

Abstract
The study aimed to identify the potential acetylcholinesterase (AChE) inhibitors for effective Alzheimer’s treatment from existing FDA-approved drugs through a drug repurposing technique via computational tools. Further, to evaluate the anti-Alzheimer’s potency of the identified drug with the help of a suitable drug delivery system through in vivo pharmacological studies. The molecular docking and dynamics simulation studies indicated that letrozole has a significant binding affinity of -9.6 kcal/mol and a better interaction with AChE. The physicochemical properties of letrozole-encapsulated solid lipid nanoparticles (L-SLNs) were characterized and confirmed. Initially, acute toxicity tests of L-SLNs were performed according to OECD 423 guidelines. Biochemical studies revealed that L-SLNs significantly decreased brain Acetylcholine esterase activity induced by scopolamine, but L-SLNs significantly increased AChE activity compared to the Shaam control group. Histopathological evaluation of brain regions revealed significant insights into the neuroprotective potential of L-SLNs in an Alzheimer’s disease (AD) rat model. Treatment with L-SLNs demonstrated dose-dependent neuroprotection across all studied brain regions. At a low dose of L-SLNs (2.5 mg/kg), neuronal and glial cells in the cortical and hippocampal regions showed improved regularity, although some disorganization persisted. At a mid-dose of L-SLNs (5 mg/kg), the histopathological architecture further normalized, with neurons and glial cells exhibiting regular arrangement and morphology akin to normal cells. The high dose of L-SLNs (10 mg/kg) provided the most significant protection, with neuronal and glial cells displaying near-normal arrangement and morphology in the cortical, hippocampal, and Substantia Nigra regions. This study highlights the importance of SLNs-based drug delivery systems in improving the efficacy of existing therapeutic agents in neurodegenerative conditions.
Supplementary Information
The online version contains supplementary material available at 10.1038/s41598-025-17733-4.
Keywords: Acetylcholinesterase, Alzheimer’s, Drug repurposing, Solid lipid nanoparticles, Letrozole
Subject terms: Drug delivery, Pharmaceutics, Pharmacology, Neurological disorders
Introduction
Memory loss, cognitive decline, and behavioral abnormalities are hallmarks of Alzheimer’s disease (AD), a neurological condition that worsens over time1. Neurodegeneration and a reduction in the neurotransmitter acetylcholine (Ach) in AD patients’ brains are the leading causes of these alterations. Memantine and acetylcholinesterase (AChE) inhibitors are two popular AD medicines, can reduce some of the symptoms, but are not a cure for AD2. The most common cause of dementia in the elderly is AD3. The development of symptomatic treatments for AD has been at least partially successful thanks to research into the condition, but there have also been multiple failures in the quest for disease-modifying medications4,5. These achievements and setbacks have sparked discussion over possible gaps in our knowledge of the pathophysiology of AD as well as possible hazards in the identification of therapeutic targets, development of drug candidates, diagnostics and clinical trial design6. There is a critical need for effective treatments. Current AD medicines improve symptoms by targeting cholinergic and glutamatergic neurotransmission, as shown in Fig. 1.
Fig. 1.
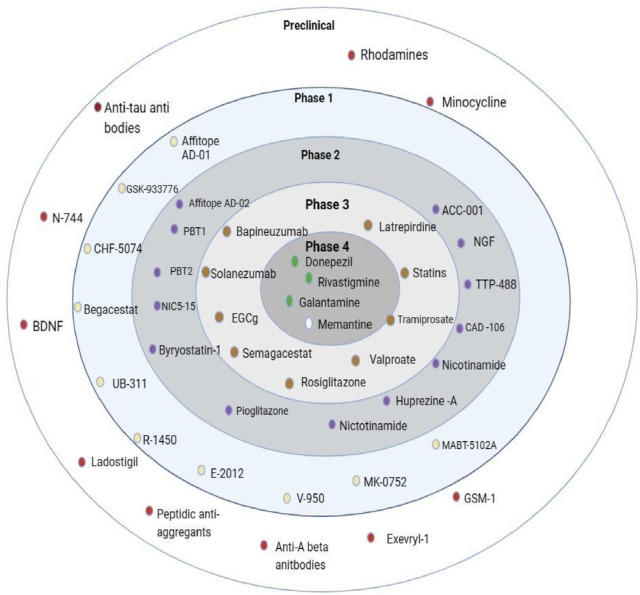
Drug Development (Targeting cholinergic and glutamatergic neurotransmission).
According to the World Health Organization (WHO), more than 50 million individuals received a dementia diagnosis in 2020, with AD responsible for more than 60% of these cases7. The complete causes behind this complicated illness are still unknown despite continuous investigation. According to a well-known notion known as the “cholinergic hypothesis,” AD is mostly caused by the gradual loss of cholinergic neurons. Additionally, the activity of neuronal acetylcholinesterase (AChE), which degrades acetylcholine in the synaptic cleft and disrupts synaptic communication, exacerbates the decrease in acetylcholine levels in AD patients’ brains. By raising acetylcholine levels in the brain, which might improve memory and cognitive function, inhibiting AChE is thought to be a viable strategy for reducing AD symptoms8.
Over the past two decades, several cholinesterase inhibitors (ChEIs) have been developed and used primarily for treating AD9,10. These inhibitors have shown potential in treating other conditions, such as glaucoma, myasthenia gravis and chronic psychiatric disorders like schizophrenia. Currently, donepezil, galantamine and rivastigmine are the most used ChEIs for AD treatment. However, these medicines often come with significant dose-dependent side effects. Additionally, the short half-life of some ChEIs, such as rivastigmine and physostigmine, poses challenges for their long-term therapeutic use2.
Computer-Aided Drug Design (CADD) is essential to the hunt for next-generation acetylcholinesterase (AChE) inhibitors since it improves accuracy and expedites the drug development process11. CADD methods, such as ligand-based and structure-based strategies, make effective use of computing power to find and refine possible inhibitors. By identifying important residues and energetically favorable binding conformations, structure-based techniques like molecular docking and molecular dynamics simulations make it easier to investigate the binding interactions between AChE and potential compounds12.
It is predicted that the process of discovering and developing a new medicine will take between 10 and 17 years, including numerous steps, and cost between US$2 and US$3 billion13. Additionally, it appears to have a high failure rate in clinical trials, with about 90% of medicines being disqualified due to unanticipated features14. New drug discovery is time-consuming and expensive. This scenario can be improved, and computational drug repurposing holds great promise for contemporary drug development. However, the researcher may find it challenging to do computational tasks, including creating chemical libraries, detecting binding pockets, analyzing docking parameters and running docking processes15.
Drug repurposing, or drug repositioning or reprofiling, involves finding new uses for existing drugs and still-under-researched medications. This relatively new approach enables much faster medication development and lower costs, especially for FDA-approved repurposed pharmaceuticals that might go through clinical trials more quickly due to prior safety, toxicological, and clinical investigations. Various non-computational and computational procedures can be considered for medication repurposing. Indeed, the process of repurposing drugs can be significantly aided by computational techniques like bioinformatics, genomics, and systems biology16.
The potential therapeutic uses of solid lipid nanoparticles (SLNs), a colloidal carrier with distinct size-dependent characteristics, have drawn a lot of interest in drug administration. Suitable for delivering hydrophobic pharmaceuticals, these carriers are made of solid lipids supported by emulsifiers or surfactants that may solubilize lipophilic compounds17. SLNs are superior to traditional drug delivery methods in a number of ways, including regulated drug release, increased loading capacity, and greater stability18. They are also capable of protecting pharmaceuticals from extreme environmental conditions, have a high drug content, and can be mass-produced utilizing high-pressure homogenization procedures. To get over these restrictions, a second generation of lipid-based nanocarriers called nanostructured lipid carriers (NLCs) was created. A combination of liquid and solid lipids forms NLCs, which have a greater drug loading capacity and an unstructured crystal structure19. By increasing drug solubility in the lipid matrix and preventing drug ejection during storage, they may provide more regulated release patterns. NLCs and SLNs have shown promise in topical, parenteral, and oral delivery methods and may lead to the creation of novel treatments20.
Solid lipid nanoparticles (SLNs) have emerged as a significant drug delivery system21. In recent times, for studying and treating neurodegenerative diseases, including Alzheimer’s, Parkinson’s disease17,18. SLNs possess the ability to enhance bioavailability, penetration through the blood-brain barrier22 and provides sustained release of therapeutic agents, making them a promising platform for research and clinical applications23–25. The objective of this present study was to identify a new lead moiety from FDA-approved drug or a phytocompound through the application of computational tools, to formulate and characterise and evaluate for the treatment of Alzheimer’s disease.
Materials and methods
Materials
Letrozole was procured from Yarrow Chem Products, Mumbai, India. Other reagents and chemicals, such as scopolamine, trichloroacetic acid, 5,5’-dithiobis (2-nitrobenzoic acid), phosphate buffer solution, potassium reagent, hydrogen peroxide and Ellman’s reagent were purchased from Himedia Laboratories Pvt. Ltd., Mumbai, India.
Computational studies
Virtual screening
The AutoDock Vina 1.2 (https://vina.scripps.edu/) software was used to conduct a molecular docking study. The Protein Data Bank (PDB) website at (http://www.rcsb.org/) has the X-ray crystallographic structure of human AChE, PDB code 4EY7 (https://www.rcsb.org/structure/4ey7). The CharmGUI web server was used for protein preparation26. To determine the target protein’s active site, a grid box measuring X -14.108464, Y -43.832714, and Z 27.669929 Å was put up with a grid spacing of 0.375 Å. The FDA-approved ligands’ 3D structures were obtained from Drug Bank (https://go.drugbank.com/) and subjected to mmf94 force field energy reduction. The configuration with the lowest docking energy was selected when the docking process was finished, and the ideal position was maintained27. Discovery Studio Visualizer 2021 was used to analyze hydrogen bond interactions and protein-ligand configurations28,29.
Molecular dynamics
Molecular dynamics (MD) simulation studies were conducted on the selected protein-ligand complexes of molecular docking analysis using the OPLS 2005 force field in the DESMOND v6.3 module of the Schrodinger suite30,31. To create the system builder, the protein-ligand combination was first enclosed in a cubic boundary box using TIP3 water as the solvent model32,33. A second reduction and recalculation procedure was performed on the protein to include more counterions to balance the system’s charges. Additionally, to mimic the salt levels present in a physiological setting, a solution containing 0.15 M NaCl was added to the system 20 m from the ligand. Nine phases make up this protocol, which includes two minimization steps and four brief simulations (equilibration phase) run prior to the start of the real production period34. In the beginning, the molecular dynamics simulation studies were conducted for the top-scoring ligand-receptor complexes with run lengths of 10 ns. Second, 100ns was used to identify very stable ligand-protein complexes for further testing. The OPLS 2005 force field and the NPT ensemble were used in the simulations, which were run at 300 K and 1.01325 bar of air pressure. A Simulation event analysis tool of the DESMOND module was used to evaluate the MD simulation findings for complex RMSD (Root Mean Square Deviation), RMSF (Root Mean Square Fluctuations) protein-ligand interactions and contacts with various amino acid residues35.
ADMET studies
ADMET (Absorption, Distribution, Metabolism, Excretion and Toxicity) studies are essential in drug discovery, providing insights into a drug candidate’s pharmacokinetics and safety profile. pKCSM (Pharmacokinetics Chemistry, Small Molecule) is a computational tool leveraging machine learning to predict ADMET properties efficiently36,37. It evaluates key aspects such as absorption, including intestinal uptake and permeability; distribution, such as blood-brain barrier penetration and tissue distribution; metabolism, including interactions with cytochrome P450 enzymes; excretion, such as renal clearance and half-life; and toxicity, predicting risks like mutagenicity and hepatotoxicity38. SMILES of the ligand were used as input format in pkCSM, which computes the ADMET properties39. This integration of predictive models into a unified platform makes pkCSM invaluable for optimizing drug discovery pipelines.
Formulation
Solid lipid nano formulation (SLNs)
Letrozole-loaded solid lipid nanoparticles (L-SLNs) was made using the solvent evaporation and emulsification technique40. The lipid phase was made up of 100 mg of stearic acid that had been completely dissolved in 10 mL of chloroform that had been heated to 70 ± 2 °C. Using a water bath, the aqueous phase was kept at the same temperature (70 ± 2 °C) and included 20 mg of sodium deoxycholate (SDC) and 1 mL of Tween-80 dissolved in 20 mL of distilled water41. After adding 150 mg of letrozole to the organic phase, the mixture was magnetically agitated for 10 min. Then, using a magnetic stirrer, the organic phase was gradually introduced dropwise into the aqueous phase while being continuously stirred at 1500 rpm. A high-speed homogenizer was used to homogenize the emulsion for 15 min at 10,000 rpm. To minimize the size of the particles, ultrasonication was used for 5 min. Subsequently, the formulation was characterized using various techniques, including physical instability, particle size analysis, chemical instability, X-ray diffraction, scanning electron microscopy, transmission electron microscopy, drug entrapment assessment and zeta potential measurement23.
Characterization
Assessment of chemical instability
At the end of the fourth week, an assessment of chemical instability was conducted by recording the Fourier-transform infrared (FTIR) spectrum of the samples, which included both the pure drug and its excipient mixtures. The analysis was performed using an FTIR spectrophotometer over a scanning range of 4000 to 400 cm⁻¹. This extensive range allowed for a comprehensive detection of various functional groups present within the samples42. The recorded spectra were subsequently compared to assess any changes that may indicate chemical instability. Key aspects to examine included shifts in peak positions, variations in peak intensities, and the appearance or disappearance of specific functional groups. Significant alterations in the FTIR spectra can suggest degradation or negative interactions between the drug and excipients over the four-week period. Such findings are crucial for determining the chemical stability of the formulations and may prompt further considerations regarding reformulation or adjustments in handling and storage conditions to ensure product integrity43.
Particle size and zeta potential
Using Zetasizer ZS (Malvern, UK), the mean particle size (z-average) of the lipid nanoparticles was measured. Every measurement was taken at a detection angle of 90° and at 25 °C. The same device was used to measure the zeta potential. The charge shown on the surface of SLNs is known as the zeta potential44.
Drug entrapment efficacy
Measuring the amount of free drug in the aqueous phase or dispersion medium of undiluted SLNs dispersion allowed for the determination of the system’s entrapment effectiveness. Letrozole serial dilutions were made to measure absorbance using UV-visible spectroscopy. The formulation was centrifuged for 15 min at 10,000 rpm, and the absorbance of the supernatant was measured at 240 nm45.
Powder X-ray diffraction (PXRD) analysis
The SSD160 1D Detector and BRUKER D8 Advance ECO XRD equipment were used to assess the physical properties of L-SLNs. After the thin layer of the pure L-SLNs was completely dried, the detector was set up in a 20 configuration with Cu Kα 1 radiation (l = 1.54060) and operated at 20 keV and 30 mA46.
Field emission scanning electron microscopy (FESEM) and transmission electron microscopy (TEM)
The morphological characteristics of L-SLNs were studied using FESEM (JEOL JSM6700). A sample of L-SLNs was placed in a 200-mesh copper grid and observed for particle shape and size using FESEM47. The morphological shape and size of L-SLNs were studied using TEM (TEM-JEOL model 2100) operated at an acceleration voltage of 200 KV. For this purpose, L-SLNs were redispersed with 1 mL of deionized water. A few drops of the dispersed L-SLNs sample were placed on a carbon-coated copper grid, which was air-dried at 60 °C for 5 min.
Pharmacological evaluation
Experimental animals
The breeding facility at the institution supplied male Wistar rats weighing 150–160 g and 9 weeks old. The rats were acclimated for 7 days at 25 ± 2 °C and 55 ± 1% relative humidity in a clean environment with a 12-hour light/dark cycle. They were given a typical pellet feed and endless access to water. The protocols of the Committee for the Control and Supervision of studies on Animals (CCSEA), located in New Delhi, India, were followed in all studies. Authentication number XXIX/MSRFPH/CHE/PG-14/15 was issued after the study protocol was approved by the Institutional Animal Ethics Committee of the Department of Pharmacology, Faculty of Pharmacy, M.S. Ramaiah University of Applied Sciences, at a meeting on February 15, 2024.
Acute toxicity
Acute toxicity experiments were conducted on the L-SLNs using three rats in each group. The study was conducted according to OECD 423 guidelines. Since the test drug is an SLNs formulation for targeted drug delivery, the formulation was bulky in nature, with a concentration of around 1 mg/mL. Because of these reasons, we chose to go with the maximum dose of 50 mg/kg.
Drug administration
The animals were fasted overnight and weighed before being given the drugs. An oral gavage needle was used to administer the prepared suspension as a single dose. Following the administration of the drugs, the animals were monitored, recorded and interpreted according to the protocol48.
In vivo studies
Study design
The study is reported by ARRIVE guidelines (https://arriveguidelines.org). Forty-two rats were taken and categorized into six groups, as shown in Table 1, each containing 6 rats49. Groups I, II, III, and IV were designated as Normal control (water), Positive (Scopolamine 10 µg, ICV), and Standard (Scopolamine 10 µg + Donepezil 5 mg/kg), respectively. Groups IV, V, and VI served as treatment groups (L-SLNs at doses of low (2.5 mg/kg), mid (5 mg/kg), and high (10 mg/kg), respectively). The dose was fixed by the IC₅₀ value of letrozole and the drug entrapment efficiency by UV spectrophotometer, and converted into a dose suitable for the animal. Scopolamine was induced on the 8th day after seven days of behavioural tests undergone by rats. The intracerebroventricular (i.c.v.) route was selected for administering scopolamine into the left ventricle of rat brains using a stereotaxic apparatus50. The treatment groups received their respective treatments, L-SLNs, for 14 consecutive days. Cognitive functions were assessed every other day and on the final day (the 28th day) of treatment.
Table 1.
Treatment protocol for alzheimer’s disease in rats.
| 1. | Group 1 | Control | Normal control receives water |
|---|---|---|---|
| 2. | Group 2 | SCO | Scopolamine 10 µg, ICV |
| 3. | Group 3 | SCO + Donepezil (5 mg/kg) | Scopolamine 10 µg, ICV + Standard |
| 4. | Group 4 | SCO + L-SLNs (2.5 mg/kg) | Scopolamine 10 µg, ICV + Test Drug in low dose (2.5 mg/kg) |
| 5. | Group 5 | SCO + L-SLNs (5 mg/kg) | Scopolamine 10 µg, ICV + Test Drug in mid dose (5 mg/kg) |
| 6. | Group 6 | SCO + L-SLNs (10 mg/kg) | Scopolamine 10 µg, ICV + Test Drug in high dose (10 mg/kg) |
Stereotaxic surgery and experimental procedures
Stereotaxic surgery is a precise methodology employed for the purpose of brain manipulation in live animals, enabling researchers to precisely target deep brain structures through the utilization of a stereotaxic device.
Pre-operative care
To avoid contaminating the surgical site with hair or other materials, pre-operative care was carried out at a secure distance. The rodent analgesia Standard Operating Procedure (SOP) was followed for administering the non-steroidal anti-inflammatory analgesic meloxicam51. Based on body weight, xylazine (5 mg/kg, intraperitoneal) and ketamine (50 mg/kg, intraperitoneal) were used to anesthetize each rat52. Both eyes were treated with ophthalmic ointment to avoid corneal desiccation throughout the surgery53. To prepare the surgical site, the top of the head was shaved, and the hair was carefully removed. To guarantee stability during the process, every animal was firmly positioned in a stereotaxic frame54. To keep the animal’s body temperature stable and avoid hypothermia, a heat source was also positioned below it or insulating supplies like bubble wrap or thermal drapes were utilized.
Stereotaxic surgery
Prior to surgery, the animal’s lack of the pedal withdrawal (toe pinch) reaction was used to confirm the depth of unconsciousness55. The periosteum was scraped off and pushed aside, and any blood was cleaned off the surface using sterile swabs. Anterior-Posterior (0.92 mm), Medial-Lateral (1.6 mm), and Dorsal-Ventral (3.25 mm) from the skull surface were the predetermined locations for the creation of a single burr-hole in relation to Bregma56. After finishing the injection, the syringe was placed over the burr-hole and left to rest for another two to five minutes before being gently removed57.
Assessment of cognitive function
Elevated plus maze test
Spatial memory was tested using the raised plus maze paradigm. All animals had their cognitive performance evaluated during a seven-day period58. On the eighth day, all subjects received scopolamine intracerebroventricular (i.c.v.), except for the Shaam group animals, who received saline intravenously. Cognitive testing is repeated following illness induction to observe the animal’s behaviour59. The maze is made up of four arms that extend from a center region (5 × 5 cm): two open arms (16 × 5 cm) and two closed arms (16 × 5 × 15 cm). The device is 25 cm tall. When testing animals, time spent in both the open and closed arms is recorded, as is the number of entrances. Each animal is positioned across from the center at the end of the open arm. During the five-minute test, the amount of time spent in each arm is electronically recorded, and the number of entries is manually tallied. Spending time in an open arm was thought to enhance cognitive function60.
Morris water maze test
The purpose of the Morris Water Maze test is to evaluate memory and spatial learning. A concealed platform is situated one inch above the water’s surface in a circular pool of opaque water. A constant water temperature of 25 °C is maintained. The secret platform is situated in one of the four quadrants that make up the pool61. Before inducing dementia, each rat undergoes seven days of training. A cognitive function test was conducted both throughout the treatment period and on successive days after the administration of the drug. During the last seven days of the therapy, visual cues were given to the rats to help them find the hidden platform. The time it takes a rat to locate the concealed platform from its starting place is known as escape latency (EL). Throughout the trial, the goal platform and starting location stayed the same. A lower EL suggested that memory had improved62.
Open field test
The Open Field Test (OFT) is a widely used behavioural assay in animal research to assess locomotor activity and anxiety-like behaviour. Black Plexiglas walls encircle the 36 squares (5 × 5 cm) of the white floor that make up this contraption63. While the four core squares are referred to as the central field, the 32 squares that make up the periphery are known as the peripheral area. The protected area is the name given to the surrounding region. Both before and after the sickness was created, tests were carried out under low light levels. In order to measure cognitive capacities, this model was used to analyze the behavior, location and autonomic nervous system (ANS) functioning of rats64. Behavioral factors such as rearing, grooming, freezing and latency (the time it takes to initiate movement) were also assessed. Time spent in the core vs. peripheral regions and the number of squares each rat traversed were recorded for each trial. To assess the function of the ANS, micturition and feces were also observed65.
Neurochemical studies
After assessment of the motor performance, rats were euthanized by injection of ketamine and xylazine (80 mg/kg: 12 mg/kg, i.p.)66. Next, phosphate buffer (pH 7.4) was used to homogenize the separated brain tissue. For ten minutes, the homogenate was centrifuged at 8000 rpm and 4 °C67.
Estimation of the ache activity
Phosphate buffer (2.6 mL, pH = 8) and 100 µL of DTNB were combined with the brain tissue homogenate (0.4 mL). After mixing the cuvette’s contents, the absorbance at 412 nm is measured68,69. A change in absorbance is seen after adding 20 µL of substrate and acetylthiocholine iodide. The formula below is used to determine the enzyme activity70.
 |
A/min = Change in absorbance per min.
ε = 1.361 × 10 M-1 cm− 1.
b = pathlength (1 cm).
Vt = Total volume (3.1 ml).
Vs = sample volume (0.4 ml.
Antioxidant studies
Estimation of glutathione peroxidase (GPx)
0.5 mL of supernatant and 0.1 mL of 25% TCA were combined, and the mixture was centrifuged for five minutes at 4000 rpm71. After this procedure, 0.3 mL of the supernatant was extracted and combined with 0.5 mL of 0.1 M phosphate buffer (pH 7). Ellman’s reagent (10 Mm) was added in 0.2 mL, stirred, and incubated for 10 min. A blank reagent was used to test the absorbance at 412 nm72.
 |
Where, A = Absorbance.
Estimation of catalase
With 1.9 mL of phosphate buffer (pH 7), a 100 µL aliquot of 10% w/v homogenate in 0.15 M potassium chloride was mixed. 1 ml solution of 10 mM H₂O₂ was then added73. The absorbance at 240 nm was measured at 0 min. U/mg of wet tissue was used to represent the activity, which was calculated using the molar extinction coefficient of H₂O₂74.
 |
ΔAs = Absorbance difference of the sample.
ΔAo = Absorbance of control.
DF = Dilution factor.
€ = molar coefficient of H2O2 (0.041 moles/cm).
Estimation of superoxide dismutase (SOD)
200 µL of 1 mM hydroxylamine hydrochloride, 50 µL of 10%w/v homogenate, 200 µL of Nitroblue Tetrazolium (NBT) (24 mM in methanol), 100 µL of 1 mM Ethylenediaminetetraacetic acid (EDTA), and 0.5 mL of 100 mM sodium carbonate were added. After 0 min, a reading was taken at 560 nm. The NBT reduction of the combination was measured at 560 nm after a 5-minute incubation period. One enzymatic unit of SOD is the amount of enzyme required in 100 µL of 10%w/v tissue homogenate to stop the 50% decrease of 24 mM NBT; this is expressed as U/mg of wet tissue75.
 |
Histopathology
The brain’s weight was noted. The brain was preserved in 20% formalin (20 mL formaldehyde/180 mL water) after being cleaned with regular saline76,77. Using a microtome treated in an alcohol-xylene series, paraffin slices were created at a thickness of 5 min and stained with alum hematoxylin and eosin. They underwent histological analysis after being placed on a glass slide78.
Statistical analysis
All the values are expressed as Mean ± SEM. One-way ANOVA was applied, and a comparison was made between the normal control vs. the test groups using Dunnett’s multiple comparison tests. p < 0.005 value was considered significant.
Results and discussion
Computational studies
Virtual screening
Virtual screening was performed after preparing the targeted protein using AutoDock Vina. To make sure the docking findings were accurate, the virtual screening process was carried out twice. Furthermore, re-docking the co-crystal ligand with the targeted protein allowed for the validation of the docking methodology. Following virtual screening, the output results from the module were examined, and the docking scores of potential drugs were contrasted with those of the co-crystal, as shown in Table 2. The top ten compounds were discovered to have a greater docking affinity and a more dynamic simulation. ADMET simulations are being carried out for these compounds.
Table 2.
Molecular Docking results of top 10 compounds.
| SL. No | Compound name | Docking Score Kcal/mol | Binding Interaction |
|---|---|---|---|
| 1 | Dutasteride | -10.8 | HIS94 |
| 2 | Letrozole | -10.7 | TRP86, TRP286, PHE338 |
| 3 | Testosterone propionate | -10.2 | HIS94, HIE64, GLN67, TRP5 |
| 4 | Fulvic acid | -9.9 | HIS84 |
| 5 | Naringenin | -9.8 | HIE64, HIS94, THR200 |
| 6 | Flufenamic acid | -9.6 | HIS94, THR200 |
| 7 | Desoximentasone | -9.5 | TYR77, PHE347 |
| 8 | Clopidogrel | -9.1 | TYR72, ASP74, TYR341 |
| 9 | Resveratrol | -9.4 | TYR77, VAL340 |
| 10 | Fenofibric acid | -9.1 | TYR72, TYR77, SER347, PHE346 |
| 11 | Co-crystalized Ligand (Donepezil) | -10.2 | TRP286, TRP86, PHE295 |
Molecular dynamics (MD)
MD simulation for the top 5 compounds was carried out for 100ns. The molecular dynamics analysis indicates that Letrozole stands out as the better candidate among the top five compounds evaluated. Letrozole demonstrates stable interactions with critical residues, including TRP286, TRP86 and PHE338, with high interaction percentages of 69%, 76% and 47%, respectively, as shown in Fig. 2. Its Protein RMSD and Ligand RMSD are both 2.8 Å, shown in Fig. 2, reflecting balanced and stable dynamic behaviour, while its RMSF values further highlight its minimal atomic fluctuations, indicating localized stability. While Clopidogrel and Naringenin also exhibit favourable dynamics with comparable RMSD and RMSF values, their interactions with residues are either less consistent or involve fewer critical amino acids than Letrozole. On the other hand, Fenofibric and Flufenamic show significantly higher RMSD and RMSF values, indicating less stability in both the protein and ligand dynamics, along with weaker residue interactions. Letrozole complex has a strong binding affinity, stable RMSD, RMSF values and dynamic stability, positioning it as the most reliable ligand in this analysis and the top 5 compounds’ MD simulation results with protein RMSD and Ligand RMSD as shown in supplementary Table 1.
Fig. 2.

(a) RMSD, (b) RMSF, (c) 2D interaction of ligand and (d) Protein-Ligand interaction of Letrozole in complex with Acetylcholine esterase.
ADMET
The ADMET profile of Letrozole highlights its favourable pharmacokinetic and safety characteristics. Its molecular properties, including a moderate molecular weight of 285.31 and a Log P of 2.659, indicate good lipophilicity, supporting membrane permeability. With three rotatable bonds and a surface area of 127.252, it maintains an appropriate balance between flexibility and molecular stability. Regarding absorption, Letrozole is slightly soluble in water and is not a substrate or inhibitor of P-glycoprotein, which minimizes efflux-related bioavailability issues. It shows low skin permeability (-2.492 log kP) and moderate unbound fraction in plasma (Fu = 0.242). For distribution, Letrozole demonstrates limited blood-brain barrier (BBB) permeability (-1.183 log BB) and poor CNS penetration (-3.385), reducing central nervous system side effects. In metabolism, it selectively inhibits CYP2D6 while sparing other major CYP enzymes (CYP2C19, CYP1A2, and CYP2C9), reducing the potential for drug-drug interactions. Excretion is efficient, with a low clearance rate (0.12 log mL/min/kg) and no renal OCT2 substrate activity. Toxicity data reveal low hepatotoxicity risk and high safety margins, with a chronic toxicity LOAEL of 30,138 log mg/kg_bw/day and acute toxicity LD50 of 2.599 mol/kg. Overall, Letrozole’s ADMET profile, shown in supplementary Table 2, suggests it is a well-balanced drug candidate with good pharmacokinetics, minimal systemic toxicity and manageable drug interaction risks.
Characterization
Drug excipient compatibility study through ATR-IR
The IR spectra of the drug and the excipients were satisfactory with their absorption bands. Similarly, the physical mixture also indicated the presence of characteristic peaks of the drug and excipients, as shown in Fig. 3. No change in the original spectra, that is, appearance or disappearance of peaks, was observed. The characteristic absorption peaks of letrozole were found at 2229 cm− 1 for C ≡ N stretching, at 1266 cm− 1 for C-N, and 690–900 cm− 1 for out-of-plane C-H bending, respectively, and were retained during the test. It is therefore expected; the drugs and excipients are compatible with each other and free from any significant chemical interactions.
Fig. 3.

ATR-IR spectra of Letrozole and Letrozole with different excipients.
Post formulation ATR-IR
The ATR-IR of the L-SLNs was taken post-formulation. When the ATR IR of L-SLNs and raw drug Letrozole are compared, none of the peaks of Letrozole are retained in the post-formulation ATR-IR, as shown in Fig. 4, indicating that Letrozole has been effectively entrapped.
Fig. 4.

ATRIR spectra of Letrozole and Letrozole SLNs.
Drug entrapment efficacy
Letrozole was analyzed using a known concentration of sample UV spectroscopy at 240 nm, and a calibration plot was generated. Using a phosphate buffer solution at pH 7.4. Supplementary Table 3 presents the absorbance values of Letrozole at various concentrations. The Letrozole calibration curve demonstrated acceptable linearity, as shown in supplementary Fig. 1 with an R² value of 0.9908. Absorbance for L-SLNs was also recorded. The amount of drug entrapped was determined to be 5.1503 mg/mL.
Particle size and zeta potential
The particle size distribution and zeta potential of the L-SLNs formulation were determined using the Zeta PALS instrument. Two distinct peaks were observed at 215.8 nm and 61.36 nm, suggesting the presence of nanoparticles of varying sizes in the formulation. The peak at 215.8 nm likely corresponds to the primary population of nanoparticles, while the smaller peak at 61.36 nm could represent smaller particles or aggregates. The average particle size was found to be 102.5 nm, shown in supplementary Fig. 2(a), which is typical for drug delivery nanoparticles, as this size range facilitates efficient cellular uptake and tissue penetration. The Polydispersity Index (PDI) of 0.500 suggests a reasonably narrow size distribution, although there may still be some heterogeneity in the formulation. The zeta potential was measured at57shown in supplementary Fig. 2(b), indicating that the nanoparticles possess a moderate negative charge, which helps prevent aggregation by providing electrostatic repulsion between particles. While this value suggests a degree of stability, higher zeta potential values (more negative) would typically be desired for greater long-term stability. In the context of drug delivery, the size and surface charge of the L-SLNs are crucial for determining their pharmacokinetics, bioavailability and ability to deliver the encapsulated drug (Letrozole) effectively to target tissues. The formulation stability and particle size indicate that it could be suitable for enhancing the solubility and bioavailability of Letrozole.
PXRD pattern of L-SLNs
XRD is the non-destructive technique used to analyze the crystal structure of SLNs and determine the lipid’s crystallinity. The powder X-ray diffraction analysis of the L-SLNs was performed to assess the crystallinity and structural properties. The diffraction peaks of the L-SLNs at 2θ values are 13.82°, 16.93°, 19.46°, 21.20°, 21.43°, 26.10°, and 27.90°, likened to planes such as (011), (002), (101), (102), (110), (103), and (112) are lattice planes. The XRD pattern exhibited a predominant peak at 21.20° along with several low-intensity peaks between 18° and 28°, while the pattern beyond 30° approached the baseline. The intense band at 21.20° is characteristic of the ordered lipid lattice, consistent with a β-type polymorphic arrangement of the lipid matrix {da Silva Santos, 2019 #6}. Notably, no additional sharp reflections attributable to crystalline letrozole were observed, confirming that the drug is molecularly dispersed within the lipid core rather than existing as a separate crystalline phase. The reduction in peak intensities indicates a less ordered nanoconfined crystalline state typical of SLNs.
Further, the XRD analysis of L-SLNs exhibited a reduction in the characteristic crystalline peaks of pure letrozole, with a calculated degree of crystallinity of 44.14%. This partial crystallinity suggests that letrozole is dispersed within the lipid matrix in a less ordered form, confirming successful encapsulation. Such reduced crystallinity is advantageous, as it minimizes the risk of drug expulsion during storage, enhances nanoparticle stability, and supports sustained drug release. Since crystalline substances generally dissolve more slowly than amorphous ones, this crystalline behaviour may influence the release kinetics of letrozole. Overall, the XRD results indicate that the L-SLNs retain a partially crystalline structure, as shown in supplementary Fig. 3, which could contribute to a controlled release profile for the drug.
FESEM and TEM
The FESEM images of the L-SLNs revealed a high degree of purity and uniformity in the structure of the L-SLNs. They appeared as long, thin cylinders, spherical in shape with a diameter of approximately 100–200 nanometres, exhibiting a smooth surface with minimal defects or impurities. The formulation was consistent with the expected properties of SLNs, known for their unique cylindrical structure and high surface area. The smooth surface and minimal defects suggest that the L-SLNs possess high mechanical strength and stability, essential characteristics for their performance in various applications. The FESEM of L-SLNs is shown in Fig. 5(a) and (b). The TEM images shown in Fig. 5(c) and (d) clearly provided the morphological shape and size of L-SLNs. The L-SLNs mostly appeared to be spherical in shape and exhibited variation in particle size ranging from 100 to 200 nm.
Fig. 5.

(a, b) FESEM images of L-SLNs (c, d) TEM images of L-SLNs.
Acute toxicity
Acute toxicity tests on L-SLNs were executed following OECD 423 guidelines. The study was designed using three animals per stage and was meticulously observed for any signs of toxicity or death. Although the OECD 423 guideline recommends a limit dose of 2000 mg/kg body weight, considered safe in the absence of toxicological responses, modifications were made due to the nature of the L-SLNs formulation. Considering that L-SLNs are designed for targeted drug delivery and prepared in nano formulation with the bulky nature of the formulation at a concentration of 1 mg/mL, it was felt that an adjusted dose would be appropriate. Therefore, a dose of 50 mg/kg body weight was deemed fit for the study to ascertain the safety profile of the formulation under review while considering physicochemical properties.
Assessment of cognitive function
Elevated plus maze
An elevated plus maze model is used to assess spatial memory. All treated animals were tested for cognitive function on the 21st day. Rats were treated with L-SLNs (2.5 mg/kg, 5 mg/kg, 10 mg/kg) for 14 consecutive days. On the 21st day, their cognitive performance was assessed by following the elevated plus maze. It is observed that L-SLNs (5 mg/kg, 10 mg/kg) showed a moderately significant (p < 0.001) improvement, as these groups spent less time both in the open arm and the closed arm, as compared to the disease group, indicating improvement in cognitive behaviour, as shown in supplementary Table 4. In comparison, the administration of letrozole loaded SLNs (5 mg/kg, 10 mg/kg) showed a shorter 108 ± 3.42; (p < 0.001**) open arm, 192 ± 3.42; closed arm, 126 ± 2.65; (p < 0.001***) open arm, 173.8 ± 2.36 closed arm, respectively. Figure 6 shows the number of entries in open and closed arms by animal.
Fig. 6.

Graphs representing the number of entries in the open and closed arms by animals.
Morri’s water maze
Memory and spatial learning were evaluated by observing escape latency time (ELT). Swimming time for rats to find the escape platform decreased in all groups except the scopolamine-induced rats during the experimental period, as shown in Fig. 7. Scopolamine-treated rats exhibited a significantly longer time of 25.67 ± 0.9888 (p < 0.001 ***) than the Shaam control group. These results indicate that scopolamine triggered the impairment of long-term and spatial memory, as shown in Supplementary Table 5. In comparison, the administration of L-SLNs (2.5 mg/kg, 5 mg/kg, 10 mg/kg) showed a shorter 13.83 ± 0.7032 (p < 0.001***) 10.83 ± 0.5426 (p < 0.001 **), 8.833 ± 1.167(p < 0.001 ***), respectively, escape latency time compared with that of positive control rats. Standard induced donepezil (2 mg/kg i.p.) also shows the decreased ELT compared to positive groups (8.667 ± 0.5578 (p < 0.001***).
Fig. 7.

Graph plot for Morris Water Maze Test.
Open field test
Rats were examined for behavior, location, and autonomic nervous system (ANS) to assess the cognitive functions. The open field model was followed to assess the behaviour of animals treated with L-SLNs (2.5 mg/kg, 5 mg/kg, 10 mg/kg). The distance travelled parameter was assessed, and the results are shown in Supplementary Table 6. It is evident from the data that mid-dose and high-dose animals showed significant improvement as the distance travelled increased, compared to the disease group. However, animals treated with a selected dose of L-SLNs (2.5 mg/kg, 5 mg/kg, 10 mg/kg) showed significant improvement 16.01 ± 0.6736 (p < 0.001**), 20.01 ± 0.8061 (p < 0.001***), 24.87 ± 0.6121 (p < 0.001***) as shown in Fig. 8.
Fig. 8.

Graph representing the distance travelled in the treatment groups.
Biochemical studies
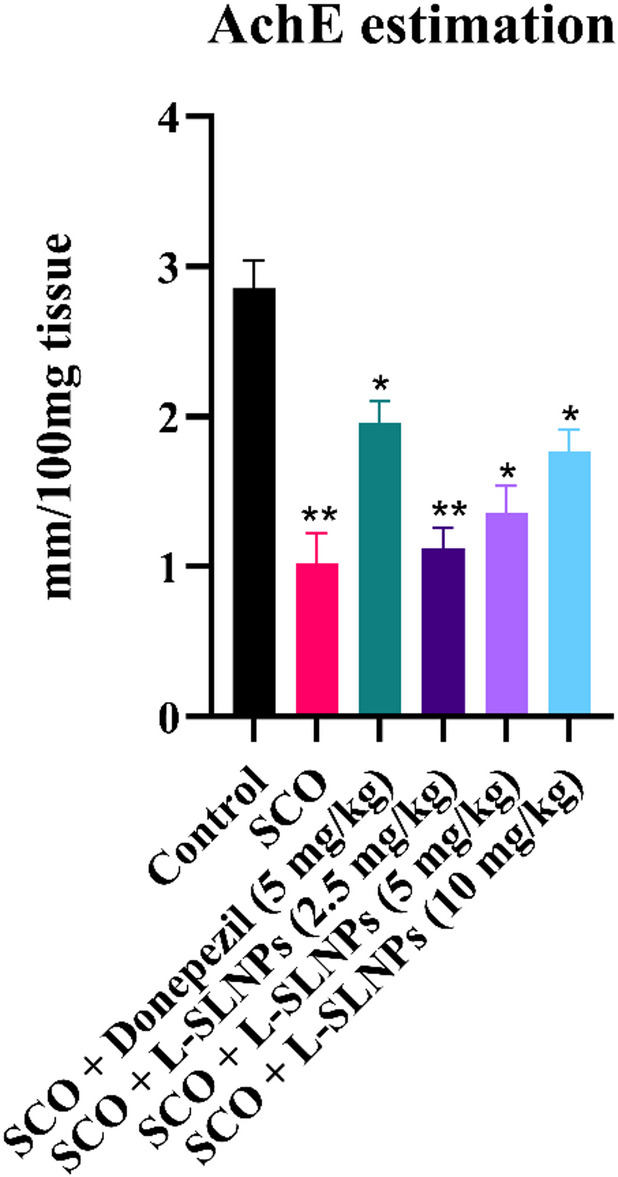
Acetylcholine esterase Estimation
The effect of L-SLNs on brain AChE, as revealed by administration of scopolamine, exhibited a significantly decreased brain AChE activity 1.320 ± 0.1258 mm/100 mg tissue (p < 0.001**) compared with the Shaam control group (2.718 ± 0.193 mm/100 mg tissue). Nevertheless, upon administration of L-SLNs 2.5 mg/kg low dose, 5 mg/kg mid dose, 10 mg/kg high dose and standard donepezil of (2 mg/kg i.p.) has significantly increased AChE activity to 1.072 ± 0.145 mm/100 mg tissue (p < 0.001 ***), 1.184 ± 0.1012 mm/100 mg tissue (p < 0.001 ***), 1.767 ± 0.1453 mm/100 mg tissue (p < 0.001 ***), 1.727 ± 0.1797 mm/100 mg tissue (p < 0.001 ***), respectively, as shown in Fig. 9 compared with the positive control group and effects of L-SLNs on brain chemical parameters in cognitively impaired rat induced by scopolamine are shown in supplementary Table 7.
Fig. 9.
Graph representing the effect of L-SLNs on Acetylcholine Esterase in scopolamine-induced Alzheimer’s in rats.
Antioxidant studies
Biochemical parameters evaluated include GPx, CAT and SOD. These are the biomarkers of antioxidant property, and their levels determine the oxidative damage to all the tissues. The supplementary Table 8 shows the mean ± SEM values of GPx, CAT and SOD in all experimental groups.
SOD
The mean activity of superoxide dismutase (SOD) in the tissue of control animals was 1.64 ± 0.3947 U/100 mg of tissue. The disease control group significantly reduced the mean SOD activity in the tissue to 0.1556 ± 0.02854 U/100 mg of tissue. Standard groups significantly increased SOD activity to 1.17 ± 0.3872 U/100 mg of tissue. Similarly, treatment of rats with Letrozole SLNs significantly increased the mean SOD activity to 0.51 ± 0.0482, 0.70 ± 0.1358 and 1.13 ± 0.0165, respectively, at Low, Mid, and High doses of tissue and Fig. 10(a) represents the effect of L-SLNs on SOD in Scopolamine-induced AD in rats.
Fig. 10.

Effects of letrozole loaded SLNs on brain chemical parameters in cognitively impaired rats induced by scopolamine. (a) SOD activity (b) GSH activity (c) Catalase activity.
GPx
The mean Glutathione activity (nm/100 mg of tissue) of the control group was 2.4398 ± 0.439 nm/mg of tissue. The disease group significantly reduced Glutathione activity to 0.3301 ± 0.09 nm/100 mg of tissue. Standard groups significantly increased the mean GSH activity to 1.269 ± 0.2577 nm/mg of tissue compared to the disease control group. Treatment of rats with low, mid, and high doses of L-SLNs significantly increased catalase activity to 0.49366 ± 0.040, 0.933 ± 0.11 and 1.404 ± 0.2725 nm/mg of tissue, respectively. Figure 10(b) represents the effect of L-SLNs on GPx in Scopolamine-induced AD in rats.
Catalase
The mean Catalase activity (nm/100 mg of tissue) of control groups was 2.598 ± 0.3121 nm/100 mg of tissue. The disease group significantly reduced Catalase activity to 0.9227 ± 0.093 nm/100 mg of tissue. Standard groups significantly increased the mean catalase activity to 2.125 ± 0.1411 nm/mg of tissue compared to the disease control group. Treatment of rats with low, mid, and high doses of L-SLNs significantly increased catalase activity to 01.288 ± 0.1597, 1.221 ± 0.06378 and 1.896 ± 0.22027 nm/100 mg of tissue, respectively. Figure 10(c) represents the effect of L-SLNs on Catalase in scopolamine-induced AD in rats.
Histopathological studies
The histopathological evaluation of brain regions, including the cortical area, hippocampus and substantia nigra (SN), revealed significant insights into the neuroprotective potential of L-SLNs in an AD rat model as shown in Figs. 11 and 12. In the normal control group, histopathological alterations were observed, indicating potential baseline vulnerability in neuronal regions. The positive control group showed severe damage characterized by disorganized and loosely packed neuronal cells, Purkinje cell hyperplasia, and marked inflammation, reflecting the pathological insults associated with AD.
Fig. 11.

Effect of L-SLNs on cortical region of AD rat (A) Normal control rat exhibited normal neuronal cells and glial cells normal (B) Positive control rat exhibits most of the cell bodies and neuronal cell are disarranged and loosely packed (Black arrow) (C) standard group treated with donepezil exhibits the Purkinje cells are somewhat regularly arranged and loosely packed (D) L-SLNs (2.5 mg/kg) low dose rat exhibits neuronal, glial cells arranged regularly and loosely packed (E) L-SLNs (5 mg/kg) mid dose rat treated neuronal, glial cells arranged regularly and showing neuronal cells are normal (F) L-SLNs (10 mg/kg) high dose rat treated the neuronal, glial cells showing normal arrangement compared to low dose.
Fig. 12.

Effect of L-SLNs on hippocampus region (A) Normal control rat showed pyramidal cell bodies with large rounded vesicular nuclei and prominent nucleus (B) Positive control rat showed pyramidal cell bodies disarranged and appeared dark shrunken with pyknotic nuclei (C) Standard control rat treated with donepezil (2 mg/kg i.p.) have showed pyramidal cell bodies containing dense large cell bodies with prominent nuclei (D) L-SLNs low dose (2.5 mg/kg) have showed hippocampus region disorganised and loosely packed (E) L-SLNs mid dose (5 mg/kg) reveals that hippocampus region showing dentate gyrus normal morphology normal (F) L-SLNs high dose (10 mg/kg) hippocampus region showing dentate gyrus normal morphology.
Treatment with L-SLNs demonstrated dose-dependent neuroprotection across all studied brain regions. At a low dose (2.5 mg/kg), neuronal and glial cells in the cortical and hippocampal regions showed improved regularity, although some disorganization persisted. At a mid-dose (5 mg/kg), the histopathological architecture further normalized, with neurons and glial cells exhibiting regular arrangement and morphology akin to normal cells. The high dose (10 mg/kg) provided the most significant protection, with neuronal and glial cells displaying near-normal arrangement and morphology in the cortical, hippocampal, and SN regions. These effects suggest that L-SLNs effectively counteract the neurodegenerative changes induced by AD.
In comparison, the standard drug, Donepezil, demonstrated similar protective effects but did not surpass the highest dose of L-SLNs in restoring normal histopathological features. Specifically, Donepezil-treated brains exhibited improved but moderately disorganized neuronal packing, indicating limited recovery relative to the high-dose L-SLNs group. The results emphasize the potential of L-SLNs as a novel therapeutic strategy for AD. The sustained release and enhanced delivery of L-SLNs likely contributed to the superior outcomes, enabling effective distribution and protection against neurodegenerative damage. This study highlights the importance of L-SLNs-based drug delivery systems in improving the efficacy of existing therapeutic agents in neurodegenerative conditions.
Discussion
Molecular docking represents a significant methodological approach utilized in computational assessments pertinent to the development of drugs, serving to quantify the affinity of binding between a ligand and its corresponding receptor. The docking of molecule investigation indicated that Letrozole exhibited a superior binding energy of -10.7 Kcal/mol alongside a co-crystal binding energy of -10.2 Kcal/mol. Furthermore, the analysis demonstrated that the amino acids TRP286, TRP86 and PHE338, with high interaction percentages of 69%, 76% and 47%, respectively, are conserved between Letrozole and the co-crystal structure. Prior research has documented that specific amino acids are crucial in inhibiting AChE. Consequently, this implies that Letrozole possesses significant potential for inhibiting acetylcholinesterase and the therapeutic management of AD. The ADMET profile of this compound reflects lower values, suggesting an enhanced drug likeness. The partition coefficient (logPo/w) of substances is related to their degree of distribution and absorption in the body. ADMET analysis revealed that all the compounds fall within the acceptable range for drug-likeness, suggesting they are potential drug-like molecules that could inhibit proteins associated with Alzheimer’s disease. Molecular dynamics simulations were employed to investigate the time-dependent behaviour of the molecular systems, with all entities within the simulation box exhibiting flexibility. This approach was used to deduce the protein’s movements and flexibility, impacting the complex interaction dynamics. The letrozole structure remained steady throughout the 100ns simulation, as determined by RMSD and RMSF analyses.
Letrozole is classified as a third-generation non-steroidal aromatase inhibitor, predominantly utilized in the treatment of hormone receptor-positive breast cancer among postmenopausal women. Nonetheless, its clinical utility is constrained by its inherent instability and suboptimal solubility.
Recent developments in SLNs have highlighted their potential to improve treatment effectiveness in neurodegenerative illnesses and enhance medication transport across the blood-brain barrier. For example, Yusuf et al.,23 developed piperine-loaded SLNs and found that they significantly improved memory function in a rat model of Alzheimer’s disease (AD). These results are comparable to ours with L-SLNs, particularly when taken at larger dosages. Additionally, their formulation showed significant AChE inhibition and brain-targeted distribution.
Comparable to our L-SLNs (~ 102.5 nm), Nautiyal et al.,79 reported rutin-loaded SLNs for brain tumor treatment, demonstrating effective particle size distribution and stability with mean diameters about 100–150 nm. Our study’s zeta potential (-54 mV) aligned with values found for stable SLN systems in neuro-delivery, which lessens aggregation and helps guarantee dispersion stability. Almeida et al.,20 created SLNs loaded with S-carboxymethyl-L-cysteine and showed cognitive advantages in models of Parkinson’s disease. Our L-SLNs demonstrated better histopathological restoration throughout cortical, hippocampus, and substantia nigra areas in comparison to their study, particularly at the 10 mg/kg dosage, in addition to enhanced AChE activity. Furthermore, Senthamarai Pandi et al.,21 usage of Eudragit L100-coated, thymoquinone-encapsulated SLNs showed improved bioavailability and BBB penetration. However, because of the API’s proven safety profiles, our method using an FDA-approved medication like letrozole with verified encapsulation and sustained release profiles represents a safer and perhaps quicker translation approach. Our results support the idea that SLNs are functional drug delivery systems for neurotherapeutics. Still, they also reveal that L-SLNs function on par with or better than several current SLNs-based therapies due to their regulated distribution and improved neuroprotection.
In the current investigation, L-SLNs augment their therapeutic efficacy for Alzheimer’s disease. The outcomes were evaluated using particle size, zeta potential, and SEM analysis. The particle size of the formulation was measured, yielding a PDI of 0.500. The Zeta potential of the L-SLNs was determined to be -13.7 mV. FTIR and XRD analyses indicated the absence of drug-lipid interactions within the L-SLNs, which is critical for assessing drug-lipid interactions, as these may influence the entrapment efficiency and stability of the SLNs.
In vivo research was conducted, and scopolamine-induced dementia was widely used to examine treatment strategies for Alzheimer’s disease. Previous research has shown that administering scopolamine to rat brains affects the expression of multiple genes associated with apoptosis, muscarine receptor signalling pathways and cell differentiation. In the current study, scopolamine was administered intracerebroventricularly (i.c.v.) using a stereotaxic apparatus, followed by elevated brain acetylcholinesterase activity and significant histological alterations in the brain.
Cholinergic neurotransmission is primarily concluded through the enzymatic activity of AChE, an enzyme that facilitates the hydrolysis of ACh, an essential cholinergic neurotransmitter. It has been documented that scopolamine can elicit an increase in AChE enzymatic activity. Consequently, the outcome of this research suggests that the administration of L-SLNs positively influences cognitive capacities, particularly concerning learning and memory functions. The manifestation of oxidative stress incites lipid peroxidation, which is concomitant with a decrease in GPx concentrations and a decline in the activity of antioxidant enzymes. This sequence of biochemical events ultimately leads to the degeneration of cholinergic neurons and the subsequent emergence of cognitive deficits. The administration of scopolamine was demonstrated to provoke oxidative stress, which is considered the principal pathway contributing to cellular damage. In the current study, scopolamine administration led to the development of oxidative stress, as demonstrated by a significant decrease in the levels of critical brain antioxidant defences, namely GPx, SOD and Catalase activity. The current study found that delivering Letrozole loaded SLNs (2.5 mg/kg, 5 mg/kg, and 10 mg/kg) led to drastic increases in antioxidant activity. Histopathological study of sections from the scopolamine group revealed neurodegeneration, including a considerable loss in the number of neurons.
Conclusions
A virtual screening process was carried out to identify a new lead compound via computational tools, and Letrozole was found to be the best lead. Letrozole demonstrates stable interactions with critical residues, with high interaction percentages of 69%, 76%, and 47%, respectively. Its Protein RMSD and Ligand RMSD are 2.8 Å, reflecting balanced and stable dynamic behavior. The drug excipient compatibility study through ATR-IR showed satisfactory absorption bands and no change in the original spectra. The post-formulation ATR-IR of the L-SLNs showed no retention of Letrozole peaks, indicating effective entrapment. The particle size distribution and zeta potential of the L-SLNs formulation were determined using the Zeta PALS instrument, suggesting the presence of nanoparticles of varying sizes. XRD analysis of the blank and L-SLNs revealed sharp peaks with high intensity, indicating a crystalline structure. The FESEM and TEM images of the L-SLNs revealed a high degree of purity and uniformity in the structure, indicating high mechanical strength and stability. The study conducted acute toxicity tests on SLNs following OECD 423 guidelines. The cognitive function of rats treated with high doses of test drugs improved significantly compared to the untreated group. Biochemical studies revealed that L-SLNs significantly decreased brain Acetylcholine Esterase activity induced by scopolamine. However, letrozole-loaded SLNs significantly increased AChE activity compared to the Shaam control group. The antioxidant properties of GPx, CAT, and SOD were evaluated, showing that L-SLNs significantly increased SOD activity, GPx, and catalase activity. Histopathological evaluation of brain regions revealed significant insights into the neuroprotective potential of L-SLNs in an AD rat model. The high dose (10 mg/kg) provided the most considerable protection, with neuronal and glial cells displaying near-normal arrangement and morphology in the cortical, hippocampal, and SN regions. The results elucidate the potential of L-SLNs as a novel therapeutic strategy for AD, with sustained release and enhanced delivery likely contributing to superior outcomes.
Supplementary Information
Below is the link to the electronic supplementary material.
Acknowledgements
The authors thank M.S. Ramaiah University of Applied Sciences and Chromed Biosciences Pvt. Ltd for supporting this project by providing the necessary facilities. The authors extend their appreciation to the Deanship of Scientific Research and Graduate Studies at King Khalid University for funding this work through a Large Group Research Project under grant number RGP.2/189/46.
Author contributions
DH, DNA and PP conceived and designed the research. DH, BSK, SROS, NMS, SKW, BG, SG, PT, SK, KC, DNA and PP conducted the experiments. DH, DNA and PP analyzed the data. DH, BSK, SK, KC, DNA and PP wrote the manuscript. All authors read and approved the manuscript.
Data availability
The manuscript and supplementary files include all the data generated during the study.
Declarations
Ethics approval and consent to participate
The protocols of the Committee for the Control and Supervision of studies on Animals (CCSEA), located in New Delhi, India, were followed in all studies. Authentication number XXIX/MSRFPH/CHE/PG-14/15 was issued after the study protocol was approved by the Institutional Animal Ethics Committee of the Department of Pharmacology, Faculty of Pharmacy, M.S. Ramaiah University of Applied Sciences, at a meeting on February 15, 2024.
Competing interests
The authors declare no competing interests.
Footnotes
Publisher’s note
Springer Nature remains neutral with regard to jurisdictional claims in published maps and institutional affiliations.
Contributor Information
Damodar Nayak Ammunje, Email: superdamu@gmail.com.
Parasuraman Pavadai, Email: pvpram@gmail.com.
References
- 1.Goedert, M. & Spillantini, M. G. A century of Alzheimer’s disease. science 314, 777–781 (2006). [DOI] [PubMed]
- 2.Wenk, G. L. Neuropathologic changes in alzheimer’s disease. J. Clin. Psychiatry. 64, 7–10 (2003). [PubMed] [Google Scholar]
- 3.Kumar, B. S. et al. Alzheimer’s Disease Protein Targets: Comprehensive Review and Future Directions. (2024). [DOI] [PubMed]
- 4.Katzman, R. Education and the prevalence of dementia and alzheimer’s disease. Neurology43, 13–13 (1993). [DOI] [PubMed] [Google Scholar]
- 5.Hendrie, H. C. Epidemiology of dementia and alzheimer’s disease. Am. J. Geriatric Psychiatry. 6, S3–S18 (1998). [DOI] [PubMed] [Google Scholar]
- 6.Larson, E. B., Kukull, W. A. & Katzman, R. L. Cognitive impairment: dementia and alzheimer’s disease. Annu. Rev. Public Health. 13, 431–449 (1992). [DOI] [PubMed] [Google Scholar]
- 7.Rocca, W. A. & Amaducci, L. Epidemiology of alzheimer’s disease. Neuroepidemiology, 55–96. https://www.taylorfrancis.com/chapters/edit/10.1201/9780429277276-6/epidemiology-alzheimer-disease-walter-rocca-luigi-amaducci (2019).
- 8.Friedland, R. P. Vol. 43 246–246 (AAN Enterprises, (1993).
- 9.Sireesha, G. et al. Identification of novel lead moieties as Anti-Cholinesterase agents: A computational approach. Bull. Env Pharmacol. Life Sci.12, 175–179 (2023). [Google Scholar]
- 10.Pavadai, P. et al. Synthesis of piperidine-4-one derivative containing dipeptide: an acetyl cholinesterase and β-secretase inhibitor. Anti-infective Agents. 18, 160–168 (2020). [Google Scholar]
- 11.Zhao, L., Ciallella, H. L., Aleksunes, L. M. & Zhu, H. Advancing computer-aided drug discovery (CADD) by big data and data-driven machine learning modeling. Drug Discovery Today. 25, 1624–1638 (2020). [DOI] [PMC free article] [PubMed] [Google Scholar]
- 12.Vemula, D., Jayasurya, P., Sushmitha, V., Kumar, Y. N. & Bhandari, V. CADD, AI and ML in drug discovery: A comprehensive review. Eur. J. Pharm. Sci.181, 106324 (2023). [DOI] [PubMed] [Google Scholar]
- 13.Park, K. A review of computational drug repurposing. Translational Clin. Pharmacol.27, 59–63 (2019). [DOI] [PMC free article] [PubMed] [Google Scholar]
- 14.Corsello, S. M. et al. The drug repurposing hub: a next-generation drug library and information resource. Nat. Med.23, 405–408 (2017). [DOI] [PMC free article] [PubMed] [Google Scholar]
- 15.Karaman, B. & Sippl, W. Computational drug repurposing: current trends. Curr. Med. Chem.26, 5389–5409 (2019). [DOI] [PubMed] [Google Scholar]
- 16.Sanseau, P. & Koehler, J. Vol. 12 301–302 (Oxford University Press, (2011).
- 17.Mehnert, W. & Mäder, K. Solid lipid nanoparticles: production, characterization and applications. Adv. Drug Deliv. Rev.64, 83–101 (2012). [DOI] [PubMed] [Google Scholar]
- 18.Yadav, N., Khatak, S. & Sara, U. S. Solid lipid nanoparticles-a review. Int. J. Appl. Pharm.5, 8–18 (2013). [Google Scholar]
- 19.Müller, R. H., Radtke, M. & Wissing, S. A. Solid lipid nanoparticles (SLN) and nanostructured lipid carriers (NLC) in cosmetic and dermatological preparations. Adv. Drug Deliv. Rev.54, S131–S155 (2002). [DOI] [PubMed] [Google Scholar]
- 20.Almeida, S. D. et al. Development and evaluation of S-carboxymethyl-L-cystine-loaded solid lipid nanoparticles for parkinson’s disease in murine and zebrafish models. Sci. Rep.15, 10885 (2025). [DOI] [PMC free article] [PubMed] [Google Scholar]
- 21.Pandian, S. R. K. et al. Formulation and evaluation of rutin-loaded solid lipid nanoparticles for the treatment of brain tumor. Naunyn. Schmiedebergs Arch. Pharmacol.394, 735–749 (2021). [DOI] [PubMed] [Google Scholar]
- 22.Senthamarai Pandi, J. et al. Pharmacokinetics and brain tumor delivery studies of Thymoquinone-Encapsulated Eudragit L100-Coated Solid-Lipid nanoparticles. J. Cluster Sci.36, 26 (2025). [Google Scholar]
- 23.Yusuf, M., Khan, M., Khan, R. A. & Ahmed, B. Preparation, characterization, in vivo and biochemical evaluation of brain targeted Piperine solid lipid nanoparticles in an experimentally induced alzheimer’s disease model. J. Drug Target.21, 300–311 (2013). [DOI] [PubMed] [Google Scholar]
- 24.Kunjiappan, S. et al. Capsaicin-loaded solid lipid nanoparticles: design, biodistribution, in Silico modeling and in vitro cytotoxicity evaluation. Nanotechnology32, 095101 (2020). [DOI] [PubMed] [Google Scholar]
- 25.Mukherjee, S., Ray, S. & Thakur, R. Solid lipid nanoparticles: a modern formulation approach in drug delivery system. Indian J. Pharm. Sci.71, 349 (2009). [DOI] [PMC free article] [PubMed] [Google Scholar]
- 26.Jo, S., Kim, T., Iyer, V. G. & Im, W. CHARMM-GUI: a web‐based graphical user interface for CHARMM. J. Comput. Chem.29, 1859–1865 (2008). [DOI] [PubMed] [Google Scholar]
- 27.Saravanan, G. et al. Design, graph theoretical analysis, density functionality theories, insilico modeling, synthesis, characterization and biological activities of novel thiazole fused Quinazolinone derivatives. Drug Dev. Res.79, 260–274 (2018). [DOI] [PubMed] [Google Scholar]
- 28.Cosconati, S. et al. Virtual screening with autodock: theory and practice. Expert Opin. Drug Discov.5, 597–607 (2010). [DOI] [PMC free article] [PubMed] [Google Scholar]
- 29.Gade, A. C., Murahari, M., Pavadai, P. & Kumar, M. S. Virtual screening of a marine natural product database for in Silico identification of a potential acetylcholinesterase inhibitor. Life13, 1298 (2023). [DOI] [PMC free article] [PubMed] [Google Scholar]
- 30.Shri, S. R., Nayak, Y. & Ranganath Pai, S. Molecular Docking studies and molecular dynamic simulation analysis: to identify novel ATP-competitive Inhibition of glycogen synthase kinase-3β for alzheimer’s disease. F1000Research13, 773 (2024). [DOI] [PMC free article] [PubMed] [Google Scholar]
- 31.Parasuraman, P. & Suresh, R. Design and insilico molecular prediction of flavone-fused-thiazole analogues as acetyl cholinesterase and β-Secretase inhibitor in the treatment of alzheimer’s disease. Int. J. Pharm. Technol. Res.7, 125–131 (2015). [Google Scholar]
- 32.Iqbal, D. et al. High-throughput screening and molecular dynamics simulation of natural product-like compounds against alzheimer’s disease through a multitarget approach. Pharmaceuticals14, 937 (2021). [DOI] [PMC free article] [PubMed] [Google Scholar]
- 33.Iqbal, S., Anantha Krishnan, D. & Gunasekaran, K. Identification of potential PKC inhibitors through pharmacophore designing, 3D-QSAR and molecular dynamics simulations targeting alzheimer’s disease. J. Biomol. Struct. Dynamics. 36, 4029–4044 (2018). [DOI] [PubMed] [Google Scholar]
- 34.Hollingsworth, S. A. & Dror, R. O. Molecular dynamics simulation for all. Neuron99, 1129–1143 (2018). [DOI] [PMC free article] [PubMed] [Google Scholar]
- 35.Zhao, H. & Caflisch, A. Molecular dynamics in drug design. Eur. J. Med. Chem.91, 4–14 (2015). [DOI] [PubMed] [Google Scholar]
- 36.Ferreira, L. L. & Andricopulo, A. D. ADMET modeling approaches in drug discovery. Drug Discovery Today. 24, 1157–1165 (2019). [DOI] [PubMed] [Google Scholar]
- 37.Zhong, H. A. ADMET properties: overview and current topics. In: Drug Design: Principles Applications (ed. Grover, A.) 113–133 (Springer, Singapore, 2017).
- 38.da Silva, V. B. et al. Computer-aided drug design and ADMET predictions for identification and evaluation of novel potential farnesyltransferase inhibitors in cancer therapy. J. Mol. Graph. Model.28, 513–523 (2010). [DOI] [PubMed] [Google Scholar]
- 39.Kesharwani, R. K. et al. Role of ADMET tools in current scenario: application and limitations. In: Computer-Aided Drug Design (ed. Singh, D. B.) 71–87 (Springer, Singapore, 2020).
- 40.Dhawan, S., Kapil, R. & Singh, B. Formulation development and systematic optimization of solid lipid nanoparticles of Quercetin for improved brain delivery. J. Pharm. Pharmacol.63, 342–351 (2011). [DOI] [PubMed] [Google Scholar]
- 41.Saini, S. et al. Systematically designed chitosan-coated solid lipid nanoparticles of ferulic acid for effective management of alzheimer’s disease: A preclinical evidence. Colloids Surf., B. 205, 111838 (2021). [DOI] [PubMed] [Google Scholar]
- 42.Shah, R., Eldridge, D., Palombo, E. & Harding, I. Optimisation and stability assessment of solid lipid nanoparticles using particle size and zeta potential. J. Phys. Sci.25, 59–71 (2014).
- 43.Shajan, S. R. O. et al. Folic Acid-Conjugated ferulic Acid-Entangled Single-Walled carbon nanotubes: A targeted therapeutic approach for effective breast cancer treatment. J. Drug Delivery Sci. Technol.111, 107111 (2025).
- 44.Radhakrishna, G. K. et al. Capsaicin-entangled Multi-walled carbon nanotubes against breast cancer: A theoretical and experimental approach. J. Cluster Sci.35, 2849–2869 (2024). [Google Scholar]
- 45.Nunes, D., Loureiro, J. A. & Pereira, M. C. Drug delivery systems as a strategy to improve the efficacy of FDA-approved alzheimer’s drugs. Pharmaceutics14, 2296 (2022). [DOI] [PMC free article] [PubMed] [Google Scholar]
- 46.Ahmad, S. & Hafeez, A. Formulation and development of curcumin–piperine-loaded S-SNEDDS for the treatment of alzheimer’s disease. Mol. Neurobiol.60, 1067–1082 (2023). [DOI] [PubMed] [Google Scholar]
- 47.Radomska-Soukharev, A. Stability of lipid excipients in solid lipid nanoparticles. Adv. Drug Deliv. Rev.59, 411–418 (2007). [DOI] [PubMed] [Google Scholar]
- 48.Turner, P. V., Brabb, T., Pekow, C. & Vasbinder, M. A. Administration of substances to laboratory animals: routes of administration and factors to consider. J. Am. Assoc. Lab. Anim. Sci.50, 600–613 (2011). [PMC free article] [PubMed] [Google Scholar]
- 49.Shineman, D. W. et al. Accelerating drug discovery for alzheimer’s disease: best practices for preclinical animal studies. Alzheimers Res. Ther.3, 1–13 (2011). [DOI] [PMC free article] [PubMed] [Google Scholar]
- 50.Laurijssens, B., Aujard, F. & Rahman, A. Animal models of alzheimer’s disease and drug development. Drug Discovery Today: Technol.10, e319–e327 (2013). [DOI] [PubMed] [Google Scholar]
- 51.Flecknell, P. Laboratory Animal Anaesthesia (Academic, 2015).
- 52.Green, C., Knight, J., Precious, S. & Simpkin, S. Ketamine alone and combined with diazepam or xylazine in laboratory animals: a 10 year experience. Lab. Anim.15, 163–170 (1981). [DOI] [PubMed] [Google Scholar]
- 53.Turner, P. V. & Albassam, M. A. Susceptibility of rats to corneal lesions after injectable anesthesia. Comp. Med.55, 175–182 (2005). [PubMed] [Google Scholar]
- 54.Paxinos, G., Watson, C., Calabrese, E., Badea, A. & Johnson, G. A. MRI/DTI Atlas of the Rat Brain (Academic, 2015).
- 55.AvendañO, C. Stereology of neural connections: an overview. In: Neuroanatomical Tract-Tracing 3: Molecules Neurons Systems, Vol. 40. 477–529 (Springer, Boston, 2006).
- 56.Paxinos, G. & Watson, C. The Rat Brain in Stereotaxic Coordinates: Hard Cover Edition (Elsevier, 2006).
- 57.Care, I. o. L. A. R. C. o. & Animals, U. o. L. Guide for the care and use of laboratory animals. (US Department of Health and Human Services, Public Health Service, National ….
- 58.Prasanth, D. S. et al. Citronellal as a promising candidate for alzheimer’s disease treatment: A comprehensive study on in Silico and in vivo anti-acetylcholine esterase activity. Metabolites13, 1133 (2023). [DOI] [PMC free article] [PubMed] [Google Scholar]
- 59.Pentkowski, N. S. et al. Anxiety-like behavior as an early endophenotype in the TgF344-AD rat model of alzheimer’s disease. Neurobiol. Aging. 61, 169–176 (2018). [DOI] [PMC free article] [PubMed] [Google Scholar]
- 60.Pentkowski, N. S., Rogge-Obando, K. K., Donaldson, T. N., Bouquin, S. J. & Clark, B. J. Anxiety and alzheimer’s disease: behavioral analysis and neural basis in rodent models of alzheimer’s-related neuropathology. Neurosci. Biobehavioral Reviews. 127, 647–658 (2021). [DOI] [PMC free article] [PubMed] [Google Scholar]
- 61.Perez Garcia, G. et al. Repetitive low-level blast exposure improves behavioral deficits and chronically lowers Aβ42 in an alzheimer disease Transgenic mouse model. J. Neurotrauma. 38, 3146–3173 (2021). [DOI] [PMC free article] [PubMed] [Google Scholar]
- 62.Berahmand, F., Anoush, G., Hosseini, M. J. & Anoush, M. Grape seed oil as a natural therapy in male rats with alzheimer’s diseases. Adv. Pharm. Bull.10, 430 (2020). [DOI] [PMC free article] [PubMed] [Google Scholar]
- 63.Lim, G. et al. Ibuprofen effects on alzheimer pathology and open field activity in APPsw Transgenic mice. Neurobiol. Aging. 22, 983–991 (2001). [DOI] [PubMed] [Google Scholar]
- 64.Gould, T. D., Dao, D. & Kovacsics, C. Mood and Anxiety Related Phenotypes in Mice: Characterization Using Behavioral TestsVol. 42 (Springer, 2009).
- 65.Whyte, L. S. et al. Reduction in open field activity in the absence of memory deficits in the AppNL – G– F knock-in mouse model of alzheimer’s disease. Behav. Brain. Res.336, 177–181 (2018). [DOI] [PubMed] [Google Scholar]
- 66.Palmer, A. M. Neurochemical studies of alzheimer’s disease. Neurodegeneration5, 381–391 (1996). [DOI] [PubMed] [Google Scholar]
- 67.Francis, P. T. et al. Neurochemical studies of early-onset alzheimer’s disease: possible influence on treatment. N. Engl. J. Med.313, 7–11 (1985). [DOI] [PubMed] [Google Scholar]
- 68.Iyo, M. et al. Measurement of acetylcholinesterase by positron emission tomography in the brains of healthy controls and patients with alzheimer’s disease. Lancet349, 1805–1809 (1997). [DOI] [PubMed] [Google Scholar]
- 69.Kuhl, D. et al. In vivo mapping of cerebral acetylcholinesterase activity in aging and alzheimer’s disease. Neurology52, 691–691 (1999). [DOI] [PubMed] [Google Scholar]
- 70.Shinotoh, H. et al. Brain acetylcholinesterase activity in alzheimer disease measured by positron emission tomography. Alzheimer Disease Assoc. Disorders. 14, S114–S118 (2000). [DOI] [PubMed] [Google Scholar]
- 71.Bermejo, P. et al. Peripheral levels of glutathione and protein oxidation as markers in the development of alzheimer’s disease from mild cognitive impairment. Free Radic. Res.42, 162–170 (2008). [DOI] [PubMed] [Google Scholar]
- 72.Prohaska, J. R. The glutathione peroxidase activity of glutathione S-transferases. Biochim. Et Biophys. Acta (BBA)-Enzymology. 611, 87–98 (1980). [DOI] [PubMed] [Google Scholar]
- 73.Youssef, P. et al. Evidence supporting oxidative stress in a moderately affected area of the brain in alzheimer’s disease. Sci. Rep.8, 11553 (2018). [DOI] [PMC free article] [PubMed] [Google Scholar]
- 74.Yadav, J. et al. Sialic acid associated with oxidative stress and total antioxidant capacity (TAC) expression level as a predictive indicator in moderate to severe alzheimer’s disease. Exp. Gerontol.141, 111092 (2020). [DOI] [PubMed] [Google Scholar]
- 75.Clausen, A., Xu, X., Bi, X. & Baudry, M. Effects of the superoxide dismutase/catalase mimetic EUK-207 in a mouse model of alzheimer’s disease: protection against and interruption of progression of amyloid and Tau pathology and cognitive decline. J. Alzheimers Dis.30, 183–208 (2012). [DOI] [PubMed] [Google Scholar]
- 76.Erdemci, F., Aşır, F. & Taş, F. Etiology and histopathology of alzheimer’s disease and current approaches. Black Sea J. Health Sci.5, 322–327 (2022). [Google Scholar]
- 77.Ramar, M. K., Henry, L. J. K., Ramachandran, S., Chidambaram, K. & Kandasamy, R. Ziziphus Mauritiana lam attenuates inflammation via downregulating NFκB pathway in LPS-stimulated RAW 264.7 macrophages & OVA-induced airway inflammation in mice models. J. Ethnopharmacol.295, 115445 (2022). [DOI] [PubMed] [Google Scholar]
- 78.Götz, J. et al. Transgenic animal models of alzheimer’s disease and related disorders: histopathology, behavior and therapy. Mol. Psychiatry. 9, 664–683 (2004). [DOI] [PubMed] [Google Scholar]
- 79.Nautiyal, G., Sharma, S. K., Kaushik, D. & Pandey, P. Development, optimization, and evaluation of Rutin-Loaded liposomes in the management of rheumatoid arthritis. Curr. Drug Deliv. 22(10), 1441–1458 (2025). [DOI] [PubMed]
Associated Data
This section collects any data citations, data availability statements, or supplementary materials included in this article.
Supplementary Materials
Data Availability Statement
The manuscript and supplementary files include all the data generated during the study.