

Abstract
Here, we describe a simple, rapid, cost-effective, and efficient novel one-step purification method for GST-tagged peptides and small proteins. This novel technique applies to proteins and peptides that are known to be thermally stable at 60°C and do not have elaborate structure(s) and whose heat-induced unfolding is reversible. This method takes advantage of glutathione S-transferase from Schistosoma japonicum (sj26GST) precipitating when heated at 60 °C. Purified GST-fusion products are subjected to enzymatic cleavage to separate the GST tag from the target peptide or small proteins. In our proposed method, the cleavage products are heated at 60 °C for 20 min which results in the precipitation of the GST tag. Subsequently, the GST tag is separated from the target peptide or small protein by high-speed centrifugation. Biophysical experiments such as SDS-PAGE, circular dichroism, isothermal titration calorimetry, mass spectroscopy, and multidimensional NMR spectroscopy confirm that the target peptides and small proteins are purified to more than 95% homogeneity, intact native conformation, and no significant change in the binding affinity of heat-treated purified product to the interacting partners.
Keywords: Aggregation, GST purification, Heat treatment, Recombinant proteins
1. Introduction
Proteins are complex biological molecules that are involved in numerous cellular functions and are essential for industrial and therapeutic applications [1, 2]. Peptides and small proteins have been extensively developed in various fields of medicine as therapeutics and target agents [3]. About 7000 naturally occurring peptides have been identified and known to play vital roles in human physiology including actions such as hormones neurotransmitters, ion channel ligands, or anti-infectives [4]. When compared to small molecules, peptides and small proteins have excellent selectivity and affinity, as well as the ability to stay in target locations due to their size [5, 6]. In addition, their ability to be degraded easily is beneficial for many ailments [7]. Recombinant protein production is essential and is mainly driven by the cost-effectiveness, simplicity, and speed of the production process in association with an adequate yield of protein products. Escherichia coli is one of the most preferred protein expression systems due to its capability of high yield production of recombinant proteins via established methods [8]. Recombinant peptide/small protein production faces challenges because of the peptide/small protein’s size and/or the presence of highly charged residues which renders the peptide/small protein susceptible to proteases in the host expression [9]. To resolve this, unique protein/peptide affinity tags are employed. The affinity tag facilitates and enhances the expression level and solubility of recombinant proteins and peptides via affinity chromatography [10, 11]. Among the various soluble enhancing tags is glutathione S-transferase which confers on the peptide/small protein of interest greater stability and high solubility. Glutathione S-transferase (GST) is a 26-kDa eukaryotic protein that is widely expressed. It is known to be nontoxic to the host when cloned from Schistosoma japonicum and employed as an N-terminal fusion tag, resulting in high expression. It has been shown by Kaplan et al. that glutathione S-transferase from Schistosoma japonicum (sj26GST) losses its enzymatic activity with increasing temperature; the midpoint of transition occurs at 51 °C [12]. GST binds to glutathione in a Sepharose matrix with a high affinity. This is reversible following the binding of the fusion protein.
The bound protein can be eluted under mild and non-denaturing conditions using free reduced glutathione (10–40 mM). A specific protease site engineered between the GST moiety and the target protease allows the removal of the GST tag from the recombinant target protein. After enzymatic cleavage, a second chromatography on a glutathione column can be used to remove the GST tag from the target protein [13, 14]. This is accomplished by reloading the cleavage products onto glutathione Sepharose, where the GST tag binds to the glutathione Sepharose and the target protein flows through in a huge volume.
The GST tag can then be eluted with reduced glutathione, and the eluted target protein requires an additional concentration step before using the target protein for other biophysical experiments. The back-to-back two-step purification can be tedious, labor-intensive, and time-consuming.
Herein, we illustrate a simple, rapid, efficient heat treatment purification technique that eliminates the second chromatographic step and does not result in any loss in the biological activity of the target peptides/small proteins. Several protein models were used to highlight the robustness of this approach. CD2 domain of cpSRP43 (6 kDa) is a component of the chloroplast signal recognition pathway that is involved in the transport of the light-harvesting chlorophyll-binding protein. AlbM4, 1.5 kDa is a 10-residue peptide motif that is located at the C-terminal end of Albino 4, which is a ligand of cpSRP43 [15]. The 11.5 kDa S100A13 (S100 Calcium Binding Protein A13) exports proteins that lack a signal peptide and are secreted by an alternative pathway.
S100A13 (S100 Calcium Binding WAP - domain of Anosmin-1 (7 kDa)) is evolutionarily conserved and has been shown to have characteristics found in proteins associated with primary immune defense, cell proliferation, and wound healing by inhibiting protease activity [16]. An effector of the Ras-related protein Cell division cycle 42 (Cdc42), known as PBD46, is an activated derivative of PAK which binds to and modulates the Cdc42 function [17, 18]. This Ras-binding protein also demonstrated that the heat treatment purification approach was appropriate because of its size (5.1 kDa). Our results demonstrate that when exposed to heat (60 °C), the GST tag eventually precipitates. By precipitating the GST tag and rapidly centrifuging the sample to separate the target peptide/small protein from the solid impurities, the heat treatment effectively separates the cleavage products. This novel method was used on proteins and peptides up to 11.5 kDa that are known to be thermally stable at 60 °C, have simple structural characteristics, and exhibit reversible heat-induced unfolding. The heat treatment approach on proteins larger than 11.5 kDa has to be studied further.
2. Material
Prepare all the solutions using ultrapure (deionized) water and analytical-grade reagents. Prepare and store all the reagents at room temperature (except where mentioned).
2.1. Buffers
1× phosphate-buffered saline (1× PBS): 137 mM sodium chloride, 2.7 mM potassium chloride, 10 mM disodium hydrogen phosphate, 2 mM dipotassium hydrogen phosphate; pH 7.2.
Equilibration/lysis/wash buffer: 1× PBS, pH772.
Elution buffer: 10 mM reduced glutathione in 1× PBS; pH 8.0.
2.2. Media and Cells
Luria-Bertani (LB) Miller Broth media: Dissolve 12.5 g of LB ready-made powder in 500 mL of water. Dispense into flasks, cover with aluminum foil, and autoclave with the liquid cycle for 15 min at 121.5 °C at 15-lb pressure.
LB agar plates.
Competent BL21 (DE3)/star competent cells.
Escherichia coli (E. coli) BL21-Pro cells containing HB-pET22b™.
M9 Media.
2.3. Solutions
Ampicillin: 100 mg of ampicillin in 1 mL of 50% ethanol and store in −20 °C freezer.
Isopropyl-1-thio-B-D-galactopyranoside (IPTG): 238 mg of IPTG in 1 mL of water and stored at −20 °C.
Glycerol stock of E. coli cells transformed with the HB-pET22b™ expression vector.
SDS-polyacrylamide gel electrophoresis (SDS-PAGE) setup: 30% polyacrylamide (29% acrylamide and 1% N,N′-methylenebisacrylamide), 1.5 M Tris–HCl (pH 6.8 for stacking gel and pH 8.8 for resolving gel), 10% ammonium persulfate, N,N,N′,N′-tetramethyl-ethylenediamine.
Loading dye: 2.4 mL 1 M Tris-Cl(pH ~ 6.8), 3 mL20% SDS, 3 mL glycerol (100%), 1.6 mL B-mercaptoethanol, 6 mg bromophenol blue.
Staining solution: 15 mL of methanol, 5 mL of glacial acetic acid, 30 mL of DI water, 100 mg of Coomassie Brilliant Blue R-250.
De-staining solution: 120 mL of methanol, 40 mL of glacial acetic acid, 200 mL of DI water.
10× running buffer: 30.3 g of Tris base; 144.0 g glycine, 10.0 g of SDS dissolve and bring the total volume to 1.0 L.
TBS/T solution: 20 nM Tris–HCl pH 7.4, 0.15 M NaCl, 0.1% Tween.
Towbin buffer: 25 mM Tris–HCl, 192 mM glycine, pH 8.3 with 20% methanol (v/v) and 0.01% SDS.
5% skim milk: 5 gm dissolved in 100 mL 1× TBS-T solution 10 mL 10% Tween-20.
Phenyl methyl sulfonyl fluoride (PMSF): 34.8 mg of PMSF in 1 mL of 100% ethanol and stored in 20 °C freezer.
NBT (nitro-blue tetrazolium chloride) and BCIP (5-bromo-4-chloro-3′-indolyl-phosphate p-toluidine salt).
Sequence grade recombinant trypsin.
Pure, 15N labeled peptide solution.
Deuterium oxide.
2.4. Equipment
2 L Erlenmeyer flasks.
500 mL Erlenmeyer flasks.
Temperature-controlled shaking incubator.
A mechanical device to disrupt E. coli cells (e.g., an Ultrasonicator, French press, or cell homogenizer).
UV-vis spectrophotometer.
Refrigerated centrifuge, and centrifuge bottles (500 mL and 50 mL).
Nalgene™ PPCO centrifuge bottles.
GSH-Sepharose resin.
Column with dimensions 1.6 cm × 20 cm can be used to pack GSH-Sepharose with a bed volume of ~15 mL.
Econo UV monitor.
Low-flow peristaltic pump.
Oakridge tubes.
Ultrafiltration centrifugal concentrating devices (Centricon) with appropriate molecular-weight cutoffs.
Water bath.
Beckman Coulter Avanti centrifuge.
Beckman Coulter Avanti J-E Rotor JA–10.
Beckman Coulter Avanti J-E Rotor JA–25.
Sorvall™ Legend™ Micro 21 Microcentrifuge.
Rocker.
Degas machine.
Nitrocellulose membrane.
Isothermal titration calorimeter (MicroCal, Calorimetry Sciences, Thermometric AB).
2.5 mL Hamilton gas-tight syringe with a blunt-end needle long enough to reach the volume of the sample cell.
Spectrophotometer and quartz cuvettes of appropriate optical path length (depending on the expected protein concentration).
2 mL all-glass syringe (e.g., Becton Dickinson 2 cc Yale syringe).
Precut needle supplied with the DSC instrument.
Differential scanning calorimeter (DSC), calibrated.
CD spectrometer (calibrated) and cells.
500 MHz NMR Magnet.
NMR tubes.
3. Methods
3.1. Bacterial Overexpression and Detection of GST Fusion Protein
3.1.1. Construction of a GST-Tagged Fusion Protein Expression Vector (pET22bTM) and Transformation of BL21 Star E. coll Competent Cells with the Expression Vector
Take competent cell stock aliquot BL21 star (about 100 μL) out of −80 °C freezer. Place on ice to thaw for about 5 min.
Pipet 5 μL of plasmid DNA (pET22b™) and add to the thawed competent cells and incubate on ice for at least 30 min (see Note 1).
Heat shock the competent cells at 42 °C for 45–60 s followed by cooling on ice for 3–5 min.
After the ice treatment, 900 μL of cold LB broth was added to the cells and kept on the shaker at 37 °C for 50–60 min.
Prepare LB agar plates with appropriate antibiotic [ampicillin at 100 μg/mL].
Centrifuge the grown cells for 8–10 min at 13,000 rpm.
Discard the supernatant. Dissolve the pellet in 100 μL of LB media then spread the culture onto LB agar plates.
Incubate the plate at 37 °C for 14–16 h (overnight). Longer times of incubations will allow the satellite colonies to appear.
3.1.2. Preparation of Starter Culture
Prepare 50–100 mL of LB broth (2.5 w/v% of LB media to water) in an Erlenmeyer flask (500 mL) and sterilize by autoclaving at 120 °C, 15 lbs pressure for 60 min.
Add ampicillin antibiotic to 10 mL of sterilized LB media [final ampicillin concentration to (100 μg/mL)].
Pick a single colony from overnight LB agar plates using a sterilized inoculation loop, or a sterile pipette tip, and add to the prepared 10 mL LB broth (step 2) containing ampicillin.
Incubate the bacterial culture in a shaker (~250 rpm) at 37 °C until the OD @ 600 nm reaches a value of 0.4–0.6 (~12–14 h.).
Save the starter culture flask in a refrigerator overnight at 4 °C.
3.1.3. Preparation of Large-scale Bacterial Culture for Protein Overexpression
Prepare 500 mL of LB broth (2.5 w/v% of LB media to water) in 2 L Erlenmeyer flasks and sterilize by autoclaving at 120 °C, 15 lbs pressure for 60 min.
Add ampicillin antibiotic to 500 mL of sterilized LB media [final ampicillin concentration to (100 μg/mL)].
Add 25 mL of the starter culture (step 5) to LB media.
Grow the cells under the same growth conditions of 37 °C and 250 rpm until the OD @ 600 nm reaches ~0.4–0.6(~1–2 h).
After reaching the desired OD, dispense 1 mL of bacterial cells from the flask, as a pre-induction sample, for SDS-PAGE analysis.
Prepare 1 M IPTG stock solution (2.38 gm of IPTG in 10 mL DI water).
Induce the culture to overexpress protein by addition of 500 μL of I M IPTG stock solution [final IPTG concentration to (100 μg/mL)] (see Note 2).
Dispense 1 mL of bacterial cells from the flask, as a post-induction sample, for SDS-PAGE analysis.
Continue induction of protein at 37 °C and 250 rpm for approximately 3–5 h. After induction, centrifuge bacterial cell culture in centrifuge bottles (1 L) at 6000 rpm for 25 min at 4 °C. Later, carefully discard the supernatant without disturbing the bacterial cell pellet at the bottom.
Resuspended cell pellet in ~40 mL of freshly prepared 10 mM phosphate buffer (PB) (pH 7.2) and transfer to a new centrifuge tube (50 mL).
Centrifuge at 6000 rpm for 15 min at 4 °C. Discard the clear 10 mM sodium phosphate buffer (PB) supernatant. Freeze the cell pellet at −20 °C for future use. When required, they can be thawed at room temperature and then placed on ice.
Perform SDS-PAGE of the pre – and post-IPTG induced samples.
The resulting gel should show a prominent band corresponding to the molecular size of the GST tag-fused target protein.
3.2. Protein Purification Using GST-Glutathione Affinity Chromatography
The E. coli expression vectors, encoded with N-terminal glutathione S-transferase (GST) tag followed by protease cleavage sites (e.g., thrombin, factor Xa, enterokinase, or PreScission) are designed to purify desired recombinant proteins. GST target proteins can be purified by affinity chromatography on commercially available glutathione (γ-glutamyl cysteinyl glycine; GSH) Sepharose resins (Kd = 0.6nM). The successful removal of the GST tag from the target protein can be achieved by treatment with a preferred restriction protease under optimal conditions. Optimal conditions like the choice of cleavage buffer, pH, temperature, the addition of reducing agents or a mild denaturant, length of incubation, and addition of divalent cations, like Ca2+ to the buffer help to maximize the efficiency of cleavage using minimal amounts of restriction protease.
3.2.1. Column Packing
Efficient column packing is extremely important for protein separation, especially when using gradient elution. Column resin packed too densely might crack, leading to channeling and breakthrough. A column resin packed too loosely can further compress causing a liquid gap where mixing can occur. Both instances will lead to uneven flow, band broadening, and loss of resolution ultimately causing loss of valuable protein. A good column packing eliminates such issues and helps inconsistent performance over several processing cycles.
Take the 15 mL of a 50% slurry of GST-Sepharose in 20% ethanol and degas.
Pour the degassed slurry into a 1.6 cm × 20 cm Econo UV column along the walls using a glass rod and allow gravity settlement of resin.
Make sure there is no formation of air pockets/bubbles.
Wash the settled resin with equilibration buffer (starting buffer of purification/lysis buffer) with a constant flow rate of 1–2 mL/min for at least 5 column volumes (CV) of buffer (~100 mL).
3.2.2. Bacterial Cell Lysis and Loading
Thaw the cell pellet from the −20 °C freezer (from step 11 in Subheading 3.1.3), and add 30–35 mL of lysis buffer. Let it thaw for 20 min at room temperature and subsequently suspend the cell pellet by dissolving/vortexing until the suspension becomes turbid.
Place the cell suspension on an ice bath for a minimum of 10 min.
Lyse the resuspended cells by ultrasonication (amplitude # 15 Watts output) with an alternate cycle of 10 s of on and off for 15 min.
Centrifuge the lysate at 19,000 rpm for 25 min at 4 °C using Nalgene centrifuge bottles.
Quickly collect the supernatant into a clean falcon tube to avoid resuspension of cell debris.
3.2.3. Purification of GST Fusion Protein Using Protease Thrombin
Clear cell lysate/supernatant (from step 5 in Subheading 3.2.2) loaded onto pre-equilibrated GSH-Sepharose column at a flow rate of 0.2 mL/min (see Note 3).
Complete loading of supernatant followed by 1× PBS buffer wash. Absorbance for bacterial contaminant proteins is monitored by a single-wavelength detector (280 nm).
Continue 1× PBS buffer wash until the absorbance reached baseline.
Elute GST fusion protein with 10 mM reduced glutathione in 1× PBS buffer for thrombin cleavage.
3.2.4. Off-Column Cleavage
Elute GST fusion protein with 10 mM reduced glutathione in 1× PBS buffer for thrombin cleavage (see Note 4).
The eluted fraction with GST fusion protein subjected to ultrafiltration and buffer exchange into 1× PBS using centrifugal spin concentrators with a molecular weight cutoff of 10 kDa.
GST fusion protein concentration was estimated by measuring the absorbance at 280 nm.
Add restriction protease, thrombin, to the GST fusion protein solution at a ratio of 1 U of thrombin to 250 μg of GST fusion protein.
Incubate the mixture at 22 °C for 24 h with continuous mixing/rocking (Fig. 1) (see Note 5).
Fig. 1.

SDS-PAGE of purification and thrombin cleavage of GST-CD2 (32 kDa): lane-1, pre-stained protein marker; lane-2, pellet post cell lysis; lane-3, supernatant post lysis; lane-4, flow through; lane-5, eluted GST-CD2; lane-6, 8 M urea; lane-7, cleaved GST-CD2 using thrombin
3.3. Separation of Cleaved Fusion Products Using the Heat Treatment Procedure
The heat treatment method is a single-step, simple, rapid, and efficient way of separating the GST tag from the target protein after the cleavage. This method eliminates the second chromatography step in the conventional purification process. Applying heat at 60 °C following cleavage causes the GST tag to precipitate or aggregate. High-speed centrifugation is applied to the sample to separate target proteins from the aggregated GST tag.
3.3.1. Heat Treatment Method
After cleavage, incubate the mixture at 60 °C for 20 min, followed by two-time centrifugation at 16,200 xg for 10 min to remove the GST tag (see Notes 6 and 7).
Collect the supernatant after centrifuge.
Check the purity of samples by SDS-PAGE (Figs. 2, 3, 4, 5, and 6).
Subject the purified protein product(s) to desalting and concentration using a Millipore ultrafiltration concentrator (s) using appropriate molecular weight cutoff filter(s).
Fig. 2.

(a) SDS-PAGEs of heat treatment: lane-1, pre-stained protein marker; lane-2, GST-CD2; lane-3, cleaved GST CD2; lane-4, supernatant 45 °C; lane-5, pellet 50 °C; lane-6, supernatant 50 °C; lane-7, pellet 55 °C; lane-8, supernatant 55 °C; lane-9, pellet 60 °C; lane-10, supernatant 60 °C; lane-11, pellet 65 °C; lane-12, supernatant 65 °C; lane-13, pellet 70 °C; lane-14, supernatant 70 °C; lane-15, pellet 75 °C; lane-16, supernatant 75 °C; lane-17, pellet 80 °C; lane-18, supernatant 80 °C; lane-19, pellet 85 °C; lane-20, supernatant 85 °C. (b) Absorbance of pure GST-tag monitored its aggregation index at temperatures ranging from 40 to 80 °C
Fig. 3.

(a) Flow chart comparing conventional purification method and heat treatment method. (b) SDS-PAGE of purification of CD2 (6 kDa) using heat treatment method (lanes-3–4) or conventional purification method (lanes-5–6): lane-1, pre-stained protein marker; lane-2, cleaved GST-CD2 using thrombin; lane-3, pellet after heat treatment; lane-4, supernatant after heat treatment; lane-5, eluted CD2 in flow-through; lane-6, eluted GST with 10 mM reduced GSH. (c) Western blot of heat treatment method: lane-1, GST-CD2; lane-2, cleaved GST-CD2; lane-3, supernatant post-heat treatment, lane-4, pellet post-heat treatment; lane-5, pre-stained protein marker. (d) Yields of CD2: heat treatment method vs. conventional purification method
Fig. 4.

(a) SDS-PAGE of purification of PBD46 (5.1 kDa) using the heat treatment method. Lane-1, MWM; lane-2, PBD46 bound to GST; lane-3, PBD46 after cleavage by thrombin; lane-4, 30 °C treatment pellet; lane-5, 30 °C treatment supernatant; lane-6, 50 °C treatment pellet; lane-7, 50 °C treatment supernatant; lane-8, 70 °C treatment pellet; lane-9, 70 °C treatment supernatant; lane-10, 90 °C treatment pellet; lane-11, 90 °C treatment supernatant. (b) DSC spectrum of PBD46 purified by heat treatment. The Tm of the peptide is 41.6 °C (black) which was consistent with the observed Tm of 41.3 °C for PBD46 produced by the conventional double chromatography method (gray). (c) Mass spectrum confirming the size of PBD46. The mass is around 10 kDa because PBD46 is known to dimerize. (d) MALDI-TOF spectrum of PBD46 was analyzed to confirm the amino acid sequence of the peptide
Fig. 5.
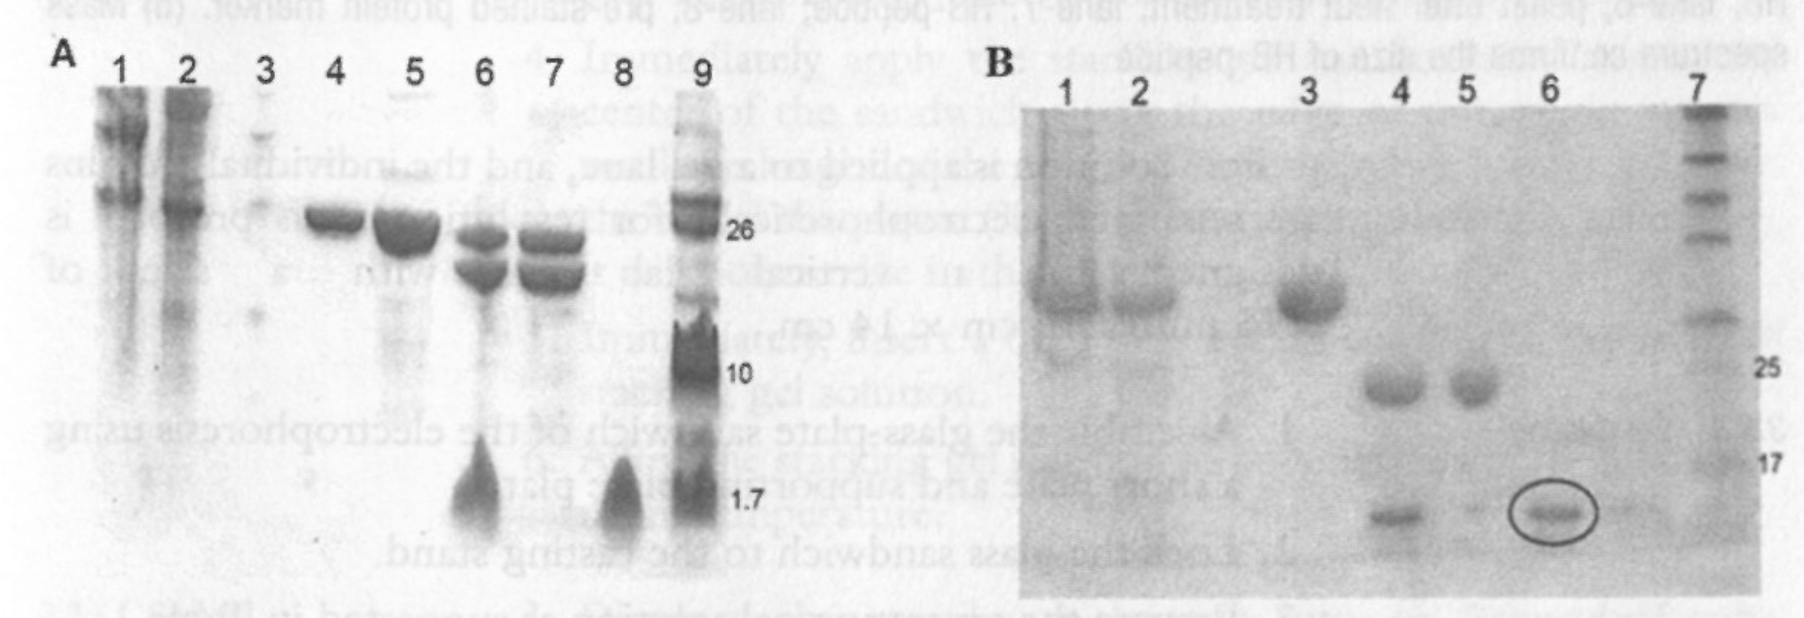
(a) Tricine gel of purification of AlbM4 peptide (1.5 kDa): lane-1, pellet after lysis; lane-2, supernatant after lysis; lane-3, flow through; lane-4&5, eluted GST-AlbM4; lane-6, cleaved fusion protein; lane-7, pellet after heat treatment; lane-8, supernatant after heat treatment; lane-9, pre-stained ultra-low protein marker. (b) SDS-PAGE of purification of A) S100A13 (11.5 kDa): lane-1, pellet after lysis; lane-2, supernatant after lysis; lane-3, eluted GST-S100A13; lane-4, cleaved GST S100A13; lane-5, pellet after heat treatment; lane-6, supernatant after heat treatment; lane-7, pre-stained protein marker
Fig. 6.

(a) SDS-PAGE of purification of WAP (7 kDa): lane-1, pellet after lysis; lane-2, supernatant after lysis; lane-3, eluted GST-WAP; lane-4, cleaved GST WAP; lane-5, pre-stained protein marker; lane-6, WAP. (b) Mass spectrum confirms the size of WAP. (c) SDS-PAGE of purification of the HB-peptide (3.7 kDa): lane-1, pellet after lysis; lane-2, supernatant after lysis; lane-3, flow through; lane-4, eluted GST-HB; lane-5, cleaved GST HB; lane-6, pellet after heat treatment; lane-7, HB-peptide; lane-8, pre-stained protein marker. (d) Mass spectrum confirms the size of HB-peptide
3.3.2. Denaturing (SDS) Discontinuous Gel Electrophoresis
One-dimensional gel electrophoresis separates proteins under denaturing conditions (presence of 0.1% SDS) based on the molecular size as they move through a polyacrylamide gel matrix toward the anode. The polyacrylamide gel is cast as a separating gel (called resolving or running gel) topped by a stacking gel in an electrophoresis setup. After sample proteins are solubilized, an aliquot of the protein solution is applied to a gel lane, and the individual proteins are separated electrophoretically for resolution. This protocol is designed for a vertical slab gel with a size of 0.75 mm × 14 cm × 14 cm.
3.3.3. Gel Casting
Assemble the glass-plate sandwich of the electrophoresis using a short plate and supporting plate plates.
Lock the glass sandwich to the casting stand.
Prepare the separating gel solution as suggested in Table 1.
Add a specified amount of 10% ammonium persulfate and TEMED to the above solution, and swirl gently to mix.
Immediately apply the separating gel solution into the glass sandwich along an edge of one of the spacers using a pipette until the height of the solution between the glass plates is ~11 cm. (Use the solution immediately; otherwise, it will polymerize in the tube.)
Using another Pasteur pipette, slowly cover the top of the gel with a layer of isopropyl alcohol. The overlay provides exposure to moisture, which inhibits polymerization and also allows a flat interface to form during gel formation.
Do not disturb the gel surface for at least 20–30 min at room temperature.
Table 1.
Conditions to prepare the separating and stacking gel solutions
| Materials | Resolving gel | Stacking gel |
|---|---|---|
|
| ||
| Total volume | 8 mL | 5 mL |
| ddH2O | 2.6 mL | 2.6 mL |
| 30% acrylamide | 3.2 mL | 1 mL |
| 0.5 M Tris-HCl pH 8.8 | 2 mL | - |
| 0.5 M Tris-HCl pH 6.8 | - | 1.25 mL |
| 10% SDS | 80 μL | 50 μL |
| 10% APS | 80 μL | 50 μL |
| TEMED | 8 μL | 8 μL |
3.3.4. Stacking Gel
Pour off the layer of isopropyl alcohol from the glass sandwich.
Prepare the stacking gel solution as directed in Table 1.
Add a specified amount of 10% ammonium persulfate (w/v%) and TEMED to the above solution, and stir gently to mix.
Immediately apply the stacking gel solution slowly into the center of the sandwich along the edge of one of the spacers until the height of the solution in the sandwich is ~1 cm from the top of the plates. (Use the solution immediately; otherwise, it will polymerize in the tube.)
Immediately, insert a 0.75 mm Teflon comb into the layer of stacking gel solution.
Allow the stacking gel solution to polymerize for 20–30 min at room temperature.
3.3.5. Sample Preparation and Loading (see Notes 8 and 9)
Dispense the samples to be run into an Eppendorf tube (100 μL each).
From the 100% TCA stock, add 10 μL to each sample (100 μL per mL, i.e., if the sample is 100 μL, add 10 μL of the TCA). Vortex and spin at 13,000 rpm for 3 min.
Discard the supernatant and add 500 μL of acetone (100%) and vortex and spin again at 13,000 rpm for 3 min.
Carefully remove the supernatant with the pellet at the bottom of the walls of the Eppendorf.
After you remove the supernatant, put the Eppendorf tube in a heater block for 30 s to remove extra acetone.
Add 15 μL of 8 M urea solution to the pellet and try to dissolve it completely.
Add 5 μL of loading dye and mix it with a pipette.
Carefully remove the Teflon comb from the setup without tearing the edges of the polyacrylamide wells. After the comb is removed, rinse wells with water.
Attach the gel sandwich to the buffer chamber following the manufacturer’s instructions.
Fill the buffer chamber with 1 x electrophoresis running buffer so that the sample wells of the stacking gel are filled with buffer.
Now, load the samples onto the wells of the gel (15–20 μL).
Make sure you add a commercial protein marker in one of the lanes.
3.3.6. Gel Running
Connect the power supply to the setup and run at 100 mA of constant current, until the bromophenol blue tracking dye has reached the bottom of the separating gel (~60 min).
Disconnect the power supply. Discard electrophoresis buffer and remove gel sandwich.
Orient the gel so that the order of the sample wells is known and lay the sandwich on a paper towel.
Carefully remove the gel from the gel sandwich plates. Cut a small triangle off one corner of the gel so the lane orientation is not lost during staining and destaining.
Stain the gel with Coomassie blue staining solution for 5–6 min.
Wash the stained gel with water to remove the superficial stain on the gel followed by destaining with a destaining solution for 6–8 h.
Proceed to protein detection.
3.3.7. Transferring the Protein from the Gel to the Membrane/Western Blot
The Western blotting technique is utilized for the detection and characterization of a particular biomolecule/protein in a sample. Protein sample mixtures are first resolved by molecular weight using gel electrophoresis (SDS-PAGE), and then blotting or electro-transfer of samples from the gel to a nitrocellulose membrane is performed. Specific proteins are then detected on the blot by antibody probes. Western blots resolve complex mixtures of proteins and provide data on the molar mass and abundance of a particular protein of interest in a sample mixture.
3.3.8. Setup Blotting Sandwich and Transfer
After a successful run of the SDS-PAGE experiment, the gel obtained is utilized for blotting.
Soak the blotting stack items, filter paper, and transfer membrane (nitrocellulose membrane) in Towbin buffer solution for 5 min.
Assemble the blotting stack in the following order: (bottom) filter-paper-gel-nitrocellulose-filter paper (top).
Follow the instrument manual to set up the reservoir with the blotting stack.
Fill the reservoir with Towbin buffer. (The blotting would generate high heat which can melt away the gel so make sure you follow instrument manual instructions clearly for the usage of stirrer and ice bags in the reservoir.)
Connect the setup to the power supply, adjust the run parameters to 150 V, 75 mA and then carry on blotting for 120 min.
After the completion of the run, carefully separate the nitrocellulose membrane from the blotting stack into a clean box.
Soak the membrane in 5% skim milk (w/v%) in TBS-T solution (freshly prepared) for 30 min at room temperature with continuous rocking.
Wash the membrane with 5 mL of TBS-T solution.
Add 5 mL of 0.2% BSA in TBS-T to the membrane followed by the addition of a primary antibody (2 μL).
Incubate for 12 h at room temperature with continuous rocking.
Wash the membrane with TBS-T solution three times with 3 mL each time to remove excess antibody.
Add 5 mL of 0.2% BSA (w/v%) in TBS-T to the membrane followed by the addition of a 2 μL secondary antibody (alkaline phosphatase-conjugated antibody).
Incubate for 2 h at room temperature with continuous rocking.
Wash the membrane with TBS-T solution three times with 3 mL each time to remove excess antibody.
Add 3 mL of NBT/BCIP solution to transfer paper and then incubate for 5 min at room temperature with a continuous rocking.
Proceed to protein detection.
3.4. Isothermal Titration Calorimetry
Isothermal titration calorimetry (ITC) is the most rigorous commercially available method for characterizing protein-ligand interactions. In this method, interactions are detected by the enthalpy change of the reaction. ITC is also a useful tool for evaluating qualitative questions such as whether a proposed binding interaction occurs at all, or not. ITC can be a rich source of thermodynamic information about the molecular binding mechanism. The dissociation constant obtained from the ITC data will directly show the affinity each protein has for its ligand. Any slight changes in an increase or decrease in the affinity of protein-ligand interaction should be directly reflected in a lower/higher respective dissociation constant.
De-gas the protein samples by gently stirring under a vacuum for 15 min.
Clean the calorimeter reaction cell with buffer.
Remove the buffer from the reaction cell using the 3 mL syringe.
Load the sample into the reaction cell using the 2.5 mL Hamilton syringe. Gently place the needle of the syringe on the bottom of the reaction cell and slowly inject the sample while moving the syringe up to dislodge any air bubbles that may otherwise become trapped in the reaction cell.
Stop injecting, when the sample can be observed to be coming up out of the reaction cell port.
Remove the excess solution from around the cell porthole but leave the sample cell filled up to the top of the reaction cell opening.
Load the syringe with a cpSRP54 sample (syringe capacity up to 40 μL).
Using the Origin Version 7.0 version, set the temperature of the reaction cell to 25 °C.
Initiate the titration according to the manufacturer’s instructions.
Carry on the titration sequentially with 1.3 μL aliquots from the syringe to the cell (CD2) with a 12 s interval between injections to allow each point along the titration sufficient time to reach equilibrium.
Refer to the manufacturer’s instructions for how to set the parameters in the Origin program.
The given concentration of cpSRP54 sample and CD2 is in a molar ratio of 10:1, make sure you follow the same ratio to carry out the titration.
After completion of the ITC titrations, clean and store the calorimeter cell as recommended by the instrument manufacturer.
Analyze the binding data using the Origin Version 7.0 provided by the instrument manufacturer (Fig. 7).
Fig. 7.

Isothermal titration calorimetry of (a) heat-treated CD2 vs. 54-peptide (Kd = 1.27 μM) and (b) conventionally purified CD2 vs. 54-peptide (Kd = 1.42 μM)
3.5. Differential Scanning Calorimetry
Analyzing the thermal stability of a protein in a dilute solution involves determining changes in the partial molar heat capacity of the protein at constant pressure (ΔCp). Differential scanning calorimetry (DSC) is an analytical technique that measures the molar heat capacity of samples as a function of temperature. It measures the thermal transition temperature (melting temperature; Tm) and the energy required to disrupt the interactions stabilizing the tertiary structure (ΔH) of proteins. DSC profiles provide information about the thermal stability of protein and to some extent serve as a structural “fingerprint” that can be used to assess structural conformation.
Turn on the DSC machine.
Clean the sample and reference cell with DI water (follow the instructions manual for a cell cleaning procedure).
Rinse both the cells with buffer two times.
Fill both the cells with buffer (250 μL) and then close the lid tightly until the pressure reaches above 40 psi inside the cell chamber.
Now open the DSC control program, and create a sequence of buffer runs followed by sample runs. Label the runs according to your convenience.
Run at least three buffer runs between 25 and 85 °C at a ramping temperature rate of 2 °C/min to buffer-buffer baseline of the instrument.
After the buffer runs, carefully empty the buffer from the sample cell and load the protein sample solution (250 μL) into the sample cell without disturbing the reference cell.
Wait for the run to complete then analyze the results using the MicroCal PEAQDSC program (Fig. 8).
The peak of the resulting DSC thermograms represented the melting temperature of the respective protein sample.
After completion of the experiment, clean cells as recommended by the instrument manufacturer.
Fig. 8.

(a) Differential scanning thermograms of heat-treated CD2 and GST-CD2. (b) Thermal denaturation of conventionally purified CD2
3.6. Circular Dichroism Spectroscopy
Circular dichroism (CD) spectroscopy is a very important technique in structural biology for examining the folding, structural changes, and especially secondary structures of proteins. Its usage as a quantitative/qualitative method has been based on empirical methods that use a variety of computational algorithms with reference databases composed of spectra of known protein (crystallographic) structures. These algorithms permit the determination of the secondary structure of an unknown protein. In addition, new computational and bioinformatic methods have been developed and new reference databases have been created, which greatly improve and facilitate the analyses of secondary conformation of proteins using CD spectra. CD spectrum can provide a complex fingerprint that can be compared with that of a specimen that has been well authenticated as being native and functional. This constitutes an empirical, but powerful, means of characterization.
Set up the CD spectrometer by purging the optics with nitrogen gas, turning on the coolant, and finally switching on the lamp.
Allow the machine to warm up for 15 min. Regulate the thermostat system to the 25 °C temperature.
Enter the settings in the required program for the scan.
Set wavelength. For far-UV spectra, it is usual to scan between 250 nm and 180 nm.
Set bandwidth as 10 nm.
Set averaging time or time constant, scan speed, and the number of accumulations following the instructions in the manual.
Clean and dry a 0.1 cm quartz cuvette for experimental purposes.
Fill the cuvette with buffer and place it in the cell holder.
Scan the baseline using the same cell and buffer with abovementioned same instrument settings.
Remove the buffer solution, rinse the cell with water and dry, refill the cell with the clear protein solution, and scan the sample using the same instrument settings (Figs. 9 and 10).
Fig. 9.

(a) Far UV circular dichroism spectra, (b) intrinsic fluorescence emissions spectra and (c) overlay of 2D 1H15N-HSQC spectra and (d) chemical shift perturbation plot of heat-treated and conventionally purified CD2
Fig. 10.

Far UV CD spectra of heat-treated AlbM4 and synthetic AlbM4 confirm the characteristic random coil secondary structure
3.7. Thermal Denaturation Using Intrinsic Fluorescence Spectroscopy
Set up the CD spectrometer by purging the optics with nitrogen gas, turning on the coolant, and finally switching on the lamp.
Allow the machine to warm up for 15 min. Regulate the thermostat system to the 25 °C temperature.
Enter the settings in the required program for the scan.
Set wavelength. For near-UV spectra, the scan should be from 300 to 350 nm, to cover contributions from tryptophan and tyrosine.
For far-UV spectra, it is usual to scan between 250 nm and 180 nm.
Set bandwidth as 10 nm.
Set averaging time or time constant, scan speed, and the number of accumulations following the instructions in the manual.
Clean and dry a 1.0 cm quartz cuvette for experimental purposes.
Fill the cuvette with buffer and place it in the cell holder.
Scan the baseline using the same cell and buffer with abovementioned same instrument settings.
Remove the buffer solution, rinse the cell with water and dry, refill the cell with the clear protein solution, and scan the sample using the same instrument settings (Fig. 9).
3.8. HSQC NMR Spectroscopy
For labeled peptide preparation and 2D HSQC, take 1 mL glycerol bacterial stock of the GST-tagged peptide and grow in 10 mL of LB media for 5 h at 37 °C while shaking.
Centrifuge the 15 mL tube at 4500 rpm for 10 min, discard the supernatant and wash the pellet with the NMR buffer (10 mM NaH2PO4, 5 mM MgCl2, and 25 mM NaCl, 1 mM NaN3 at pH = 5.5).
Centrifuge the mixture at 4500 rpm for 10 min.
Resuspend the pellet in 100 mL of M9 media (95.5 mM KH2PO4, 57.4 mMK2 HPO4, 63.4 mM Na2 HPO4, 13.8 mM K2 SO4, 9.35 mM NH4 Cl, 0.1 mM CaCl2, and 0.4% glucose supplemented with a vitamin solution (0.4 mg each of pantothenic acid, choline chloride, folic acid, myo-inositol, nicotinamide, pyridoxal hydrochloride, and riboflavin) and 25 mg/L thiamine).
Grow the 100 mL seed culture overnight at 37 °C and transfer the bacteria to a 2 L of M9 media the next day.
Monitor the growth and stop it at O.D of 0.75–1.0.
Harvest, purify, and confirm the identity of the proteins following the procedure outlined before.
Dialyze the pure protein in the NMR buffer and concentrate it to 0.3–0.5 mM.
Take 450 μL of the protein sample and mix it with 50 μL of D2O.
Add the sample to the NMR tube and load it into the NMR machine. HSQC experiments were performed on a Bruker Avance-500 MHz NMR spectrometer using Bruker TopSpin NMR software.
Process, visualize, and analyze the 2D HSQC spectra using TopSpin and Sparky.
4. Notes
One of the most crucial factors to be considered during cloning is the selection of the expression host(s). Escherichia coli is preferred for producing recombinant proteins due to their ease of handling, cost-effectiveness, rapid growth, and ability to express proteins at high levels.
The protein expression yields are influenced by parameters such as growth temperature, antibiotic concentration, the time at which expression is induced, and the concentration of the inducer (IPTG). These parameters require optimization.
Due to the relatively slow binding kinetics between GST and glutathione, it is important to keep the flow rate low (0.2–0.5 mL/min) during sample loading for maximum binding capacity.
The efficiency of the GSH-Sepharose matrix depends on proper maintenance and storage of the column. The most suitable solvent to store the column is 20% ethanol with 1 mM sodium azide at 4 °C.
The enzymatic cleavage step is dependent on the choice of cleavage site placed between GST and the target protein. Time and temperature optimization are required for complete cleavage.
Some crucial parameters that must be carefully considered are that the heat treatment method should be used on peptides and proteins that are thermally stable at 60 °C and do not have an elaborate structure(s), and whose heat-induced unfolding is reversible.
Proper separation of the target protein from aggregated GST tag after heat treatment requires centrifugation twice at high speed.
In general, it takes about 70 h, from overexpression to obtaining pure recombinant target protein (Table 2). For optimal yields of the pure target recombinant protein, care needs to be taken to ensure that the cleavage of the GST-fused target protein is complete.
- Proteins addressed in this book chapter:
- GST-CD2.
- GST- PBD46.
- GST-AlbM4.
- GST S100A13.
- GST-WAP.
Table 2.
Approximate time from overexpression to obtaining pure recombinant target protein
| Subprocess | Approximate time required |
|---|---|
|
| |
| Bacterial transformation | 2 h |
| Growth of transformants on plate | 12–16 h |
| Colony pickup and growth of starter culture | 12–16 h |
| Large-scale expression, induction, and harvesting | 8 h |
| Sonication, centrifugation, and protein purification | 8 h |
| Buffer exchange/desalting of the desired protein | 2 h |
| Enzymatic cleavage | 24 h |
| Heat treatment | 20 min |
| Separation of GST tag from the target protein using high-speed centrifugation | 20 min |
Acknowledgments
This work was supported by the Department of Energy (DE-FG02- 01ER15161), the National Institutes of Health/National Cancer Institute NIH/NCI (1 RO1 CA 172631) and the NIH through the COBRE program (P30 GM103450), and the Arkansas Biosciences Institute (ABI-TKSK- 2016-17). This work was also supported by the National Institute of General Medical Sciences of the National Institutes of Health under award P20GM139768 and the Arkansas Integrative Metabolic Research Center at the University of Arkansas.
References
- 1.Sharma S, Vaid S, Bhat B, et al. (2019) Thermostable enzymes for industrial biotechnology. In: Advances in enzyme technology. Elsevier, pp 469–495 [Google Scholar]
- 2.Lagassé HAD, Alexaki A, Simhadri VL, Katagiri NH et al. (2017) Recent advances in (therapeutic protein) drug development. F1000Research 6:113. [DOI] [PMC free article] [PubMed] [Google Scholar]
- 3.Mirakabad FST, Khoramgah MS, Keshavarz FK et al. (2019) Peptide dendrimers as valuable biomaterials in medical sciences. Life Sci 233:12. [DOI] [PubMed] [Google Scholar]
- 4.Fosgerau K, Hoffmann T (2015) Peptide therapeutics: current status and future directions. Drug Discov Today 20:122–128 [DOI] [PubMed] [Google Scholar]
- 5.Thomas Uhlig TK, Martinelli FG, Oppici CA et al. (2014) The emergence of peptides in the pharmaceutical business: from exploration to exploitation. EuPA Open Proteom 4:58–69 [Google Scholar]
- 6.Sachdeva S (2017) Peptides as ‘drugs’: the journey so far. Int J Pept Res Ther 23:49–60 [Google Scholar]
- 7.Dulal P (2010) Protein or peptide drugs: applications, problems and solutions. Biotech Soc Nepal (bsn) E-Bull 2 [Google Scholar]
- 8.Fossum S, Crooke E, Skarstad K (2007) Organization of sister origins and replisomes during multifork DNA replication in Escherichia coli. EMBO J 26:4514–4522 [DOI] [PMC free article] [PubMed] [Google Scholar]
- 9.Kim H, Jang JH, Kim SC et al. (2014) De novo generation of short antimicrobial peptides with enhanced stability and cell specificity. J Antimicrob Chemother 69:121–132 [DOI] [PubMed] [Google Scholar]
- 10.Ki MR, Pack SP (2020) Fusion tags to enhance heterologous protein expression. Appl Microbiol Biotechnol 104:2411–2425 [DOI] [PubMed] [Google Scholar]
- 11.Olech L (2007) Affinity tagging for protein purification. Genet Eng Biotechnol News 27:42 [Google Scholar]
- 12.Kaplan W, Husler P, Klump H et al. (1997) Conformational stability of pGEX-expressed Schistosoma japonicum glutathione S-transferase: a detoxification enzyme and fusion-protein affinity tag. Protein Sci 6:399–406 [DOI] [PMC free article] [PubMed] [Google Scholar]
- 13.Smith DB, Johnson KS (1988) Single-step purification of polypeptides expressed in Escherichia-colias fusions with glutathione S-transferase. Gene 67:31–40 [DOI] [PubMed] [Google Scholar]
- 14.Malhotra A (2009) Tagging for protein expression. In: Burgess RR, Deutscher MP (eds) Guide to protein purification, second edition, methods in enzymology, vol 463. Elsevier Academic Press Inc, San Diego, pp 239–258 [Google Scholar]
- 15.Schuenemann D, Gupta S, Persello-Cartieaux F et al. (1998) A novel signal recognition particle targets light-harvesting proteins to the thylakoid membranes. Proc Natl Acad Sci U S A 95:10312–10316 [DOI] [PMC free article] [PubMed] [Google Scholar]
- 16.Choy C, Kim SH (2010) Biological actions and interactions of Anosmin-1. In: Quinton R (ed) Kallmann syndrome and hypogonadotropic hypogonadism, frontiers of hormone research, vol 39. Karger, Basel, pp 78–93 [DOI] [PubMed] [Google Scholar]
- 17.Phillips MJ, Calero G, Chan B et al. (2008) Effector proteins exert an important influence on the signaling-active state of the small GTPase Cdc42. J Biol Chem 283:14153–14164 [DOI] [PMC free article] [PubMed] [Google Scholar]
- 18.Sakhel B, Jayanthi S, Muhoza D et al. (2021) Simplification of the purification of heat stable recombinant low molecular weight proteins and peptides from GST-fusion products. J Chromatogr B Analyt Technol Biomed Life Sci 1172:10. [DOI] [PubMed] [Google Scholar]