

Abstract
The use of single-cell RNA sequencing in clinical and translational research is limited by the challenge of identifying cell-type-specific, targetable molecular changes in individual patients, and cross-species differences. Here, we created an Integrated Single-cell Kidney Atlas including over one million cells from 140 samples, defining more than 70 conserved cell states in human and rodent models. We developed CellSpectra, a computational tool that quantifies changes in gene expression coordination across cellular functions, which we applied to kidney and lung cancer data. This tool powers our Patient-Level Single-Cell Functional Profiling Report, which highlights cell-type-specific changes in pathway gene expression coordination in individuals. Our cross-species atlas facilitates the selection of a rodent model that closely reflects the cellular and pathway-level signatures observed in patient samples, advancing the application of single-cell methodologies in clinical precision medicine. Finally, by using experimental models, we demonstrate how our informatics approach can be applied for the potential selection of suitable therapeutics.
Introduction
Kidney disease affects over 800 million people worldwide, leading to more than one million deaths annually1,2. Chronic kidney disease (CKD) arises from common conditions such as aging, diabetes and hypertension, hypoxic or toxic injury, or primary inflammatory diseases 3–5. While current disease classifications underscore the histopathological patterns of injury, they do not fully elucidate the underlying molecular changes critical for clinical decision-making6.
Advances in single-cell RNA sequencing (scRNA-seq) are particularly vital for the kidney, an organ marked by numerous functionally distinct cell types7,8. Large single cell reference atlases8–10 have improved our understanding of cell types, and animal models have been pivotal in elucidating disease mechanisms. However, their utility in precision medicine is constrained by our limited knowledge of how well they reflect patient-specific changes11,12.
Another challenge lies in leveraging single-cell atlases to identify targetable pathways in individual patients. Current analyses typically consider changes in the mean or variance of single genes, and then aggregate gene-level statistics across pathways to derive pathway-level significance13–16. These approaches are limited by the sparsity of single cell data, technical variability, and the statistical challenges of analyzing individual samples.
Here, we created a comprehensive unified kidney reference atlas, encompassing over one million cells from 140 human and rodent samples. We introduce CellSpectra, a computational framework that quantifies the coordination of gene expression in cellular functions. CellSpectra robustly identifies cell type- and pathway-level changes in individual patients and measures cross-species conservation. We demonstrate its generalizability, by performing a sample-level pathway analysis of kidney disease and lung cancer atlases. Finally, we showcase how CellSpectra’s Single-Cell Functional Profiling can lay the foundation for personalized medicine in nephrology.
Results
Conserved cell types of the healthy and diseased kidney
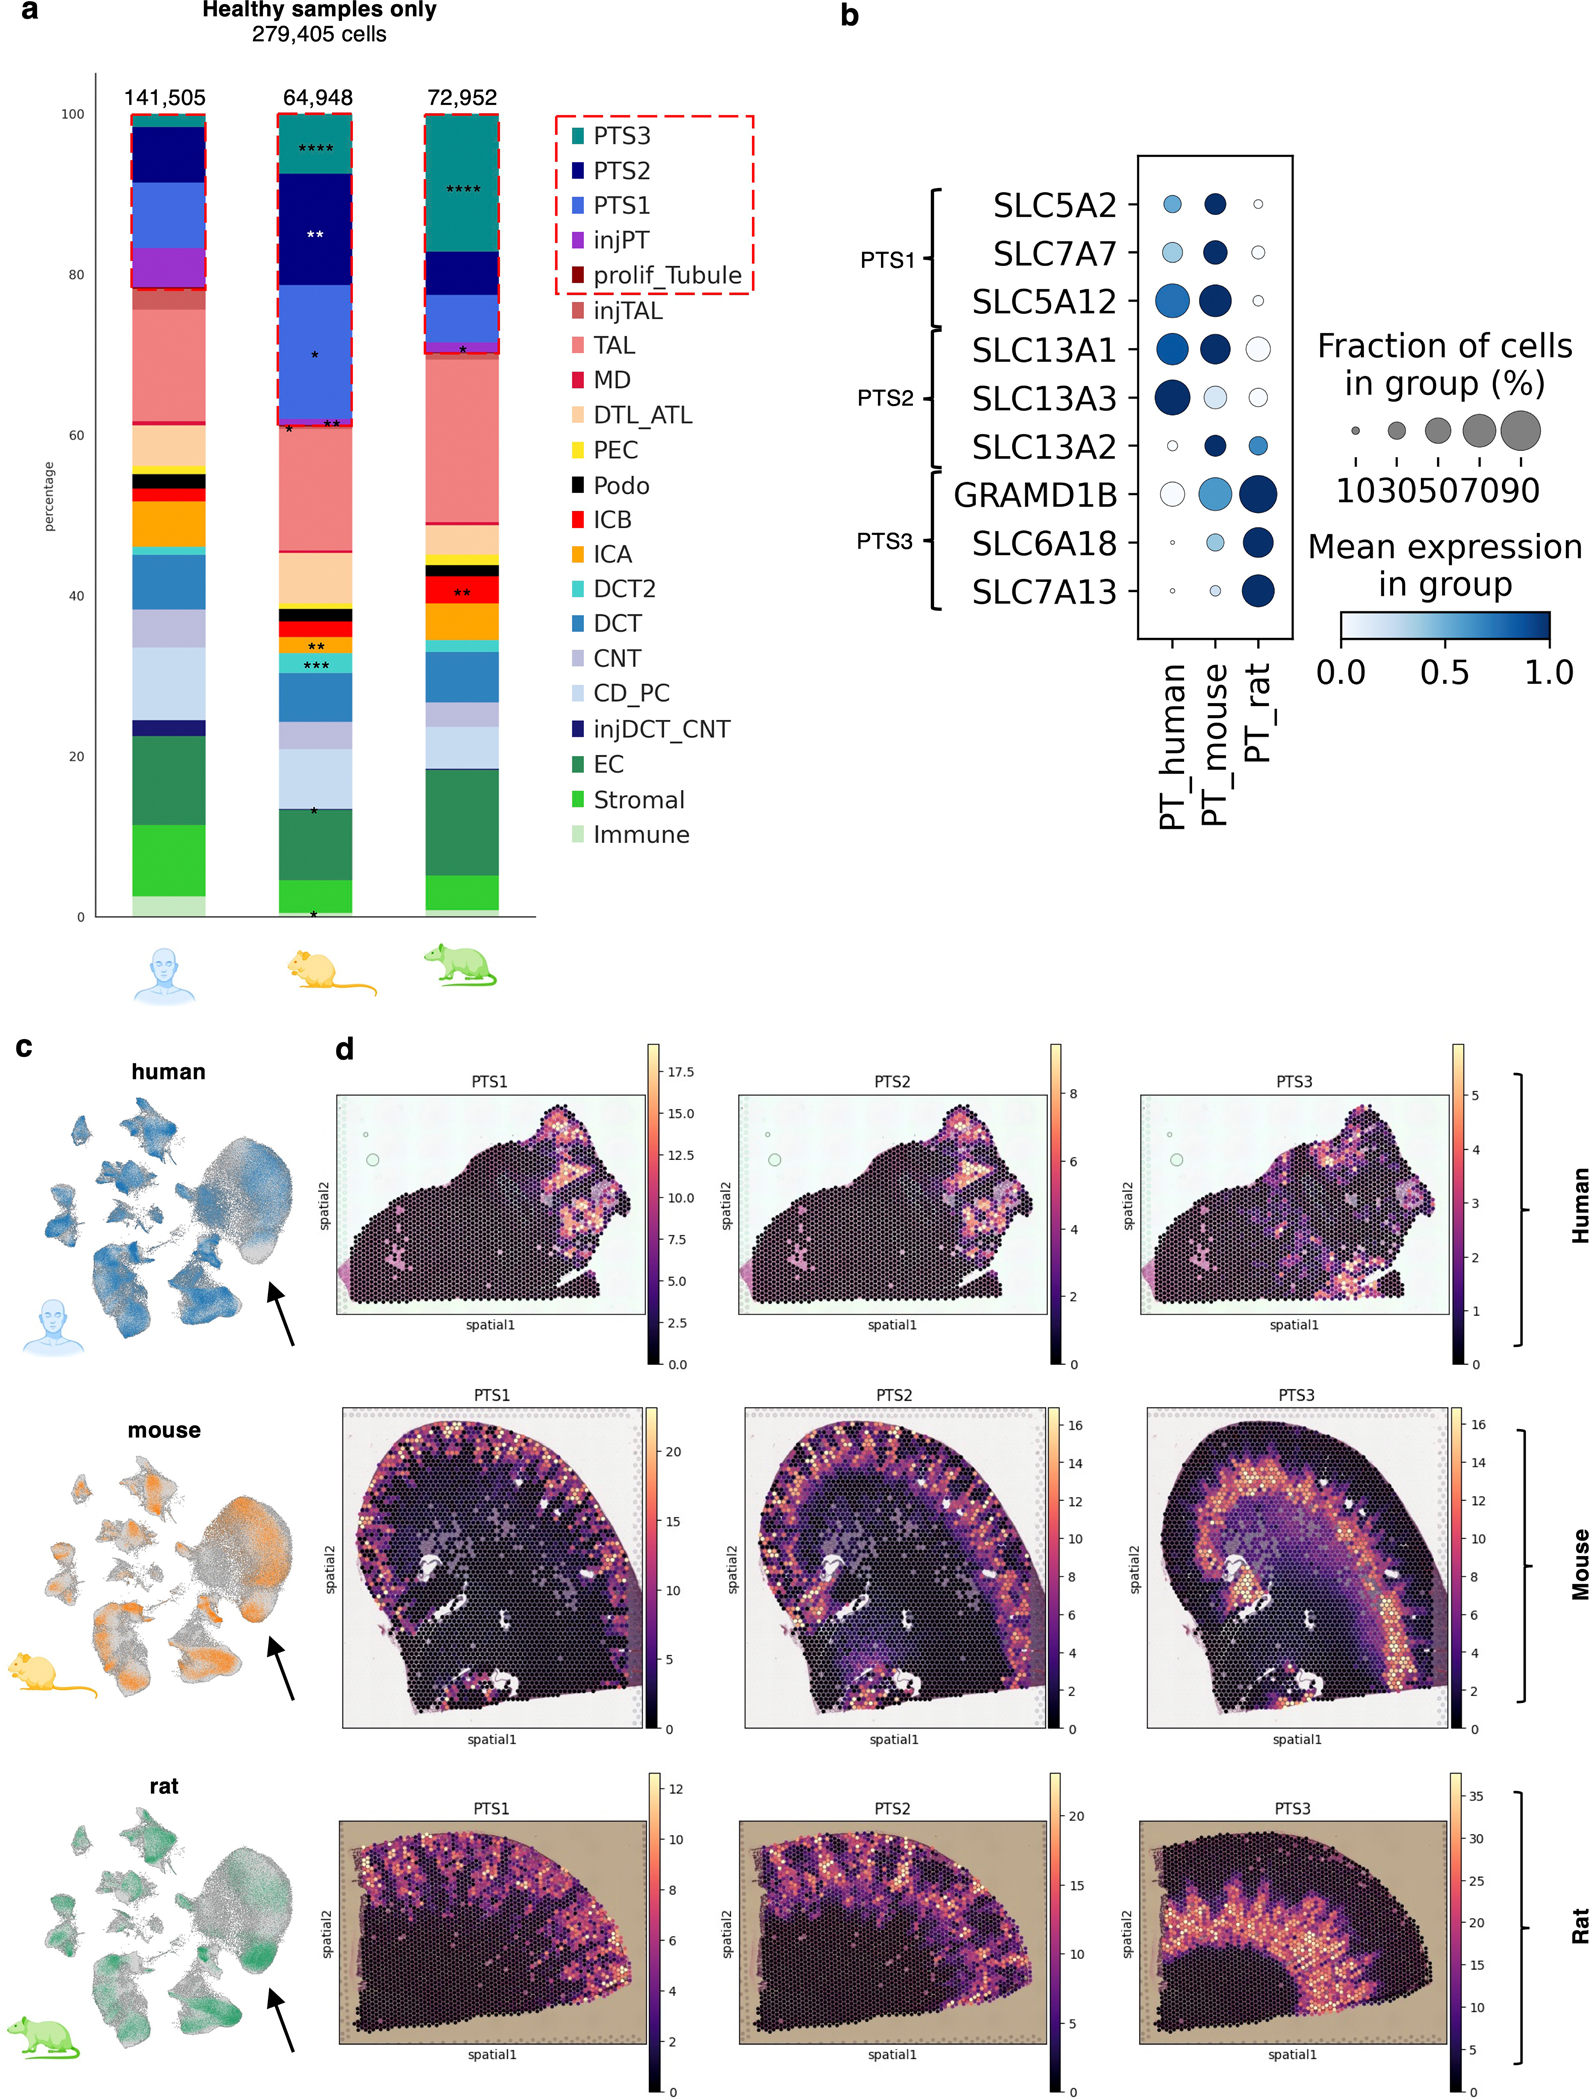
We created a reference kidney single-cell atlas from samples across three species, including human chronic kidney disease (CKD) associated with hypertension (H-CKD) or diabetes (DKD), acute kidney injury (AKI), and healthy controls8,17. In addition, we included a comprehensive collection of samples from mouse AKI and DKD models, as well as from rat DKD and H-CKD models18–21. Considering one-to-one orthologous genes, we applied a deep generative model-based integration22 to harmonize and annotate cell types across species (Fig. 1a and Methods). Ultimately, we integrated over one million cells from more than 140 samples (Extended Data Fig. 1, Supplementary Fig. 1, and Supplementary Table 1).
Figure 1: Species Integrated Single cell Kidney Atlas (SISKA 1.0).

(a) Project Overview: Single-nucleus RNA-sequencing (snRNA-seq) datasets from human, mouse, and rat kidneys, encompassing healthy and diseased conditions, were processed and integrated using scVI to build a unified atlas.
(b) Integrated UMAP and Cell Type Annotation: A UMAP embedding represents over one million integrated cells annotated into 21 major cell types across species. Each color corresponds to a specific cell type. A conceptual nephron schematic highlights the anatomical location of epithelial subtypes. Cell type abbreviations: Principal cells of the collecting duct (CD_PC), connecting tubule (CNT), distal convoluted tubule (DCT and DCT2), intercalated cells (ICA and ICB), podocytes (Podo), parietal epithelial cells (PEC), proximal tubule (PTS1, PTS2, PTS3), injured proximal tubule (injPT), proliferating tubule (prolif_Tubule), macula densa (MD), thick ascending limb (TAL), descending and ascending thin limb (DTL_ATL), immune cells, endothelial cells (EC), stromal cells, injured TAL (injTAL), and injured distal tubule (injDCT_CNT).
(c) Conserved Marker Genes Across Species: A dot plot shows conserved marker genes identified by MetaMarker. Dot size indicates the fraction of cells expressing each gene, while dot color reflects the scaled mean expression level. The Venn diagram highlights overlaps of marker genes across species, with 906 conserved across cell types (852 unique genes).
(d) High-resolution Clustering and Conserved States: Leiden clustering identifies fine-grained subclusters, with colors indicating conserved marker genes present in at least two species. This analysis highlights conserved cellular states across species.
(e) Conserved Stromal Subclusters: Examples of conserved stromal cell subclusters include pericytes expressing NOTCH3, vascular smooth muscle cells expressing MYH11, and mesangial cells/juxtaglomerular cells expressing PIEZO2. A dot plot visualizes the conserved expression of these genes across species (human, mouse, rat), with dot size and color indicating fraction and scaled mean expression, respectively. A glomerulus schematic shows the anatomical localization of these cell types.
We annotated 21 main cell clusters conserved across species, serving as the foundation of further analysis and sub-clustering (Fig. 1b, Extended Data Fig. 2, Supplementary Fig. 2). Our annotations aligned closely with those from the original studies (Supplementary Fig. 3). We identified a total of over 900 conserved marker genes with species-independent expression patterns across the 21 main clusters23, of which 852 were uniquely identified in only one cell type (Fig. 1c, Supplementary Fig. 4 and Supplementary Table 2).
These included genes such as ALDH1A2 in parietal epithelial cells (PEC), a key enzyme in retinoic acid synthesis, and FAM189A1, a lesser-known gene with neural expression24–27. Similarly, we characterized three conserved proximal tubule (PT) segments: PTS1 and PTS2, distinguished by varying expressions of SLC transporters, and the deeper medullary-lying PTS3 segment. Further, we identified cell states enriched in disease such as injured epithelial cells28 (Supplementary Fig. 5). Conserved marker genes confirmed their replicability across species and datasets (Fig. 1c, Supplementary Fig. 4). Annotation and conservation of cell types were further confirmed in an independent correlation-based approach (Extended Data Fig. 3, Methods)29. All major cell types were present in humans, mice, and rats, but cell fractions varied between species, and for example markedly fewer PTS3 cells were detected in human kidneys (Extended Data Fig. 2, Extended Data Fig. 4). Similarly, multiple genes showed expression differences across species (Supplementary Fig. 6, Supplementary Table 4).
Dimension-reduction and clustering tools with user-defined resolutions are leading to heated debates on the actual number of cell states in any given dataset30,31. We aimed to harness cross-species conservation to determine the resolution of cell type partitioning, reasoning that cell types/states observed in multiple species are more likely to be biologically meaningful. This analysis revealed nearly 80 cell states that can be distinguished by conserved marker genes across at least two species (Fig. 1d, Extended Data Fig. 5). For instance, three similar stromal subclusters were distinguished by the conserved expression of NOTCH3 (pericytes), MYH11 (vascular smooth muscle cells), and the mechanosensitive ion channel PIEZO2 involved in blood pressure regulation, expressed in mesangial cells and juxtaglomerular cells32–34 (Fig. 1e, Supplementary Table 3).
Next, to elucidate the fundamental functions of cell types, we conducted a cell-type-specific differential expression analysis utilizing Gene Ontology terms35 (DEGOs) rather than individual genes (Supplementary Fig. 7a, Supplementary Fig. 8, Methods). The top-ranked GO sets, in terms of cross-species conservation, captured the essential physiological functions of kidney cell types (Supplementary Fig. 9a). We validated this approach’s utility by using spatial transcriptomics data, confirming the spatial conservation of biological functions across rodents (Supplementary Fig. 9b)36.
In summary, we have generated a cross-species integrated single-cell kidney atlas comprising over a million cells and almost 80 conserved cell states meaningfully representing conserved cellular functions. A web tool to compare the expression of genes of interest across species and conditions is now provided on our website (www.susztaklab.com).
Estimating functional gene expression coordination
Animal models play a critical role in translational research; however it is hard to understand whether a specific rodent model effectively mimics changes observed in patients. So far, we have defined conserved cellular functions based on the consistency of the overall increase in expression of a gene or gene set in one cell type compared to that in other cell types. This definition does not make full use of the multivariate expression data as it ignores “coordination”, the nuanced co-expression pattern of genes in a cellular function.
We developed CellSpectra, a statistical approach to quantify the level of coordination of a given cellular function (e.g. GO term) within a group of independent samples (“internal coordination”) and to identify changes in “external” coordination between groups of samples. CellSpectra assumes that the relative expression between genes within a tightly regulated pathway should be constant. A high correlation between two samples indicates that the genes in this gene set follow the same pattern, whereas differences manifest as a different relative expression pattern (changes in coordination) (Fig. 2a). Moving beyond pairwise comparisons, CellSpectra is based on the fact that a high Pearson correlation between all sample pairs essentially means that the expression matrix of the sample set is well approximated by its first eigenvector (Fig. 2b, Methods).
Figure 2: CellSpectra: Exploration of single-cell atlases by estimating gene expression coordination of cellular functions across samples, conditions, and species.

(a) Simplified schematic. Gene expression coordination within a cell type is assessed using Pearson correlation. Example gene set 1 shows weak correlation (uncoordinated), while gene set 2 shows strong correlation (coordinated).
(b) Coordination within gene sets across samples is quantified using CellSpectra. Singular value decomposition (SVD) is applied to the sample expression matrix, and the first eigenvector (V1) captures maximal variance. High pairwise sample correlations indicate that V1 effectively represents the dataset’s coordination.
(c) Cross-species comparison. V1 derived from human data for a specific gene set and cell type is used as a reference. Query rodent samples are regressed onto the human V1, and R2 values quantify gene expression similarity. Density plot illustrates uncoordinated versus coordinated gene expression patterns. The y-axis represents a smoothed density estimate, reflecting the relative number of samples for each R2 value (x-axis). Matrix plots show the sample-wise scaled gene expression for two different cell types.
(d) Density (y-axis) for R2 values (x-axis) for the gene set “Regulation of glomerular filtration” comparing rodent samples to a healthy human reference. For this pathway rodent podocytes (grey) exhibit significantly higher R2 values (high similarity/coordination) compared to other cell types. R2 distributions are plotted for distal tubule cells (DCT_CNT_CD), podocytes (Podo), parietal epithelial cells (PEC), proximal tubule (PT), thick ascending limb with macula densa (TAL_MD), descending and ascending thin limb (DTL_ATL), immune cells, endothelial cells (EC), stromal cells.
(e) Heatmap of average R2 values between healthy humans (reference) and rodent samples (mouse and rat) for selected biological functions. Each row is one significant pathway (Wilcoxon rank-sum test, cell type specificity), each column is a cell type. Red indicates higher average R2 values, blue lower values.
(f) Density (y-axis) for R2 values (x-axis, coordination) for the gene set “Regulation of glomerular filtration” of rodent podocytes (grey) compared to other cell types (blue).
CellSpectra first computes a singular value decomposition on the expression matrix of the reference samples. The first eigenvector is extracted to embody the cell type-specific “internal” reference coordination pattern of the genes of the given pathway. Then, the expression vector of each individual sample in the query is regressed against this “external” reference eigenvector (Fig. 2c). A high R2 in this regression indicates that the query sample has the same coordination as the samples in the reference (Fig. 2c, Methods).
We first used CellSpectra to compare the cell type-specific coordination of healthy rodents to a healthy human reference (Fig. 2c). “Regulation of glomerular filtration”, a key podocyte function, showed high R2 distributions for rodent compared to human podocytes, but significantly lower R2 distributions when other rodent cell types were compared to their counterparts in humans (Fig. 2d). We calculated conserved cellular marker functions based on the high coordination across species in one, but not the other cell types (Fig. 2e). Notably, the identified gene sets aligned with expected cellular functions of their respective cell types, and negative controls confirmed the specificity of this approach (Fig. 2f). To obtain internal coordination within one sample set, we used the leave-one-out procedure to derive a R2 distribution for the given function and cell type. Importantly, the proportion of variance explained by the first eigenvector for most of the defined functions was well above 75% (Supplementary Fig. 10a–c)37.
In summary, we developed CellSpectra, a flexible tool for identifying consistencies and differences in coordination of gene expression within pathways across species, cell types, or conditions.
Functional coordination of rodent models and human patients
To address how well rodent models mimic cellular processes observed in human patients, we measured the coordination of rodent samples relative to a reference of human disease (Fig. 3a). We systematically compared the functional similarity between humans and rodents across GO terms in all cell types (Fig. 3b, Supplementary Fig. 12a). Certain gene sets, such as “Regulation of protein kinase C signaling” in PECs - a key mechanism in kidney diseases - showed greater similarity to humans in rats than in mice38 (Fig. 3c). Some functions showed high coordination with humans in diseased rats, but not in healthy rat controls34,39 (Fig. 3d, Supplementary Fig. 12c). Building on an analysis, that identified highly coordinated features in diseased epithelial cell types (Supplementary Fig. 11), we examined the injPT R2 distributions between various rodent models and humans (Supplementary Fig. 12d). However, no single rodent model consistently performed better than the others across all functions (Fig. 3e,f).
Figure 3: Functional similarities and differences of rodent and human kidney cells in disease states.

(a) Gene pathway similarity in cellular functions of rodents was compared to human patients (diseased reference).
(b) Box plots of the average R2 values (y-axis) of marker gene sets per sample across species (human-healthy, mouse, rat) and cell type (x-axis). Higher R2 values indicate higher coordination with the diseased human reference. For each cell type three separate box plots show R2 sample averages of healthy humans (blue), healthy and diseased mice (orange), and healthy and diseased rats (green). Values were calculated for individual samples (biological replicates) above the cell number threshold (human n = 11–20, mouse n = 42–61, rat n = 17–34 depending on the respective cell type). Box plots show the median (center line), quartiles (box limits), and whiskers, which extend to the minimum and maximum values within 1.5×IQR. Data points outside this range are plotted as outliers.
(c) Example of R2 distributions of human (blue), mouse (orange), and rat (green) samples of “Regulation of protein kinase C signaling” in PEC. The y-axis represents a smoothed density estimate, reflecting the relative number of samples for each R2 value (x-axis).
(d) Density plots of R2 distributions relative to the diseased human reference of diseased rats and rat controls for Stromal “glutamate metabolic process”. R2 distributions of rat controls are plotted in both density plots.
(e) Density plots of R2 distributions of rodent models and human controls in injPT “Positive regulation of steroid biosynthetic process”. The y-axis represents a smoothed density estimate, reflecting the relative number of samples for each R2 value (x-axis).
(f) Heatmap of average R2 values of selected functions in injPT cells across rodent models. Each column is a model: mouse FA (folic acid injury), diabetes, AKI (acute kidney injury, ischemia-reperfusion), rat DOCA (deoxycorticosterone acetate, hypertension) and rat ZSF1 (diabetes), each row is specific gene set. Yellow indicates higher R2 values.
While R2 distributions reveal interspecies coordination, CellSpectra can also identify underlying genes driving coordination changes using gene residuals from the V1 regression (Methods). For example, differences in coordination between rodents and humans in PEC “Regulation of protein kinase C signalling” were linked to higher expression in ADRA1A, and lower levels of ULK4 in rodents (Supplementary Fig. 12b). Such genes provide an intuitive understanding of the direction and nature of these changes.
In summary, CellSpectra’s ability to quantify gene expression coordination enhances the evaluation of rodent models relative to patient samples, thereby supporting the selection of appropriate models for translational studies.
Sample level coordination changes across species and disease
To investigate coordination changes of cellular functions associated with the various disease states across rodent models and human patients, we established a healthy reference from all control samples across species (Fig. 4a). We developed a statistical test to assess significant changes in pathway coordination in individual samples, reflected in a low R2 (Methods). Using the mouse AKI ischemia time course, we plotted the coordination of the “Response to ischemia” in PT cells for each individual sample over time (Fig. 4b). CellSpectra detected coordination changes at 4h and 12h after reperfusion, marked by a decrease in individual R2 values. As a control, samples from later time points or from diabetic mice, did not display significant coordination changes in this function (Fig. 4b). We repeated the analysis using KEGG pathways40 and observed consistent results, including coordination changes in KEGG HIF-1 signaling (Supplementary Fig. 13a)41. We quantified significant gene sets in PT cells for each sample (Fig. 4c, Supplementary Fig. 13b) and observed time-dependent variation in the number of affected pathways. We hypothesized that disease severity correlates with the total number of pathways impacted. Supporting this, the db/db + AAV Renin mouse model of more severe disease exhibited greater coordination changes compared to db/db mice, consistent across gene set databases19 (Fig. 4d, Supplementary Fig. 13c).
Figure 4: Gene expression changes of cellular functions at the sample level across species and disease states.

(a) CellSpectra p-values as an estimation of functional gene expression coordination changes in individual samples compared to a reference. Diseased humans and rodents were compared to a cross-species refence.
(b) Gene expression coordination changes (R2, y-axis) in PT cells in “Response to ischemia” pathway. Diabetic mice (DKD, n = 26) and mouse acute ischemia injury (AKI) samples over time were plotted (x-axis). Red dots indicate padj < 0.05, blue dots > 0.05.
(c) Boxplots showing the number of significantly changed gene sets (padj < 0.05) in PT cells, per samples over the AKI time course (n = 3 biological replicates per time point, with some having two libraries from the same sample).
(d) Radar plots: the axes represent cell types, the data points represent the number of pathways with significant coordination changes (padj < 0.05), the max scale is 1200 gene sets, left: db/db; right: db/db + Renin AAV mouse. Cell types with less than 10 cells are not included into the analysis (highlighted in red).
(e) Boxplots showing the number of significant gene sets with coordination changes (padj < 0.05) per sample in diabetic rats (DKD) and diabetic rats treated with soluble guanyl cyclase activator (sGCact) or stimulator (sGCstim) in each cell type (n = 3 biological replicates per group).
(f) Scatter plots with group comparison. Experimental groups or conditions (x-axis) including diabetic rats (DKD), treated with soluble guanyl cyclase activator (sGCact) or stimulator (sGCstim). Change in coordination as R2 (y-axis). Examples include Podocyte “SMAD protein signal transduction” and PT “Smooth muscle cell differentiation”. Dots show individual samples (n = 3 biological replicates per group), red dots indicate padj < 0.05. Bars indicate the mean R2 per group.
Statistics in (b)–(f) were obtained from the CellSpectra sample-level analysis and FDR-corrected for multiple pathway testing. Box plots in (c) and (e) show the median (center line), quartiles (box limits), and whiskers, which extend to the minimum and maximum values within 1.5×IQR. Data points outside this range are plotted as outliers.
Next, we validated CellSpectra’s ability to detect molecular changes following drug therapies (Fig. 4e). Soluble guanylate cyclase activators (sGCact) and stimulators (sGCstim) are in clinical development for DKD treatment. Notably, the pronounced podocyte gene coordination changes seen in diabetic rats (Supplementary Fig. 14a,b) were almost completely reversed with sGCact treatment, but not with sGCstim (Fig. 4e). The effect size aligned with kidney phenotype outcomes reported in the original study21. CellSpectra further revealed treatment-specific cellular function changes: for instance, podocyte “SMAD protein signal transduction” showed significant coordination disruption in untreated and sGCstim-treated rats but was restored with sGCact. Conversely, “Smooth muscle cell differentiation” in PT cells was reversed with both treatments (Fig. 4f). Importantly, rat-only and cross-species analyses showed similar results (Supplementary Fig. 14c), and replicate analyses further confirmed CellSpectra’s reproducibility (Supplementary Fig. 15).
CellSpectra identifies cellular pathways with the strongest expression changes in individual samples (Extended Data Fig. 6a), quantifies cross-species coordination, reveals disease subtype differences, and highlights sample-specific treatment effects. This integrated approach enabled the identification of pathways altered across species as well as human-specific disease changes (Extended Data Fig. 6, Supplementary Fig. 16). A comprehensive list of conserved and species-specific features is available in Supplementary Table 5.
Experimental validation of therapeutic targets
To further validate CellSpectra, we analyzed the folic acid (FA)-induced mouse kidney injury model, commonly used to study acute tubular injury followed by fibrosis. Results from biological replicates showed consistent findings. The number of significant gene sets per cell type correlated well with histological damage in proximal tubules42 (Fig. 5a,b). This alignment was consistent across references and pathway databases (Extended Data Fig. 7a,b). Results for KEGG pathways with altered coordination in proximal tubules of FA mice compared to the cross-species reference are reported in Supplementary Table 6.
Figure 5: Validation of targetable pathways in mouse kidney disease models.

(a) Experimental scheme of the folic acid (FA)-induced kidney disease model and representative PAS-stained kidney section. Representative histological image from one folic acid-treated mouse. Similar results were observed in four independent mice. Scale bar: 20 μm.
(b) Radar plots visualizing cell-type-specific coordination changes (CellSpectra, cross-species reference) in individual FA mice (biological replicates 1–3) using the KEGG pathway database. Axes represent cell types, plots scaled as noted.
(c) Heatmaps of “TNF −” and “mTOR signaling” pathway coordination (upper, R2 values, CellSpectra) and normalized enrichment scores (lower, NES, GSEA-based). Each column represents one FA mouse (FA1–4). Red indicates lower R2 (coordination changes) or higher NES; ns = not significant. Non-significant samples are assigned R2 = 1 or NES = 0.
(d) Density plots of Tsc2 and Akt3 expression (“mTOR signaling”) in PT cells of one FA mouse vs. healthy reference. The blue arrow indicates the reference gene expression distribution. Red arrow represents the individual FA mouse gene expression. Density (y-axis) and normalized gene expression of samples (x-axis).
(e) Boxplots visualizing underlying gene expression coordination changes of “TNF signaling” in PT cells of the FA-induced kidney disease model (FA, n = 4 biological replicates) or the pooled on-the-fly reference (120 randomly permuted values equally derived from n = 10 biological replicates). Normalized gene expression of individual samples (y-axis). Box plots show the median (center line), quartiles (box limits), and whiskers, which extend to the minimum and maximum values within 1.5×IQR. Data points outside this range are plotted as outliers. Vascular Cell Adhesion Molecule 1 (Vcam1), C-X-C Motif Chemokine Ligand 1 (Cxcl1), C-X-C Motif Chemokine Ligand 2 (Cxcl2), cAMP Responsive Element Binding Protein 5 (Creb5), Conserved Helix-Loop-Helix Ubiquitous Kinase (Chuk, also known as IKK-α), Baculoviral IAP Repeat Containing 3 (Birc3).
(f) Schematic of TNF pathway targeting (etanercept) followed by FA injection in mice.
(g) Blood urea nitrogen (BUN) levels (y-axis) in FA and FA plus etanercept injected animals (x-axis). N = 5 biological replicates per group. Mean (bars) +/− SEM are shown. Statistical analysis was performed using an unpaired two-tailed Student’s t-test.
Among the most frequently impacted pathways were mTOR and TNF signaling (Fig. 5c). Unlike traditional pathway analyses (e.g. GSEA)43,44, which identified few pathways with sample-level significance (Fig. 5c, Supplementary Table 6), CellSpectra detected changes in mTOR and TNF signaling across most FA samples, regardless of the reference (Extended Data Fig. 7c). While GSEA did not show significant mTOR enrichment, CellSpectra identified significant changes (Fig. 5d). Notably, gene-level contributions varied between mice, but all shared a pathway-level coordination shift, demonstrating CellSpectra’s ability to capture complex, heterogeneous expression changes that enrichment-based approaches might miss. Our results align with previous publications, which highlight mTORC1 activation in the proximal tubule of FA mice45.
To determine whether CellSpectra-derived changes in pathway gene expression are of therapeutic relevance, we further analyzed the TNF pathway. While CellSpectra does not directly predict the direction of change, coordination differences were associated with a massive upregulation of TNF-associated genes, indicating a greater potentially targetable pathway activity (Fig. 5e). Administration of the TNF inhibitor etanercept significantly improved kidney function in FA-induced kidney injury, supporting the therapeutic value of CellSpectra predictions (Fig. 5f–g).
In summary, CellSpectra identified sample level pathway changes that were undetected by GSEA. Our experimental validation of TNF pathway inhibition demonstrates how pathway-level coordination analysis by CellSpectra can inform therapeutic strategies.
CellSpectra reveals molecular cancer subtype differences
To test the applicability of CellSpectra to other diseases, we analyzed a non-small cell lung cancer (NSCLC) atlas, aiming to uncover molecular differences in patients and subtypes (Extended Data Fig. 8a)46. Analysis of malignant cells revealed marked coordination changes across many pathways, whereas non-malignant epithelial cells exhibited relatively few coordination changes (Extended Data Fig. 8b).
Understanding the molecular differences between two NSCLC subtypes - adenocarcinoma (LUAD) and squamous cell carcinoma (LUSC) - is crucial, as LUSC has worse outcomes due to its complex tumor biology47. CellSpectra identified marked coordination changes in hallmark cancer features such as “Pyrimidine Metabolism” (Extended Data Fig. 8c–e)48, which were driven by the high expression of UMPS and TK148. LUAD specific features included a MET-related pathway, reflecting the higher prevalence of MET mutations in this subtype49. In contrast, LUSC displayed frequent coordination changes in pathways such as “P53 transcriptional gene network,” (consistent with TP53 mutations in 90% of samples)50, and “Glutathione conjugation” (Extended Data Fig. 8c)51. LUSC exhibited more differentially coordinated pathways overall, consistent with its higher mutational burden (Extended Data Fig. 8d)47.
To refine subtype-specific insights, we compared LUAD and LUSC directly using early-stage LUAD as a reference. This revealed pathway coordination differences in LUSC which were undetected by GSEA (Extended Data Fig. 8f). For example, “Oxidative stress response” showed coordination changes between subtypes, driven by lower FOS and higher NFE2L2 expression, a known mutation in LUSC (Extended Data Fig. 8f–g) 47,52. Subtype differences in glucose metabolism were similarly recovered53. While “Bile acid”-related pathways showed less obvious differences between these cancer subtypes, CellSpectra identified such changes, likely related to the higher expression of AKR1C1, AKR1C2, and AKR1C3 (Supplementary Fig. 17).
In summary, CellSpectra extends beyond kidney disease, providing patient-level insights into pathway coordination changes that traditional approaches like GSEA missed.
Single-cell functional profiling of kidney disease patients
Our ultimate objective is the implementation of single-cell gene expression tools in clinical practice to identify targetable molecular changes in patient samples. To achieve this, we expanded the human data by incorporating various published and unpublished datasets 54–56. Utilizing scANVI 57, we integrated the additional data with the human core atlas and transferred cell type labels (Fig. 6a, Supplementary Fig. 18). The extended atlas includes 150 healthy and diseased samples with over 700,000 cells, including kidney biopsies from the Penn Nephrology Clinic (Extended Data Fig. 9, Supplementary Fig. 19, Supplementary Table 7).
Figure 6: Single-cell Functional Profiling Report for patient samples.

(a) Overview: Extended human kidney reference atlas. Single-cell Functional Profiling compares gene expression coordination of an individual patient to a refence. Representative results from a biopsy of a patient with IgA Nephropathy (right). Radar plots indicate the cell type (listed outside) and the number of gene sets with significant changes in coordination (padj < 0.05). Top dyscoordinated gene sets are highlighted for podocytes and proximal tubule cells. Dot color represents scaled R2 values. Dot size indicates the frequency of significant changes for the specific cellular function among all diseased samples. X-axis shows the significance of the change (−log10(padj)).
(b) Functional Profiling Report for a biopsy from a patient with hypertensive kidney disease.
(c) Underlying genes of “Sodium Ion Transport” coordination changes (DCT_CNT_CD) from the individual H-CKD biopsy. Gene expression distributions are shown in density plots (reference = blue). Smoothed density estimate (y-axis), reflecting the relative number of samples for each normalized sample gene expression value (x-axis). The red arrow indicates the respective normalized gene expression of the H-CKD biopsy query.
(d) Gene expression coordination changes of “Sodium ion transport” in DCT_CNT_CD cells in CKD samples without hypertension (HT−, n = 9), hypertension without diabetes (HT+ DM−, n = 15), and patients with hypertension and diabetes (HT+ DM+, n = 41). Coordination (R2, y-axis) with bars representing the mean. Red dots indicate padj < 0.05 for the respective sample.
(e) Gene expression coordination changes (R2, y-axis) of “TNF −” and “mTOR signaling” pathways (PT) in AKI (acute kidney injury, n = 21), CKD (chronic kidney disease, n = 69), or PKD (polycystic kidney disease, n = 7).
(f) Heatmap of coordination changes (R2 values) in the “mTOR Signaling” pathway in individual samples (rows) and cell types (columns). R2 values are plotted, darker red indicating lower values (coordination changes). Only samples with significant changes in at least one cell type are shown. Non-significant samples are assigned a R2 = 1.
Statistics in (a), (b), and (d)–(f) were obtained from the CellSpectra sample-level analysis and FDR-corrected for multiple pathway testing.
We used CellSpectra to compare over 100 patient samples with 47 healthy reference samples examining thousands of cellular functions (Fig. 6a). To visualize the results for individual samples, we developed the Single-cell Functional Profiling Report (FPR). This report first details the number of pathways with significant coordination changes by cell type, then lists the most significantly altered pathways. Dot sizes indicate the prevalence of coordination changes for each feature within the diseased population.
We highlight a biopsy sample from a patient with IgA nephropathy (Fig. 6a). This patient showed coordination changes in PT functions, a common feature among patients with CKD. The most significantly altered podocyte functions, although less frequent across diseased samples, were linked to inflammatory processes consistent with this type of glomerular disease also affecting podocytes58.
Next, we sought to identify the most frequent significant features across all diseased samples. “Vasculature Development” in PT cells showed the highest prevalence, observed in over 70% of samples (Supplementary Fig. 20a). Highly repetitive features were observed primarily in PT and TAL cells (Supplementary Fig. 20b). Supplementary Table 8 provides complete lists of such features for the GO, KEGG, and STRING databases.
To investigate whether specific pathway gene expression changes were more common in specific disease conditions, we analyzed a biopsy from a hypertensive, non-diabetic female patient diagnosed with H-CKD. This sample revealed numerous differently coordinated functions in the distal tubule segments (Fig. 6b), including “Sodium Ion Transport” in DCT_CNT_CD, a key pathway in blood pressure and sodium balance. The underlying genes (such as SCN3A, SLC23A2, SLC24A1, and SCNN1B) included several previously linked to hypertension (Fig. 6c)59,60. These findings align with current knowledge on distal sodium homeostasis and its role in hypertension61. Further analysis confirmed significant coordination changes in this pathway across various hypertensive patients but not in non-hypertensive controls (Fig. 6d). “Monoatomic Ion Transmembrane Transport” (Supplementary Fig. 20c), another top-ranking function in hypertensive patients, was driven by genes such as NEDD4L, with genetic variations associated with essential hypertension62 (Supplementary Fig. 20d).
Profiling reports of other kidney disease subtypes revealed distinct gene expression changes (Extended Data Fig. 10a). By comparing diseased subtypes (e.g., ADPKD) with other CKD forms, we identified unique differences, such as “Water Transport” in distal tubules (Extended Data Fig. 10b,c). The latter was linked to higher expression of CFTR63 and altered aquaporin levels, aligning with the efficacy of tolvaptan in ADPKD treatment (Extended Data Fig. 10d)64 . We also found sex-specific coordination changes, partly driven by Y chromosome genes such as NLGN4Y (Supplementary Fig. 21).
To connect our mouse model analysis to real-world patient data, we screened reports from 100 patients for TNF and mTOR signaling changes in proximal tubules (Fig. 6e). ADPKD samples showed the highest prevalence of coordination changes in both pathways, consistent with prior studies 65,66. Additional CKD and AKI samples also showed significant deviations, potentially highlighting targetable activity changes (Fig. 6e). With increasing availability of biologics targeting specific pathways, CellSpectra could aid in identifying patients likely to benefit from targeted therapies (Supplementary Fig. 20e). Moreover, CellSpectra not only detects pathway-specific gene expression changes, but also pinpoints the affected cell types, enabling detailed molecular comparison across patients (Fig. 6f).
In summary, we developed Single-cell Functional Profiling for individual patients, revealing cell-type and condition-specific changes in gene expression coordination, and supporting the identification of druggable targets from patient samples.
Discussion
Here we present a unique combination of a cross-species kidney single-cell atlas and a statistical tool to elucidate biological changes. SISKA 1.0 includes over one million cells, providing a comprehensive understanding of cell types, cell states, and gene expression variations 67–72. We extended the human data into a disease-centered atlas with over 700,000 cells, incorporating most single nucleus data. We showcase how SISKA adds confidence to the identification of conserved cell states and cellular functions. While it is challenging to robustly define species-specific cell types with high confidence, we applied a similar conservation-based approach across datasets.
CellSpectra enables analysis of pathway-specific changes in gene expression coordination in individual samples. This distinguishes it from traditional analysis approaches that primarily focus on the upregulation or enrichment of genes or entire pathways73–78. While some earlier tools have employed measurements of global expression variability79, gene set coordination80, gene-gene co-expression predictability81, or gene set expression similarity by correlation29,82, CellSpectra is uniquely designed to provide statistical confidence in detecting coordination changes in individual samples relative to a reference.
Rodent models help to examine the causal roles of specific genes or pathways and to test potential therapies. While certain cellular functions commonly exhibit coordination differences in disease across species, specific gene expression patterns can vary. The combination of the multispecies atlas and CellSpectra enables direct functional comparisons between models and human patients, providing a critical insight for selecting appropriate animal models to study patient-specific changes and treatments.
SISKA uses approximately 12k one-to-one orthologous genes to directly compare humans and rodents. While this gene set is sufficient for estimating functional similarities, it restricts comparisons of pathways containing many non-homologous genes. Therefore, we provide species-specific datasets with all available genes for further in-depth analyses as needed.
Statistical confidence at the individual sample level is critical, as clinical decisions must be made for each individual patient. We validated CellSpectra across various conditions and experimentally demonstrated that targeting pathways with coordination changes can improve disease phenotypes, as in the folic acid model. This highlights the potential of profiling individual biopsies from patients with complex conditions to provide clinically relevant molecular insights.
CellSpectra revealed significant differences in the coordination of ion transport-related functions in hypertensive patients, aligning with known pathophysiological mechanisms. With the rapid expansion of targeted therapies, CellSpectra might support treatment decisions across medical fields beyond nephrology. Here, we demonstrated applicability to other tissues and its potential to complement precision medicine pipelines in oncology. To support widespread adoption, we developed an open-source CellSpectra R package and provide tutorials on GitHub that guide users through its features.
With the broad collection of available analysis tools, it is important to recognize their limitations. Our approach relies on linear assumptions in SVD and regression, which may lead to missed non-linear relationships in the data. Current atlases often include only a few hundred samples, making non-linear models prone to overfitting. Linear models, though simpler, still provide actionable insights. Despite robust statistical corrections to mitigate overfitting, the multiple computational layers in our analysis make it a potential limitation. Therefore, CellSpectra generates a quality report for each analyzed query and pathway, enabling users to assess the robustness of results. It is worth noting that existing gene set databases, like Gene Ontology, were not originally designed to identify gene sets characterized by high coordination. Future development of databases based on gene expression coordination across independent samples could further refine this approach. Like other statistical methods in the single-cell field, our tool can face challenges from data sparsity, particularly in rare cell types. To address this, we implemented “on-the-fly” reference matching to reduce biases from variations in cell numbers and detection rates across samples. While we experimentally validated our approach using the folic acid model, many of our predictions in the human population require further investigation and interventional trials to demonstrate clinical benefit. Current limitations include the availability of clinical metadata, such as medication intake. As more data becomes available, we aim to define age- and sex-matched references for patients, further improving CellSpectra’s predictive accuracy and utility.
In conclusion, we demonstrate that SISKA effectively captures variations in cell type gene expression and show how CellSpectra can estimate functional similarity across species. CellSpectra introduces a robust statistical approach to data analysis, focusing on gene expression coordination, which can be applied to other tissues as well. Ultimately, our study marks a significant advance in applying single-cell tools at the patient level and has the potential to open avenues for clinical precision diagnostics and therapeutics in the future.
Methods
Ethics statement
All research presented in this manuscript complies with the ethical regulations at the University of Pennsylvania. Animal studies were approved by the Institutional Animal Care and Use Committee (IACUC) of the University of Pennsylvania. Collection of human biopsy samples was reviewed and approved by the Institutional Review Board at the University of Pennsylvania (IRB). We have obtained informed consent from all participants. Patients gave consent to be included in this observational study and to store their biosamples.
Datasets, data generation, and data processing
Processed Seurat objects of the following datasets were used: Human single-nuclei data generated by the Kidney Precision Medicine Project (Accessed Sep, 7, 2022. https://www.kpmp.org, UCSD_HuBMAP_KPMP-Biopsy_10X-R_12032021.h5Seurat) , Susztak lab human single-nuclei data17, ZSF1 rat data 21, DOCA rat data 20. Diabetic kidney disease mouse data19 (GSE184652) and mouse AKI data18 (GSE139107) were processed from raw .h5 or count matrix files and filtered based on the provided metadata. Technical replicates from the mouse AKI time course were considered as separate samples. Balancing the cell numbers across species limited the further increase of the current multispecies atlas83. Early mouse DKD treatment timepoints (day 3) were excluded and data was randomly down sampled to 300,000 cells. Unpublished data from our lab included a podocyte specific G2NA APOL1 risk allele mouse 84 and samples prepared following folic acid injection (250 mg/kg body weight in 300 mM NaHCO3). snRNA libraries were generated using the Chromium Next GEM Single Cell 3’ platform (10X Genomics) following the manufacturer’s instructions. The final quality of the library was checked on an Agilent Bioanalyzer High Sensitivity DNA chip. Initial data processing included Cell Ranger (v6.0.1), DoubletFinder (v2.0) 85, and SoupX (v1.5) 86. More details regarding samples and the analysis pipeline are provided in Supplementary Table 1.
Integration of the multi-species atlas
Integration was based on one-to-one orthologous genes69 created from the Ensembl website87. Seurat objects were converted to anndata objects using sceasy (v0.0.7)88 prior to further processing in Scanpy (v1.9)89. Objects were concatenated (“inner”) to a single object after harmonizing relevant metadata information. The final object contained over 12,000 one-to-one orthologous genes represented in all 7 datasets. While the processed objects were already cleaned in the original publications, we applied a common cut-off for quality parameters (mitochondrial genes < 15%; nCounts/nFeatures > 300). Species information was used as a batch key for variable gene selection. The concatenated object was integrated in scVI22 considering 3000 highly variable genes. scVI hyperparameters were optimized in an iterative approach in combination with meticulous data cleaning. Low quality clusters were removed based on enrichment for mitochondrial and ribosomal genes or generally low count / feature numbers while missing expression of informative marker genes. Remaining doublets or ambient contaminated clusters were removed by iterative subclustering focusing on cells with marker expression related to highly abundant cell types (PT, TAL, etc.) when conflicting with the entitled cell type labels. scVI parameters were optimized to achieve optimal species and sample mixing while containing the known biological cellular architecture of the kidney, distinguishing rare cell types (PECs, immune and endothelial subclusters, etc.) while preserving conserved marker gene expression in all species consistent with the literature for these cell types. Best performing scVI hyperparameters used in the last integration (scVI v0.19.0) showed an elbo validation metric of 798.321:
Dimension reduction and cell type annotation was performed in Scanpy (v1.9). Neighbors were computed on n_pcs=30 of X_scVI and default settings. We used the Leiden algorithm90 of varying resolutions to annotate the main cell types of the kidney based on previous literature and expert opinions of marker genes. Fine-resolution cell states were defined with a Leiden resolution of 8.0 containing more than 10 cells.
CellSpectra
CellSpectra quantifies the degree to which the gene expression pattern coordination of a pathway or function (gene set) in a given cell type is preserved across samples, conditions, or species.
Basic Model and Procedure.
CellSpectra can be applied for any chosen cell type and pathway. For now, let’s assume that the pathway and cell type are given. Assume first that there are two groups of samples, which we call the reference group and the query group. Let be the number of samples in the reference group and be the number of samples in the query group. For each sample, we follow the pre-processing procedures described below to obtain a sample-by-gene pseudobulk expression matrix for the given cell type and pathway. Let be the mean gene expression matrix for the reference, and let be the mean gene expression matrix for the query. CellSpectra is based on the intuition that, if sample in the first group and sample in the second group are similar in their coordination of the given pathway in the given cell type, then the pairwise correlation between and should be high. Note that, by measuring correlation across genes instead of differential expression of single genes, we are measuring expression coordination and not directly comparing the absolute gene expressions.
To quantify pathway-level coordination across more than two samples, we rely on the intuition that high Pearson correlation between all pairs of a set of samples essentially means that is well approximated by the linear decomposition,
| (1) |
where is “small”. Thus, CellSpectra first uses the reference sample group to identify , the main axis of coordination between the genes in the pathway, by performing an SVD: , where is the sample encoding matrix, and is the gene loading matrix. Then, we let , the first SVD component, i.e. the first column of . In effect, the vector can be interpreted as an eigensample – the gene expression vector for this pathway of the estimated prototypical sample represented the reference group. We are regressing other samples against this eigensample. This eigensample is taken as the first column of the gene loading matrix.
With estimated from the reference samples, we can then use it to assess whether the coordination level of the pathway has changed for sample(s) in the query. For this, we perform linear regression of for each sample in the query, against . The value of this regression is a measure of similarity in the coordination of the given pathway in the given cell type in this query sample, as compared to the reference. To assess significance, we would compare the value against the values derived from a regression of each sample in the reference against ; a high would indicate preservation of coordination. However, we can not directly compare the from the query to those derived from the reference, as itself was estimated from the reference, and we would be double-dipping. In other words, because was estimated based on , we expect its correlation with each to be much higher than with an unseen sample. To remedy this, we use a leave-one-out scheme to obtain a baseline distribution of from the reference which is comparable to those in the query: For , fit SVD on the matrix with row removed to obtain , and regress on to get . Even though each is obtained from an SVD over samples instead of the original samples, for large we expect that the distribution of to be a good approximation to what we expect to be the distribution of query , if the query has the same coordination patterns as the reference.
Quantifying the loss of coordination for one sample.
A low value of in the regression for a given query sample against , as compared to the reference distribution of , indicates a loss of coordination in sample . How large of a decrease would give us statistical significance? The reference distribution of is approximated using a collection of numbers, derived from the leave-one-out procedure described above. This only gives p-values at the granularity of , which, with the sample size of current single cell atlases, is too coarse for the significance evaluations that are needed under multiple testing (e.g. in our data there are hundreds of pathways and tens of cell types, and thus p-values need to be less than 105 to be significant after Bonferroni correction). Thus, we develop a parametric method for significance assessment of loss of coordination. We go back to model (1) and add the assumption that . The gene-specific variances capture both technical noise and biological factors, i.e. some genes have higher technical noise, and some genes have higher biological noise (less tightly regulated). The parameters are unknown, and thus we estimate them from the reference sample set: Let , where is the fitted value of made using the leave-one-out estimate . Then, . Then, for the query sample, we compute a Chi-square statistic by summing the squared residuals, each standardized by :
where is the fitted value obtained by regressing on . Under the null hypothesis that also follows model (1) with the same values as , we expect to follow a Chi-square distribution with degrees of freedom.
In practice, to ensure robustness, we capped the contribution of each gene to the Chi-square statistic to a predetermined maximum value (CHISQ.MAX = 4). This precaution was taken to mitigate the effect of outliers or extremely variable genes on the overall statistic. This makes the test using the Chi-square null distribution slightly more conservative, which we are willing to accept in practice.
Data subsampling to account for unbalanced cell numbers.
The number of differently coordinated gene sets of an individual sample can be inflated by capture rate or cell numbers that differ substantially from the reference, as the technical noise variation in the pseudobulk gene expression estimate is directly inversely related to the cell count. We control for this technical factor by subsampling the cells in the reference data set to be comparable to that in the query. Starting from single-cells and raw counts, the reference was redefined for every query sample by randomly sampling cells from each reference sample, until the total counts were approximately the total counts of the query pseudocell. To make this approach more robust to random variation, we created 3 pseudo replicates per reference sample with this approach. The overall performance of CellSpectra was significantly improved as rare cell types in samples with low cell numbers didn’t trend towards inflated numbers of dysregulated gene sets anymore.
Preprocessing.
While this approach is flexible regarding shape and preprocessing of the input data, we recommend pseudobulking single-cell RNA-seq raw counts for each cell type to obtain a cell type-specific matrix of samples and genes. Samples with less than 10 cells of a cell type were not included in the respective pseudobulk matrix or any CellSpectra analysis. We performed CellSpectra after count normalizing and log transformation. However, scaling of genes can be appropriate. In our case, conserved marker gene sets were similar independently of the optional scaling, while log transformation preserves the expression quantity of individual genes. Gene sets of any multi-species analysis were based on the modified Gene Ontology database used for the DEGO calculation (described above) or the human KEGG database (accessed via the R package KEGGREST as implemented in our process_gene_sets_from_KEGG() function). Analysis on the human extended atlas was based on GO_Biological_Process_2023 downloaded from the enrichR website 91, the KEGG database as before, or a customized STRING database downloaded from the STRING website (9606.clusters.proteins.v12.0)92. For any comparison of queries to a reference and any analysis resulting in individual p-values, we implemented the ‘on the fly’ version starting from a Seurat object input instead of a pseudobulk matrix (see Data subsampling to account for unbalanced cell numbers).
Within cell type / condition coordination.
Analysis estimating the gene expression similarity within cell types or conditions can be performed in a leave-one-out approach. V1 was defined by all samples within a condition minus one. The left-out sample was regressed on V1. This was repeated for all samples within a condition or cell type to get a R2 similarity distribution. To define conserved cellular functions, leave-one-out R2 distributions were calculated for every gene set within every cell type across species. To define marker gene sets and conserved cellular functions of a cell type, a Wilcoxon rank-sum test was used followed by FDR-correction for multiple testing. Padj < 0.05 was considered as significant. For the comparison of healthy versus injured PT cells, leave-one-out distributions within pan PT cells of healthy samples and injured PT cells of diseased samples were compared. To define coordinated functions in human injured epithelial subtypes, R2 distributions were calculated within all injured epithelial cell types (mixed cell types). To ensure robust results, these were compared to pooled R2 distributions derived from comparisons within healthy counterparts (identical cell types).
Human and rodent comparison.
V1 was defined from a human healthy or diseased “on the fly” reference. To compare average R2 values of sample-pseudo cell types only the top 50 coordination-based marker gene sets (padj < 0.05) with highest R2 leave-one-out averages across species were considered. Average R2 values per cell type and sample were plotted. A Wilcoxon rank-sum test was used for all statistical testing, with FDR-correction applied as appropriate.
Single-sample p-value.
We introduced a statistical approach to assess the deviation of diseased samples from a reference at the gene expression level (see Quantifying the loss of coordination for one sample). These p-values represent the probability of observing a chi-square statistic as extreme as, or more extreme than, the one calculated, under the null hypothesis that the diseased sample’s gene expression does not deviate from the reference. We considered padj < 0.05 as significant. Gene set coordination changes with differences in the prevalence between conditions were selected based on a Fisher’s Exact Test. Derived p-values were used to rank top candidates of different prevalence.
Estimation of underlying genes.
Underlying genes were defined as the genes with the highest or lowest values before squaring the residuals normalized by the reference residual distribution (see Quantifying the loss of coordination for one sample). A rank of underlying genes can be derived from the report_genes() function in our CellSpectra R package. Visualization of underlying genes was shown relative to the “on the fly” reference of the respective query sample. In cases of visualizing the reference relative to several query samples, boxplots show the gene expression distribution of the pooled “on-the-fly” references.
Filtering of low expressed genes.
Depending on the capture rate of the query the gene expression matrix after pseudobulking can contain many genes with zero or close to zero expression. In some cases, high number of such genes in a pathway can be problematic and inflate the estimated p-value. This is especially relevant when estimating underlying genes. Thus, we used CellSpectra’s filtering mode (“threshold” = 0) when extracting underlying genes. Analysis on the cancer data and KEGG pathways was also performed in the filtered mode as indicated. Since filtering genes can result in differences in total pathway numbers across samples, we report the percentage of significant pathways instead of total numbers.
Query Quality Report.
We provide a quality report summarizing relevant statistics of the leave-one-out reference estimation. This report is generated for each query analysis, since the reference capturing depth is dependent on the query cell number. Higher cell numbers and deeper capturing rates will result in better estimations of V1 and more statistical power. Users can check the estimation quality of V1 by examining the average and median LOO R2, the R2 standard deviation, and the variance explained by V1.
Human kidney biopsy samples (extended human atlas)
New generated human data was based on biopsy samples in a biobank from an observational cohort. No interventions were part of this investigation. Nuclei were extracted using a lysis buffer composed of Tris-HCl, NaCl, MgCl2, 10% NP40, and an RNAse inhibitor (40 U/ul). Frozen biopsy tissue weighing 1–3 mg was finely chopped into 1–2 mm segments using a razor blade in 500 μl of the lysis buffer. This minced tissue was then placed into a gentleMACS C tube and homogenized with 1 ml of lysis buffer in a gentleMACS homogenizer using the Multi_E_01 and Multi_E_02 programs for 30 seconds. The homogenate was then passed through a 40 μm strainer (08–771-1, Fisher Scientific) and the strainer was rinsed with 2 ml of wash buffer (PBS 1X + 10% BSA (50 mg/ml) + RNAse inhibitor (40 U/ul)). The nuclei were spun down at 500×g for 5 minutes at 4°C, and the resulting pellet was re-suspended in wash buffer and filtered again through a 40 μm Flowmi cell strainer (BAH136800040–50EA, Sigma Aldrich). The quality of the nuclei was assessed, and their number was counted. Following the manufacturer’s instructions, 10,000 to 30,000 cells (varied per sample) were loaded into the Chromium Controller (10X Genomics, PN-120223) using a Chromium Next GEM chip G Single Cell Kit (10X Genomics, PN-1000120) to create single-cell gel beads in an emulsion. The Chromium Next GEM Single Cell 3′ GEM Kit v3.1 (10X Genomics, PN-1000121) and the Single Index Kit T Set A (10X Genomics, PN-120262) were used as per the manufacturer’s guidance for synthesizing cDNA and preparing the library. The libraries underwent quality control with the Agilent Bioanalyzer High Sensitivity DNA kit (Agilent Technologies, 5067–4626) and were sequenced on the Illumina Novaseq 6000 system using 2 × 150 paired-end kits. The sequencing data were sorted with a 28 bp Read1 for cell barcode and UMI, an 8 bp I7 index for sample indexing, and a 91 bp Read2 for transcript identification.
Human Atlas extension
Reference “core” atlases were generated for human, mouse, and rat. These included original genes, but cell type labels were derived from our multi-species atlas, thereby harmonizing them across the three single-species reference atlases. We extended the human core atlas with various additional samples and datasets. Data sources and pipeline information are summarized in Supplementary Table 7 8,54–56. The additional KPMP data was accessed Nov, 15, 2023 (https://www.kpmp.org). Processing pipelines included SoupX (v1.5)86 and DoubletFinder (v2.0)85 for new generated data. Overlapping samples between datasets were only included once. QC parameter cut-offs were initially harmonized to nCount_RNA < 20000, nFeature_RNA < 5000, nFeature_RNA > 200, percent_mt < 15. As before, an iterative integration and data cleaning approach was applied including removal of low quality, doublet, or ambient clusters. Initial integration, HVG selection, and dimension reduction was performed in a modified pipeline of our multi-species integration. After initial integration and cleaning, we used scANVI (v1.0.4)57 for supervised integration and cell type label transfer from our human core atlas:
Functional Profiling Report.
Shown reports are based on CellSpectra comparisons of individual diseased samples to the human ‘healthy’ reference. Cellular functions with significant coordination differences (padj < 0.05) were counted for each cell type and visualized in a radar plot. Cell types below the cell number threshold for the individual sample are highlighted in red. Dot plots show the top gene sets with significant coordination changes of selected cell types based on the −log(padj). R2 values in this context cannot be intuitively compared, as some gene sets exhibit very different R2 distributions compared to others. Therefore, we applied MinMaxScaling() from 0 to 1 to the R2 values of each cellular function, based on all diseased samples in the extended atlas within the same cellular function. Dot sizes reflect the rarity or commonality of dysregulation, termed ‘Prevalence of coordination changes’. This prevalence considers the total number of samples that exceed the cell number cut-off for the respective cell type.
GSEA-based sample level analysis
We calculated z-scores for each gene in the query based on the expression distribution of the respective “on the fly” reference. Genes for each query were ranked based on these z-scores. We used the R package fgsea (V1.30.0) 93 in default settings on the exact same gene set databases used for the respective CellSpectra analysis to identify significant pathways from the ranked query gene list. Gene number thresholds were set to 10 and 200 to match the respective CellSpectra analysis. Enrichment scores (NES) or R2 values were set to NES = 0 or R2 = 1 for non-significant samples (padj > 0.05) or for samples excluded from the analysis (e.g. cell numbers threshold) in all heatmaps visualizing coordination changes of individual samples.
Experimental validation of etanercept
All experiments were performed in male 6–8 week old C57BL/6 mice. Following folic acid injection (250 mg/kg body weight in 300 mM NaHCO3), mice were treated with etanercept (7mg/kg, i.p.), or vehicle. Treatments were repeated to a total of 2 (etanercept) injections. Mice were sacrificed 7 days after disease induction. Blood urea nitrogen (BUN) levels were measured using the Pointe Scientific BUN Reagent Kit (Ref B7552–150).
Supplementary Methods
Additional information regarding the MetaMarker23 and MetaNeighbor analysis82,29, differential expression analysis between species, differentially expressed gene sets35,36,73,94, Cell2location36,95, and the NSCLC analysis44,46,96, can be found in the Supplementary information.
Statistics and reproducibility
Details on how the statistical analyses were conducted are provided in Methods with multiple testing correction where applicable. snRNA-seq sample size was limited by the availability of data. No statistical method was used to predetermine sample size. The experiments were not randomized, and the investigators were not blinded. Some samples and cells were excluded based on quality control criteria. Further criteria for excluding cells, genes, and datasets are detailed in Methods. Robustness of results was ensured through validation across multiple independent datasets. Validation experiments were performed once with biological replicates.
Extended Data
Extended Data Figure 1: Data summary of the multi-species kidney atlas (SISKA1.0) after QC.

Table displays sample and cell numbers included in our unified kidney atlas (SISKA1.0) from control and diseased samples across species. The parenthesis indicates the number of individual samples. Respective disease states and rodent models are summarized in the “Diseases and Models” column.
Chronic kidney disease (CKD), Acute kidney injury (AKI), Ischemia reperfusion injury (IRI) mouse model, Diabetic kidney disease (DKD), Folic acid mouse model (FA), Zucker fatty and spontaneously hypertensive (ZSF1) rat model of diabetes, deoxycorticosterone acetate (DOCA) rat model of hypertension, Hypertension associated kidney disease (H-CKD).
Extended Data Figure 2: Relative frequencies of species across cell types in SISKA1.0.

(a) UMAP of the integrated multi-species atlas (SISKA1.0) colored by species human (blue), mouse (orange), and rat (green).
(b) UMAP of the integrated multi-species atlas colored based on the input datasets.
(c) UMAP of the integrated multi-species atlas individually colored by species human (blue), mouse (orange), and rat (green).
(d) Bar graphs of the cell type compositions of each cluster (x-axis) across species (rat, human, mouse from top to bottom) for the 21 major annotated cell types. The y-axis is the percent of cells within each cluster (each normalized to 100%)
(e) Bar graphs of the cell type compositions (x-axis) across input datasets for the 21 major annotated cell types. The y-axis is the percent of cells within each cluster (each normalized to 100%) The color legend corresponds to datasets in panel b.
Extended Data Figure 3: MetaNeighbor-based cell type similarity analysis across species and datasets.

The x and y axis plots the cell types across 7 processed datasets in an unsupervised dendrogram. The color indicates the mean area under the receiver operator characteristic curve (AUROC) of cell types. Red indicates higher AUROC, while blue indicates a lower AUROC.
Extended Data Figure 4: Differences in the proximal tubule composition of human and rodent datasets.
(a) Cell type fractions of the healthy human (n = 20), mouse (n = 10), and rat (n = 8) kidney data. Asterisks indicating significant differences. PT subtypes are highlighted in red boxes. Two-sided Student t-test between human and rodent percentages per sample. * p < 0.05, ** p < 0.01, *** p < 0.001, **** p < 0.0001.
(b) Dot plot of PT subsegment marker genes within the human, mouse, and rat PT clusters. Dot colors indicate the scaled mean expression per cell type, the size of the dot indicates the percentage of cells expressing the respective gene.
(c) Feature plots of healthy human, mice, and rat cells within SISKA 1.0. Arrows point towards the PTS3 segment.
(d) Cell2location cell type abundance analysis on Visium spatial transcriptomics data of human, mouse, and rat (yellow indicates a higher estimated abundance). Plots are shown for the estimated PTS1, PTS2, and PTS3 abundance.
Extended Data Figure 5: Conserved cell types and states in our integrated kidney atlas (SISKA 1.0).

Fine resolution (126) clusters of SISKA1.0 ordered in a hierarchical dendrogram. The cell types with multispecies conserved gene expression are labelled in green while those without are labelled black. Columns visualize the composition of each cluster based on additional metadata information: Disease state (blue disease, pink healthy), species (mouse, rat and human), sex (human only, male orange, female purple), sample identity, KPMP annotation (KPMP only), global annotation. The right UMAP is colored by cell type labels.
Principal cells of the collecting duct (CD_PC), connective tubule (CNT), distal convoluted tubule (DCT and DCT2), intercalated cells (ICA and ICB), podocytes (Podo), parietal epithelial cells (PEC), proximal tubule (PTS1, PTS2, PTS3), injured proximal tubule (injPT), proliferating tubule (prolif_Tubule), macula densa (MD), thick ascending limb (TAL), descending and ascending thin limb (DTL_ATL), immune cells, endothelial cells (EC), stromal cells, injured TAL, and thick ascending and distal injured tubule (injTAL and injDCT_CNT).
Extended Data Figure 6: Hallmark features of frequent coordination changes across species.

(a) Top significant cellular functions identified in diabetic kidney disease (DKD) and hypertensive chronic kidney disease (H-CKD) rat models. The x-axis shows −log10(padj) values for top-ranked functions, with each bar color-coded by cell type. Functions in the DKD model were predominantly associated with podocytes, while those in the H-CKD model were linked to TAL cells, including “ligand-gated cation channel activity” and inflammation-related gene sets.
(b) Frequently significant cellular functions (padj < 0.05 in at least 10% of samples across any species) were defined as conserved hallmark features. A pie chart displays the cell type distribution of these 595 hallmark features, with TAL and PT cells accounting for the majority.
(c) Bar plot illustrating the dyscoordination prevalence of hallmark functions (percentage of significant samples) for human (blue), mouse (orange), and rat (green) samples. Functions such as “Positive regulation of signaling receptor activity” and “Collagen catabolic process” were frequently dyscoordinated across species.
(d) R2 values and significance of coordination changes for selected hallmark features. Scatter plots show individual sample R2 values (y-axis) grouped by condition (x-axis) for TAL (“Positive regulation of signaling receptor activity”) and PT (“Collagen catabolic process”). Blue dots represent non-significant samples (padj > 0.05), while red dots indicate significant coordination changes (padj < 0.05). Separate panels are shown for human, mouse, and rat samples, emphasizing cross-species differences in hallmark functions.
Extended Data Figure 7: CellSpectra analysis of folic acid (FA) mouse models reveals consistent cell type involvement and pathway enrichment.

(a) Radar plots display the percentage of significant gene sets per cell type for individual FA mice using the cross-species atlas. The radar plots highlight analysis results for different databases (KEGG, Gene Ontology) and indicate cell types such as PT, TAL, and Podo on the axes.
(b) Similar radar plots are shown for mouse-specific data (mouse-only references), emphasizing cell type-specific coordination changes comparable to the cross-species analysis.
(c) Heatmaps compare GSEA-based (upper panel) and CellSpectra-based (lower panel) analyses for the KEGG pathways “mTOR Signaling” and “TNF Signaling.” Enrichment scores (NES) were set to 0 and R2 values to 1 for non-significant samples (padj > 0.05). Columns represent FA samples (FA1–FA4), while rows correspond to pathways. Color scales reflect NES (upper) and R2 (lower) values. These analyses demonstrate consistency in cell type involvement and pathway enrichment, highlighting the effectiveness of CellSpectra in identifying key pathways in FA-induced kidney injury.
Extended Data Figure 8: CellSpectra analysis of a lung cancer single-cell atlas.

(a) Non-small cell lung cancer (NSCLC) single-cell atlas: adenocarcinoma (LUAD) and squamous cell carcinoma (LUSC) and non-tumor tissue was analyzed.
(b) The percentage of pathways (y-axis) showing significant coordination changes in epithelial cells and cancer cells (x-axis) in total of 45 cancer samples (n = 43 for epithelial cells). Non-tumor tissue epithelial cells were used as the reference.
(c) Heatmap of gene coordination changes (R2 values) in MSigDB C2 pathways in individual cases (cancer cells compared to a non-tumor epithelial reference). Red indicates lower R2 values (dyscoordination). Samples with padj > 0.05 or those below the cell/gene number threshold are left white. LUSC, n = 6. LUAD, n = 30.
(d) Percentage of pathways (y-axis) showing significant coordination changes in LUAD and LUSC samples (x-axis). Cancer cells were compared to a non-tumor epithelial reference. LUSC, n = 6. LUAD, n = 30.
(e) Density plots of gene expression in selected genes from “Pyrimidine Metabolism” (UMPS, TK1) and “Glutathione Conjugation” (GSTM3, GGT5) in two cancer samples. Blue = “on-the-fly” reference distribution; red arrow = query sample. Y-axis = density estimate; x-axis = gene expression. Lower R2 and higher NES in red.
(f) Heatmap of gene coordination changes (R2) in LUAD Stage II–IV (n = 15) and LUSC (n = 6) compared to LUAD Stage I reference. Red = lower R2 or higher NES. GSEA results shown on the right. Samples with padj > 0.05 or insufficient data are white.
(g) Density plot of gene expression distributions for FOS and NFE2L2 (“Oxidative Stress Response”) in a LUSC sample (red arrow) and the LUAD I reference distribution (blue line). Density (y-axis) and the normalized sample gene expression (x-axis) are shown.
(h) Boxplots of normalized sample FOS and NFE2L2 gene expression (y-axis) in all LUSC samples (red, n = 6) and the pooled LUAD I reference (blue, 288 randomly permuted values equally derived from n = 16 biological replicates).
All Boxplots show the median (center line), quartiles (box limits), and whiskers, which extend to the minimum and maximum values within 1.5×IQR. Data points outside this range are plotted as outliers.
Extended Data Figure 9: Sample number and disease summary of the extended human kidney atlas.

Table summarizing the input data of the extended human atlas. Number of samples for 5 different diseases or groups (Controls, CKD, AKI, CKD-ADPKD, and Penn Medicine biopsy samples) and the respective datasets. Subgroups are shown for CKD and Penn Medicine biopsies. The right column indicates numbers of female and male patients per disease / condition.
Extended Data Figure 10: CellSpectra functional profiling of ADPKD samples.

(a) Single-cell functional profiling report of a patient with diagnoses ADPKD (autosomal dominant polycystic kidney disease). The radar plot indicates the total number of significant pathways (padj < 0.05) per cell type (circles). Cell types below the cell number threshold are highlighted in red. Top significant gene sets based on the −log10(p-value) are highlighted for selected cell types (right panel). Color of the dot indicates the severity of coordination changes based on the R2 values (scaled for each gene set across all diseased samples). Size of the dot indicates the frequency of significant coordination changes for this specific cellular function among all diseased samples above the cell number cut-off.
(b) Diseased-reference analysis overview. 8 ADPKD samples were compared to a CKD reference. Highly repetitive (prevalence > 75%; total of 185 features) cellular functions were enriched in PT cells, visualized in a pie chart (lower panel).
(c) Two cellular functions identified in the CKD-reference analysis are shown in the healthy-reference setting. Dots show individual samples, with R2 indicated on the y-axis. The x-axis groups individual samples into groups (CKD and ADPKD, PT: n = 68 and n = 7; DCT_CNT_CD: n = 72 and n = 8). The y-axis represents the R2 value, while red dots indicate padj < 0.05. Bars display the mean R2 per group.
(d) Boxplots visualizing the normalized sample gene expression of underlying genes (y-axis) for the non-PKD reference (orange) and the PKD query samples (red, n = 8). Reference expression was pooled from the “on the fly” references of all query samples (2,232 perturbated values equally derived from n = 93 patients). All boxplots show the median (center line), quartiles (box limits), and whiskers, which extend to the minimum and maximum values within 1.5×IQR. Data points outside this range are plotted as outliers.
Supplementary Material
Acknowledgements
Work in the Susztak lab is supported by the NIH (2R01DK076077–15, 5R01DK087635–15, 5P50DK114786–07, 5R01DK105821–08, 5R01DK132630–02). The authors thank the Translation Genetics In Renal Medicine (TIGER) grant from the University of Pennsylvania. NRZ received grants from the NIH (1R56AG081351) and the National Science Foundation DMS/NIGMS (Grant #2245575). KAK was supported by the MOLMED PhD program of the Medical University of Graz, a Marietta-Blau Grant (Österreichischer Austauschdienst, OeAD GmbH), and an Austrian Marshall Plan Foundation scholarship. MSB was supported by grants from German Research Foundation (Deutsche Forschungsgemeinschaft, DFG, BA 6205/2–1), Else Kröner-Fresenius Foundation, and the Berlin Institute of Health at Charité – Universitätsmedizin Berlin Clinician Scientist Program. The funders had no role in study design, data collection and analysis, decision to publish or preparation of the manuscript. Figure were created in BioRender. Kloetzer, K. (2025) https://BioRender.com/mj6hxst.
Footnotes
Competing Interests Statement
The laboratory of Dr. Susztak is supported by Gilead, Novo Nordisk, Novartis, GSK, BIPI, Regeneron, Genentech, ONO and Calico. Dr. Susztak is on the SAB of Pfizer and Otsuka.
Data availability
Previously published data can be accessed via the Kidney Precision Medicine Project website https://www.kpmp.org for KPMP human snRNA-seq, and Gene Expression Omnibus accession codes GSE211785 (Susztak lab human snRNA-seq), GSE209821 (ZSF1 rat snRNA-seq), GSE183839 (DOCA rat snRNA-seq), GSE184652 (diabetic kidney disease mouse snRNA-seq) and GSE139107 (mouse AKI time course snRNA-seq). Unpublished raw and processed snRNA-seq mouse data have been deposited in Gene Expression Omnibus with the accession code GSE291551. Additional published input data used for the extended human atlas was accessed via CELLxGENE (diabetic kidney disease, Wilson et al. 2022), GSE185948 (ADPKD), and the KPMP website (KPMP unpublished). The lung cancer core atlas was downloaded from CELLxGENE. All 5 single-cell atlases (SISKA, human extension, human-, mouse- and rat-only) as well as the unpublished human snRNA-seq data from biopsies has been deposited in Zenodo 97. A user-friendly webtool for gene expression browsing of the multi-species atlas (SISKA) and R2 distributions of rodent models compared to humans is provided on our website www.susztaklab.com. Gene set databases were downloaded from the MSigDB website (C2 database), GO_Biological_Process_2023 downloaded from the enrichR website, KEGG database (accessed via the R package KEGGREST), and the STRING website (9606.clusters.proteins.v12.0). The cross-species GO database was adapted from Figshare 94. Visium spatial transcriptomics datasets were accessed via GSE211785 (human), the DNA Data Bank of Japan (DRA012650) and Genomic Expression Archive (E-GEAD-450) for rat data36, and downloaded from https://www.10xgenomics.com/datasets/adult-mouse-kidney-ffpe-1-standard-1-3-0 (mouse).
Code availability
Customized codes to reproduce the integration pipeline, figures, and downstream analysis were deposited on a GitHub repository www.github.com/susztaklab/SISKA 98. A detailed CellSpectra repository containing the R package and documentation is available via https://github.com/kloetzerka/CellSpectra 99.
References
- 1.Global, regional, and national burden of chronic kidney disease, 1990–2017: a systematic analysis for the Global Burden of Disease Study 2017. Lancet (London, England) 395, 709–733 (2020). [DOI] [PMC free article] [PubMed] [Google Scholar]
- 2.Kidney disease: a global health priority. Nature Reviews Nephrology (2024). [Google Scholar]
- 3.Kalantar-Zadeh K, Jafar TH, Nitsch D, Neuen BL & Perkovic V Chronic kidney disease. The Lancet 398, 786–802 (2021). [Google Scholar]
- 4.Muntner P Longitudinal measurements of renal function. Seminars in nephrology 29, 650–657 (2009). [DOI] [PubMed] [Google Scholar]
- 5.Zuk A & Bonventre JV Acute Kidney Injury. Annu Rev Med 67, 293–307 (2016). [DOI] [PMC free article] [PubMed] [Google Scholar]
- 6.Sethi S, et al. Mayo Clinic/Renal Pathology Society Consensus Report on Pathologic Classification, Diagnosis, and Reporting of GN. Journal of the American Society of Nephrology : JASN 27, 1278–1287 (2016). [DOI] [PMC free article] [PubMed] [Google Scholar]
- 7.Schreibing F & Kramann R Mapping the human kidney using single-cell genomics. Nature Reviews Nephrology 18, 347–360 (2022). [DOI] [PubMed] [Google Scholar]
- 8.Lake BB, et al. An atlas of healthy and injured cell states and niches in the human kidney. Nature 619, 585–594 (2023). [DOI] [PMC free article] [PubMed] [Google Scholar]
- 9.Sikkema L, et al. An integrated cell atlas of the lung in health and disease. Nature medicine 29, 1563–1577 (2023). [Google Scholar]
- 10.Rood JE, Maartens A, Hupalowska A, Teichmann SA & Regev A Impact of the Human Cell Atlas on medicine. Nature medicine 28, 2486–2496 (2022). [Google Scholar]
- 11.Robinson NB, et al. The current state of animal models in research: A review. Int J Surg 72, 9–13 (2019). [DOI] [PubMed] [Google Scholar]
- 12.Zhou J, et al. Unified Mouse and Human Kidney Single-Cell Expression Atlas Reveal Commonalities and Differences in Disease States. Journal of the American Society of Nephrology : JASN 34, 1843–1862 (2023). [DOI] [PMC free article] [PubMed] [Google Scholar]
- 13.Luecken MD & Theis FJ Current best practices in single-cell RNA-seq analysis: a tutorial. Molecular systems biology 15, e8746 (2019). [DOI] [PMC free article] [PubMed] [Google Scholar]
- 14.Heumos L, et al. Best practices for single-cell analysis across modalities. Nature Reviews Genetics 24, 550–572 (2023). [Google Scholar]
- 15.Squair JW, et al. Confronting false discoveries in single-cell differential expression. Nature Communications 12, 5692 (2021). [Google Scholar]
- 16.Zhao K & Rhee SY Interpreting omics data with pathway enrichment analysis. Trends in Genetics 39, 308–319 (2023). [DOI] [PubMed] [Google Scholar]
- 17.Abedini A, et al. Single-cell multi-omic and spatial profiling of human kidneys implicates the fibrotic microenvironment in kidney disease progression. Nature genetics 56, 1712–1724 (2024). [DOI] [PMC free article] [PubMed] [Google Scholar]
- 18.Kirita Y, Wu H, Uchimura K, Wilson PC & Humphreys BD Cell profiling of mouse acute kidney injury reveals conserved cellular responses to injury. Proceedings of the National Academy of Sciences 117, 15874–15883 (2020). [Google Scholar]
- 19.Wu H, et al. Mapping the single-cell transcriptomic response of murine diabetic kidney disease to therapies. Cell Metabolism 34, 1064–1078.e1066 (2022). [DOI] [PMC free article] [PubMed] [Google Scholar]
- 20.Abedini A, et al. Single-cell transcriptomics and chromatin accessibility profiling elucidate the kidney protective mechanism of mineralocorticoid receptor antagonists. The Journal of clinical investigation (2023). [Google Scholar]
- 21.Balzer MS, et al. Treatment effects of soluble guanylate cyclase modulation on diabetic kidney disease at single-cell resolution. Cell Rep Med 4, 100992 (2023). [DOI] [PMC free article] [PubMed] [Google Scholar]
- 22.Lopez R, Regier J, Cole MB, Jordan MI & Yosef N Deep generative modeling for single-cell transcriptomics. Nature Methods 15, 1053–1058 (2018). [DOI] [PMC free article] [PubMed] [Google Scholar]
- 23.Fischer S & Gillis J How many markers are needed to robustly determine a cell’s type? iScience 24, 103292 (2021). [DOI] [PMC free article] [PubMed] [Google Scholar]
- 24.Chen Y, et al. Structural Basis of ALDH1A2 Inhibition by Irreversible and Reversible Small Molecule Inhibitors. ACS Chem Biol 13, 582–590 (2018). [DOI] [PMC free article] [PubMed] [Google Scholar]
- 25.Chen A, Liu Y, Lu Y, Lee K & He JC Disparate roles of retinoid acid signaling molecules in kidney disease. Am J Physiol Renal Physiol 320, F683–f692 (2021). [DOI] [PMC free article] [PubMed] [Google Scholar]
- 26.Uhlen M, et al. Towards a knowledge-based Human Protein Atlas. Nature Biotechnology 28, 1248–1250 (2010). [Google Scholar]
- 27.Safizadeh Shabestari SA, et al. Overlapping pathogenic de novo CNVs in neurodevelopmental disorders and congenital anomalies impacting constraint genes regulating early development. Hum Genet (2022). [Google Scholar]
- 28.Shi W, Le W, Tang Q, Shi S & Shi J Regulon analysis identifies protective FXR and CREB5 in proximal tubules in early diabetic kidney disease. BMC nephrology 24, 180 (2023). [DOI] [PMC free article] [PubMed] [Google Scholar]
- 29.Crow M, Paul A, Ballouz S, Huang ZJ & Gillis J Characterizing the replicability of cell types defined by single cell RNA-sequencing data using MetaNeighbor. Nature Communications 9, 884 (2018). [Google Scholar]
- 30.Kiselev VY, Andrews TS & Hemberg M Challenges in unsupervised clustering of single-cell RNA-seq data. Nat Rev Genet 20, 273–282 (2019). [DOI] [PubMed] [Google Scholar]
- 31.Grabski IN, Street K & Irizarry RA Significance analysis for clustering with single-cell RNA-sequencing data. Nat Methods 20, 1196–1202 (2023). [DOI] [PMC free article] [PubMed] [Google Scholar]
- 32.Hill RZ, et al. Renal mechanotransduction is an essential regulator of renin. bioRxiv, 2023.2011.2004.565646 (2023). [Google Scholar]
- 33.Tefft JB, et al. Notch1 and Notch3 coordinate for pericyte-induced stabilization of vasculature. Am J Physiol Cell Physiol 322, C185–c196 (2022). [DOI] [PMC free article] [PubMed] [Google Scholar]
- 34.Kuppe C, et al. Decoding myofibroblast origins in human kidney fibrosis. Nature 589, 281–286 (2021). [DOI] [PMC free article] [PubMed] [Google Scholar]
- 35.Ashburner M, et al. Gene Ontology: tool for the unification of biology. Nature genetics 25, 25–29 (2000). [DOI] [PMC free article] [PubMed] [Google Scholar]
- 36.Onoda N, et al. Spatial and single-cell transcriptome analysis reveals changes in gene expression in response to drug perturbation in rat kidney. DNA Res 29(2022). [Google Scholar]
- 37.Su H, Lei CT & Zhang C Interleukin-6 Signaling Pathway and Its Role in Kidney Disease: An Update. Frontiers in immunology 8, 405 (2017). [DOI] [PMC free article] [PubMed] [Google Scholar]
- 38.Meier M, Menne J & Haller H Targeting the protein kinase C family in the diabetic kidney: lessons from analysis of mutant mice. Diabetologia 52, 765–775 (2009). [DOI] [PubMed] [Google Scholar]
- 39.Hewitson TD & Smith ER A Metabolic Reprogramming of Glycolysis and Glutamine Metabolism Is a Requisite for Renal Fibrogenesis—Why and How? Frontiers in Physiology 12(2021). [Google Scholar]
- 40.Kanehisa M, Furumichi M, Sato Y, Kawashima M & Ishiguro-Watanabe M KEGG for taxonomy-based analysis of pathways and genomes. Nucleic Acids Res 51, D587–d592 (2023). [DOI] [PMC free article] [PubMed] [Google Scholar]
- 41.Bonventre JV & Yang L Cellular pathophysiology of ischemic acute kidney injury. The Journal of clinical investigation 121, 4210–4221 (2011). [DOI] [PMC free article] [PubMed] [Google Scholar]
- 42.Yan LJ Folic acid-induced animal model of kidney disease. Animal Model Exp Med 4, 329–342 (2021). [DOI] [PMC free article] [PubMed] [Google Scholar]
- 43.Mootha VK, et al. PGC-1α-responsive genes involved in oxidative phosphorylation are coordinately downregulated in human diabetes. Nature genetics 34, 267–273 (2003). [DOI] [PubMed] [Google Scholar]
- 44.Subramanian A, et al. Gene set enrichment analysis: A knowledge-based approach for interpreting genome-wide expression profiles. Proceedings of the National Academy of Sciences 102, 15545–15550 (2005). [Google Scholar]
- 45.Cao H, et al. Tuberous sclerosis 1 (Tsc1) mediated mTORC1 activation promotes glycolysis in tubular epithelial cells in kidney fibrosis. Kidney international 98, 686–698 (2020). [DOI] [PubMed] [Google Scholar]
- 46.Salcher S, et al. High-resolution single-cell atlas reveals diversity and plasticity of tissue-resident neutrophils in non-small cell lung cancer. Cancer Cell 40, 1503–1520.e1508 (2022). [DOI] [PMC free article] [PubMed] [Google Scholar]
- 47.Lau SCM, Pan Y, Velcheti V & Wong KK Squamous cell lung cancer: Current landscape and future therapeutic options. Cancer Cell 40, 1279–1293 (2022). [DOI] [PubMed] [Google Scholar]
- 48.Mullen NJ & Singh PK Nucleotide metabolism: a pan-cancer metabolic dependency. Nature Reviews Cancer 23, 275–294 (2023). [DOI] [PMC free article] [PubMed] [Google Scholar]
- 49.Friedlaender A, Drilon A, Banna GL, Peters S & Addeo A The METeoric rise of MET in lung cancer. Cancer 126, 4826–4837 (2020). [DOI] [PMC free article] [PubMed] [Google Scholar]
- 50.Herbst RS, Morgensztern D & Boshoff C The biology and management of non-small cell lung cancer. Nature 553, 446–454 (2018). [DOI] [PubMed] [Google Scholar]
- 51.Bansal A & Simon MC Glutathione metabolism in cancer progression and treatment resistance. Journal of Cell Biology 217, 2291–2298 (2018). [DOI] [PMC free article] [PubMed] [Google Scholar]
- 52.Hayes JD & Ashford ML Nrf2 orchestrates fuel partitioning for cell proliferation. Cell Metab 16, 139–141 (2012). [DOI] [PubMed] [Google Scholar]
- 53.Leitner BP, et al. Multimodal analysis suggests differential immuno-metabolic crosstalk in lung squamous cell carcinoma and adenocarcinoma. NPJ Precis Oncol 6, 8 (2022). [DOI] [PMC free article] [PubMed] [Google Scholar]
- 54.Muto Y, et al. Defining cellular complexity in human autosomal dominant polycystic kidney disease by multimodal single cell analysis. Nat Commun 13, 6497 (2022). [DOI] [PMC free article] [PubMed] [Google Scholar]
- 55.Wilson PC, et al. Multimodal single cell sequencing implicates chromatin accessibility and genetic background in diabetic kidney disease progression. Nature Communications 13, 5253 (2022). [Google Scholar]
- 56.Liu H, et al. Kidney multiome-based genetic scorecard reveals convergent coding and regulatory variants. Science (New York, N.Y.) 387, eadp4753 (2025). [DOI] [PMC free article] [PubMed] [Google Scholar]
- 57.Xu C, et al. Probabilistic harmonization and annotation of single-cell transcriptomics data with deep generative models. Molecular systems biology 17, e9620 (2021). [DOI] [PMC free article] [PubMed] [Google Scholar]
- 58.Lai KN, et al. IgA nephropathy. Nature Reviews Disease Primers 2, 16001 (2016). [Google Scholar]
- 59.Yang X, et al. Genome-wide linkage and regional association study of blood pressure response to the cold pressor test in Han Chinese: the genetic epidemiology network of salt sensitivity study. Circ Cardiovasc Genet 7, 521–528 (2014). [DOI] [PMC free article] [PubMed] [Google Scholar]
- 60.Hanukoglu I & Hanukoglu A Epithelial sodium channel (ENaC) family: Phylogeny, structure-function, tissue distribution, and associated inherited diseases. Gene 579, 95–132 (2016). [DOI] [PMC free article] [PubMed] [Google Scholar]
- 61.Crowley SD & Coffman TM The inextricable role of the kidney in hypertension. The Journal of clinical investigation 124, 2341–2347 (2014). [DOI] [PMC free article] [PubMed] [Google Scholar]
- 62.Russo CJ, et al. Association of NEDD4L ubiquitin ligase with essential hypertension. Hypertension 46, 488–491 (2005). [DOI] [PubMed] [Google Scholar]
- 63.Persu A & Devuyst O Transepithelial chloride secretion and cystogenesis in autosomal dominant polycystic kidney disease. Nephrology Dialysis Transplantation 15, 747–750 (2000). [Google Scholar]
- 64.Müller RU, et al. An update on the use of tolvaptan for autosomal dominant polycystic kidney disease: consensus statement on behalf of the ERA Working Group on Inherited Kidney Disorders, the European Rare Kidney Disease Reference Network and Polycystic Kidney Disease International. Nephrology, dialysis, transplantation : official publication of the European Dialysis and Transplant Association - European Renal Association 37, 825–839 (2022). [DOI] [PMC free article] [PubMed] [Google Scholar]
- 65.Jardine MJ, Liyanage T, Buxton E & Perkovic V mTOR inhibition in autosomal-dominant polycystic kidney disease (ADPKD): the question remains open. Nephrology Dialysis Transplantation 28, 242–244 (2012). [Google Scholar]
- 66.Li X, et al. A tumor necrosis factor-alpha-mediated pathway promoting autosomal dominant polycystic kidney disease. Nature medicine 14, 863–868 (2008). [Google Scholar]
- 67.Song Y, Miao Z, Brazma A & Papatheodorou I Benchmarking strategies for cross-species integration of single-cell RNA sequencing data. Nature Communications 14, 6495 (2023). [Google Scholar]
- 68.Rosen Y, et al. Towards Universal Cell Embeddings: Integrating Single-cell RNA-seq Datasets across Species with SATURN. bioRxiv, 2023.2002.2003.526939 (2023). [Google Scholar]
- 69.Swamy VS, Fufa TD, Hufnagel RB & McGaughey DM Building the mega single-cell transcriptome ocular meta-atlas. GigaScience 10(2021). [Google Scholar]
- 70.Bakken TE, et al. Comparative cellular analysis of motor cortex in human, marmoset and mouse. Nature 598, 111–119 (2021). [DOI] [PMC free article] [PubMed] [Google Scholar]
- 71.Li H, et al. Cross-species single-cell transcriptomic analysis reveals divergence of cell composition and functions in mammalian ileum epithelium. Cell Regeneration 11, 19 (2022). [DOI] [PMC free article] [PubMed] [Google Scholar]
- 72.Chen D, et al. Single cell atlas for 11 non-model mammals, reptiles and birds. Nature Communications 12, 7083 (2021). [Google Scholar]
- 73.Song Y, Hu Y, Dow J, Perrimon N & Papatheodorou I ScGOclust: leveraging gene ontology to compare cell types across distant species using scRNA-seq data. bioRxiv, 2024.2001.2009.574675 (2024). [Google Scholar]
- 74.Andreatta M & Carmona SJ UCell: Robust and scalable single-cell gene signature scoring. Computational and Structural Biotechnology Journal 19, 3796–3798 (2021). [DOI] [PMC free article] [PubMed] [Google Scholar]
- 75.Noureen N, Ye Z, Chen Y, Wang X & Zheng S Signature-scoring methods developed for bulk samples are not adequate for cancer single-cell RNA sequencing data. eLife 11, e71994 (2022). [DOI] [PMC free article] [PubMed] [Google Scholar]
- 76.Tomfohr J, Lu J & Kepler TB Pathway level analysis of gene expression using singular value decomposition. BMC Bioinformatics 6, 225 (2005). [DOI] [PMC free article] [PubMed] [Google Scholar]
- 77.Ozerov IV, et al. In silico Pathway Activation Network Decomposition Analysis (iPANDA) as a method for biomarker development. Nat Commun 7, 13427 (2016). [DOI] [PMC free article] [PubMed] [Google Scholar]
- 78.Barbie DA, et al. Systematic RNA interference reveals that oncogenic KRAS-driven cancers require TBK1. Nature 462, 108–112 (2009). [DOI] [PMC free article] [PubMed] [Google Scholar]
- 79.Levy O, et al. Age-related loss of gene-to-gene transcriptional coordination among single cells. Nature Metabolism 2, 1305–1315 (2020). [Google Scholar]
- 80.Yu T & Bai Y Capturing changes in gene expression dynamics by gene set differential coordination analysis. Genomics 98, 469–477 (2011). [DOI] [PMC free article] [PubMed] [Google Scholar]
- 81.Leote AC, Lopes F & Beyer A Loss of coordination between basic cellular processes in human aging. Nature Aging 4, 1432–1445 (2024). [DOI] [PMC free article] [PubMed] [Google Scholar]
- 82.Fischer S, Crow M, Harris BD & Gillis J Scaling up reproducible research for single-cell transcriptomics using MetaNeighbor. Nat Protoc 16, 4031–4067 (2021). [DOI] [PMC free article] [PubMed] [Google Scholar]
- 83.Maan H, et al. Characterizing the impacts of dataset imbalance on single-cell data integration. Nature Biotechnology (2024). [Google Scholar]
- 84.Beckerman P, et al. Transgenic expression of human APOL1 risk variants in podocytes induces kidney disease in mice. Nature medicine 23, 429–438 (2017). [Google Scholar]
- 85.McGinnis CS, Murrow LM & Gartner ZJ DoubletFinder: Doublet Detection in Single-Cell RNA Sequencing Data Using Artificial Nearest Neighbors. Cell systems 8, 329–337.e324 (2019). [DOI] [PMC free article] [PubMed] [Google Scholar]
- 86.Young MD & Behjati S SoupX removes ambient RNA contamination from droplet-based single-cell RNA sequencing data. Gigascience 9(2020). [Google Scholar]
- 87.Martin FJ, et al. Ensembl 2023. Nucleic Acids Research 51, D933–D941 (2022). [Google Scholar]
- 88.Cakir B, et al. Comparison of visualization tools for single-cell RNAseq data. NAR Genom Bioinform 2, lqaa052 (2020). [DOI] [PMC free article] [PubMed] [Google Scholar]
- 89.Wolf FA, Angerer P & Theis FJ SCANPY: large-scale single-cell gene expression data analysis. Genome Biology 19, 15 (2018). [DOI] [PMC free article] [PubMed] [Google Scholar]
- 90.Traag VA, Waltman L & van Eck NJ From Louvain to Leiden: guaranteeing well-connected communities. Scientific Reports 9, 5233 (2019). [DOI] [PMC free article] [PubMed] [Google Scholar]
- 91.Kuleshov MV, et al. Enrichr: a comprehensive gene set enrichment analysis web server 2016 update. Nucleic Acids Res 44, W90–97 (2016). [DOI] [PMC free article] [PubMed] [Google Scholar]
- 92.Szklarczyk D, et al. The STRING database in 2023: protein–protein association networks and functional enrichment analyses for any sequenced genome of interest. Nucleic Acids Research 51, D638–D646 (2022). [Google Scholar]
- 93.Korotkevich G, et al. Fast gene set enrichment analysis. bioRxiv, 060012 (2021). [Google Scholar]
- 94.Gillis J Protocol data (Python version). https://figshare.com/articles/dataset/Protocol_data_Python_version_/13034171. (figshare, 2020). [Google Scholar]
- 95.Kleshchevnikov V, et al. Cell2location maps fine-grained cell types in spatial transcriptomics. Nature Biotechnology 40, 661–671 (2022). [Google Scholar]
- 96.Megill C, et al. cellxgene: a performant, scalable exploration platform for high dimensional sparse matrices. bioRxiv, 2021.2004.2005.438318 (2021). [Google Scholar]
- 97.Klötzer KA, et al. A cross-species single-cell kidney atlas: Data repository. 10.5281/zenodo.15007208. . (Zenodo, 2025). [DOI] [Google Scholar]
- 98.KonstantinKltz. susztaklab/SISKA: Pre-release V0.1. 10.5281/zenodo.15109635. (Zenodo, 2025). [DOI] [Google Scholar]
- 99.KonstantinKltz. kloetzerka/CellSpectra: CellSpectra. 10.5281/zenodo.15112987. (Zenodo, 2025). [DOI] [Google Scholar]
Associated Data
This section collects any data citations, data availability statements, or supplementary materials included in this article.
Supplementary Materials
Data Availability Statement
Previously published data can be accessed via the Kidney Precision Medicine Project website https://www.kpmp.org for KPMP human snRNA-seq, and Gene Expression Omnibus accession codes GSE211785 (Susztak lab human snRNA-seq), GSE209821 (ZSF1 rat snRNA-seq), GSE183839 (DOCA rat snRNA-seq), GSE184652 (diabetic kidney disease mouse snRNA-seq) and GSE139107 (mouse AKI time course snRNA-seq). Unpublished raw and processed snRNA-seq mouse data have been deposited in Gene Expression Omnibus with the accession code GSE291551. Additional published input data used for the extended human atlas was accessed via CELLxGENE (diabetic kidney disease, Wilson et al. 2022), GSE185948 (ADPKD), and the KPMP website (KPMP unpublished). The lung cancer core atlas was downloaded from CELLxGENE. All 5 single-cell atlases (SISKA, human extension, human-, mouse- and rat-only) as well as the unpublished human snRNA-seq data from biopsies has been deposited in Zenodo 97. A user-friendly webtool for gene expression browsing of the multi-species atlas (SISKA) and R2 distributions of rodent models compared to humans is provided on our website www.susztaklab.com. Gene set databases were downloaded from the MSigDB website (C2 database), GO_Biological_Process_2023 downloaded from the enrichR website, KEGG database (accessed via the R package KEGGREST), and the STRING website (9606.clusters.proteins.v12.0). The cross-species GO database was adapted from Figshare 94. Visium spatial transcriptomics datasets were accessed via GSE211785 (human), the DNA Data Bank of Japan (DRA012650) and Genomic Expression Archive (E-GEAD-450) for rat data36, and downloaded from https://www.10xgenomics.com/datasets/adult-mouse-kidney-ffpe-1-standard-1-3-0 (mouse).