Abstract
Water-soluble quantum dots (qdots) are now being used in life sciences research to take advantage of their bright, easily excited fluorescence and high photostability. Although the frequent erratic blinking and substantial dark (never radiant) fractions that occur in all available qdots may interfere with many applications, these properties of individual particles in biological environments had not been fully evaluated. By labeling Qdot-streptavidin with organic dyes, we were able to distinguish individual dark and bright qdots and to observe blinking events as qdots freely diffused in aqueous solution. Bright fractions were measured by confocal fluorescence coincidence analysis (CFCA) and two-photon cross-correlation fluorescence correlation spectroscopy (FCS). The observed bright fractions of various preparations were proportional to the ensemble quantum yields (QYs), but the intrinsic brightness of individual qdots was found to be constant across samples with different QYs but the same emission wavelengths. Increasing qdots' illuminated dwell time by 10-fold during FCS did not change the fraction of apparently dark qdots but did increase the detected fraction of blinking qdots, suggesting that the dark population does not arise from millisecond blinking. Combining CFCA with wide-field imaging of arrays of qdots localized in dilute agarose gel, the blinking of qdots was measured across five orders of magnitude in time: ≈0.001-100 s. This research characterizes photophysical pathologies of qdots in biologically relevant environments rather than adhered on dielectric surfaces and describes methods that are useful for studying various bioapplicable nanoparticles.
Keywords: nanoparticles, fluorescence, correlation, spectroscopy, imaging
Semiconducting quantum dots (qdots) have been shown to possess several photophysical properties that are superior to those of organic fluorophores: high-absorption cross sections, excellent photostability, broad excitation spectra, and narrow emission spectra (1, 2). Recent improvements in synthesis methods and protective coatings for water solubility make qdots promising fluorescent labels for certain life sciences research (3, 4). Indeed, qdots have been used successfully in a variety of biological experiments, such as long-term multicolor imaging (5), single-particle tracking in live cells (6), fluorescence in situ hybridization in human chromosomes (7), Xenopus embryo development imaging (8), multiphoton imaging in live mice (9, 10), cancer targeting and metastasis studies in vivo (11, 12), FRET-based biosensors (13), and multiplexed biocoding (14).
Despite the advantages of qdots, many studies suggest considerable heterogeneity in their emission properties, including: blinking (i.e., fluorescence intermittency) (15), nonradiant or dark dot populations (16), emission spectrum variations (17), and fluorescence lifetime fluctuations (18). These attributes can limit the effectiveness of qdots for use as probes in biology. For example, in laser scanning microscopy and single-particle tracking, recording trajectories of individual qdots can be interrupted by blinking (6). Correlations of qdots by optical and electron microscopy (6, 19) can be complicated by the fact that a substantial always dark fraction of qdots may be undetectable by optical microscopy. Characterization of these photophysical pathologies, as needed to optimize the biomedical applications of qdots, is the objective of this report.
Many previous studies on blinking of the bright fraction and on dark fractions have been based on measurements of individual qdots immobilized onto dielectric surfaces (such as glass coverslips) in the absence of an aqueous environment (15, 16, 20). However, it has been shown that the surrounding and supporting environments can affect the emission properties of qdots, even with extensive coating and protection (21-23). Because most biological studies are carried out in water, it is important to evaluate the emission behavior of freely diffusing qdots in solution (24).
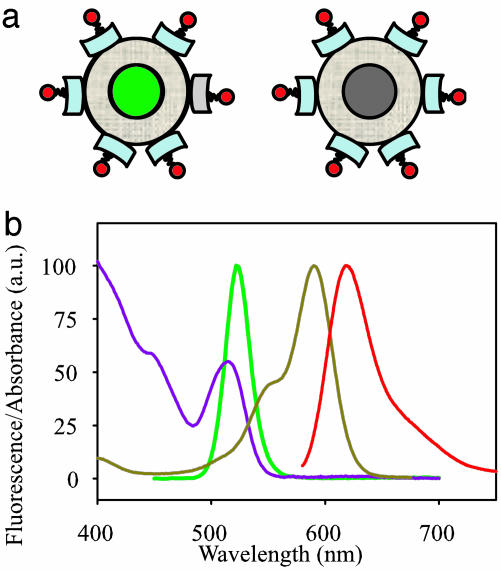
In this report, we describe the nonradiant (dark) fraction and blinking of Qdot-streptavidin (SAv) samples in solution. CdSe/ZnS qdots with water-soluble protective coatings and SAv ligands (Quantum Dot, Hayward, CA) were conjugated to biotin-linked organic dyes. The dyes were chosen to have spectrally distinct emission spectra but overlapping excitation spectra with qdots, thus allowing the dark qdots to be recognized and distinguished from fluorescent qdots (Fig. 1).
Fig. 1.
Schematic structure and spectra of qdot particles used in the experiments. (a) Qdot-SAv (central sphere of CdSe/ZnS core/shell, tan outer layer of amphiphilic coating for water solubility, and light blue block of SAv) labeled with biocytin-Alexa Fluor 594 (red). (Left) Bright (green) qdot. (Right) Dark (gray) qdot. The cartoon does not indicate the actual dye-loading ratio. (b) Normalized fluorescence absorption and emission spectra of Alexa Fluor 594 (dark yellow and red, respectively) and of Qdot525-SAv (purple and green, respectively).
By confocal fluorescence coincidence analysis (CFCA) and two-photon cross-correlation fluorescence correlation spectroscopy (FCS), we measured the properties of bright qdots and dark qdots as they diffused through a femtoliter optical focal volume. Fast blinking events and average dark fractions can be directly observed in solution. To measure slower blinking kinetics, we trapped individual qdots within cavities of agarose gel (25). We found that the bright fraction determined from single-particle measurements correlates with the ensemble quantum yield (QY). We also found that longer observation times reveal greater numbers of blinking dots but not greater numbers of bright dots, suggesting that blinking and dark fraction may be uncoupled. We report photophysical properties of individual qdots, including probability distributions of blinking “on”-times and “off”-times, without immobilizing qdots to surfaces, which we find alters their fluorescence properties.
Materials and Methods
Detailed instrumentation and experimental methods are described in Supporting Materials and Methods, which is published as supporting information on the PNAS web site. To make qdot-dye conjugates, Qdot525-SAv (QY = 0.57, Quantum Dot) was labeled with Alexa Fluor 594-biocytin (Molecular Probes) (Fig. 1). Qdot655-SAv (QY = 0.3 and 0.8) was obtained from Quantum Dot and was labeled with biotin-oligonucleotide (30-mer)-fluorescein (Operon Biotechnologies, Huntsville, AL) (Fig. 7, which is published as supporting information on the PNAS web site). CFCA and wide-field single-dot imaging were performed on an IX-71 inverted microscope (Olympus, Melville, NY). In CFCA, fluorescence from Qdot525 and from Alexa Fluor 594 was collected and separated by a 595DCXR dichroic mirror and confocally detected by two avalanche photodiodes (PerkinElmer). The fluorescence intensity traces were recorded at bin width 50 μs and subjected to coincidence analysis. Wide-field images of individual qdots localized in dilute agarose gel were recorded by a charge-coupled device (CCD) camera (Andor Technology, Belfast, U.K.) with 50-ms exposure for sequences of up to 20 min. The instruments used in two-photon cross-correlation FCS were as described in ref. 9. Excitation power was monitored and kept well below the qdots' saturation power level (9). These qdots and dyes can both be excited at 900 nm by two-photon excitation; thus, the observation volume is the same for both fluorophores [critical for dual-color cross-correlation FCS (26)] and gives an accurate measure of bright fraction. Methods of fluorescence lifetime measurements are described in ref. 27.
Results and Discussion
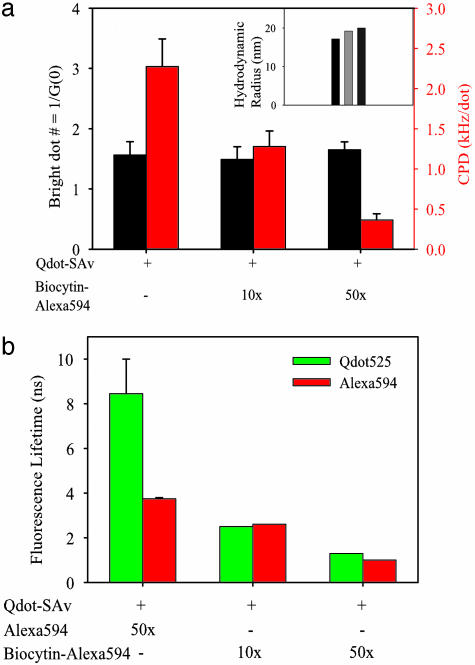
Dye Conjugation Does Not Affect Bright Fraction but Does Decrease Molecular Brightness. To prove the validity of our method, we first characterized the effects of dye conjugation on the qdots. FCS was used to measure bright dot concentration from average particle number inside the focal volume, molecular brightness [i.e., count rate per dot (CPD)], and the hydrodynamic radius for each sample from diffusion coefficients. CPD was measured with the same focal volume, illumination power, and detector system response (28). Bright dot concentrations were found to be the same for both labeled and unlabeled qdot samples of the same total concentration (Fig. 2a), demonstrating that the bright/dark fractions were not affected by dye attachment within ≈±10%. At an extremely high dye labeling ratio of 50:1, CPD and fluorescent lifetime were both decreased 7- to 8-fold (Fig. 2), suggesting quenching of qdot fluorescence by dye conjugation. This effect was alleviated by using low labeling ratios and by increasing linker length between qdots and dyes (Fig. 2a and data not shown). Qdots have been reported to show resonance energy transfer with dyes acting as acceptors (13). With increasing labeling ratios, we found that both qdot lifetime and effective Alexa Fluor 594 lifetime decreased (Fig. 2b) and did not find any evidence of fast amplitude transitions in the fluorescence decay curves of Alexa Fluor 594 (not shown). In summary, some quenching of the qdot fluorescence is observed by both the CPD and the lifetime, but the bright fraction does not change with labeling ratio. As expected, the hydrodynamic radius of Qdot525-Alexa Fluor 594 conjugates is ≈20 nm, slightly larger than that of unlabeled Qdot525-SAv (17 nm; Fig. 2a Inset).
Fig. 2.
Photophysical validation of the model system for measuring dark fraction and blinking of qdots. (a) Average number (black bars) of bright qdots within focal volume and CPDs (red bars) of three samples as measured by two-photon FCS (excitation power = 350 μW). Each sample has the same total concentration as determined by absorption spectroscopy (not shown). (Inset) Hydrodynamic radii of the three samples. Black, Qdot525; light gray, Qdot525-biotin-Alexa Fluor 594 (10×); dark gray, Qdot525-biotin-Alexa Fluor 594 (50×). (b) Fluorescence lifetime measurements of Qdots (green) and Alexa Fluor 594 (red) for the samples indicated in the graph.
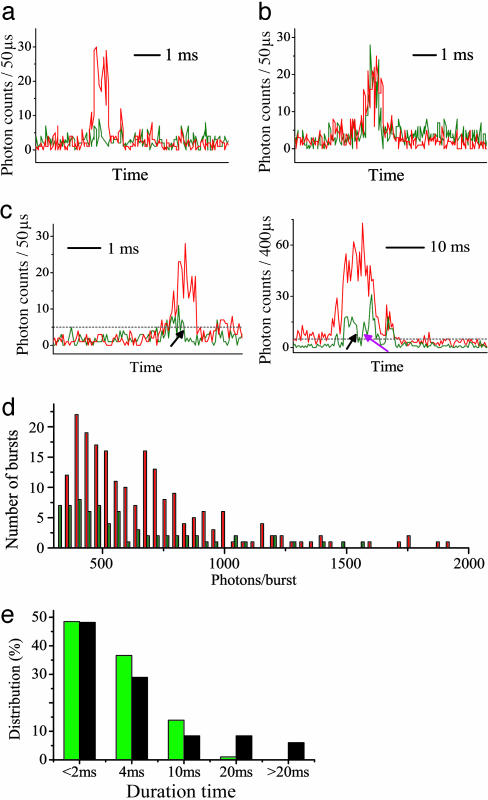
By CFCA, Bright qdots Were Distinguished from Dark qdots, and Blinking Events Were Detected. The bursts in the Alexa Fluor 594 fluorescence traces (Fig. 3) indicate diffusion of the Qdot525-SAv-Alexa Fluor 594 conjugate through the focal volume, whereas the bursts in the Qdot525 fluorescence traces indicate actual qdot fluorescence emission during the dwell time. Dark qdots were identified by the “red-only” bursts of Alexa Fluor 594 (Fig. 3a); bright qdots were identified by the “coincident” bursts and included both on qdots (Fig. 3b) and “blinking” qdots (Fig. 3c Left), with the former remaining on during the entire dwell time and the latter showing on→off switching during dwell time. Off→on switching events were also found (not shown). About 10% of the bursts were “green only” (data not shown) and might be a few qdots not conjugated with functional SAv molecules. Burst widths were ≈1 ms, reflecting the dwell time of individual Qdot525-Alexa Fluor 594 conjugates inside the focal volume (Fig. 3 a and b). The distributions of the number of bursts relative to the number of photons in each burst are shown in the histogram for both red and green bursts in Fig. 3d. The number of “green” bursts (i.e., the integrated area under the green histogram) is about half that of the total number of bursts (i.e., the red bursts), indicating ≈50% bright qdots in this particular sample. The numbers of photons in a burst (i.e., the shape of the histograms) follow approximately the same distribution for both colors. Because blinking qdots were not distinguishable in this burst size histogram, we counted and categorized each individual burst recorded over a 60-s time trace and identified 410 bursts, with 44% as dark qdots and 56% as bright qdots (including on and a few blinking qdots; Table 1), consistent with expectations from Fig. 3d. Therefore, dye conjugation with coincidence detection does enable observation of otherwise unobservable dark qdots and shows considerable heterogeneity among the bulk qdot sample.
Fig. 3.
CFCA on Qdot525-biotin-Alexa Fluor 594. (a-c) Time traces of Alexa Fluor 594 (red) and Qdot525 (green) fluorescence as individual conjugates diffuse through focal volume, indicating dark qdots (a), bright qdots (b), and blinking qdots (c) in HPLC water (Left) and in 36% glycerol (Right). Time scale is shown by the scale bars. Black broken line indicates the threshold of qdot fluorescence signal over background. (Threshold level is 3-fold that of standard deviations above the background.) Black arrows and purple arrow indicate on→off and off→on events, respectively. (d) Burst photon count histograms of a recorded 60-s intensity trace comparing Alexa Fluor 594 (red) and qdot fluorescence (green) bursts in H2O. (e) Distribution of the on-time (green) and off-time (black) of qdots.
Table 1. Fractions of dark and bright (including on and blinking) qdots measured by CFCA.
| Solvent
|
||
|---|---|---|
| qdot properties | HPLC water | 36% glycerol |
| Dwell time, ms | 0.5–2 | 5–20 |
| Bin width, ms | 0.05 | 0.4 |
| Bursts analyzed | 410 | 665 |
| Dark qdots (%) | 181 (44%) | 315 (47%) |
| Bright qdots (%) | 229 (56%) | 350 (53%) |
| Bright on qdots (%) | 197 (86%) | 229 (65%) |
| Bright blinking qdots (%) | 32 (14%) | 121 (35%) |
To test whether the dark qdots we observed were merely snapshots of blinking qdots in the off state, we performed CFCA in 36% glycerol solution, which has a viscosity 10-fold higher than water and slows down the diffusion of qdots to provide a longer observation time window. Burst widths were now reliably detectable up to ≈10 ms, and on→off→on cycles were noticed (Fig. 3c Right). Among 665 bursts counted, 47% were identified as dark qdots, without significant difference from the dark fraction measured by CFCA in water (Table 1). If a dark dot were merely in a transitory off state, one would expect that longer observation times would lead to a decreased dark fraction. However, the 10-fold increase in observation time did not result in any detectable change in the dark fraction, suggesting that most dark qdots remain dark. In summary, by CFCA, we estimated the bright fraction of the Qdot525-SAv sample (QY = 0.57) to be 56 ± 6%.
During the ≈1-ms dwell time in water, only 14% of bright qdots were found to be blinking, and no on→off→on cycles were found (Table 1), which might be why blinking was not observed in FCS correlation spectra in a previous study (9). During the ≈10-ms dwell time in 36% glycerol, 35% of bright qdots were found to be blinking, suggesting that freely diffusing qdots are still blinking in solution but that their detection requires longer dwell time. Among those blinking qdots, the distribution of on/off duration shows a decreasing probability at longer times (Fig. 3e), qualitatively the same as qdot blinking statistics on supporting surfaces (20, 29).
Bright Fraction Measured by Two-Photon Cross-Correlation FCS Agrees with CFCA Results. The observation of fluorescent bursts from individual qdots requires extremely low concentration (≈0.2 nM), resulting in a small sample population. To sample more qdots in solution, we increased qdot concentration 50-fold to 10 nM and performed two-photon cross-correlation FCS to measure average numbers of bright qdots and dark qdots inside the focal volume. The average number of fluorescent particles inside the focal volume is equal to the reciprocal of the zero-time autocorrelation amplitude G(0) (30); therefore, the bright qdot number (green particles) is found by G(0) in the green channel (G(0)green), and the total qdot number (red particles) is found by G(0) in the red channel (G(0)red). The fluorescence cross-correlation function measures coincident fluctuations in both channels in case of binding of the two species with distinct colors (26, 31). The cross-correlation amplitude (G(0)cross) is the time-averaged intensity fluctuation product 〈I(t)greenI(t)red〉 divided by the product of the average intensities in the two channels, 〈I(t)green〉〈I(t)red〉. In our experiments, coincident fluctuations occur only when bright qdots (green) with red dye labels diffuse through the focal volume, and, therefore, G(0)cross should be the reciprocal of the red particle number in the focal volume and equal to G(0)red.
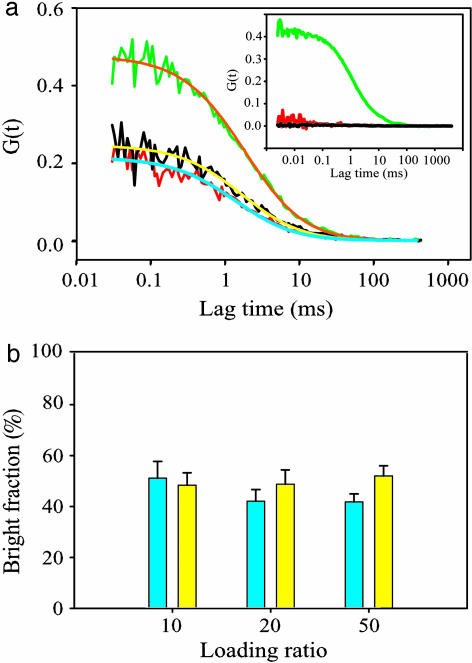
Using two-photon cross-correlation FCS of Qdot525-SAv-Alexa Fluor 594 conjugates, G(0)green was found to be higher than G(0)red and G(0)cross, supporting the existence of a dark fraction (Fig. 4a). G(0)cross between Qdot525-SAv (without dye) and free Alexa Fluor 594-UTP is very close to zero (Fig. 4a Inset), indicating that the cross-correlation amplitude caused by spectral bleed-through is negligible. In this case, the bright fraction can theoretically be measured by either G(0)cross/G(0)green or G(0)red/G(0)green. We conjugated qdots to Alexa Fluor 594 with various loading ratios, expecting to find the same bright fraction, as determined by these two ratios. However, the bright fractions calculated from G(0)red/G(0)green were found to decrease slightly as the loading ratios increased, leading to reduced bright fractions, but the bright fractions calculated from G(0)cross/G(0)green were relatively constant (Fig. 4b). These differences are likely to be due to the inhomogeneous dye brightness ratio among the labeled bright dots. Therefore, we concluded that G(0)cross/G(0)green is the best measure of the bright fraction and used this ratio for the studies below. We calculated the bright fraction of Qdot525-SAv to be 50 ± 5%, which is similar to the results obtained from CFCA of 56 ± 6%.
Fig. 4.
Measurement of the bright fraction of Qdot525-SAv by two-photon cross-correlation FCS. (a) Auto- and cross-correlation curves of Qdot525-SAv-Alexa Fluor 594 conjugate (≈10 nM). Qdot525 autocorrelation (green), Alexa Fluor 594 autocorrelation (red), and cross-correlation (black) functions are shown with the best theoretical fit curves (orange, blue, and yellow, respectively). (Inset) Auto- and cross-correlation curves of Qdot525-SAv plus free Alexa Fluor 594-UTP colored as in main panel. This is the control for spectral bleed-through. (b) Bright fraction with various dye-loading ratios. yellow, G(0)cross/G(0)green; blue, G(0)red/G(0)green.
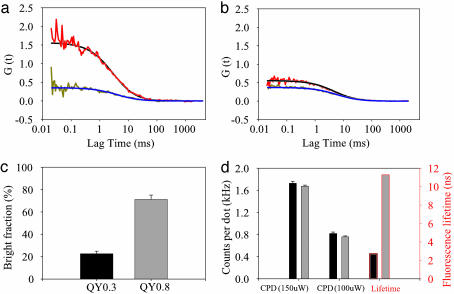
Correlation Between Bright Fraction and the Ensemble QY. The ensemble fluorescence QY of a given sample is the ratio of the number of fluorescence photons emitted to the excitation photons absorbed. The QY is a measure of the brightness of the bulk fluorophore sample. Because of the dot-to-dot heterogeneity observed above (Fig. 3), it is obvious that the ensemble QY of a qdot sample depends not only on single-dot brightness but also on the average bright fraction. We compared the molecular brightness and bright fraction of two Qdot655-SAv samples from different production lots with very similar emission spectra (Figs. 5 a and b and 7) but very different QYs (0.3 and 0.8, respectively). The bright fractions of the low-QY (0.3) sample and the high-QY (0.8) sample were found to be 23 ± 3% and 71 ± 4%, respectively (Fig. 5c). However, CPDs (measured by FCS under 900-nm excitation) were found to be similar between the two unlabeled samples (Fig. 5d). These findings suggest that the intrinsic quantum efficiency of bright qdots is near 1 and that the relative proportion of bright and dark qdots determines the effective bulk QY of the sample. Similar CPDs and action cross sections were found when comparing two Qdot605 samples (QY = 0.67 and 0.97; Fig. 7). Our findings were also corroborated by a recent report that the fluorescence quantum efficiency of a single bright qdot is 98%, on average (32). Finally, our study strongly suggests that the qdots in sample QY = 0.97 do have a bright fraction close to unity, which makes them ideal for use in applications requiring consistent labeling of individual targets.
Fig. 5.
Correlation of bright fraction with ensemble QYs. (a) Autocorrelation curve of qdot fluorescence (red; fitting curve is black) and cross-correlation curve (dark yellow; fitting curve is blue) from red-emitting Qdot655-SAv (QY = 0.3) labeled with fluorescein sample (see Fig. 7). (b) Autocorrelation curve of qdots and cross-correlation curve from Qdot655-SAv (QY = 0.8)-fluorescein sample, colored as in a.(c) Comparison of bright fractions of the QY = 0.3 and QY = 0.8 samples. (d) CPDs at two noted excitation powers and fluorescence lifetimes of two Qdot655-SAv samples. QY = 0.3, black; QY = 0.8, gray.
The fluorescence lifetimes were found to correlate with ensemble QYs in both sample pairs (Fig. 5d; see also Table 2, which is published as supporting information on the PNAS web site); therefore, the dark qdots may be characterized as qdots with very short fluorescence lifetimes due to nonradiative transitions to the ground states that yield extremely low quantum efficiency. A recent study showed that individual qdots at different emission intensities have different lifetimes (18). Thus, lifetime measurements of individual qdots are needed to address the heterogeneity of QYs within various samples.
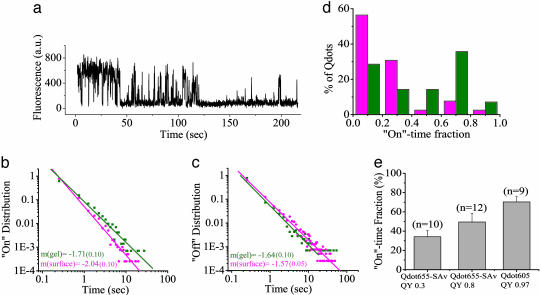
Blinking On-Time and Off-Time Distributions Follow Power Laws. Because of limited dwell time, the on/off distributions of freely diffusing qdots in solution (Fig. 3e) cannot be quantitatively compared with the blinking statistics of qdots immobilized on surfaces. To study qdot blinking behavior throughout extended timescales, we embedded unlabeled qdots in dilute agarose gel and recorded wide-field image series of populations of individual qdots (see Movie 1, which is published as supporting information on the PNAS web site). This method has been used in single-molecule studies to confine translational diffusion in an aqueous environment while still allowing free rotation (25). Some blinking was found for every imaged qdot (see Fig. 6a for a representative trace), which suggests the universal blinking behavior of qdots, even in an aqueous environment.
Fig. 6.
Blinking statistics of qdots in agarose gel. (a) Fluorescence time trace of a single gel-localized qdot. (b and c) On-time (b) and off-time (c) distributions are plotted versus time on log-log scale to show the power law distribution Φ(t) = t-(1+ν), with negative slope m = -(1 + ν) shown in the plot with the uncertainties in the parentheses (20). Surface-supported (pink) and gel-localized (green) qdots are compared. (d) Distributions of on-time fractions from surface-supported (pink; n = 37) and gel-localized (green; n = 12) qdots. (e) On-time fractions of gel-localized qdots from three different batches; n is the number of qdots, and error bars are SEM.
The on- and off-time probability distributions Φ(ton) and Φ(toff) follow a power law form Φ(t) ∝ t-(1+ν), where ν ≈ 0.7 is observed over three orders of magnitude for gel-localized qdots (from 10-1 s to 102 s; Fig. 6 b and c). Fourier transform of this form to frequency-dependent noise spectra yields
 |
with ν ≈ 0.7 as in Φ(T), which resembles previous data on ensemble qdots in solution and single qdots on surfaces (33).
Blinking Varies with Environments and Samples. On distributions decreased significantly and off distributions increased slightly for surface-supported qdots relative to gel-localized qdots (Fig. 6 b and c). This result confirms that surface adherence might increase dark time due to blinking and supports the need to study blinking behavior in solution. The surface effect might vary with differing samples and surfaces, and it could be complicated by the statistical nature of qdot blinking (34). However, our observations represent the typical timescale (0.1 s to ≈10 min) of most single-molecule imaging experiments and should be relevant to biological research using fluorescence from individual qdots. The total on-time fraction of each qdot significantly increases during approximately the first 5 min after application of known blinking-reducing agents at high concentration (i.e., 100 mM; data not shown), such as DTT or 2-mercaptoethanol (22). Confirming the time-distribution analysis, a higher percentage of gel-localized qdots was found to have long on-time fractions (>60%) compared with surface-supported qdots (Fig. 6d).
The small difference between the on-time fraction (Fig. 6e) of gel-localized Qdot655-SAv (QY = 0.8) and gel-localized Qdot655-SAv (QY = 0.3) cannot account for the QY difference, confirming our findings that the ensemble measurements of QY arise primarily from the properties of the bright fraction of the population as distinct from their blinking. The highest on-time fraction we found (70% during 5 min of continuous illumination) was from the Qdot605 (QY = 0.97) sample (Fig. 6e). Intriguingly, blinking in this QY ≈ 1 sample may imply a difference in optical absorption properties during on and off states, which conserves the high QY ≈ 1 even in the presence of ≈30% average off time.
Conclusions
Our study has provided direct measures of blinking and dark fractions of water-soluble qdots in aqueous solution. We used complementary methods, including CFCA and two-photon cross-correlation FCS on the qdot-dye conjugate freely diffusing in solution and wide-field epifluorescence imaging of unlabeled, gel-localized but locally mobile qdots. Various synthesizing methods have been developed to make bioapplicable nanoparticles, including qdots (2, 35), and our techniques should be useful for studying the photophysical properties of all types of nanoparticles at the single-particle level.
For the qdot samples that we have examined, blinking was found on both freely diffusing qdots and on gel-localized qdots at timescales from milliseconds to hundreds of seconds. The brightness of qdots can be characterized in two distinct but complementary ways: (i) the mean intrinsic brightness of single qdots in the “on” state can be measured by action cross sections or CPDs and (ii) the bright fraction of the dot population that is capable of absorbing excitation light can be conveniently estimated from the ensemble QY. As expected, the very best batch has both the highest ensemble QY (0.97) and the highest on-time fraction (70% under our illumination conditions).
As additional applications of qdots are developed, it may be desirable to specify particular properties that are needed for certain experiments, such as qdots with minimal blinking for single-particle tracking, qdots with minimal dark fraction for correlative electron and optical microscopy, or qdots with small effective size for live cell imaging of protein dynamics. Taking advantage of the spectroscopic features that are unique to qdots, one can design experiments that were not possible with preexisting organic fluorophores (36).
Supplementary Material
Acknowledgments
We thank Dr. Marcel Bruchez (Quantum Dot) for providing research materials and technical advice, Diana Bull and Jesse McMullen for experimental contributions, Dr. Frank Wise and Stephen Clark for fruitful discussion and critical reading of the manuscript, and Mark A. Williams for editorial assistance. This work was performed at the Developmental Resource for Biophysical Imaging Opto-Electronics (Cornell University) and was supported by National Institute of Biomedical Imaging and Bioengineering/National Institutes of Health Grant 9 P41 EB001976-18, National Cancer Institute Grant 3 CA094311, and National Science Foundation Grants CHE-0242328 and STC ECS-9876771.
Author contributions: J.Y. designed research; J.Y. performed research; J.Y., D.R.L., H.D.V., and W.R.Z. analyzed data; and J.Y., D.R.L., H.D.V., W.R.Z., and W.W.W. wrote the paper.
Abbreviations: qdot, quantum dot; QY, quantum yield; CFCA, confocal fluorescence coincidence analysis; FCS, fluorescence correlation spectroscopy; CPD, count rate per dot; SAv, streptavidin.
References
- 1.Alivasatos, A. P. (1996) Science 271, 933-937. [Google Scholar]
- 2.Michalet, X., Pinaud, F. F., Bentolila, L. A., Tsay, J. M., Doose, S., Li, J. J., Sundaresan, G., Wu, A. M., Gambhir, S. S. & Weiss, S. (2005) Science 307, 538-544. [DOI] [PMC free article] [PubMed] [Google Scholar]
- 3.Bruchez, M., Jr., Moronne, M., Gin, P., Weiss, S. & Alivisatos, A. P. (1998) Science 281, 2013-2016. [DOI] [PubMed] [Google Scholar]
- 4.Chan, W. C., Maxwell, D. J., Gao, X., Bailey, R. E., Han, M. & Nie, S. (2002) Curr. Opin. Biotechnol. 13, 40-46. [DOI] [PubMed] [Google Scholar]
- 5.Wu, X., Liu, H., Liu, J., Haley, K. N., Treadway, J. A., Larson, J. P., Ge, N., Peale, F. & Bruchez, M. P. (2003) Nat. Biotechnol. 21, 41-46. [DOI] [PubMed] [Google Scholar]
- 6.Dahan, M., Levi, S., Luccardini, C., Rostaing, P., Riveau, B. & Triller, A. (2003) Science 302, 442-445. [DOI] [PubMed] [Google Scholar]
- 7.Xiao, Y. & Barker, P. E. (2004) Nucleic Acids Res. 32, e28/1-e28/5. [DOI] [PMC free article] [PubMed] [Google Scholar]
- 8.Dubertret, B., Skourides, P., Norris, D. J., Noireaux, V., Brivanlou, A. H. & Libchaber, A. (2002) Science 298, 1759-1762. [DOI] [PubMed] [Google Scholar]
- 9.Larson, D. R., Zipfel, W. R., Williams, R. M., Clark, S. W., Bruchez, M. P., Wise, F. W. & Webb, W. W. (2003) Science 300, 1434-1436. [DOI] [PubMed] [Google Scholar]
- 10.Levene, M. J., Dombeck, D. A., Kasischke, K. A., Molloy, R. P. & Webb, W. W. (2004) J. Neurophysiol. 91, 1908-1912. [DOI] [PubMed] [Google Scholar]
- 11.Voura, E. B., Jaiswal, J. K., Mattoussi, H. & Simon, S. M. (2004) Nat. Med. 10, 993-998. [DOI] [PubMed] [Google Scholar]
- 12.Gao, X., Cui, Y., Levenson, R. M., Chung, L. W. & Nie, S. (2004) Nat. Biotechnol. 22, 969-976. [DOI] [PubMed] [Google Scholar]
- 13.Medintz, I. L., Clapp, A. R., Mattoussi, H., Goldman, E. R., Fisher, B. & Mauro, J. M. (2003) Nat. Mater. 2, 630-638. [DOI] [PubMed] [Google Scholar]
- 14.Han, M., Gao, X., Su, J. Z. & Nie, S. (2001) Nat. Biotechnol. 19, 631-635. [DOI] [PubMed] [Google Scholar]
- 15.Nirmal, M., Dabbousi, B. O., Bawendi, M. G., Macklin, J. J., Trautman, J. K., Harris, T. D. & Brus, L. E. (1996) Nature 383, 802-804. [Google Scholar]
- 16.Ebenstein, Y., Mokari, T. & Banin, U. (2002) Appl. Phys. Lett. 80, 4033-4035. [Google Scholar]
- 17.Empedocles, S. A., Norris, D. J. & Bawendi, M. G. (1996) Phys. Rev. Lett. 77, 3873-3876. [DOI] [PubMed] [Google Scholar]
- 18.Fisher, B. R., Eisler, H. J., Stott, N. E. & Bawendi, M. G. (2004) J. Phys. Chem. B 108, 143-148. [Google Scholar]
- 19.Nisman, R., Dellaire, G., Ren, Y., Li, R. & Bazett-Jones, D. P. (2004) J. Histochem. Cytochem. 52, 13-18. [DOI] [PubMed] [Google Scholar]
- 20.Kuno, M., Fromm, D. P., Hamann, H. F., Gallagher, A. & Nesbitt, D. J. (2000) J. Chem. Phys. 112, 3117-3120. [Google Scholar]
- 21.Koberling, F., Mews, A. & Basche, T. (2001) Adv. Mater. 13, 672-676. [Google Scholar]
- 22.Hohng, S. & Ha, T. (2004) J. Am. Chem. Soc. 126, 1324-1325. [DOI] [PubMed] [Google Scholar]
- 23.Speckman, D. M., Jennings, T. L., LaLumondiere, S. D. & Moss, S. C. (2002) Mater. Res. Soc. Symp. Proc. 704, 269-274. [Google Scholar]
- 24.Yao, J., Larson, D. R., Zipfel, W. R. & Webb, W. W. (2005) in Proceedings of SPIE: Nanobiophotonics and Biomedical Applications II, eds. Cartwright, A. N. & Osinski, M. (SPIE, Bellingham, WA), Vol. 5705, pp. 148-151. [Google Scholar]
- 25.Peterman, E. J. G., Brasselet, S. & Moerner, W. E. (1999) J. Phys. Chem. A 103, 10553-10560. [Google Scholar]
- 26.Heinze, K. G., Koltermann, A. & Schwille, P. (2000) Proc. Natl. Acad. Sci. USA 97, 10377-10382. [DOI] [PMC free article] [PubMed] [Google Scholar]
- 27.Heikal, A. A., Hess, S. T., Baird, G. S., Tsien, R. Y. & Webb, W. W. (2000) Proc. Natl. Acad. Sci. USA 97, 11996-12001. [DOI] [PMC free article] [PubMed] [Google Scholar]
- 28.Xu, C. & Webb, W. W. (1997) in Topics in Fluorescence Spectroscopy: Nonlinear and Two-Photon-Induced Fluorescence, ed. Lakowicz, J. (Plenum, New York), Vol. 5, pp. 471-540. [Google Scholar]
- 29.Shimizu, K. T., Neuhauser, R. G., Leatherdale, C. A., Empedocles, S. A., Woo, W. K. & Bawendi, M. G. (2001) Phys. Rev. B Condens. Matter 63, 205316/1-205316/5. [Google Scholar]
- 30.Webb, W. W. (2001) Appl. Opt. 40, 3969-3983. [DOI] [PubMed] [Google Scholar]
- 31.Hom, E. F. & Verkman, A. S. (2002) Biophys. J. 83, 533-546. [DOI] [PMC free article] [PubMed] [Google Scholar]
- 32.Brokmann, X., Coolen, L., Dahan, M. & Hermier, J. P. (2004) Phys. Rev. Lett. 93, 107403/1-107403/4. [DOI] [PubMed] [Google Scholar]
- 33.Pelton, M., Grier, D. G. & Guyot-Sionnest, P. (2004) Appl. Phys. Lett. 85, 819-821. [Google Scholar]
- 34.Brokmann, X., Hermier, J. P., Messin, G., Desbiolles, P., Bouchaud, J. P. & Dahan, M. (2003) Phys. Rev. Lett. 90, 120601/1-120601/4. [DOI] [PubMed] [Google Scholar]
- 35.Penn, S. G., He, L. & Natan, M. J. (2003) Curr. Opin. Chem. Biol. 7, 609-615. [DOI] [PubMed] [Google Scholar]
- 36.Kim, S., Lim, Y. T., Soltesz, E. G., De Grand, A. M., Lee, J., Nakayama, A., Parker, J. A., Mihaljevic, T., Laurence, R. G., Dor, D. M., et al. (2004) Nat. Biotechnol. 22, 93-97. [DOI] [PMC free article] [PubMed] [Google Scholar]
Associated Data
This section collects any data citations, data availability statements, or supplementary materials included in this article.


