Abstract
Confocal fluorescence correlation spectroscopy as a time-averaging fluctuation analysis combining maximum sensitivity with high statistical confidence has proved to be a very versatile and powerful tool for detection and temporal investigation of biomolecules at ultralow concentrations on surfaces, in solutions, and in living cells. To probe the interaction of different molecular species for a detailed understanding of biologically relevant mechanisms, crosscorrelation studies on dual or multiple fluorophore assays with spectrally distinct excitation and emission are particularly promising. Despite the considerable improvement of detection specificity provided by fluorescence crosscorrelation analysis, few applications have so far been reported, presumably because of the practical challenges of properly aligning and controlling the stability of the experimental setup. In this work, we demonstrate that two-photon excitation combined with dual-color fluorescence correlation spectroscopy can be the key to simplifying simultaneous investigations of multiple fluorescent species significantly on a single-molecule scale. Two-photon excitation allows accession of common fluorophores of largely distinct emission by the same excitation wavelength, because differences in selection rules and vibronic coupling can induce considerable shifts between the one-photon and two-photon excitation spectra. The concept of dual-color two-photon fluorescence crosscorrelation analysis is introduced and experimentally demonstrated with an established assay probing the selective cleavage of dual-labeled DNA substrates by restriction endonuclease EcoRI.
Because of its sensitivity, which is high enough to probe the presence and dynamic behavior of single fluorescent molecules in measurement volumes of <10−15 liters, confocal fluorescence correlation spectroscopy (FCS) (1–3) is closely related to numerous optical methods for single-molecule detection and analysis at room temperature that have recently evoked a whole new field of biophysical research (4, 5). Using laser-induced fluorescence of highly efficient fluorescent labels, measurements of intramolecular dynamics as well as molecular interactions of biomolecules at ultralow concentrations became feasible, promising new insights into basic molecular mechanisms that take place in living organisms. In contrast to superresolution techniques such as near-field and atomic force microscopy, diffraction-limited far-field confocal microscopy and fluorescence spectroscopy are not restricted to probing surfaces and thus are the methods of choice for following the three-dimensional dynamics of single molecules in vitro and in vivo (6, 7). In confocal spectroscopy, the exciting laser beam is focused to a diffraction-limited spot by epiillumination of a high numerical aperture objective. A pinhole in the image plane serves as a field diaphragm and discriminates against axial out-of-focus fluorescence. The optically defined detection volume element is usually of the order of some 10−16 liters, allowing resolution of occupation numbers in the single-particle regime at nanomolar or lower concentrations. Obviously, the observation of free mobile molecules in a fixed open volume element restricts the observation time according to mobility parameters such as diffusion or transport coefficients. To obtain reasonable signal-to-noise ratios by collecting as many photons as possible per single molecule, the excitation levels are usually fairly large (≈100 kW/cm2), demanding high photostability of the chosen labeling dyes. So far, only a few dye classes, including Rhodamine and Cyanine derivatives, have thus met the requirements for single-molecule studies.
In the context of confocal detection, FCS has proven to be a remarkably valuable tool, assessing a multitude of parameters like local concentrations, particle mobility, association and dissociation rates, and enzymatic activity, as well as rate constants of diverse intramolecular dynamics, with high statistical accuracy (8–11). Dual-color crosscorrelation analysis (12, 13), a conceptual modification of FCS using two spectrally separable fluorescent labels, yields a considerable improvement in signal specificity for heterogeneous systems where molecular interactions of different species are to be observed. The simplicity of the measurement process has recently even encouraged biotechnological applications leading to online kinetics of enzymatic reactions (14) and fast enzyme screening applications (15, 16). In principle, any molecular association and dissociation, as well as the formation or cleavage of chemical bonds, can be studied simply by simultaneous detection of two spectrally separated fluorophores, following the amplitude of the crosscorrelation function in real time during the reaction. Despite the simplified analysis, the experimental setup, on the other hand, can be rather critical with two laser beams being brought to a perfect and stable overlap within fractions of micrometers. For a few certain dye combinations, excitation laser sources can be operated in multiline mode (16), which yields significant advantages in overall performance. In addition, the chosen dye systems have to fulfill the requirements for ultrasensitive single-molecule detection under the circumstances of dual excitation, i.e., showing not only high quantum yields but also photostability toward either detection wavelength. To simplify the optical system, it would be highly advantageous to establish a system of two dyes with comparable excitation maxima but largely different Stokes shifts toward emission. In this case, sufficient excitation of probes with distinct emission characteristics could be performed by a single laser line. However, so far no such system among the fluorescent probes known to be appropriate for single-molecule experiments has been reported, but evidence is given that two-photon excitation might be the key to solving this experimental problem.
Two-photon excitation for laser-scanning microscopy was first demonstrated by Denk et al. (17) as an elegant solution to obtain intrinsic three-dimensional resolution, thereby restricting photodamage not only of dye resources but also of the cellular compounds in studies on live samples. IR laser light can be used to access common fluorescent probes in the visible or near UV spectral range. Two-photon excitation is induced by simultaneous (≈10−15 s) absorption within the cross section of the dye molecule (≈10−16 ⋅cm−2) and consequently requires high instantaneous photon flux densities of the order of 1031 photons/cm2. The nonlinear process with an excitation probability proportional to the mean square of the intensity results in inherent spatial sectioning comparable or even superior to the resolution obtained by confocal pinholes: because the intensity squared declines with distance z from the focal plane as z−4, only the focal plane receives sufficient intensity for significant absorption. This feature as well as the higher tolerance of infrared light by cells or tissue has supported two-photon laser scanning microscopy as an attractive alternative to confocal imaging techniques (18). Although two-photon absorption cross sections of common dyes are fairly low (of the order of 10−50 cm4/photon), single-molecule detection of mobile or surface-bound dye molecules after two-photon excitation has been accomplished previously (19, 20), as well as single-color FCS (21–23), showing considerable improvement with respect to intracellular applications (23). However, there is one more essential advantage with respect to one-photon excitation: the two-photon induced transition to the excited state, which is formally symmetry forbidden, exhibits different selection rules and vibronic coupling. As a consequence, the two-photon excitation spectra of the common fluorophores can differ considerably from their one-photon counterparts with no change in emission, which makes it possible to accomplish simultaneous excitation of spectrally distinct dyes (24). Although this concept has been used in confocal imaging applications, its suitability for single-molecule-based techniques, requiring the detection of two labels on a single molecule during the limited time frame of molecular residence in the focal spot, has so far not been demonstrated. Clearly, the choice of a proper dye system is crucial for such applications, because the chosen dyes should exhibit not only similar excitation and distinct emission spectra but also comparable photobleaching quantum yields at a given intensity.
We describe the experimental arrangement and application of two-photon excited two-color crosscorrelation spectroscopy on the level of single diffusing molecules, using two Rhodamine derivatives (Rhodamine green and Texas red) as distinct labels that meet the above-mentioned photophysical requirements. The overall performance of the optical system is tested, accessing the kinetics of enzymatic cleavage of double-labeled double-stranded DNA molecules by restriction endonuclease EcoRI, following the scheme introduced by Kettling et al. (14). The results demonstrate that the performance, which can be obtained in terms of detection sensitivity and specificity, is indeed comparable or even superior to that achievable in one-photon setups with two excitation lines. This result is particularly promising for intracellular applications (23), analytic purposes (14), fast analytic purposes (15), or even high-throughput screening approaches (16) of dual-color crosscorrelation, where several known additional advantages of two-photon excitation, such as reduced background and probe depletion, come into play (17, 23).
Materials and Methods
Theoretical Concept.
Confocal fluorescence correlation spectroscopy (1, 2) is a method uniquely suited to investigation of mobility and intramolecular dynamics of single molecules in time regimes between several nanoseconds and several milliseconds. The idea is to temporally analyze spontaneous deviations of molecular parameters from their thermodynamic mean, giving rise to fluctuations of fluorescence emission. The normalized fluorescence correlation function is defined by:
 |
1 |
If two different signals with fluctuations δFi and δFj are recorded, Gii and Gjj represent the two fluorescence autocorrelation functions, respectively, and Gij or Gx the crosscorrelation function. For two-photon excitation, the fluctuating signals δF for i, j can be expressed as
 |
2 |
where 〈I0(t)〉 is the average intensity at the geometrical focal point, S(r) the dimensionless spatial distribution function of the focused light in the sample space, and g2, defined as  is a measure of the second-order temporal coherence of the excitation (25). Ωi(r) is the optical transfer function for the emission in confocal setups defined by the objective-pinhole combination, and it is usually wavelength dependent. Two-photon excitation, in principle, requires no pinhole, so that wide-field collection with Ωi(r) ≈1 can be assumed. Ci is the concentration of the fluorophore contributing to Fi, qi is its quantum efficiency, σi its two-photon absorption cross section, and κi the wavelength-dependent collection efficiency of the setup. In the simplest case observed here, δF(t) are number fluctuations caused by freely diffusing particles traversing the illuminated spatial regime without changing their fluorescence characteristics:
  . Thus, δF(t) can be rewritten in a simplified form:
 |
3 |
where ηi,j denotes the photon detection yield for either molecular species in counts per molecule per second (12). In ideal cases with fully separable dyes, ηi,j cancels out in calculations of the normalized auto and crosscorrelation functions, measured from a mixture of single-labeled species with concentrations Ci and Cj, as well as double-labeled species with concentration Cij (12):
 |
4 |
 |
with Veff as the effective measurement volume element and Mi,j,ij as the time-dependent correlation governed by molecular dynamics. For 2PE with Ω(r) = 1, and if S(r) is assumed to be Gaussian with 1/e2 values r0 and z0, the effective volume size is  (23). For noninteracting particles, freely diffusing in three dimensions, M is given by:
 |
5 |
r0 and z0 are the characteristic lateral and axial volume dimensions, τd,n = r02/8D are defined as the average lateral diffusion times for a molecule of species i,j,ij with diffusion coefficient Di,j,ij through Veff. For a known Veff, the concentration of double-labeled species can be derived simply from auto- and crosscorrelation amplitudes without considering the molecular mobility, by the simple relationship:
 |
Unfortunately, the complete separation between two detection channels is hard to accomplish with a set of fluorescent probes, if one intends to work in the visible spectral range. In reality, unspecific crosstalk in particular due to long-wavelength emission of the blue-shifted dye cannot be neglected (12, 13). In this case, the relative count rates per molecule η for each species in either of the two detection channels have to be considered and the dependence of the auto and crosscorrelation amplitudes on the molecular concentrations Ci,j,ij have to be modified as follows (13):
 |
 |
 |
6 |
with ηii being the green emission characteristics of the green dye in counts per molecule per second, ηjj the red emission of the red dye, and ηij the crosstalk of the green dye into the red channel. Fi,j are the measured average fluorescence signals in counts per second in either detection channel. Thus, the absolute concentration Cij of double-labeled species can be calculated from the average fluorescence signals, the values ηii,jj,ij and Veff known from calibration measurements, as well as the amplitudes of cross- and green autocorrelation functions Gx(0) and Gi(0), if none of the concentrations is known. In controlled association or dissociation assays where Cij(t) + Ci(t) = constant = Ci,0, the relationship between crosscorrelation amplitude at any time t, Gx(0,t) and concentration Cij is simply given by:
 |
7 |
Experimental Setup.
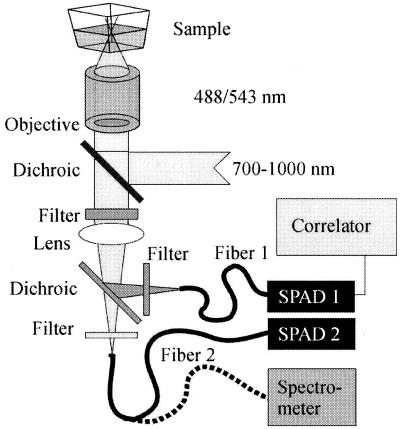
The experimental setup (Fig. 1) is realized on the basis of an inverted Olympus IX-70 microscope. For two-photon excitation, a mode-locked Spectra-Physics Tsunami Titanium-Sapphire laser is used, operating at 80 MHz with 100-fs pulses, tunable between 700 and 1,000 nm. The parallel laser light epiilluminates a water-immersion UPlanApo 60 × 1.2 objective (Olympus) via a dichroic mirror 710DCSPXR (AHF Analysentechnik, Tübingen, Germany). The back aperture is slightly overfilled, creating a diffraction-limited focal spot. The radial and axial dimensions r0 and z0 are known from calibration measurements with pure dye Rhodamine 6G excited at 830 nm. The determination of r0 yields a value of 0.48 μm. The fraction z0/r0 for the given setup is 2.8, yielding an effective volume element Veff about 0.6 fl. The fluorescence light traverses the first dichroic mirror and an emission filter 600DF200 (AHF) for efficient suppression of IR excitation light and is then split by a second dichroic mirror 595DCLP (AHF). Additional detection light specificity is obtained by a 535DF45 (AHF) bandpass filter (green detector) and a RG610 (Schott) long-pass filter (red detector) chosen according to the selected dye system Rhodamine green and Texas red (Molecular Probes). For detection, we use two optical fiber coupled avalanche photodiodes SPCM-200 (EG&G, Optoelectronics, Vaudreuil, Canada). The optical fibers, with a diameter of 100 μm, are separately adjustable in the x, y, z directions. The photocount signal is autocorrelated over 60 s by a PC ALV-5000 multiple-τ correlator card (ALV, Langen, Germany) operating in auto- and crosscorrelation modes. Evaluation of the curves is carried out by origin (MicroCal Software, Northampton, MA) by using Marquardt nonlinear least-square fitting routine. Confocal spectra are taken with a fiber-coupled spectrometer (Ocean Optics, Dunedin, IL) by using an entrance fiber slit of 100 μm.
Figure 1.
Optical setup as realized in an inverted microscope Olympus IX70. A single Titanium-Sapphire laser line with tunable wavelength is used for illumination, and the detected light is split by a dichroic after the collimating lens and imaged onto two different optical fibers. Both fibers can be coupled alternatively into a spectrometer.
Biochemical Assay.
The biochemical preparation of the test assay is analogous, as described elsewhere (14), with the only exception that instead of the Cy-5-label, Texas red was used for labeling the 5′-end of the oligonucleotide (NAPS, Göttingen, Germany). Digestion studies were performed by using 125 nM of double-labeled DNA substrate.
Results
Establishing the Dye System and Calibration Measurements.
The selection of proper dye systems is most crucial for crosscorrelation analysis and deserves great attention. The spectral overlap of the emission characteristics should be minimal; on the other hand, both dyes should not only be well excitable by the same two-photon laser line but should also tolerate the same excitation intensities without considerable photobleaching. Many dyes designed for the red spectral range are commonly excited at much lower intensity levels than the blue or green dyes. This requires an optimization procedure of both parameters, wavelength, and intensity, with respect to the chosen dye system. Most likely, every optimized two-photon dual color setup is a compromise according to the different photostability, quantum yield, absorption spectra, etc., of the chosen dye system.
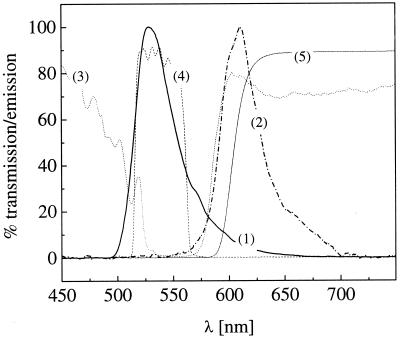
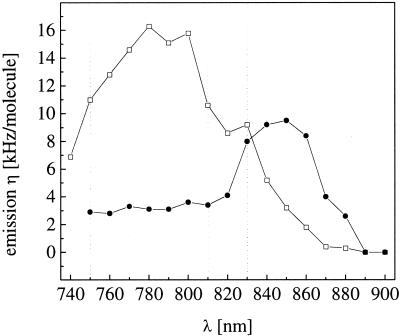
Based on the experience with previous one- and two-photon FCS measurements, the dye system selected for the crosscorrelation experiment consists of Rhodamine green and Texas red. Both fluorophores exhibit large fluorescence quantum yields and high enough photostability to tolerate the intensities required for confocal FCS experiments with high signal-to-noise levels. Fig. 2 shows the two-photon excited spectra that are measured from micromolar dye solutions within the focal volume element, if the excitation wavelength is set to 830 nm for both dyes. The characteristic transmission curves of the optical elements chosen for the dual-color detection (dichroics and filters) are also plotted. To discriminate against the considerable overlap between the two emission spectra, the filter used for the red detection arm is allowed to cut off a portion of the Texas red emission. To determine the optimal wavelength to excite both dyes equally well, the excitation is scanned between 740 nm and 900 nm, and the photon detection yield η, being a direct measure for signal quality in FCS (26), is recorded for both dyes independently. Fig. 3 shows a plot of η both for Rhodamine green and Texas red vs. the two-photon excitation wavelength. η can be determined easily from FCS measurements by multiplying the average count rate 〈F〉 with the correlation amplitude. During the scan, intensity and pulse width are controlled and kept constant at 30 nm and 100 fs. No photobleaching of the dyes (resulting in reduced molecular residence times) can be observed under these conditions. If the wavelength effects on the effective volume element are taken into consideration, the relative two-photon absorption cross sections can in principle be directly derived from this graph (23). Interestingly, Texas red, being the red-emitting dye, exhibits its maximum of η if 780 nm for excitation is applied, whereas the maximum Rhodamine green emission is obtained for excitation at 850 nm. The optimal wavelength for the following crosscorrelation experiments where both dyes are excited equally well is at 830 nm.
Figure 2.
Spectra of the used dyes after two-photon excitation, measured by a fiber-coupled spectrometer within the focal spot. Excitation wavelength is 830 nm. (1) Rhodamine green, (2) Texas red. The spectra are not notably different compared with one-photon excitation at the respective absorption maxima. The transmission characteristics of dichroic mirror (3) and filters [(4) and (5)] used for spectral separation of the emission light are also indicated.
Figure 3.
Wavelength dependence of the fluorescence emission yield η in counts per molecule and second for both dyes (Rhodamine green ●, Texas red □). Excitation power and pulse width are kept constant at 30 mW and 100 fs. The excitation maximum of Texas red is blue shifted compared with Rhodamine green. At 830 nm, both dyes exhibit similar performance.
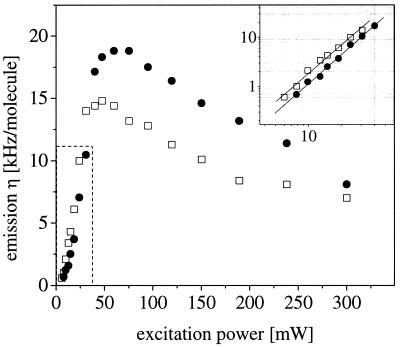
To test whether the excitation at 830 nm is indeed a two-photon process, and to determine the “safe” intensity range where no photobleaching or saturation effects compromise the FCS signal, the emission yields η for both dyes (ηii and ηjj) are further plotted vs. excitation power in Fig. 4. It can easily be seen that the curves exhibit clear maxima with a considerable decay at greater powers presumably due to photobleaching, before a saturation plateau is reached. This observation is comparable to earlier FCS studies with two-photon excitation on other Rhodamine derivatives (ref. 23) and supports the presumption that the two-photon photobleaching cross sections of many common dyes might be larger than for one-photon excitation. However, the power dependence at lower intensity (Fig. 4 Inset) indicates a clear two-photon process with slopes in a double-logarithmic plot of 1.97 for Rhodamine green and 1.93 for Texas red. The intensity chosen for the following crosscorrelation measurements is 35 mW, high enough to obtain good photon emission yields η, and staying safely below the photobleaching thresholds. Under these conditions, the measured η are 10.0 kHz/molecule for Rhodamine green and 12.0 kHz/molecule for Texas red if the specific emission filters are removed.
Figure 4.
Plot of η vs. excitation power for both dyes (Rhodamine green ●, Texas red □) at 830 nm. At low power levels, the slope (Inset) is very close to two (1.97 for Rhodamine green and 1.97 for Texas red). Both curves exhibit clear maxima with a subsequent decay because of photobleaching rather than saturation.
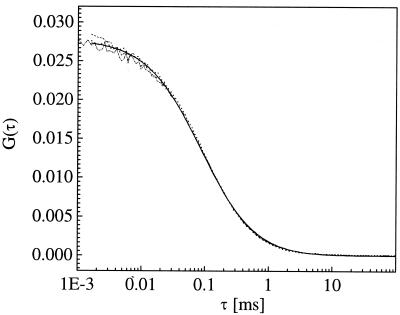
To assure a perfect alignment in the detection pathways, a calibration procedure is chosen as suggested by Schwille et al. (12). Autocorrelation curves in both detection channels are recorded from Rhodamine 6G, a dye excitable at 830 nm, which yields comparable emission both in the green and in the red. As depicted in Fig. 5, the autocorrelation curves can be brought to almost perfect overlap, indicating that the detected volume elements are of the same size. As expected, the crosscorrelation function is basically identical with the two autocorrelation curves, proofing that the two detection volumes perfectly match in the sample space.
Figure 5.
Autocorrelation curves recorded from a test solution of Rhodamine 6G in the “green” (dotted) and “red” (dashed) detection channel and corresponding crosscorrelation curve (dashed-dotted line). The curves are fitted according to Eq. 4 (solid line). It can be verified that the detection volumes are almost identical, since amplitudes and decay times of the curves match.
Test Experiments and Enzymatic Digestion Assay.
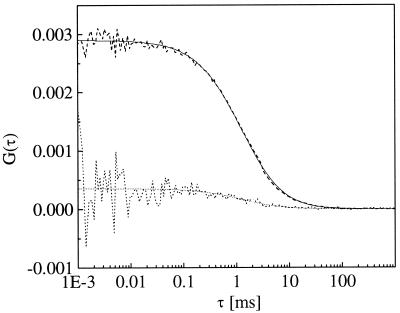
As outlined in Materials and Methods, the amplitude of the crosscorrelation function is in ideally calibrated setups directly proportional to the concentration of double-labeled molecules. In the absence of double-labeled species, Gx(0) equals zero. If there is some crosstalk from the green dye in the red detector, however, a nonspecific crosscorrelation signal remains. To test the specificity of a chosen setup, the amplitude of this crosscorrelation is usually compared with experimental conditions with a maximum fraction of double-labeled species. In the first test experiment, the crosscorrelating sample is achieved by hybridization of equal amounts (125 nM) of Texas red- and Rhodamine green-labeled DNA oligomers, whereas in the negative control for a noncrosscorrelating sample, each labeled oligo-DNA (again 125 nM) was hybridized with its nonlabeled opposite (in 10-fold excess) and pooled 1:1 afterward. Fig. 6 shows the crosscorrelation curves measured for the two limiting cases of fully crosscorrelating and fully noncrosscorrelating samples, determining the dynamic range for the enzymatic cleavage reaction of double-stranded DNA at the same concentrations, as described below. The data collection time for each curve was 3 × 60 s. Under chosen assay conditions, the measured values for red and green emissions are ηii = 1.6 kHz/molecule, ηjj = 3.0 kHz/molecule, with a green–red crosstalk as outlined in Eqs. 6 and 7 of ηij = 0.2 kHz/molecule. These relatively low values, compared with the values for pure dyes in water, as used for the above calibration procedure, are caused by specific emission filter losses but presumably also to buffer effects and quenching by the molecular DNA environment. Nevertheless, the amplitude of the background crosscorrelation curve is less than 10% of the value of the positive sample. This demonstrates a performance of the setup that is comparable and potentially even superior to one-photon optics (12, 14).
Figure 6.
Crosscorrelation curves recorded from a solution of double-labeled (dashed) or a mixture of single-labeled (dotted) DNA target resembling the start and end points of the cleavage reaction. Fits according to Eq. 4 are indicated as solid lines. The difference in correlation amplitudes (factor of 10) marks the dynamic performance of the setup.
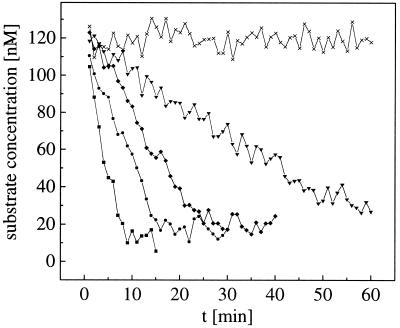
Finally, test measurements of real-time enzyme kinetics, following the scheme proposed by Kettling et al. (14), are measured in the dual-color two-photon setup. The investigated reaction step of enzymatic cleavage converts double-labeled substrate into single-labeled products, accompanied by a loss of crosscorrelating species that can be monitored online by following the amplitude of the crosscorrelation curve. The concentration of uncleaved substrate Cij can be derived easily from Gx(0) at any time, according to Eq. 7. Quantification of enzyme activity could be achieved by measuring at different EcoRI concentrations. The data recording time for each of the crosscorrelation curves in Fig. 7 was 60 s.
Figure 7.
Kinetics of enzymatic cleavage dependent on enzyme concentration (■, 0.25 units/μl; ●, 0.125 u/μl; ⧫, 0.06 u/μl; ▾, 0.03 u/μl; x, negative control). Each data point is the averaged result from a 60-s measurement. The substrate concentration (initially 125 nM) can be derived from the amplitudes of the crosscorrelation functions during the reaction according to Eq. 7.
Conclusions
The design of a dual-color crosscorrelation setup based on simultaneous two-photon excitation of two distinct dyes is outlined and demonstrated. The experimental performance that can be obtained is tested by measuring the kinetics of DNA cleavage by restriction endonuclease EcoRI and found to be at least comparable or even superior to respective one-photon setups using two different excitation lines, in terms of detection specificity.
There are several advantages concerning two-photon excitation in the system described here: first, the two-photon excitation process with a single laser line for both dyes minimizes efforts for optical alignment, because in principle no pinholes are required for detection, and the overlap of excitation volumes is guaranteed. One-laser-line excitation and pinhole-free detection also circumvents the problems of chromatic aberrations, resulting in displaced excitation volumes of different colors (27) if two different laser lines (e.g., green and red) are coupled into nonideally corrected (achromatic) objectives. Further, because of the seemingly different photophysical transitions underlying the two-photon excitation process of used fluorescent dyes, intersystem crossing to the triplet state—an important phenomenon in one-photon FCS experiments (8)—does not seem to play a role, preventing losses of the crosscorrelation signal induced by transient dark states. Because of the high axial resolution in the two-photon excited focal volume element, higher concentrations of labeled substance up to several hundred nanomolars can be observed safely. In addition, a high signal-to-noise ratio allows short analysis times for a sample of a few seconds and below (data not shown). The lower limit of measurement times for discriminating positive from negative samples is currently under investigation. An exciting perspective is given further for intracellular applications of dual-color crosscorrelation analysis, for which two-photon excitation has already been demonstrated to be superior (23), in particular because of its inherent optical sectioning capabilities preventing photodamage in off-focus areas. As previously pointed out (14), the concept of dual-color crosscorrelation can be applied to any association or dissociation process or any reaction where a chemical or physical linkage between two labeled molecules is formed or destroyed, independent of the size of the observed molecule and not limited by a certain distance between the fluorophores, in contrast to other detection methods such as energy transfer approaches.
Prospectively, measurements in living cells with two-photon crosscorrelation should be possible and advantageous, allowing the precise determination of kinetic rates and concentrations of double-labeled molecules or complexes without the need for diffusional analysis in a spatially defined volume element. Because no pinholes are required, a combination with two-photon imaging, by using the same experimental setup and scanning the excitation beam, seems particularly attractive. Further, the simplicity of the described measurement concept as well as the quality of the obtained data suggest a use of this technique in high-throughput screening where short analysis times per sample are required, such as crosscorrelation setups like RAPID FCS (15) or coincidence analysis such as Confocal Fluorescence Coincidence Analysis (16). Particularly interesting is the idea of extending this concept to multicolor two-photon excitation for simultaneous detection and analysis of more than two fluorescent species. Excitation of three or even more suitable fluorophores on a single-molecule scale by monochromatic two-photon excitation is conceivable and thus a topic of further investigations. This might open new ways of addressing questions of complex molecular and cellular processes where more than two compounds are involved and are to be monitored precisely. As an example, multicolor fluorescence correlation spectroscopy would be a most valuable tool in analyzing enzyme kinetics to characterize the Michaelis–Menten complexes or in signal processing where receptor complexes are the objects of interest.
Acknowledgments
We thank Ulrich Kettling, Michael Jahnz, Petra Dittrich, and Flaminia Malvezzi-Campeggi for discussions and Karin Birkenfeld for assistance in sample preparation. Financial support by the German Ministry for Education and Research (Biofuture Grant No. 0311845) and Evotec BioSystems AG, Hamburg, Germany, is gratefully acknowledged.
Abbreviations
- FCS
fluorescence correlation spectroscopy
- 2PE
two-photon excitation
Footnotes
Article published online before print: Proc. Natl. Acad. Sci. USA, 10.1073/pnas.180317197.
Article and publication date are at www.pnas.org/cgi/doi/10.1073/pnas.180317197
References
- 1.Magde D, Elson E L, Webb W W. Phys Rev Lett. 1972;29:705–708. [Google Scholar]
- 2.Rigler R, Mets Ü, Widengren J, Kask P. Eur Biophys J. 1993;22:169–175. [Google Scholar]
- 3.Eigen M, Rigler R. Proc Natl Acad Sci USA. 1994;91:5740–5747. doi: 10.1073/pnas.91.13.5740. [DOI] [PMC free article] [PubMed] [Google Scholar]
- 4.Nie S, Zare R N. Annu Rev Biophys Biomol Struct. 1997;26:567–596. doi: 10.1146/annurev.biophys.26.1.567. [DOI] [PubMed] [Google Scholar]
- 5.Xie X S, Trautman J K. Annu Rev Phys Chem. 1998;49:441–480. doi: 10.1146/annurev.physchem.49.1.441. [DOI] [PubMed] [Google Scholar]
- 6.Weiss S. Science. 1999;283:1676–1683. doi: 10.1126/science.283.5408.1676. [DOI] [PubMed] [Google Scholar]
- 7.Ambrose W P, Goodwin P M, Jett J H, Van Orden A, Werner J H, Keller R A. Chem Rev. 1999;99:2929–2956. doi: 10.1021/cr980132z. [DOI] [PubMed] [Google Scholar]
- 8.Widengren J, Mets Ü, Rigler R. J Chem Phys. 1995;99:13368–13379. [Google Scholar]
- 9.Rauer B, Neumann E, Widengren J, Rigler R. Biophys Chem. 1996;58:3–12. doi: 10.1016/0301-4622(95)00080-1. [DOI] [PubMed] [Google Scholar]
- 10.Schwille P, Bieschke J, Oehlenschläger F. Biophys Chem. 1997;66:211–228. doi: 10.1016/s0301-4622(97)00061-6. [DOI] [PubMed] [Google Scholar]
- 11.Schwille P, Kummer S, Heikal A A, Moerner W E, Webb W W. Proc Natl Acad Sci USA. 2000;97:151–156. doi: 10.1073/pnas.97.1.151. [DOI] [PMC free article] [PubMed] [Google Scholar]
- 12.Schwille P, Meyer-Almes F-J, Rigler R. Biophys J. 1997;72:1878–1886. doi: 10.1016/S0006-3495(97)78833-7. [DOI] [PMC free article] [PubMed] [Google Scholar]
- 13.Schwille P. In: Fluorescence Correlation Spectroscopy. Theory and Applications. Elson E L, Rigler R, editors. Heidelberg: Springer; 2000. , in press. [Google Scholar]
- 14.Kettling U, Koltermann A, Schwille P, Eigen M. Proc Natl Acad Sci USA. 1998;95:14116–14120. doi: 10.1073/pnas.95.4.1416. [DOI] [PMC free article] [PubMed] [Google Scholar]
- 15.Koltermann A, Kettling U, Bieschke J, Winkler T, Eigen M. Proc Natl Acad Sci USA. 1998;95:1421–1426. doi: 10.1073/pnas.95.4.1421. [DOI] [PMC free article] [PubMed] [Google Scholar]
- 16.Winkler T, Kettling U, Koltermann A, Eigen M. Proc Natl Acad Sci USA. 1999;96:1375–1378. doi: 10.1073/pnas.96.4.1375. [DOI] [PMC free article] [PubMed] [Google Scholar]
- 17.Denk W, Strickler J H, Webb W W. Science. 1990;248:73–76. doi: 10.1126/science.2321027. [DOI] [PubMed] [Google Scholar]
- 18.Williams R M, Piston D, Webb W W. FASEB J. 1994;8:804–813. doi: 10.1096/fasebj.8.11.8070629. [DOI] [PubMed] [Google Scholar]
- 19.Mertz J, Xu C, Webb W W. Opt Lett. 1995;20:2532–2534. doi: 10.1364/ol.20.002532. [DOI] [PubMed] [Google Scholar]
- 20.Sanchez E J, Novotny L, Holtom G R, Xie X S. J Phys Chem A. 1997;101:7019–7023. [Google Scholar]
- 21.Berland K M, So P T C, Gratton E. Biophys J. 1995;68:694–701. doi: 10.1016/S0006-3495(95)80230-4. [DOI] [PMC free article] [PubMed] [Google Scholar]
- 22.Brand L, Eggeling C, Zander C, Drexhage K H, Seidel C A M. J Phys Chem A. 1997;101:4313–4321. [Google Scholar]
- 23.Schwille P, Haupts U, Maiti S, Webb W W. Biophys J. 1999;77:2251–2265. doi: 10.1016/S0006-3495(99)77065-7. [DOI] [PMC free article] [PubMed] [Google Scholar]
- 24.Xu C, Zipfel W, Shear J B, Williams R M, Webb W W. Proc Natl Acad Sci USA. 1996;93:10763–10768. doi: 10.1073/pnas.93.20.10763. [DOI] [PMC free article] [PubMed] [Google Scholar]
- 25.Xu C, Webb W W. In: Topics in Fluorescence Spectroscopy 5. Lakowicz J, editor. New York: Plenum; 1997. [Google Scholar]
- 26.Koppel D E. Phys Rev A. 1974;10:1938–1945. [Google Scholar]
- 27.Dunn K W, Wang E. BioTechniques. 2000;28:542–550. doi: 10.2144/00283rr03. [DOI] [PubMed] [Google Scholar]


