

ABSTRACT
Background
Viral lower respiratory tract infections (LRTIs) can reduce the severity of subsequent LRTIs but have also been linked to respiratory allergy development and exacerbation. Here, we show that viral LRTI can imprint lung epithelial cells (LECs), leading to prolonged phenotypic and functional changes.
Methods
Mice were infected via intranasal administration of respiratory syncytial virus (RSV). After 28 days, LECs were isolated using cold dispase digestion followed by magnetic‐activated cell sorting. Epigenetic changes were assessed using Cleavage Under Targets and Release Using Nuclease (CUT&RUN), while transcriptional changes were evaluated using NanoString and qPCR. Flow cytometry was employed to measure cell surface major histocompatibility complex (MHC) levels, antigen uptake and processing rates, and OT‐I cell proliferation after antigen presentation.
Results
We identified epigenetic and transcriptomic changes in murine LECs 28 days after RSV infection, especially impacting genes associated with MHC. Lasting upregulation of MHC‐I and MHC‐II was further increased following in vivo LPS stimulation. Importantly, MHC upregulation was associated with increased antigen uptake and processing, as well as increased antigen presentation to T cells.
Conclusions
Our data demonstrate that RSV can induce prolonged upregulation of antigen presentation by LECs, with the potential to facilitate local T cell responses to microbial antigens and allergens and to enhance immunity or in susceptible hosts respiratory allergy.
Keywords: epigenetic imprinting, epithelial memory, lung epithelial cells, respiratory viral infection, RSV
RSV infection induces lasting epigenetic and transcriptional changes in LECs, upregulating MHC‐I and MHC‐II, further amplified by LPS exposure.
This is accompanied by increased antigen uptake, processing, and presentation.
These persistent alterations may influence immune responses, potentially impacting both immunity to infection and respiratory allergy development.
Abbreviations: IF, immunofluorescent; LECs, lung epithelial cells; LPS, lipopolysaccharide; MHC, major histocompatibility complex; PBS, phosphate buffered saline; RSV, respiratory syncytial virus.

1. Introduction
Viral lower respiratory tract infections (LRTI) including by rhinovirus [1], human metapneumovirus [2] and respiratory syncytial virus (RSV) [3, 4] are linked to the development and exacerbation [5, 6] of allergic airway disease but can also protect from subsequent respiratory infections [7, 8]. While multiple genetic, epigenetic, and environmental factors predisposing to allergic airway disease development have been described [9, 10], the underlying cellular and molecular mechanisms are still unclear. Historically, respiratory epithelial cells were viewed primarily as a relatively inert barrier at the interface of environment and host; however, in recent years, their importance in orchestrating initial innate immune responses has been recognized [11, 12]. Given their relatively long lifespan [13] and findings such as those by Byers et al. (2013), which demonstrated that lung epithelial progenitor cells maintain IL‐33 production after Sendai virus infection [14], and Naik et al. (2017), which showed skin epithelial cells retain a memory of inflammation [15], we hypothesized that viral LRTI can induce prolonged changes in lung epithelial cells (LECs). These changes might affect responses to future infections and allergen exposure. We used an established mouse model of RSV infection [16, 17, 18] to investigate prolonged changes in LECs following viral clearance. Here, we reveal epigenetic and transcriptomic changes in genes primarily associated with major histocompatibility complexes (MHC) and antigen processing that persist for a prolonged period after RSV infection. LECs also maintained elevated levels of both MHC‐I and MHC‐II, with further enhancement after stimulation with lipopolysaccharide (LPS). These prolonged changes were associated with increases in antigen uptake, processing, and presentation to T cells.
2. Materials and Methods
2.1. RSV Stock and Immunoplaque Assay
RSV A2 (kindly provided by Dr. James Harker, Imperial College London) was expanded in Hep‐2 cells as previously described [19]. Once a 10%–20% drop in confluency and syncytia were observed throughout, cells were sonicated, and the virus was harvested. RSV titers were assessed using an immunoplaque assay. Plaque‐forming units (PFU/ml) were calculated based on the average plaque count and a dilution factor.
2.2. Animals and Animal Procedures
Wild‐type female BALB/c and C57BL/6J mice were procured from Charles River Laboratories. Mice were acclimatized for 1 week before experimental use. OT‐I mice were imported from the CRUK Beatson Institute, Glasgow. Both male and female OT‐I mice ranging from two to 6 months old were used for OT‐I cell harvest. Mice were housed in individually ventilated cages. Animal work was carried out under the regulations of the Animals (Scientific Procedures) Act 1986. All procedures were approved by the University of Edinburgh Animal Welfare and Ethical Review Board and performed under UK Home Office licenses with institutional oversight performed by qualified veterinarians. UK Home Office project license to JS, number PP4544912. ARRIVE 2.0 guidelines were followed where applicable.
6‐week‐old BALB/c or C57BL/6J mice were administered 50 μL of 5 × 10⁶/ml RSV A2 intranasally under light anesthesia (inhaled isoflurane). Alternatively, mice were administered 50 μL of PBS (w/o Ca2+ and Mg2+) or UV‐irradiated RSV (using SPECTROLINKER XL‐1500 at 2 J/cm2). After 28 days, mice were either processed as described below or intranasally administered 50 μL PBS (w/o Ca2+ and Mg2+) or 10 μg of LPS (Sigma‐Aldrich, USA, E. coli O111:b4) in 50 μL PBS either 6 h or 24 h before further processing as described below.
2.3. Murine Lung Harvest and Processing
Murine lungs were harvested and processed as previously described [20]. In brief, lungs were inflated with ice‐cold 1.5‐2 mL enzyme mix (DMEM/F12 (Gibco, USA) + 100 U/mL Pen/Strep (Gibco, USA) + 2 mg/mL Dispase II (Sigma‐Aldrich, USA) + 0.1 mg/mL DNaseI (Sigma‐Aldrich, USA)). Lungs were then incubated at 4°C–6°C for 20 h. After incubation, lungs were passed through 70 and 30 μm strainers, and red blood cells (RBC) were lysed for 2 min using ACK RBC lysis buffer (Gibco, USA). Cells were resuspended in MACS buffer (PBS w/o Mg2+ and Ca2+ +0.5% bovine serum albumin (BSA) (Sigma‐Aldrich, USA) + 2 mM EDTA (Gibco, USA) + 100 U/mL Pen/Strep (Gibco, USA)). Cells were then either resuspended in the appropriate media for in vitro culture (discussed below) or incubated with 5 μL/1 mL/lung antimouse CD16/32 antibody (BioLegend, USA) for 30 min at 4°C before further processing.
2.4. Isolation of Lung Epithelial Cells
LECs were MACS‐isolated as previously described [20]. In brief, up to 107 cells were incubated with 5 μL anti‐CD31 microbeads and 10 μL of anti‐CD45 microbeads (Miltenyi Biotec, Germany), followed by LS column magnetic isolation. Flowthrough cells were incubated with 15 μL of anti‐EpCAM microbeads (Miltenyi Biotec, Germany) followed by magnetic isolation with MS columns. CD45‐CD31‐EpCAM+ LECs were then flushed out from MS columns with a plunger, and their purity (> 97%) was assessed using flow cytometry (Figure S1).
2.5. Cleavage Under Targets and Release Using Nuclease (CUT&RUN)
2 × 10⁵ of MACS‐sorted murine LECs from a pool of three mice were used per single CUT&RUN reaction. Unless specified otherwise, samples were kept at 4°C. Cells were washed twice using PBS with 600 × g centrifugation steps in between each wash. Cells were then incubated in 10% Triton X‐100 (Sigma‐Aldrich, USA) for 10 min to isolate nuclei. Nuclei were pelleted following 1300 × g centrifugation for 5 min and resuspended in wash buffer. Following nuclear isolation, a CUT&RUN protocol [21] was followed. In brief, nuclei were bound to BioMag Plus Concavalin A beads (Bangs Laboratories, USA) and resuspended in antibody buffer containing either anti‐H3K27ac (1:100, Active Motif, USA), anti‐H3K4me3 (1:100, Sigma‐Aldrich, USA) or normal rabbit IgG (1:100, Cell Signalling Technology, USA). Following overnight incubation, nuclei were washed thrice with wash buffer and incubated with protein A/G‐MNase (VIB Protein Core, kindly provided by Prof. Martin Guilliams) for 1 h while rotating. Chromatin digestion and release were performed using the high Ca2+/low salt method followed by phenol/chloroform extraction. DNA was stored at −20°C until further processing. KAPA Prep Kit (Roche, Switzerland) and KAPA UDI adapter kit (Roche, Switzerland) were used for library preparations per manufacturer's instructions. In brief, end repair 5′ phosphorylation (20°C, 30 min), dA‐tailing (58°C, 45 min) and adapter ligation (20°C, 60 min) were followed by un‐ligated adapter removal with 1.1 × volume of AMPure XP beads (Beckman Coulter, USA). Libraries were amplified over 12 cycles in the thermocycler using KAPA HiFi HotStart ReadyMix and 5 μM Pre‐LM‐PCR Oligo 1 & 2 (Roche, Switzerland). Following amplification, another 3‐step adapter removal with AMPure XP beads was carried out. Samples were quality controlled using LabChip GX DNA High Sensitivity (Caliper Life Sciences, USA) according to manufacturer's instructions.
Libraries were then submitted to Azenta Life Sciences for next generation sequencing using 2 × 150bp configuration at 5 × 10⁶ reads per sample. FASTQ sequencing files were uploaded to Galaxy platform [22] for QC using FastQC [23] and sequence trimming using Trimmomatic [24], followed by sequence alignment to mm10 mouse reference genome using Bowtie2 [25]. Next, the bamCoverage [26] tool was used to generate bin size 5 read coverage .bam files, followed by peak calling using Sparse Enrichment Analysis for CUT&RUN (SEACR) [27]. Default settings were used for all Galaxy platform tools. Bowtie2 and SEACR files were exported and analyzed further using R Studio R4.3.1. Defined package [28] (release. 3.14) to identify differentially bound sites (DBS). When using dba.count function duplicate reads were not removed (bRemoveDuplicates = F), peaks were resized to center around their summits (summits = T) and no peaks were filtered out based on read count (filter = 0). Normalization was performed using the dba.normalize command (method = DBA_DESEQ2, normalize = DBA_NORM_NATIVE). Contrast between the groups was performed using dba.analyze with problematic regions removed using ENCODE Blacklist database [29] (bBlacklist = T), while statistical discovery of significant DBS was carried out using DESeq2 [30] (method = DBA_DESEQ2). All other parameters in the DiffBind package were set to default. Gene annotation and genomic annotation (TxDb.Mmusculus.UCSC.mm10.knownGene) were carried out using ChIPSeeker [31] (release 1.4), while gene ontology (GO) analysis was carried out using ClusterProfiler [32] (release 4.12). DBS within +/−3 kb of TSS were visualized using deeptools (v.3.5.4). bigWig files were generated from bam files using bamCoverage (−binSize 10 ‐normalizeUsing RPGC ‐effectiveGenomeSize 2,150,570,000 –extendReads). Scores of genomic regions in proximity to differentially accessible peaks were calculated using computeMatrix (−referencePoint TSS, ‒afterRegionStartLength 3000 ‒beforeRegionStartLength 3000) and heatmaps were visualized using plotHeatmap.
2.6. RNA Extraction
RNA was extracted as previously described [20]. In brief, 100 μL of bromochloropropane (Sigma‐Aldrich, USA) was added to cells treated with TRizol (Life Technologies, USA), followed by 16,000 × g at 4°C for 20 min centrifugation and RNA precipitation using isopropanol. RNA pellets were then washed three times using 70% EtOH. After determining RNA concentration, samples were normalized using RNase‐free H2O, followed by treatment with DNase I (QIAGEN, Germany) as per the manufacturer's instructions to remove genomic DNA.
2.7. NanoString
All RNA samples were determined to be of high quality by RNA 6000 Pico Assay (Agilent, USA), with > 80% DV200. RNA from two mice was pooled to generate a single sample. Each sample was normalized to 20 ng/μl, and 8 μL/sample of RNA was profiled using Nanostring nCounter Mouse Immunology Panel according to the manufacturer's instructions. NanoString data were analyzed using “NanoTube” package [33] (release 3.18) in RStudio R4.3.1 as previously described [34]. The bgPval was set to 0.01 and the number of unwanted factors (k) was set to 3, while the remaining normalization parameters were set to default. Results are considered significant for FDR values of < 0.05.
2.8. qPCR
qPCRs using TaqMan probes (Table 1) were performed as previously described [20]. Each sample was normalized to the appropriate endogenous control within the reaction, and log2FC was calculated using the ΔΔCt method. Appropriate endogenous controls were selected using the “NormFinder” package [35] (release 0.1.2). Oaz1 and Gapdh were identified as the most stably expressed endogenous controls between experimental groups (Table S1). Oaz1 was used for low‐expressed targets, while Gapdh was used for highly expressed targets. Custom primers were used for measuring RSV L‐gene. Forward' RSV L‐gene primer: GAACTCAGTGTAGGTAGAATGTTTGCA. Reverse 3′ L‐gene primer: TTTCAGCTATCATTTTCTCTGCCAAT. RSV L‐gene TaqMan probe: (FAM) TTTGAACCTGTCTGAACATTCCCGGTT (TAMRA). qPCR data are presented as log2FC relative to the PBS sample.
TABLE 1.
TaqMan qPCR probe details.
| Target | Species | Probe | Assay ID | Catalogue number | Endogenous control |
|---|---|---|---|---|---|
| Gapdh | Mouse | VIC‐MGB | Mm99999915_g1 | 4,448,489 | NA |
| Oaz1 | Mouse | VIC‐MGB | Mm07307469_g1 | 4,448,489 | NA |
| H2‐DMb2 | Mouse | FAM‐MGB | Mm00783707_s1 | 4,331,182 | Oaz1 |
| B2m | Mouse | FAM‐MGB | Mm00437762_m1 | 4,331,182 | Gapdh |
| H2‐Ab1 | Mouse | FAM‐MGB | Mm00439216_m1 | 4,331,182 | Gapdh |
| H2‐Eb1 | Mouse | FAM‐MGB | Mm00439221_m1 | 4,331,182 | Oaz1 |
| Casp4 | Mouse | FAM‐MGB | Mm00432304_m1 | 4,331,182 | Oaz1 |
| Psmb9 | Mouse | FAM‐MGB | Mm00479004_m1 | 4,331,182 | Oaz1 |
| Tap1 | Mouse | FAM‐MGB | Mm00443188_m1 | 4,331,182 | Oaz1 |
2.9. Confocal Immunofluorescent Microscopy
Murine lungs were inflated using 0.8 mL of a 1:1 PBS/OCT mixture and placed in antigenfix (Diapath, Italy) for 45 min at RT. Lungs were then washed twice using PBS and placed in a 34% sucrose solution for 24 h at 4°C. Lungs were snap frozen in OCT and sliced (7 μm sections). Following rehydration, sections were incubated in 100 μL of blocking buffer (Tween‐20, 2% BSA, 5% FBS (LabTech, UK), 2% mouse serum (Thermo Fisher Scientific, USA) and 5% normal goat serum (Thermo Fisher Scientific, USA) in PBS) for 1.5 h at RT in a humidity chamber. Fluorochrome‐conjugated antibodies (1:400 anti‐EpCAM‐AF594, 1:200 anti‐MHC‐I‐AF647 and 1:400 anti‐MHC‐II‐AF488 (BioLegend, USA)) were diluted in blocking buffer, and 100 μL of staining mix was placed on each section for 1 h at RT. Slides were imaged using a Leica SP8 confocal microscope with a 20 × /0.75 objective without immersion or a 40 × /1.3 objective with oil immersion. A minimum of 3 fields of view were captured per section. Images were imported into Fiji, and nuclear StarDist [36] segmentation refined by EpCAM expression stratifying to the airway (EpCAMhigh) and alveolar (EpCAMlow) regions was carried out (Figure S2). The mean fluorescence intensity of MHC‐I (AF647) and MHC‐II (AF488) channels was measured for each section. Segmentation was visually assessed, and each section with incorrect segmentation was eliminated from further analysis (in total 7 sections were removed out of the 84 sections imaged).
2.10. Flow Cytometry
Staining for flow cytometry analysis was performed as previously described [20]. In brief, following incubation with anti‐CD16/32 antibody, cells were stained using a LIVE/DEAD fixable near‐IR stain (Invitrogen, USA), followed by staining with the appropriate antibody cocktail (Table 2). For intracellular TLR4 staining, the eBioscience Foxp3/Transcription Factor Staining Buffer Set (Invitrogen) was used according to the manufacturer's protocol. Samples were unmixed (with multiple autofluorescence extraction) using Cytek Aurora with Cytek SpectroFlo 3.3 and analyzed using De Novo Software FCSexpress 7. The gating strategy involved debris exclusion (side scatter/forward scatter—SSC‐H/FSC‐H), followed by singlet selection (FSC‐H/FSC‐A), RBC exclusion (SSC‐H/SSC‐B‐H) and dead cell exclusion (LIVE/DEAD Fixable Near‐IR/FSC‐H), followed by further experiment‐specific gating (Figure S3, Figure S4). Flow cytometry data are presented as fold change relative to the average median fluorescence intensity (MFI) of PBS samples. We validated our EpCAM stratification strategy to airway and alveolar LECs using CD49f (airway epithelial marker [37]), MHC‐II (pneumocyte marker [38]), and CD24 (conducting airways marker [39]) (Figure S5).
TABLE 2.
Flow cytometry antibodies.
| Antibody name | Supplier | Host species | Antibody type | Clone | Catalogue number | Antibody Registry ID | Dilution |
|---|---|---|---|---|---|---|---|
| Anti‐CD45 Pacific Blue | BioLegend | Rat | Monoclonal | S18009F | 157,212 | AB_2876534 | 1:200 |
| Anti‐CD45 AF700 | BioLegend | Rat | Monoclonal | S18009F | 157,210 | AB_2860730 | 1:200 |
| Anti‐CD31 BV605 | BioLegend | Rat | Monoclonal | 390 | 102,427 | AB_2563982 | 1:600 |
| Anti‐CD31 BV421 | BioLegend | Rat | Monoclonal | 390 | 102,423 | AB_2562186 | 1:300 |
| Anti‐EpCAM PE/Dazzle594 | BioLegend | Rat | Monoclonal | G8.8 | 118,236 | AB_2632777 | 1:300/1:150 |
| Anti‐EpCAM FITC | BioLegend | Rat | Monoclonal | G8.8 | 118,207 | AB_1134106 | 1:200 |
| Anti‐EpCAM BV605 | BioLegend | Rat | Monoclonal | G8.8 | 118,227 | AB_2563984 | 1:300 |
| Anti‐MHC‐I (H2kd/H2Dd) AF647 | BioLegend | Mouse | Monoclonal | 34–1‐2S | 114,712 | AB_493063 | 1:500 |
| Anti‐MHC‐I (H2Kb) AF647 | BioLegend | Mouse | Monoclonal | AF6‐88.5 | 116,511 | AB_492918 | 1:500 |
| Anti‐ I‐A/I‐E (MHC‐II) AF488 | BioLegend | Rat | Monoclonal | M5/114.15.2 | 107,616 | AB_493523 | 1:500 |
| Anti‐MHC‐II PerCP‐Cy5.5 | BioLegend | Rat | Monoclonal | M5/114.15.2 | 107,625 | AB_2191071 | 1:500 |
| Anti‐TLR4 PE‐Cy7 | BioLegend | Rat | Monoclonal | MTS510 | 117,609 | AB_2044019 | 1:125 |
| Anti‐CD3 BV750 | BioLegend | Rat | Monoclonal | 17A2 | 100,249 | AB_2734148 | 1:100 |
| Anti‐CD4 BV605 | BioLegend | Rat | Monoclonal | RM4‐5 | 100,547 | AB_11125962 | 1:200 |
| Anti‐CD8a PerCP/Cy.5.5 | BioLegend | Rat | Monoclonal | 53–6.7 | 100,733 | AB_2075239 | 1:100 |
| Anti‐CD69 PE | BioLegend | Hamster | Monoclonal | H1.2F3 | 104,507 | AB_313110 | 1:100 |
| Anti‐CD24 PE/Cyanine7 | BioLegend | Rat | Monoclonal | M1/69 | 101,821 | AB_756048 | 1:200 |
| Anti‐CD49f PE‐Dazzle594 | BioLegend | Rat | Monoclonal | GoH3 | 313,625 | AB_2616782 | 1:100 |
| CD19 PB | BioLegend | Rat | Monoclonal | 6D5 | 115,526 | AB_493341 | 1:50 |
| CD26 PE‐Cy7 | BioLegend | Rat | Monoclonal | H194‐112 | 137,809 | AB_2564312 | 1:125 |
| FceR1 AF647 | BioLegend | Hamster | Monoclonal | MAR1 | 134,309 | AB_1626097 | 1:50 |
| CD3 BV750 | BioLegend | Rat | Monoclonal | 17A2 | 100,249 | AB_2734148 | 1:250 |
| CD64 BV711 | BioLegend | Mouse | Monoclonal | X54‐5/7.1 | 139,311 | AB_2563846 | 1:250 |
| CD11b BV570 | BioLegend | Rat | Monoclonal | M1/70 | 101,233 | AB_1089694 | 1:125 |
| CD8a PerCP‐Cy5.5 | BioLegend | Rat | Monoclonal | 53–6.7 | 100,733 | AB_2075239 | 1:125 |
| SiglecF PE/Dazzle594 | BioLegend | Rat | Monoclonal | S17007L | 155,529 | AB_2890716 | 1:125 |
| CD172a (sirpa) FITC | BioLegend | Rat | Monoclonal | P84 | 144,005 | AB_11204432 | 1:50 |
| MerTK PE | BioLegend | Rat | Monoclonal | 2B10C42 | 151,505 | AB_2617037 | 1:125 |
| XCR1 APC | BioLegend | Mouse | Monoclonal | ZET | 148,205 | AB_2563932 | 1:125 |
| MHCII AF700 | BioLegend | Rat | Monoclonal | M5/114.15.2 | 107,621 | AB_3208338 | 1:50 |
| CD45 BV510 | BioLegend | Rat | Monoclonal | 30‐F11 | 103,137 | AB_2563061 | 1:125 |
| CD4 BV605 | BioLegend | Rat | Monoclonal | RM4‐5 | 100,547 | AB_2921040 | 1:125 |
| Ly6C BV650 | BioLegend | Rat | Monoclonal | HK1.4 | 128,049 | AB_2800630 | 1:250 |
| CD11c BV785 | BioLegend | Hamster | Monoclonal | N418 | 117,335 | AB_2565268 | 1:125 |
| Ly6G BV421 | BioLegend | Rat | Monoclonal | 1A8 | 127,627 | AB_2562567 | 1:125 |
| CD49b BV480 | BD Biosciences | Hamster | Monoclonal | HMalfa2 | 746,355 | AB_2743674 | 1:250 |
2.11. Antigen Uptake and Processing Assays
Following lung harvest and LEC isolation, 1 × 10⁶ live cells (as determined by trypan blue) were resuspended in 180 μL of prewarmed serum‐free PromoCell Airway Epithelial Growth Medium. Following the addition of 20 μL of OVA‐AF647 (Invitrogen, USA) and DQ‐OVA (Invitrogen, USA)) at a final concentration of 10 μg/mL, cells were incubated at 37°C, 5% CO2 for 1 or 4 h. All samples were collected simultaneously for further antibody staining and flow cytometric analysis (as described above).
2.12. T‐Cell Proliferation Assays
Isolated LECs were placed in complete T‐cell media (RPMI +10% FBS + 1% L‐Glu + 100 U/mL Pen/Strep +1% MEM NEAA +1% Na‐Pyruvate +0.1% 2‐mercaptoethanol) (Gibco, USA) and SIINFEKL peptide (InvivoGen, USA) at 25 μg/mL for 4 h at 37°C 5% CO2. Meanwhile, inguinal, mesenteric, brachial, axillary, and superficial cervical lymph nodes (LNs) were harvested from OT‐I mice into cold complete T‐cell media. Lymph nodes were mashed and then processed using the lung harvest and processing protocol as described above. The CD8 T‐cell MojoSort (BioLegend, USA) protocol was followed for negative sorting of CD8+ T‐cells. Up to 5 × 10⁷ labelled cells were placed in the Miltenyi LS column on the OctaMACS magnet. Flowthrough containing CD8+ T cells was collected, and cells were stained with 1:5000 CFSE (Invitrogen, USA) according to the manufacturer's instructions. 1 × 10⁵ OT‐I CD8+ cells were added per 2 × 10⁴ LECs in a 96 round‐bottom well plate. Cells were co‐cultured in 200 μL complete T‐cell media for 72 h at 37°C 5% CO2, followed by antibody staining and flow cytometric analysis as described above (Figure S4). The proliferation index was calculated as the average number of cells that an initial cell became.
2.13. Data Presentation and Statistical Analysis
Data are represented as violin, split violin, scatter, or dot plots generated using “ggplot2” package [40] (release 3.18). “webr” package (release 0.1.5) was used to create donut charts, and “UpSetR” package (release 1.4.0) [41] was used to create an UpSet plot. Dark shaded areas represent the actual distribution of data, while lightly shaded areas represent the predicted probability density. Solid lines represent the median, while dashed lines represent the 0, 25th, 75th, and 100th percentile quartiles. R studio “rstatix” package [42] (release 0.7.2) was used for statistical analysis. The normality of the data was assessed using the Shapiro–Wilk test. For single‐variable analysis, a One‐Way ANOVA was employed, followed by the Holm post hoc test for multiple comparisons (where more than two groups were present). For dual‐variable analysis of multiple groups, a Two‐Way ANOVA was employed, followed by the Holm post hoc test for multiple comparisons. Statistical comparisons were added to plots using “ggpubr” package [42] (release 0.6.0).
3. Results
3.1. RSV Infection Results in Prolonged Epigenetic and Transcriptional Changes in LECs
To test our hypothesis that RSV infection results in prolonged changes in LECs, we employed a murine model of RSV infection and investigated epigenetic and transcriptomic changes long after viral clearance (Figure S6). Specifically, we focused on a timepoint 28 days post RSV infection (28dpRSV) given that RSV is cleared within 7 days, and therefore the virus had been cleared at least 3 weeks prior [43, 44, 45] (Figure 1A). First, to interrogate potential prolonged epigenetic changes, we performed CUT&RUN of histone 3 lysine 4 trimethylation (H3K4me3) and histone 3 lysine 27 acetylation (H3K27ac); both histone modifications are associated with transcriptional activation when present within the regulatory region of a gene [46, 47, 48]. We discovered 166 differentially bound sites (DBS) for histone modification H3K27ac and 31 dB for H3K4me3 in LECs 28dpRSV compared with controls (Figure 1B,C, Table S2). Importantly, the vast majority of identified DBS were associated with regulatory elements of corresponding genes; more than 72% of H3K27ac and 90% of H3K4me3 DBS were identified in promoter regions, suggesting that observed changes in histone modification enrichment may be functional (Figure 1D). Although both enriched and depleted DBS were identified, only enriched DBS exhibited strong statistical significance and magnitude of change (Figure 1E). Gene ontology term analysis identified viral and interferon responses, and several pathways related to major histocompatibility complexes (MHC) and antigen processing (Figure 1F).
FIGURE 1.
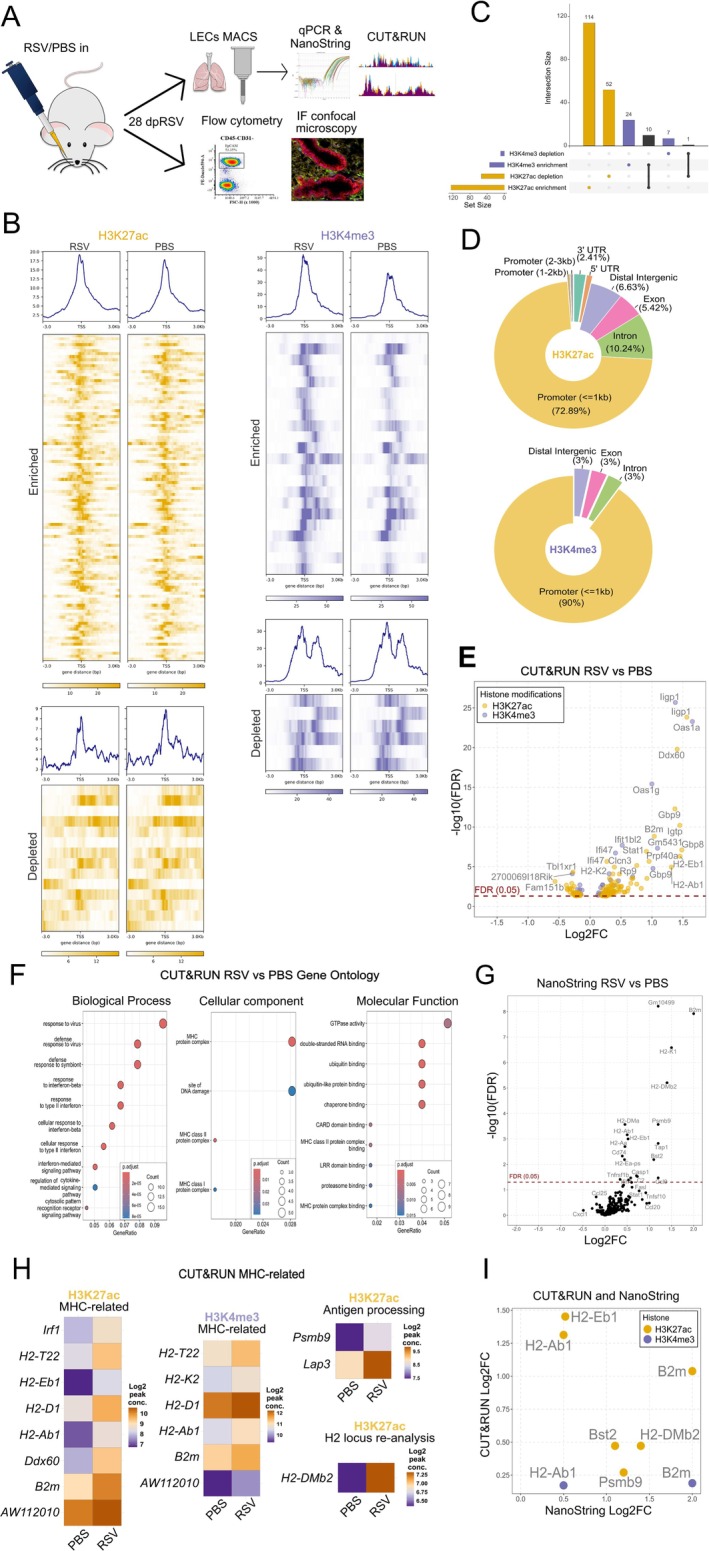
RSV causes prolonged epigenetic and transcriptional changes in LECs. (A) Experimental design. 6‐week‐old female BALB/c mice were administered RSV or PBS intranasally. After 28 days, mice were culled and lung epithelial cells were MACS‐sorted for NanoString or CUT&RUN analysis, or lungs were harvested for confocal immunofluorescence microscopy or flow cytometry analysis. (B) CUT&RUN peak profile heatmaps of significant differentially bound H3K4me3 and H3K27ac histone modifications—8 kb window. (C) UpSet plot of identified enriched and depleted DBS for H3K4me3 and H3K27ac (D) Pie charts of annotated genomic distribution of identified DBS for H3K4me3 and H2K27ac. (E) Volcano plot of genes associated with H3K4me3 and H3K27ac that were differentially bound in the RSV group as compared to the PBS group (FDR < 0.05, x axis shows a log2FC in enrichment/depletion for each histone modification, while y axis shows a ‐log10 FDR values). (F) Dot plot graph of gene ontology (GO) term enrichment for combined H3K4me3 and H3K27ac. GO terms were stratified based on one of three sub‐ontologies: Biological process (BP), cellular component (CC) and molecular function (MF). Surface area of each dot corresponds to the number of genes assigned to each term, while color levels correspond to the statistical significance of the discovered term. Gene Ratio on the x axis is a ratio of genes identified per GO term over the total number of genes assigned to that term. (G) Volcano plot of differentially expressed LEC genes 28dpRSV identified by NanoString nCounter mouse Immunology panel in the RSV group as compared to the PBS group. The x axis shows a log2FC in expression, while the y axis shows ‐log10 FDR values. (H) Heatmaps of relevant MHC or antigen processing‐related genes identified by CUT&RUN that were enriched in the RSV group. The murine H2 locus was re‐analyzed, resulting in identification of one additional, previously unreported target—H2‐DMb2. Log2 peak conc is a mean read concentration for the sample in each given group. (I) Scatter plot of all overlapping targets identified by both CUT&RUN and NanoString 28dpRSV. The y axis shows log2FC in histone enrichment, and the x axis shows the corresponding log2FC in gene expression, as identified by NanoString. CUT&RUN n = 4 per group. NanoString n = 6 per group. Each CUT&RUN sample is a pool of three mice, and each NanoString sample is a pool of two mice. Each experiment was performed twice.
Next, to determine the impact of RSV infection on the transcriptional profile of LECs, we used a NanoString Immunology panel. We discovered 19 differentially expressed genes; strikingly, eleven of those were associated with both classes of MHC and antigen processing (Figure 1G). This led us to reassess the CUT&RUN data in the context of MHC‐related genes. Of the 197 significant DBS, eight H3K27ac and six H3K4me3 were associated with MHC biology, while two H3K27ac DBS were associated with antigen processing (Figure 1H). Additionally, CUT&RUN analysis specifically within the H2 locus, where the majority of MHC‐related genes are located [49], revealed a single novel enriched H3K27ac DBS in the promoter of H2‐DMb2. There was also an overlap between prolonged epigenetic and transcriptomic changes. Six genes identified as differentially enriched by CUT&RUN were also differentially expressed (FDR < 0.05) in NanoString data (Figure 1I). Five of the genes are associated with MHC and antigen processing, while one gene, Bst2, is thought to be involved in antiviral responses [50]. Taken together, these data demonstrate that RSV infection results in prolonged transcriptional and epigenetic effects on LECs.
3.2. RSV Infection Alters the Expression of MHC and Associated Apparatus by LECs
Following the identification of several differentially expressed and histone‐modified MHC‐related genes, we validated the upregulation of several representative genes by qPCR (Figure 2A). We further used confocal microscopy to validate MHC upregulation at the protein level (Figure 2B,C), finding higher levels of both MHC‐I and MHC‐II in the airway and alveolar compartments 28dpRSV. Finally, MHC expression was assessed at single‐cell level by flow cytometry, which confirmed that CD45‐CD31‐EpCAMhigh airway LECs and CD45‐CD31‐EpCAMlow alveolar LECs (Figure S5) had high expression of both MHC‐I and MHC‐II at 28dpRSV compared with PBS and UV‐RSV controls (Figure 2D), indicating that persistent MHC upregulation requires RSV infection and not just RSV antigen. Considering this, we investigated whether the magnitude of MHC expression correlates with infection severity by correlating weight change at 6 dpRSV (peak infection severity [45, 51]) with MHC expression increases 28dpRSV (Figure S7). Using Pearson correlation coefficient, we found that increases in the expression of MHC‐I in both lung compartments and of MHC‐II in the airways strongly correlate with infection severity. Considering the importance of co‐stimulatory molecules in initiating antigen presentation, we also assessed the expression of CD40, CD86, CD80, and OX40L. While little‐to‐no changes were observed for CD40 and CD86A, CD80 (Figure S8A) and OX40L were at or below the levels of detection (Figure S8B).
FIGURE 2.

RSV infection results in prolonged upregulation of MHC‐I and MHC‐II on LECs. 6‐week‐old female BALB/c mice were administered RSV, PBS or UV‐RSV intranasally. 28dpRSV LECs were MACS‐sorted for qPCR, or lungs were processed for flow cytometry or confocal IF microscopy. (A) Duplex TaqMan qPCR validation of selected targets identified by CUT&RUN and NanoString, performed on MACS‐sorted LECs. Oaz1 was used as endogenous control for H2‐DMb2 and H2‐Eb1 while Gapdh was used as endogenous control for B2m and H2‐Ab1. Data presented as log2FC relative to PBS. N = 12–24. Up to six samples used to generate data points in Figure 2A were also used to generate NanoString data in Figure 1G. (B) Representative confocal IF micrographs of MHC distribution in sucrose‐dehydrated 7 μm‐thick OCT‐embedded murine lung 28dpRSV. 40× magnification, white scale bar—100 μm. Blue DAPI—nuclei, red—EpCAM‐AF594, green—MHC‐II‐AF488, yellow—MHC‐I‐AF647. (C) Quantification of absolute fluorescence intensity (MHC‐I and MHC‐II) in 20× magnification micrographs in airways and alveoli based on EpCAM expression via automated StarDist segmentation. N = 7–8. (D) Relative flow cytometry quantification of MHC‐I and MHC‐II expression 28dpRSV stratified based on EpCAM expression corresponding to alveoli and airways. An additional UV‐RSV control group was included. Representative histograms are included in the bottom panel. N = 4–8. Each data point is an individual mouse. Each experiment was repeated at least twice. Statistical significance was determined by performing One‐Way ANOVA with Holm post hoc test.
Thus, these data show that MHC expression is increased long after RSV infection is cleared.
3.3. Enhanced in Vivo Responsiveness to LPS by RSV‐Experienced LECs
Considering the prolonged epigenetic changes observed following RSV infection, we investigated if LEC responses to immunogens are altered. Lipopolysaccharide (LPS) has well‐described effects on LECs [52, 53, 54]; triggering proinflammatory transcriptional programs through TLR4/CD14/MD‐2 receptor signaling, similar to RSV F protein [55], and it is a major component of house dust mite (HDM) [56], a major respiratory allergen. LPS (or PBS) was therefore given intranasally (stimulation) to mice 28 days after RSV or PBS administration (conditioning), followed by transcriptome and protein analysis of LECs (Figure 3A).
FIGURE 3.

Intranasal LPS administration 28dpRSV results in an enhanced expression of MHC‐I and MHC‐II on LECs. (A) 28 days after administering RSV or PBS to 6‐week‐old female BALB/c mice 10 μg of LPS or PBS were administered intranasally. Either 6 h or 24 h later mice were culled for transcriptomic or flow cytometry analysis, respectively. (B) Left panel—volcano plot of differentially expressed LEC genes 28dpRSV identified by NanoString nCounter mouse Immunology panel in RSV‐LPS groups as compared to PBS‐LPS group. X axis shows a log2FC in expression, while y axis shows a ‐log10 FDR values. NanoString n = 6 per group, each sample is a pool of two mice, two independent experiments. Centre and right panels—representative MHC‐I and MHC‐II‐related targets validated using duplex TaqMan qPCR. Oaz1 was used as endogenous control for H2‐DMb2 while Gapdh was used as endogenous control for B2m. Treatment on day 0 (conditioning) is color coded, PBS—green and RSV—orange. Treatment on day 28 (stimulation with PBS or LPS) is labelled on x axis. N = 12–24 per group, four independent experiments. Up to six samples used to generate qPCR data points were also used to generate NanoString data in the same figure. (C) Relative flow cytometry quantification of MHC‐I and MHC‐II expression on LECs 28dpRSV stratified based on EpCAM expression which corresponds to alveolar and airway spaces. Representative histograms are included in the bottom panel. Treatment on day 0 (conditioning) is color coded, PBS—green and RSV—orange. Treatment on day 28 (stimulation with PBS or LPS) is labelled on x axis. N = 15 per group, four independent experiments. Two‐Way ANOVA with Holm post hoc test was performed to determine statistical significance.
Following 6 h in vivo LPS or PBS stimulation, the transcriptional response of isolated LECs was assessed using NanoString (Figure 3B). Virtually all significantly upregulated genes (RSV‐LPS vs. PBS‐LPS) were related to MHC biology, and the increased expression of B2m (MHC‐I) and H2‐DMb2 (MHC‐II) was validated by qPCR (Figure 3B). Next, we used flow cytometry to assess the expression of MHC molecules on LECs 24 h after LPS administration, at 28dpRSV. Corroborating the qPCR data, RSV conditioning enhanced the response to LPS, with increased MHC‐I and MHC‐II expression in both airway and alveolar LECs (Figure 3C). Given that TLR4 can be upregulated on LECs following RSV infection [57] we assessed its expression using flow cytometry at 28 dpRSV and found no differences compared to control (Figure S9).
3.4. LECs Show Augmented Antigen Uptake, Processing, and Presentation 28dpRSV
Across CUT&RUN and NanoString datasets, we identified several targets associated with antigen processing and trafficking at 28dpRSV, namely Psmb9, Lap3, Tap1, and Xcl1. The upregulation of Psmb9 (20S immunoproteasome subunit) and Tap1 (transporter molecule responsible for trafficking processed antigens [58]) was further validated by qPCR 28dpRSV (Figure 4A). This led us to hypothesize that either the antigen uptake rate and/or the antigen processing rate in LECs may be altered 28dpRSV.
FIGURE 4.

RSV infection results in enhanced LECs antigen uptake, processing and presentation. (A) Duplex TaqMan qPCR of Psmb9 and Tap1 with Oaz1 as endogenous control in MACS‐sorted LECs 28dpRSV. (B) Experimental design for antigen uptake and antigen processing assessment. Mice were administered RSV or PBS intranasally and then culled 28 days later. Lung single cell suspension was placed in serum‐free media with DQ‐OVA and OVA‐AF647. After 1 or 4 h cells were collected and stained for flow cytometry analysis. (C) Relative flow cytometry quantification of antigen uptake as determined by intracellular OVA‐AF647 signal in LECs stratified based on alveolar and airway spaces. Representative histograms in the panel on the bottom. (D) Relative flow cytometry quantification of antigen processing as determined by a ratio of intracellular DQ‐OVA over OVA‐AF647 signal in LECs stratified based on alveolar and airway spaces. DQ‐OVA/OVA‐AF647 bivariate plots in the panel at the bottom, each data point corresponds to MFI fold change ratio of DQ‐OVA/OVA‐AF647 in each mouse (E) Experimental design for assessment of antigen presentation. C57BL/6 mice were administered RSV or PBS intranasally. 28 days later mice were culled and LECs were MACS‐sorted. Sorted LECs were placed in an in vitro culture with SIINFEKL OVA peptide for 4 h. In the meantime, lymph nodes were harvested from OT‐I mice and OT‐I CD8 T‐cells were MACS sorted. OT‐I cells were labelled with proliferation dye CFSE. LECs and OT‐I cells were then co‐cultured for 72 h, followed by flow cytometry analysis (F). Relative flow cytometry analysis of OT‐I proliferation using FCS express 7 proliferation index. Left panel—representative histograms, middle panel—automated identification of OT‐I generations, right panel—relative OT‐I proliferation index. N = 8 per experimental group, two independent experiments. (G) Relative flow cytometry analysis of CD69 MFI in OT‐I cells across six generations 72 h after co‐culture start with SIINFEKL‐fed LECs. N = 8 per experimental group, two independent experiments. PBS—green and RSV—orange. One‐Way ANOVA with Holm post hoc test was performed to determine statistical significance.
To test this hypothesis, we infected or mock infected mice, followed by isolation and culture of LECs 28dpRSV in the presence of fluorescent ovalbumin (OVA)‐AF647, used to indicate antigen uptake, and BODIPY FL dye‐containing DQ‐OVA (Figure 4B) which fluoresces proportionally to its proteolytic cleavage [59]. Thus, the ratio of DQ‐OVA and OVA‐AF647 reflects the rate of antigen processing while controlling for potential differences in antigen uptake. First, we assessed the ability of LECs to take up OVA‐AF647 antigen over 1 or 4 h, with data stratified to alveolar and airway LECs (Figure 4C). Increased antigen uptake was observed after RSV conditioning across both epithelial subsets and timepoints. Similarly, we assessed antigen processing rates in alveolar and airway LECs after 1 or 4 h (Figure 4D). Again, we observed that the antigen processing rate is elevated 28dpRSV across both cell types.
Next, to test if prolonged upregulation of MHC molecules results in enhanced antigen presentation, we measured the proliferation of transgenic OVA‐specific OT mouse T cells in response to OVA‐peptide presented by LECs. Due to MHC restriction [60] and the C57BL/6J genetic background of OT mice [60] we needed to test if the effects of RSV infection are recapitulated in C57BL/6J LECs. Similar to BALB/c mice, the expression of MHC‐I in C57BL/6 mice was highly upregulated 28 dpRSV; however, no prolonged change in expression of MHC‐II was observed (Figure S10).
Twenty Eight days after the inoculation of C57BL/6J mice with RSV, we harvested LECs and cultured them with or without OVA peptide recognized by OT‐I CD8 T‐cells (SIINFEKL). After 4 h, LECs were washed and put in a co‐culture with OT‐I cells labeled with CFSE proliferation dye (Figure 4E). After 72 h, OT‐I cells proliferated more when exposed to LECs that had previously experienced RSV (Figure 4F). Additionally, CD69, a T‐cell activation and T‐cell tissue residency marker, was significantly upregulated on initial generations of proliferating OT‐I cells in the RSV group (Figure 4G).
4. Discussion
Here, we demonstrate that RSV infection results in prolonged epigenetic changes in LECs, including in regulatory elements of multiple genes related to MHC molecules and antigen processing. Furthermore, we demonstrate an increased expression of MHC‐I and MHC‐II at transcriptional and protein levels in LECs 28dpRSV. The expression of both MHC classes in LECs can be further enhanced upon subsequent exposure to LPS. These epigenetic, transcriptomic, and protein changes appear functional, as we observe that 28dpRSV LECs display elevated antigen uptake and processing. Importantly, these changes are associated with an increased propensity for T‐cells to proliferate and become activated when antigen is presented by LECs that experienced RSV infection 28 days earlier.
Our findings have a twofold significance. On one hand, increased expression of MHC‐I following RSV may enhance protection against subsequent intracellular pathogens. On the other hand, the enhanced expression of MHC‐II may lead to increased presentation of extracellular antigens, including allergens, to CD4 T‐cells.
Mounting evidence suggests that the severity of influenza infection is reduced if mice are infected with RSV 3–4 weeks prior, as demonstrated by reduced morbidity, mortality, lung pathology, and immune cell infiltration [8, 61]. This phenomenon was shown to be independent of antibody‐mediated protection or cross‐protecting lung‐resident memory T‐cells (TRM) [62]. Here, we suggest that such protection could be a result of prolonged enhancement of antigen presentation by LECs. The importance of MHC antigen presentation during viral infection is underscored by the fact that many viruses, including SARS‐CoV‐2, influenza virus, cytomegalovirus, Epstein–Barr virus, HIV, rotavirus, and hepatitis B virus, actively interfere with MHC‐I expression, antigen loading, and presentation, including in epithelial cells [63, 64, 65, 66, 67, 68, 69]. In contrast, RSV infection upregulates MHC expression, as shown here in vivo in mice, as well as by other researchers in human lung epithelial cell lines [70, 71]. Interestingly, rhinovirus, like RSV, is associated with allergic airway disease development and exacerbation [72, 73], and also upregulates MHC in respiratory epithelial cells [74].
While enhanced antigen presentation by LECs may contribute to allergic asthma exacerbation, it is unlikely that heightened LEC allergen presentation alone will lead to the development of allergic airway disease. Rather, other factors like genetic predisposition (e.g., MHC alleles) or environmental factors (e.g., environmental LPS) contribute to the development of allergic airway disease. HLA genes are the most polymorphic genes found in humans [75], with more than 35,000 alleles identified as of 2023 [76]. It is therefore likely that only specific combinations of HLA alleles may increase the risk of respiratory allergy development, particularly considering that different MHC alleles have varying affinity for different peptides [77]. Indeed, it has been shown that different class II HLA genes have an impact on the course of asthma development [78] with HLA‐DQ identified as an asthma risk allele [75, 79, 80].
However, considering the increase in MHC levels following RSV infection and their further elevation after LPS exposure, it is conceivable that respiratory viral infection in the presence of environmental LPS may result in MHC‐mediated enhanced allergen presentation and thus contribute to allergic airway disease exacerbation in susceptible individuals. Multiple studies utilizing various experimental systems show that LPS exposure can result in exacerbation of allergic airway disease [81, 82, 83], while another study demonstrated that repeated LPS administration 35–41 days after RSV infection results in an aggravated inflammatory response and airway hyper‐responsiveness [84]. Nevertheless, in light of a report that lymph nodes are not essential for clonal expansion of allergen‐specific CD4 T‐cells in the murine lung [85], it is conceivable that prolonged MHC upregulation on LECs might suffice for the expansion of allergen‐specific lung‐resident T‐cell (TRM) populations. This is further supported by our observation that antigen presentation to OT‐I cells by LECs 28dpRSV leads to the upregulation of CD69, a marker of TRM cells in the lung [86]. Consequently, following repeated allergen exposure, TRM cells in conjunction with LECs alone could contribute to the development of allergic airway disease.
While MHC‐I and MHC‐II upregulation is generally driven by IFNγ [87, 88, 89], MHC‐I upregulation following RSV has been demonstrated to be primarily type I interferon (IFN‐I) mediated [71, 90]. Nevertheless, it is unlikely that IFNs alone are responsible for the observed phenotype. While C57BL/6 mice prototypically exhibit type 1 innate immune responses (T1), BALB/c mice tend to exhibit a type 2 innate immune response (T2) [91]. We observed that RSV infection upregulates MHC‐II on LECs in BALB/c mice but not in C57BL/6 mice, suggesting that while general antiviral responses may be responsible for the upregulation of MHC‐I, a T2 cytokine response may be responsible for the upregulation of MHC‐II. This notion is further reinforced considering that T2 cytokines like IL‐13 or IL‐33 correlate with RSV disease severity [45, 92], which in our model correlates with prolonged expression levels of MHC. Similarly, several T2 cytokines, including IL‐2, IL‐4, or IL‐13, induce MHC‐II expression [93, 94].
In summary, using a mouse model we have shown that RSV infection results in prolonged epigenetic and transcriptomic changes in lung epithelial cells that result in increased antigen presentation. Our findings increase understanding of epithelial cell memory after infection and could explain severity modulation of subsequent LRTI as well as the association between LRTI and the development of allergic airway disease.
Conflicts of Interest
The authors declare no conflicts of interest.
Supporting information
Figure S1. CD45‐CD31‐EpCAM+ LECs purity after MACS sorting. Following MACS sorting the purity of LECs was assessed using flow cytometry. Purity is evaluated as a % of CD45‐CD31‐EpCAM+ out of live cells.
Figure S2. QC of StarDist confocal immunofluorescent segmentation. EpCAM high airway regions are marked with green and EpCAM low alveolar regions are marked with yellow. Fields of view with incorrect segmentation were removed from analysis.
Figure S3. Representative flow cytometry gating for LECs analysis. Following debris exclusion, singlets are selected, and RBC are removed. Next live cells are selected followed by CD45‐CD31‐ selection. Within that population LECs are stratified to EpCAM low and EpCAM high.
Figure S4. Representative flow cytometry gating for analysis of CD8+ cells in OT1/LECs co‐culture after 72 h. Following debris exclusion, singlets are selected, and RBC are removed. Next, live cells are selected followed by CD45 + CD3+ selection. Within that population OT1 cells are identified as CD4‐CD8+.
Figure S5. Epithelial subset marker validation based on EpCAM expression. Based on confocal IF microscopy EpCAM is highly expressed in murine airway, while low expression is observed in alveoli. Similar EpCAM expression pattern is observed by flow cytometry following cold dispase digestion.
Figure S6. Characterization of BALB/c model of RSV infection. (A) Changes in mice weight in PBS (green) and RSV (orange) groups shown as % of initial weight. N = 20–42. Experiment was repeated at least four times. (B) Whole‐body plethysmography without a challenge following RSV administration on days 0–8. N = 4, single experiment. Whole body plethysmography was performed using a Buxco Max II preamplifier, Buxco bias flow regulator, Buxco mouse chambers, and FinePointe software. BALB/c mice were individually placed in measurement chambers, allowed to acclimatize for 5 min, and then base line lung function (without any challenge) was monitored over a 5‐min period on a daily basis for 8 days following RSV A2 administration. Enhanced pause (PenH) was calculated as an indicator of respiratory effort. (C) Amplification plots of duplex TaqMan qPCR of RSV L‐gene and Rpl37a endogenous control 3dpRSV and 28dpRSV. N = 3–4, single experiment. (D) Flow cytometric analysis of CD8/CD4 T‐cell ratio of mouse lung during peak T‐cell response. CD8 and CD4 T‐cells were identified as CD45 + CD3 + CD8 + CD4‐ and CD45 + CD3 + CD8‐CD4+, respectively. N = 4, single experiment. (E) H&E of lightly fixed, OCT‐inflated murine lungs 5dpRSV (peak inflammation), 28dpRSV or PBS control. Whole samples (half lung) were scanned using Zeiss Axioscan Z1 with 20× objective and three representative fields of view were selected. Black scale bar—60 μm. N = 6–8, two independent experiments. (F) Representative flow cytometry gating for analysis of major immune subsets in murine lung 28dpRSV. (G) Quantification of major immune cells subsets in control (PBS) lungs and 28dpRSV following liberase TL digestion. Absolute cell counts were back calculated based on a frequency of given cell population and total lung cell count. N = 4, single experiment.
Figure S7. Infection severity on D6 correlates with MHC expression on D28. Scatter plots of mouse weight change (in % vs. baseline) 6dpRSV (y axis) and MFI fold change of MHC‐I/MHC‐II expression (x axis) stratified based on anatomical niche (pink—airways, green—alveoli). The relationship strength between the variables was assessed by using a Pearson correlation coefficient.
Figure S8. Flow cytometric analysis of co‐stimulatory molecules on LECs 28dpRSV. (A) Relative flow cytometry quantification of CD40 and CD86 expression 28dpRSV stratified based on EpCAM expression corresponding to alveoli and airways and corresponding representative histograms. N = 11–15. Each data point is an individual mouse. Experiment was repeated at least thrice. Statistical significance was determined by performing One‐Way ANOVA with Holm post hoc test. (B) Representative histograms of CD80 and OX40L expression stratified based on EpCAM expression corresponding to alveoli and airways.
Figure S9. TLR4 abundance in LECs 28dpRSV as determined by flow cytometry analysis with representative histograms. N = 8 per group, two independent experiments.
Figure S10. Flow cytometry quantification of MHC‐I and MHC‐II expression in C57BL/6 mice 28dpRSV stratified to alveolar and airway spaces. Additional UV‐RSV control group was included. Representative histograms are included in the bottom panel. N = 4–8.
Table S1. Normfinder analysis of endogenous controls across experimental groups. The stability score is calculated based on experimental group differences and intragroup variances. The lower the stability score the more stable the endogenous control. GroupDif is a measure of differences between experimental groups, while GroupSD is a weighted average of SD in each group.
Table S2. List of all genes associated with statistically significant DBS across H3K4me3 and H3K27ac in RSV as compared to PBS 28dpRSV.
Acknowledgments
We gratefully acknowledge assistance and expertise from the staff of Bioresearch and Veterinary Services at the University of Edinburgh and, Biomolecular Core, Flow Core Facility, and Microscopy Core Facility staff at the Institute for Regeneration and Repair, University of Edinburgh. We acknowledge Alison Munro of HTPU Microarray Services at the Institute of Genetics and Cancer for their technical support on NanoString. P.P.J. and J.S. thank the British Lung Foundation (PHD16‐19 BUSH) and the Breathing Together Consortium for support. M.O.B. was supported by an MRC grant (MR/T029668/1). This UK funded award is part of the EDCTP2 program supported by the European Union. Establishing the CUT&RUN technique was supported by the Carnegie Trust. Conceptualization: P.P.J., H.J.M., W.T'.J., E.W.R., and J.S. Investigation: P.P.J., W.T'.J. and M.O.B. Formal analysis: P.P.J., W.T'.J., M.R., M.V. Writing—original draft: P.P.J. Writing—review and editing: P.P.J., W.T'J., M.O.B., C.C., M.V., C.L., C.B., R.I., E.W.R., H.J.M., and J.S. Funding acquisition: J.S. Project administration: J.S., E.W.R. provided the OT‐I mice.
For the purpose of open access, the author has applied a Creative Commons Attribution (CC BY) license to any Author Accepted Manuscript version arising from this submission.
Janas P. P., T'Jonck W., Burgess M. O., et al., “Epithelial Memory After Respiratory Viral Infection in Mice Results in Prolonged Enhancement of Antigen Presentation,” Allergy 80, no. 9 (2025): 2501–2518, 10.1111/all.16683.
Funding: This work was supported by British Lung Foundation.
Data Availability Statement
The data that support the findings of this study are available from the corresponding author upon reasonable request.
References
- 1. Makrinioti H., Lakoumentas J., Xepapadaki P., et al., “The Role of Respiratory Syncytial Virus and Rhinovirus in Early Recurrent Wheeze and Asthma Inception – A Systematic Review,” Paediatric Asthma and Allergy 58 (2021): OA2572. [DOI] [PubMed] [Google Scholar]
- 2. García‐García M. L., Calvo C., Casas I., et al., “Human Metapneumovirus Bronchiolitis in Infancy Is an Important Risk Factor for Asthma at Age 5,” Pediatric Pulmonology 42 (2007): 458–464. [DOI] [PubMed] [Google Scholar]
- 3. Sigurs N., Aljassim F., Kjellman B., et al., “Asthma and Allergy Patterns Over 18 Years After Severe RSV Bronchiolitis in the First Year of Life,” Thorax 65 (2010): 1045–1052. [DOI] [PubMed] [Google Scholar]
- 4. Rosas‐Salazar C., Chirkova T., Gebretsadik T., et al., “Respiratory Syncytial Virus Infection During Infancy and Asthma During Childhood in the USA (INSPIRE): A Population‐Based, Prospective Birth Cohort Study,” Lancet 401 (2023): 1669–1680. [DOI] [PMC free article] [PubMed] [Google Scholar]
- 5. Rudd P. A., Thomas B. J., Zaid A., et al., “Role of Human Metapneumovirus and Respiratory Syncytial Virus in Asthma Exacerbations: Where Are We Now?,” Clinical Science 131 (2017): 1713–1721. [DOI] [PubMed] [Google Scholar]
- 6. Radzikowska U., Eljaszewicz A., Tan G., et al., “Rhinovirus‐Induced Epithelial RIG‐I Inflammasome Suppresses Antiviral Immunity and Promotes Inflammation in Asthma and COVID‐19,” Nature Communications 14 (2023): 2329. [DOI] [PMC free article] [PubMed] [Google Scholar]
- 7. Cox G., Gonzalez A. J., Ijezie E. C., et al., “Priming With Rhinovirus Protects Mice Against a Lethal Pulmonary Coronavirus Infection,” Frontiers in Immunology 13 (2022): 886611. [DOI] [PMC free article] [PubMed] [Google Scholar]
- 8. Hartwig S. M., Miller A. M., and Varga S. M., “Respiratory Syncytial Virus Provides Protection Against a Subsequent Influenza A Virus Infection,” Journal of Immunology 208 (2022): 720–731. [DOI] [PMC free article] [PubMed] [Google Scholar]
- 9. Mukherjee A. B. and Zhang Z., “Allergic Asthma: Influence of Genetic and Environmental Factors,” Journal of Biological Chemistry 286 (2011): 32883–32889. [DOI] [PMC free article] [PubMed] [Google Scholar]
- 10. Ntontsi P., Photiades A., Zervas E., Xanthou G., and Samitas K., “Genetics and Epigenetics in Asthma,” International Journal of Molecular Sciences 22 (2021): 2412. [DOI] [PMC free article] [PubMed] [Google Scholar]
- 11. Whitsett J. A. and Alenghat T., “Respiratory Epithelial Cells Orchestrate Pulmonary Innate Immunity,” Nature Immunology 16 (2015): 27–35. [DOI] [PMC free article] [PubMed] [Google Scholar]
- 12. Akdis C. A., “Does the Epithelial Barrier Hypothesis Explain the Increase in Allergy, Autoimmunity and Other Chronic Conditions?,” Nature Reviews. Immunology 21 (2021): 739–751. [DOI] [PubMed] [Google Scholar]
- 13. Rawlins E. L. and Hogan B. L. M., “Ciliated Epithelial Cell Lifespan in the Mouse Trachea and Lung,” American Journal of Physiology. Lung Cellular and Molecular Physiology 295 (2008): L231–L234. [DOI] [PMC free article] [PubMed] [Google Scholar]
- 14. Byers D. E., Alexander‐Brett J., Patel A. C., et al., “Long‐Term IL‐33–Producing Epithelial Progenitor Cells in Chronic Obstructive Lung Disease,” Journal of Clinical Investigation 123, no. 9 (2013): 3967–3982. [DOI] [PMC free article] [PubMed] [Google Scholar]
- 15. Naik S., Larsen S. B., Gomez N. C., et al., “Inflammatory Memory Sensitizes Skin Epithelial Stem Cells to Tissue Damage,” Nature 550 (2017): 475–480. [DOI] [PMC free article] [PubMed] [Google Scholar]
- 16. Hussell T., Baldwin C. J., O'Garra A., and Openshaw P. J. M., “CD8+ T Cells Control Th2‐Driven Pathology During Pulmonary Respiratory Syncytial Virus Infection,” European Journal of Immunology 27 (1997): 3341–3349. [DOI] [PubMed] [Google Scholar]
- 17. McFarlane A. J., McSorley H. J., Davidson D. J., et al., “Enteric Helminth‐Induced Type I Interferon Signaling Protects Against Pulmonary Virus Infection Through Interaction With the Microbiota,” Journal of Allergy and Clinical Immunology 140 (2017): 1068–1078. [DOI] [PMC free article] [PubMed] [Google Scholar]
- 18. Zhang D., Yang J., Zhao Y., et al., “RSV Infection in Neonatal Mice Induces Pulmonary Eosinophilia Responsible for Asthmatic Reaction,” Frontiers in Immunology 13 (2022): 817113. [DOI] [PMC free article] [PubMed] [Google Scholar]
- 19. Currie S. M., Findlay E. G., McHugh B. J., et al., “The Human Cathelicidin LL‐37 has Antiviral Activity Against Respiratory Syncytial Virus,” PLoS One 8 (2013): e73659. [DOI] [PMC free article] [PubMed] [Google Scholar]
- 20. Janas P. P., Chauché C., Shearer P., Perona‐Wright G., McSorley H. J., and Schwarze J., “Cold Dispase Digestion of Murine Lungs Improves Recovery and Culture of Airway Epithelial Cells,” PLoS One 19 (2024): e0297585. [DOI] [PMC free article] [PubMed] [Google Scholar]
- 21. Meers M. P., Bryson T. D., Henikoff J. G., and Henikoff S., “Improved CUT&RUN Chromatin Profiling Tools,” eLife 8 (2019): e46314. [DOI] [PMC free article] [PubMed] [Google Scholar]
- 22. Afgan E., Baker D., Batut B., et al., “The Galaxy Platform for Accessible, Reproducible and Collaborative Biomedical Analyses: 2018 Update,” Nucleic Acids Research 46 (2018): gky379. [DOI] [PMC free article] [PubMed] [Google Scholar]
- 23. Andrews S., “FastQC: A Quality Control Tool for High Throughput Sequence Data Online,” (2010), http://www.bioinformatics.babraham.ac.uk/projects/fastqc/.
- 24. Bolger A. M., Lohse M., and Usadel B., “Trimmomatic: A Flexible Trimmer for Illumina Sequence Data,” Bioinformatics 30 (2014): 2114–2120. [DOI] [PMC free article] [PubMed] [Google Scholar]
- 25. Langmead B. and Salzberg S. L., “Fast Gapped‐Read Alignment With Bowtie 2,” Nature Methods 9 (2012): 357–359. [DOI] [PMC free article] [PubMed] [Google Scholar]
- 26. Ramírez F., Ryan D. P., Grüning B., et al., “deepTools2: A Next Generation Web Server for Deep‐Sequencing Data Analysis,” Nucleic Acids Research 44 (2016): W160–W165. [DOI] [PMC free article] [PubMed] [Google Scholar]
- 27. Meers M. P., Tenenbaum D., and Henikoff S., “Peak Calling by Sparse Enrichment Analysis for CUT&RUN Chromatin Profiling,” Epigenetics & Chromatin 12 (2019): 42. [DOI] [PMC free article] [PubMed] [Google Scholar]
- 28. Stark R. and Brown G. D., “DiffBind: Differential binding analysis of ChIP‐Seq peak data,” (2012), https://api.semanticscholar.org/CorpusID:1875957.
- 29. Amemiya H. M., Kundaje A., and Boyle A. P., “The ENCODE Blacklist: Identification of Problematic Regions of the Genome,” Scientific Reports 9 (2019): 9354. [DOI] [PMC free article] [PubMed] [Google Scholar]
- 30. Love M. I., Huber W., and Anders S., “Moderated Estimation of Fold Change and Dispersion for RNA‐Seq Data With DESeq2,” Genome Biology 15 (2014): 550. [DOI] [PMC free article] [PubMed] [Google Scholar]
- 31. Yu G., Wang L.‐G., and He Q.‐Y., “ChIPseeker: An R/Bioconductor Package for ChIP Peak Annotation, Comparison and Visualization,” Bioinformatics 31 (2015): 2382–2383. [DOI] [PubMed] [Google Scholar]
- 32. Yu G., Wang L.‐G., Han Y., and He Q.‐Y., “clusterProfiler: An R Package for Comparing Biological Themes Among Gene Clusters,” OMICS: A Journal of Integrative Biology 16 (2012): 284–287. [DOI] [PMC free article] [PubMed] [Google Scholar]
- 33. Class C. A., Lukan C. J., Bristow C. A., and Do K.‐A., “Easy NanoString nCounter Data Analysis With the NanoTube,” Bioinformatics 39 (2022): btac762. [DOI] [PMC free article] [PubMed] [Google Scholar]
- 34. Burgess M. O., Janas P., Berry K., et al., “Helminth Induced Monocytosis Conveys Protection From Respiratory Syncytial Virus Infection in Mice,” Allergy 79 (2024): 2157–2172, 10.1111/all.16206. [DOI] [PubMed] [Google Scholar]
- 35. Andersen C. L., Jensen J. L., and Ørntoft T. F., “Normalization of Real‐Time Quantitative Reverse Transcription‐PCR Data: A Model‐Based Variance Estimation Approach to Identify Genes Suited for Normalization, Applied to Bladder and Colon Cancer Data Sets,” Cancer Research 64 (2004): 5245–5250. [DOI] [PubMed] [Google Scholar]
- 36. Schmidt U., Weigert M., Broaddus C., and Myers G., Medical Image Computing and Computer Assisted Intervention – MICCAI 2018, 21st International Conference, Granada, Spain, September 16‐20, 2018, Proceedings, Part II (Lect Notes Comput Sci, 2018), 265–273. [Google Scholar]
- 37. Ghosh M., Helm K. M., Smith R. W., et al., “A Single Cell Functions as a Tissue‐Specific Stem Cell and the In Vitro Niche‐Forming Cell,” American Journal of Respiratory Cell and Molecular Biology 45 (2024): 459–469. [DOI] [PMC free article] [PubMed] [Google Scholar]
- 38. Hasegawa K., Sato A., Tanimura K., et al., “Fraction of MHCII and EpCAM Expression Characterizes Distal Lung Epithelial Cells for Alveolar Type 2 Cell Isolation,” Respiratory Research 18, no. 150 (2024). [DOI] [PMC free article] [PubMed] [Google Scholar]
- 39. Chen H., Matsumoto K., Brockway B. L., et al., “Airway Epithelial Progenitors Are Region Specific and Show Differential Responses to Bleomycin‐Induced Lung Injury,” Stem Cells 30 (2024): 1948–1960. [DOI] [PMC free article] [PubMed] [Google Scholar]
- 40. Wickham H., ggplot2, Elegant Graphics for Data Analysis (Springer International Publishing, 2016), 10.1007/978-3-319-24277-4. [DOI] [Google Scholar]
- 41. Lex A., Gehlenborg N., Strobelt H., Vuillemot R., and Pfister H., “UpSet: Visualization of Intersecting Sets,” IEEE Transactions on Visualization and Computer Graphics 20 (2014): 1983–1992. [DOI] [PMC free article] [PubMed] [Google Scholar]
- 42. Kassambara A., “rstatix: Pipe‐Friendly Framework for Basic Statistical Tests,” (2023), https://rpkgs.datanovia.com/rstatix/.
- 43. Chávez‐Bueno S., Mejías A., Gómez A. M., et al., “Respiratory Syncytial Virus‐Induced Acute and Chronic Airway Disease Is Independent of Genetic Background: An Experimental Murine Model,” Virology Journal 2 (2005): 46. [DOI] [PMC free article] [PubMed] [Google Scholar]
- 44. Rameix‐Welti M.‐A., Goffic R. L., Hervé P.‐L., et al., “Visualizing the Replication of Respiratory Syncytial Virus in Cells and in Living Mice,” Nature Communications 5 (2014): 5104. [DOI] [PMC free article] [PubMed] [Google Scholar]
- 45. Stokes K. L., Chi M. H., Sakamoto K., et al., “Differential Pathogenesis of Respiratory Syncytial Virus Clinical Isolates in BALB/c Mice,” Journal of Virology 85 (2011): 5782–5793. [DOI] [PMC free article] [PubMed] [Google Scholar]
- 46. Cano‐Rodriguez D., Gjaltema R. A. F., Jilderda L. J., et al., “Writing of H3K4Me3 Overcomes Epigenetic Silencing in a Sustained but Context‐Dependent Manner,” Nature Communications 7 (2016): 12284. [DOI] [PMC free article] [PubMed] [Google Scholar]
- 47. Beacon T. H., Delcuve G. P., López C., et al., “The Dynamic Broad Epigenetic (H3K4me3, H3K27ac) Domain as a Mark of Essential Genes,” Clinical Epigenetics 13 (2021): 138. [DOI] [PMC free article] [PubMed] [Google Scholar]
- 48. Zhao W., Xu Y., Wang Y., et al., “Investigating Crosstalk Between H3K27 Acetylation and H3K4 Trimethylation in CRISPR/dCas‐Based Epigenome Editing and Gene Activation,” Scientific Reports 11 (2021): 15912. [DOI] [PMC free article] [PubMed] [Google Scholar]
- 49. Ohtsuka M., Inoko H., Kulski J. K., and Yoshimura S., “Major Histocompatibility Complex (Mhc) Class Ib Gene Duplications, Organization and Expression Patterns in Mouse Strain C57BL/6,” BMC Genomics 9 (2008): 178. [DOI] [PMC free article] [PubMed] [Google Scholar]
- 50. Zhao Y., Zhao K., Wang S., and Du J., “Multi‐Functional BST2/Tetherin Against HIV‐1, Other Viruses and LINE‐1,” Frontiers in Cellular and Infection Microbiology 12 (2022): 979091. [DOI] [PMC free article] [PubMed] [Google Scholar]
- 51. Kirsebom F., Michalaki C., Agueda‐Oyarzabal M., and Johansson C., “Neutrophils Do Not Impact Viral Load or the Peak of Disease Severity During RSV Infection,” Scientific Reports 10 (2020): 1110. [DOI] [PMC free article] [PubMed] [Google Scholar]
- 52. Yanagihara K., Seki M., and Cheng P.‐W., “Lipopolysaccharide Induces Mucus Cell Metaplasia in Mouse Lung,” American Journal of Respiratory Cell and Molecular Biology 24 (2001): 66–73. [DOI] [PubMed] [Google Scholar]
- 53. Liu X., Yin S., Chen Y., et al., “LPS‐Induced Proinflammatory Cytokine Expression in Human Airway Epithelial Cells and Macrophages via NF‐κB, STAT3 or AP‐1 Activation,” Molecular Medicine Reports 17 (2018): 5484–5491. [DOI] [PubMed] [Google Scholar]
- 54. Vernooy J. H. J., Dentener M. A., van Suylen R. J., Buurman W. A., and Wouters E. F. M., “Intratracheal Instillation of Lipopolysaccharide in Mice Induces Apoptosis in Bronchial Epithelial Cells,” American Journal of Respiratory Cell and Molecular Biology 24 (2001): 569–576. [DOI] [PubMed] [Google Scholar]
- 55. Kurt‐Jones E. A., Popova L., Kwinn L., et al., “Pattern Recognition Receptors TLR4 and CD14 Mediate Response to Respiratory Syncytial Virus,” Nature Immunology 1 (2000): 398–401. [DOI] [PubMed] [Google Scholar]
- 56. Pascoe C. D., Jha A., Basu S., et al., “The Importance of Reporting House Dust Mite Endotoxin Abundance: Impact on the Lung Transcriptome,” American Journal of Physiology. Lung Cellular and Molecular Physiology 318 (2020): L1229–L1236. [DOI] [PMC free article] [PubMed] [Google Scholar]
- 57. Monick M. M., Yarovinsky T. O., Powers L. S., et al., “Respiratory Syncytial Virus Up‐Regulates TLR4 and Sensitizes Airway Epithelial Cells to Endotoxin*,” Journal of Biological Chemistry 278 (2003): 53035–53044. [DOI] [PubMed] [Google Scholar]
- 58. Santambrogio L., Berendam S. J., and Engelhard V. H., “The Antigen Processing and Presentation Machinery in Lymphatic Endothelial Cells,” Frontiers in Immunology 10 (2019): 1033. [DOI] [PMC free article] [PubMed] [Google Scholar]
- 59. Daro E., Pulendran B., Brasel K., et al., “Polyethylene Glycol‐Modified GM‐CSF Expands CD11bhighCD11chigh but Not CD11blowCD11chigh Murine Dendritic Cells In Vivo: A Comparative Analysis With Flt3 Ligand,” Journal of Immunology 165 (2000): 49–58. [DOI] [PubMed] [Google Scholar]
- 60. Zinkernagel R. M. and Doherty P. C., “Restriction of In Vitro T Cell‐Mediated Cytotoxicity in Lymphocytic Choriomeningitis Within a Syngeneic or Semiallogeneic System,” Nature 248 (1974): 701–702. [DOI] [PubMed] [Google Scholar]
- 61. Wang H., Peters N., Laza‐Stanca V., Nawroly N., Johnston S. L., and Schwarze J., “Local CD11c+ MHC Class II− Precursors Generate Lung Dendritic Cells During Respiratory Viral Infection, but Are Depleted in the Process,” Journal of Immunology (Baltimore, Md.: 1950) 177 (2006): 2536–2542. [DOI] [PubMed] [Google Scholar]
- 62. Wu T., Hu Y., Lee Y., et al., “Lung‐Resident Memory CD8 T Cells (TRM) Are Indispensable for Optimal Cross‐Protection Against Pulmonary Virus Infection,” Journal of Leukocyte Biology 95 (2014): 215–224. [DOI] [PMC free article] [PubMed] [Google Scholar]
- 63. Zuo J., Currin A., Griffin B. D., et al., “The Epstein‐Barr Virus G‐Protein‐Coupled Receptor Contributes to Immune Evasion by Targeting MHC Class I Molecules for Degradation,” PLoS Pathogens 5 (2009): e1000255. [DOI] [PMC free article] [PubMed] [Google Scholar]
- 64. Holloway G., Fleming F. E., and Coulson B. S., “MHC Class I Expression in Intestinal Cells Is Reduced by Rotavirus Infection and Increased in Bystander Cells Lacking Rotavirus Antigen,” Scientific Reports 8 (2018): 67. [DOI] [PMC free article] [PubMed] [Google Scholar]
- 65. Kerkau T., Gernert S., Kneitz C., and Schimpl A., “Mechanism of MHC Class I Downregulation in HIV Infected Cells,” Immunobiology 184 (1992): 402–409. [DOI] [PubMed] [Google Scholar]
- 66. Sandhu P. K. and Buchkovich N. J., “Human Cytomegalovirus Decreases Major Histocompatibility Complex Class II by Regulating Class II Transactivator Transcript Levels in a Myeloid Cell Line,” Journal of Virology 94 (2020): 94, 10.1128/jvi.01901-19. [DOI] [PMC free article] [PubMed] [Google Scholar]
- 67. Chen Y., Cheng M., and Tian Z., “Hepatitis B Virus Down‐Regulates Expressions of MHC Class I Molecules on Hepatoplastoma Cell Line,” Cellular and molecular immunology 3 (2006): 373–378. [PubMed] [Google Scholar]
- 68. Moriyama M., Lucas C., Monteiro V. S., et al., “Enhanced Inhibition of MHC‐I Expression by SARS‐CoV‐2 Omicron Subvariants,” Proceedings of the National Academy of Sciences of the United States of America 120 (2023): 52120. [DOI] [PMC free article] [PubMed] [Google Scholar]
- 69. Koutsakos M., McWilliam H. E. G., Aktepe T. E., et al., “Downregulation of MHC Class I Expression by Influenza A and B Viruses,” Frontiers in Immunology 10 (2019): 1158. [DOI] [PMC free article] [PubMed] [Google Scholar]
- 70. Zdrenghea M. T., Telcian A. G., Laza‐Stanca V., et al., “RSV Infection Modulates IL‐15 Production and MICA Levels in Respiratory Epithelial Cells,” European Respiratory Journal 39 (2011): 712–720. [DOI] [PubMed] [Google Scholar]
- 71. Guo X., Liu T., Shi H., et al., “Respiratory Syncytial Virus Infection Upregulates NLRC5 and Major Histocompatibility Complex Class I Expression Through RIG‐I Induction in Airway Epithelial Cells,” Journal of Virology 89 (2015): 7636–7645. [DOI] [PMC free article] [PubMed] [Google Scholar]
- 72. Makrinioti H., Hasegawa K., Lakoumentas J., et al., “The Role of Respiratory Syncytial Virus‐ and Rhinovirus‐Induced Bronchiolitis in Recurrent Wheeze and Asthma—A Systematic Review and Meta‐Analysis,” Pediatric Allergy and Immunology 33 (2022): e13741. [DOI] [PubMed] [Google Scholar]
- 73. Ortega H., Nickle D., and Carter L., “Rhinovirus and Asthma: Challenges and Opportunities,” Reviews in Medical Virology 31 (2021): e2193. [DOI] [PMC free article] [PubMed] [Google Scholar]
- 74. Papi A., Stanciu L. A., Papadopoulos N. G., Teran L. M., Holgate S. T., and Johnston S. L., “Rhinovirus Infection Induces Major Histocompatibility Complex Class I and Costimulatory Molecule Upregulation on Respiratory Epithelial Cells,” Journal of Infectious Diseases 181 (2000): 1780–1784. [DOI] [PubMed] [Google Scholar]
- 75. Shiina T., Hosomichi K., Inoko H., and Kulski J. K., “The HLA Genomic Loci Map: Expression, Interaction, Diversity and Disease,” Journal of Human Genetics 54 (2009): 15–39. [DOI] [PubMed] [Google Scholar]
- 76. Barker D. J., Maccari G., Georgiou X., et al., “The IPD‐IMGT/HLA Database,” Nucleic Acids Research 51 (2022): D1053–D1060. [DOI] [PMC free article] [PubMed] [Google Scholar]
- 77. Paul S., Weiskopf D., Angelo M. A., Sidney J., Peters B., and Sette A., “HLA Class I Alleles Are Associated With Peptide‐Binding Repertoires of Different Size, Affinity, and Immunogenicity,” Journal of Immunology 191 (2013): 5831–5839. [DOI] [PMC free article] [PubMed] [Google Scholar]
- 78. Martyn M. B., Molis W., Jacobson R. M., Poland G. A., Weaver A. L., and Juhn Y. J., “Human Leukocyte Antigen Type and Progression From Onset of Symptoms to Development of Asthma,” Allergy and Asthma Proceedings 31 (2010): 120–125. [DOI] [PMC free article] [PubMed] [Google Scholar]
- 79. Moffatt M. F., Gut I. G., Demenais F., et al., “A Large‐Scale, Consortium‐Based Genomewide Association Study of Asthma,” New England Journal of Medicine 363 (2010): 1211–1221. [DOI] [PMC free article] [PubMed] [Google Scholar]
- 80. Pasanen A., Karjalainen M. K., Bont L., et al., “Genome‐Wide Association Study of Polymorphisms Predisposing to Bronchiolitis,” Scientific Reports 7 (2017): 41653. [DOI] [PMC free article] [PubMed] [Google Scholar]
- 81. Kumari A., Dash D., and Singh R., “Lipopolysaccharide (LPS) Exposure Differently Affects Allergic Asthma Exacerbations and Its Amelioration by Intranasal Curcumin in Mice,” Cytokine 76 (2015): 334–342. [DOI] [PubMed] [Google Scholar]
- 82. Ren Y., Ichinose T., He M., Youshida S., Nishikawa M., and Sun G., “Co‐Exposure to Lipopolysaccharide and Desert Dust Causes Exacerbation of Ovalbumin‐Induced Allergic Lung Inflammation in Mice via TLR4/MyD88‐Dependent and ‐Independent Pathways,” Allergy, Asthma & Clinical Immunology 15 (2019): 82. [DOI] [PMC free article] [PubMed] [Google Scholar]
- 83. Lowe A. P. P., Thomas R. S., Nials A. T., Kidd E. J., Broadley K. J., and Ford W. R., “LPS Exacerbates Functional and Inflammatory Responses to Ovalbumin and Decreases Sensitivity to Inhaled Fluticasone Propionate in a Guinea Pig Model of Asthma,” British Journal of Pharmacology 172 (2015): 2588–2603. [DOI] [PMC free article] [PubMed] [Google Scholar]
- 84. Chen S., Xie J., Zhao K., et al., “LPS Aggravates Lung Inflammation Induced by RSV by Promoting the ERK‐MMP‐12 Signaling Pathway in Mice,” Respiratory Research 21 (2020): 193. [DOI] [PMC free article] [PubMed] [Google Scholar]
- 85. Choi G., Kim B.‐S., Park Y.‐J., Shim I., and Chung Y., “Clonal Expansion of Allergen‐Specific CD4+ T Cell in the Lung in the Absence of Lymph Nodes,” Immune Network 17 (2017): 163–170. [DOI] [PMC free article] [PubMed] [Google Scholar]
- 86. Walsh D. A., da Silva H. B., Beura L. K., et al., “The Functional Requirement for CD69 in Establishment of Resident Memory CD8+ T Cells Varies With Tissue Location,” Journal of Immunology (Baltimore, Md.: 1950) 203 (2019): 946–955. [DOI] [PMC free article] [PubMed] [Google Scholar]
- 87. Zhou F., “Molecular Mechanisms of IFN‐γ to Up‐Regulate MHC Class I Antigen Processing and Presentation,” International Reviews of Immunology 28 (2009): 239–260. [DOI] [PubMed] [Google Scholar]
- 88. Giroux M., Schmidt M., and Descoteaux A., “IFN‐γ‐Induced MHC Class II Expression: Transactivation of Class II Transactivator Promoter IV by IFN Regulatory Factor‐1 Is Regulated by Protein Kinase C‐α,” Journal of Immunology (Baltimore, Md.: 1950) 171 (2003): 4187–4194. [DOI] [PubMed] [Google Scholar]
- 89. Steimle V., Siegrist C.‐A., Mottet A., Lisowska‐Grospierre B., and Mach B., “Regulation of MHC Class II Expression by Interferon‐γ Mediated by the Transactivator Gene CIITA,” Science 265 (1994): 106–109. [DOI] [PubMed] [Google Scholar]
- 90. Jamaluddin M., Wang S., Garofalo R. P., et al., “IFN‐β Mediates Coordinate Expression of Antigen‐Processing Genes in RSV‐Infected Pulmonary Epithelial Cells,” American Journal of Physiology. Lung Cellular and Molecular Physiology 280 (2001): L248–L257. [DOI] [PubMed] [Google Scholar]
- 91. Watanabe H., Numata K., Ito T., Takagi K., and Matsukawa A., “Innate Immune Response in TH1‐ and TH2‐Dominant Mouse Strains,” Shock 22 (2004): 460–466. [DOI] [PubMed] [Google Scholar]
- 92. Saravia J., You D., Shrestha B., et al., “Respiratory Syncytial Virus Disease Is Mediated by Age‐Variable IL‐33,” PLoS Pathogens 11 (2015): e1005217. [DOI] [PMC free article] [PubMed] [Google Scholar]
- 93. de Vries J. E., “The Role of IL‐13 and Its Receptor in Allergy and Inflammatory Responses,” Journal of Allergy and Clinical Immunology 102 (1998): 165–169. [DOI] [PubMed] [Google Scholar]
- 94. Abdel‐Salam B. K. A.‐H., “Comparing Effects of Interleukin‐2 and Interleukin‐4 on the Expression of MHC Class II, CD80 and CD86 on Polymorphonuclear Neutrophils,” Egyptian Journal of Medical Human Genetics 11 (2010): 115–120. [Google Scholar]
Associated Data
This section collects any data citations, data availability statements, or supplementary materials included in this article.
Supplementary Materials
Figure S1. CD45‐CD31‐EpCAM+ LECs purity after MACS sorting. Following MACS sorting the purity of LECs was assessed using flow cytometry. Purity is evaluated as a % of CD45‐CD31‐EpCAM+ out of live cells.
Figure S2. QC of StarDist confocal immunofluorescent segmentation. EpCAM high airway regions are marked with green and EpCAM low alveolar regions are marked with yellow. Fields of view with incorrect segmentation were removed from analysis.
Figure S3. Representative flow cytometry gating for LECs analysis. Following debris exclusion, singlets are selected, and RBC are removed. Next live cells are selected followed by CD45‐CD31‐ selection. Within that population LECs are stratified to EpCAM low and EpCAM high.
Figure S4. Representative flow cytometry gating for analysis of CD8+ cells in OT1/LECs co‐culture after 72 h. Following debris exclusion, singlets are selected, and RBC are removed. Next, live cells are selected followed by CD45 + CD3+ selection. Within that population OT1 cells are identified as CD4‐CD8+.
Figure S5. Epithelial subset marker validation based on EpCAM expression. Based on confocal IF microscopy EpCAM is highly expressed in murine airway, while low expression is observed in alveoli. Similar EpCAM expression pattern is observed by flow cytometry following cold dispase digestion.
Figure S6. Characterization of BALB/c model of RSV infection. (A) Changes in mice weight in PBS (green) and RSV (orange) groups shown as % of initial weight. N = 20–42. Experiment was repeated at least four times. (B) Whole‐body plethysmography without a challenge following RSV administration on days 0–8. N = 4, single experiment. Whole body plethysmography was performed using a Buxco Max II preamplifier, Buxco bias flow regulator, Buxco mouse chambers, and FinePointe software. BALB/c mice were individually placed in measurement chambers, allowed to acclimatize for 5 min, and then base line lung function (without any challenge) was monitored over a 5‐min period on a daily basis for 8 days following RSV A2 administration. Enhanced pause (PenH) was calculated as an indicator of respiratory effort. (C) Amplification plots of duplex TaqMan qPCR of RSV L‐gene and Rpl37a endogenous control 3dpRSV and 28dpRSV. N = 3–4, single experiment. (D) Flow cytometric analysis of CD8/CD4 T‐cell ratio of mouse lung during peak T‐cell response. CD8 and CD4 T‐cells were identified as CD45 + CD3 + CD8 + CD4‐ and CD45 + CD3 + CD8‐CD4+, respectively. N = 4, single experiment. (E) H&E of lightly fixed, OCT‐inflated murine lungs 5dpRSV (peak inflammation), 28dpRSV or PBS control. Whole samples (half lung) were scanned using Zeiss Axioscan Z1 with 20× objective and three representative fields of view were selected. Black scale bar—60 μm. N = 6–8, two independent experiments. (F) Representative flow cytometry gating for analysis of major immune subsets in murine lung 28dpRSV. (G) Quantification of major immune cells subsets in control (PBS) lungs and 28dpRSV following liberase TL digestion. Absolute cell counts were back calculated based on a frequency of given cell population and total lung cell count. N = 4, single experiment.
Figure S7. Infection severity on D6 correlates with MHC expression on D28. Scatter plots of mouse weight change (in % vs. baseline) 6dpRSV (y axis) and MFI fold change of MHC‐I/MHC‐II expression (x axis) stratified based on anatomical niche (pink—airways, green—alveoli). The relationship strength between the variables was assessed by using a Pearson correlation coefficient.
Figure S8. Flow cytometric analysis of co‐stimulatory molecules on LECs 28dpRSV. (A) Relative flow cytometry quantification of CD40 and CD86 expression 28dpRSV stratified based on EpCAM expression corresponding to alveoli and airways and corresponding representative histograms. N = 11–15. Each data point is an individual mouse. Experiment was repeated at least thrice. Statistical significance was determined by performing One‐Way ANOVA with Holm post hoc test. (B) Representative histograms of CD80 and OX40L expression stratified based on EpCAM expression corresponding to alveoli and airways.
Figure S9. TLR4 abundance in LECs 28dpRSV as determined by flow cytometry analysis with representative histograms. N = 8 per group, two independent experiments.
Figure S10. Flow cytometry quantification of MHC‐I and MHC‐II expression in C57BL/6 mice 28dpRSV stratified to alveolar and airway spaces. Additional UV‐RSV control group was included. Representative histograms are included in the bottom panel. N = 4–8.
Table S1. Normfinder analysis of endogenous controls across experimental groups. The stability score is calculated based on experimental group differences and intragroup variances. The lower the stability score the more stable the endogenous control. GroupDif is a measure of differences between experimental groups, while GroupSD is a weighted average of SD in each group.
Table S2. List of all genes associated with statistically significant DBS across H3K4me3 and H3K27ac in RSV as compared to PBS 28dpRSV.
Data Availability Statement
The data that support the findings of this study are available from the corresponding author upon reasonable request.