Abstract
Less than 100 cis-regulatory DNAs have been characterized in the context of transgenic metazoan embryos. Here we investigate the feasibility of conducting a genome-wide search for tissue-specific enhancers in the ascidian Ciona intestinalis. A total of 138 random genomic DNA fragments with an average size of 1.7 kb were separately placed 5′ of a lacZ reporter gene. Eleven of the lacZ fusion genes displayed localized patterns of expression in tadpole-stage Ciona embryos. At least five of these transgenes appear to contain bona fide tissue-specific enhancers that direct expression in the cerebral vesicle, neural tube, primordial adhesive organ, notochord, and tail epidermis. One of the enhancers maps near Distalless (Ci-Dll-A) and recapitulates most aspects of the endogenous expression pattern, including localized expression in the anterior-most regions of the neurogenic ectoderm. We discuss the prospects of creating a regulatory atlas of the Ciona genome, whereby every enhancer is identified for every gene.
Less than 3% of the human genome corresponds to protein-coding information (1, 2). Cis-regulatory elements probably represent a substantial fraction of the remaining DNA (3–6). More than half of all protein-coding sequences can be assigned a tentative function based on simple sequence analysis because of the large number of proteins that have been characterized in a variety of functional assays (1, 2). In contrast, fewer than 100 cis-DNAs have been studied in all transgenic metazoans combined, including Caenorhabditis elegans, Drosophila, sea urchins, sea squirts, fish, frogs, chicken, and mice (7). To “crack the cis code” and identify cis-regulatory elements within the human genome by sequence inspection, it will be necessary to characterize a much larger sampling of cis-DNAs in higher metazoans, particularly chordates (6, 8).
Here we exploit the ease of creating transgenic Ciona tadpoles for the genome-wide identification of tissue-specific enhancers. Tailbud-stage Ciona tadpoles are initially composed of ≈1,000 cells after just 10 rounds of cleavage after fertilization (9). As a result, transient transgenesis can be used for the efficient expression of exogenous DNAs in developing Ciona embryos. Simple electroporation methods permit the simultaneous transformation of hundreds (even thousands) of synchronously developing embryos (6). There is no need for stable incorporation or Mendelian segregation of transgenic DNAs because they must persist for just 16–24 h and 10 rounds of mitosis. Transient transgenesis has been used to characterize a number of tissue-specific enhancers that mediate expression in the tail muscles, central nervous system (CNS), notochord, and endoderm (e.g., refs. 10 and 11; reviewed in ref. 6). In addition, this method has been used to explore the consequences of misexpressing regulatory genes in inappropriate tissues. For example, ectopic expression of the Ciona Brachyury gene (Ci-Bra) in the endoderm causes a partial transformation into notochord (12). The resulting mutant tadpoles were used to identify ≈40 notochord-specific genes that function downstream of the Ci-Bra activator (12–14).
In the present study, 138 random genomic DNA fragments, with an average size of 1.7 kb, were placed 5′ of a basal fkh-lacZ fusion gene, and individually electroporated into developing Ciona embryos. Eleven of the transgenic lines exhibited localized LacZ staining in specific larval tissues, including the cerebral vesicle, neural tube, primordial adhesive organ, epidermis, and notochord. At least five of the staining patterns appear to reflect the activities of bona fide tissue-specific enhancers. One of the enhancers mediates expression at the anterior tip of the neurogenic ectoderm, which includes portions of the cerebral vesicle and primordial adhesive organ. Additional studies suggest that it is the major enhancer of the Distalless-A (Ci-Dll-A) gene. The present pilot screen identified a tissue-specific enhancer in every 20–40 kb of random genomic DNA. We discuss the feasibility and utility of identifying every cis-regulatory DNA in the Ciona genome.
Materials and Methods
Ascidians.
Adult Ciona intestinalis were collected from Pillar Point Harbor in San Mateo County, California, under scientific permit of the State of California Department of Fish and Game. These animals were kept in recirculating natural seawater at 18°C. Sperm and eggs were collected within 2 weeks of their removal from the wild.
Preparation of fkh-lacZ Transformation Vectors.
The pCES (plasmid Ciona enhancer screen) library vector was prepared in the p72-1.27 electroporation plasmid (15). The C. intestinalis fkh basal promoter, transcription start site, native initiator codon, and lacZ reporter gene were isolated by means of PCR from the −2.6-kb Ci-fkh/lacZ plasmid, also based on the p72-1.27 plasmid (11, 15). The reaction used the Pfu DNA polymerase (Stratagene) and the oligonucleotides FKH5C: CGCGGATCCCCATGGTCTTTGACCAATAATTTCGCCGCC, which contains BamHI and NcoI sites in its 5′ tail, and lacZ3A: GCTACCCGGGCCGAGCTCAGAAAAAATGACTGC. Both the resultant fragment and p72-1.27 were digested with BamHI and EcoRI (internal to the lacZ coding region) and ligated together to produce pCES.
Genomic DNA was isolated from the sperm of a single adult Ciona using the PureGene DNA Isolation kit (Gentra Systems), and then partially digested with Sau3AI. The DNA was size selected for 1.5- to 2.5-kb fragments by recovery from a gel slice using the GeneClean II kit (Qbiogene, Carlsbad, CA) after electrophoresis in low-melt agarose. The DNA fragments were then ligated into the BamHI site of pCES, transformed into DH5-α′ cells and grown on LB plates containing ampicillin. Single colonies were picked, miniprepped using standard techniques, and tested for the presence of insert by restriction digestion with PstI and NcoI (which flank the insertion site). Plasmids that contained inserts were then midiprepped using the Bio-Rad Midi kit to isolate the large amounts of DNA required for Ciona electroporation. Positives were retested using CsCl-purified DNAs.
Electroporation, fixation, and X-Gal (5-bromo-4-chloro-3-indolyl β-d-galactoside) activity staining were performed as described by Corbo et al. (15). Aliquots containing 100 μg of DNA were used in each electroporation. Embryos were allowed to develop for 16 h after fertilization at 15°C. Genomic DNA inserts containing enhancer activity were sequenced with the Big-Dye Terminator Cycle Sequencing Ready Reaction kit and an ABI Prism 377 DNA sequencer (Perkin–Elmer).
Whole-Mount in Situ Hybridizations.
In situ hybridizations were done with whole-mount staged embryos as described by Corbo et al. (15). Embryos were allowed to develop at 15°C to the indicated stages, fixed with paraformaldehyde, and then stored at −20°C. Digoxigenin-labeled RNA probes were synthesized from lacZ and Ci-Dll-A cDNA plasmids using T7 and T3 RNA polymerases (Promega).
Results
The expression vector used to identify random enhancers contains the basal promoter region of the Ciona forkhead (Ci-fkh) gene. This promoter is normally activated by distal cis-regulatory elements (located between −1.7 kb and −300 bp 5′ of the transcription start site) in all three major axial tissues of developing tadpoles: the notochord, endodermal strand, and neural tube (floor plate) (11, 16). It can also be activated in the tail muscles when attached to an appropriate enhancer (10). The basal Ci-fkh promoter does not direct LacZ staining above background levels in electroporated embryos (data not shown; ref. 11). The inducibility of this promoter in all of the major larval tissues suggests that it should be able to respond to most random tissue-specific enhancers.
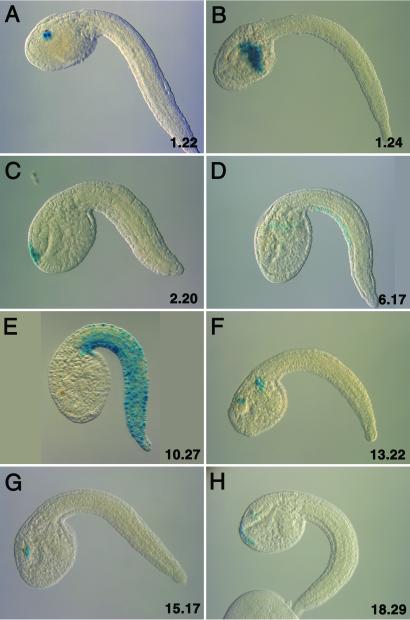
A total of 138 different fkh-lacZ transformation vectors were prepared. Each contains a random, average size of 1.7 kb genomic DNA fragment. Eleven of these vectors directed localized patterns of lacZ expression in electroporated tadpoles. Three are expressed in the tail epidermis (Fig. 1 D and E; data not shown), five in the CNS (Fig. 1 A, C, F, G, and H), three in the mesenchyme (Fig. 1B; data not shown). The mesenchyme is a hotspot of spurious staining in electroporated tadpoles (e.g., ref. 15). It is therefore possible that this pattern is caused by general activators in the 5′ genomic DNA fragment. A second suspicious staining pattern is seen within the cerebral vesicle where a third of the positive transgenic lines exhibit expression (Fig. 1 A, F, G, and H). Additional studies (see below) suggest that this staining might be associated with authentic enhancers that direct expression in other regions of the CNS or peripheral nervous system.
Figure 1.
Staining patterns obtained with random genomic DNA fragments. Tadpoles were electroporated at the one-cell stage with fkh-lacZ fusion genes containing eight different genomic DNA fragments that were randomly selected from the Ciona genome. Embryos were allowed to develop to the mid-tail-bud/early tadpole stage, and then stained with X-Gal to visualize LacZ enzyme activity. Embryos are oriented with anterior to the left and dorsal up. (A) LacZ activity staining is detected in cells of the cerebral vesicle that are located near the pigmented sensory cell, the otolith. (B) Staining is detected in the mesenchyme. (C) Staining is detected in the anterior-most regions of the neurogenic ectoderm, including portions of the head epidermis, anterior cerebral vesicle, and dorsal portion of primordial adhesive organ. (D) The 6.17 transgene directs expression in ventral regions of the tail epidermis. (E) Staining is detected throughout the tail epidermis. (F) Staining is detected in the cerebral vesicle, near the sensory cells, and mesenchyme. (G) The staining pattern obtained with the 15.17 transgene is similar to that observed for 1.22 (A). (H) Staining is detected in the primordial adhesive organ and in the cerebral vesicle near the presumptive pigmented sensory cells.
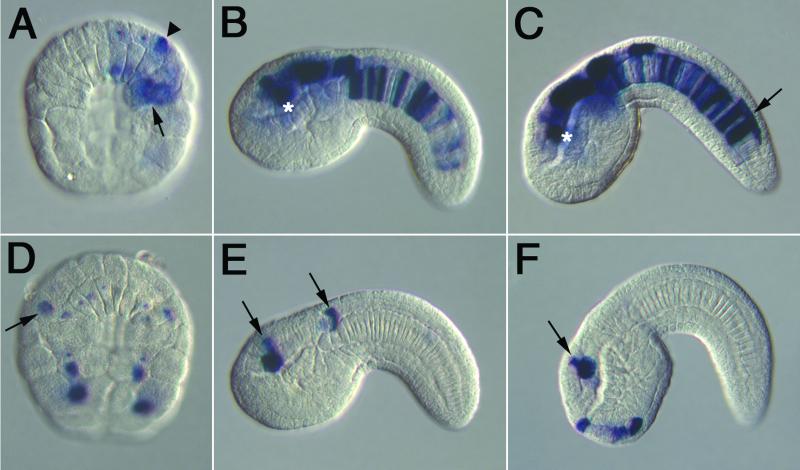
A digoxigenin-labeled lacZ antisense RNA probe was used to monitor the activities of the fkh-lacZ fusion genes at different stages of development (Figs. 2 and 3). This method is considerably more sensitive than the visualization of LacZ enzyme activity. In situ hybridization also permits a “real time” evaluation of the expression patterns, because just a few RNAs per cell can be detected. In contrast, X-Gal activity staining is obtained only after a long lag between the onset of lacZ gene expression and the accumulation of active enzyme. Based on X-Gal staining (Fig. 1F), line 13.22 exhibits staining in the cerebral vesicle, and sometimes in notochord cells. The detection of gene activity by means of in situ hybridization reveals expression during gastrulation (Fig. 2A). There is staining in the primary notochord precursor cells (arrow), and in the precursors of the neural tube (arrowhead). During tail-bud stages, expression is seen to persist in both tissues. Strong staining is detected near precursors of the sensory cells within the cerebral vesicle (asterisks in Fig. 2 B and C), as well as in the other regions of the CNS, extending from the hindbrain to the posterior tip of the neural tube (arrow, Fig. 2C). The 2.0-kb fragment that directs this composite staining pattern might contain two separate enhancers.
Figure 2.
Expression profiles of CNS and peripheral nervous system enhancers. Embryos were electroporated at the one-cell stage with different fkh-lacZ fusion genes, and subsequently hybridized with a digoxigenin-labeled lacZ antisense RNA probe. (A–C) Embryos express transgene 13.22. Staining is first detected during gastrulation (A). Expression is detected in prospective notochord cells (arrow) and in the progenitors of the CNS (arrowhead). Staining persists in the notochord and CNS during tail-bud stages (B and C). Staining is detected in the CNS hotspot in the vicinity of the future pigmented sensory cells (asterisks). Expression is also observed along the entire length of the neural tube (arrow in C). (D and E) Embryos express transgene 15.17. Variable staining is first detected during gastrulation (D). Expression is observed in a CNS precursor (arrow). Staining persists during tail-bud formation, and is observed in the CNS hotspot and visceral ganglion (arrow in E). (F) Staining pattern of transgene 18.29 in a tail-bud-stage embryo. Expression is detected in the hotspot (arrow), and in the primordial adhesive organ.
Figure 3.
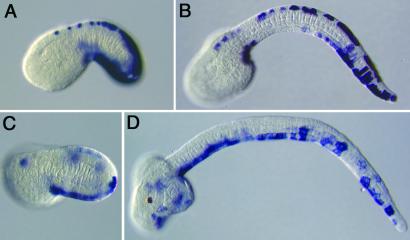
Expression profiles of epidermal enhancers. Embryos were electroporated at the one-cell stage and stained with a digoxigenin-labeled lacZ antisense RNA probe. (A and B) Embryos express transgene 10.27. Staining is detected in tail-bud-stage embryos (A) and persists in tadpoles (B). Expression is detected in both dorsal and ventral regions of the tail epidermis. (C and D) Embryos express transgene 10.10. Staining is detected in tail-bud-stage embryos (C) and tadpoles (E). Expression is primarily restricted to ventral regions of the tail epidermis (D; compare with B).
Two of the fkh-lacZ fusion genes, 1.22 and 15.17, direct virtually identical staining patterns (Fig. 1 A and G). In both cases, staining is detected exclusively in the apparent CNS hotspot near the sensory cells within the cerebral vesicle. In situ hybridization assays reveal a second site of expression within the hindbrain region of the CNS (Fig. 2E; data not shown). A transient, broader staining pattern is detected at earlier stages (Fig. 2D), which includes prospective tail muscles, notochord, and neural tube (arrow). Staining is not detected in the muscles or notochord of tadpoles. Although the 1.22 and 15.17 transgenes direct virtually identical staining patterns, they do not share any obvious sequence identity.
In situ hybridization was used to examine the activities of additional transgenic lines, 18.29 (Fig. 1H), 10.27 (Fig. 1E), and 10.10 (see below). Line 18.29, like 1.22, 15.17, and 13.22, exhibits expression near the sensory cells within the cerebral vesicle (Fig. 1H). However, staining is also detected in the primordial adhesive organ, which derives from the anterior-most head epidermis and contains sensory neurons (Fig. 2F). It is possible that staining in the CNS hotspot (arrow) occurs only when an enhancer is active somewhere within the CNS or peripheral nervous system. To investigate this possibility, in situ hybridization assays were conducted with lines 10.27 (Fig. 3 A and B) and 10.10 (Fig. 3 C and D), which exhibit distinct staining patterns in the tail epidermis. Transgene 10.27 directs expression throughout the tail epidermis (Fig. 3B), whereas transgene 10.10 directs restricted expression in ventral regions (Fig. 3D). In situ hybridization assays detect strong staining in the epidermis of early tail-bud stage (Fig. 3 A and C). Both transgenes direct persistent staining in the epidermis of tadpoles (Fig. 3 B and D). Neither transgene exhibits staining in the hotspot of the cerebral vesicle.
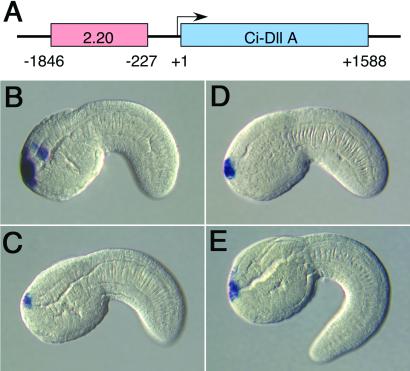
X-Gal staining indicated restricted expression of line 2.20 in the anterior-most regions of the tadpole (Fig. 1C). This staining pattern is also detected by means of in situ hybridization (Fig. 4 B and C), but staining is also sometimes seen in the CNS hotspot (Fig. 4B). The random 1.6-kb genomic DNA fragment contained in this particular fkh-lacZ fusion gene maps just 227 bp 5′ of the Ci-Dll-A transcription start site (Fig. 4A). The Ci-Dll-A coding region was used to prepare an antisense RNA probe for in situ hybridization (Fig. 4 D and E). The gene exhibits staining in anterior regions, including head and a small portion of the primordial adhesive organ. Staining is not detected in the CNS hotspot near the sensory cells. The similarity of the 2.20 and Ci-Dll-A expression patterns suggests that the 1.6-kb genomic DNA fragment contained in the 2.20 fkh-lacZ fusion gene corresponds to a major enhancer of the Ci-Dll-A gene.
Figure 4.
Transgene 2.20 is the Ci-Dll-A enhancer. Tail-bud-stage embryos were hybridized with either a lacZ (B and C) or Ci-Dll-A (D and E) digoxigenin-labeled antisense RNA probe. Embryos are oriented with anterior to the left and dorsal up. (A) Summary of the Ci-Dll-A cDNA. The 2.20 genomic DNA fragment is ≈1.6 kb in length and maps 227 bp upstream of the Dll-A transcription start site. (B and C) Embryos were electroporated at the one-cell stage with transgene 2.20, which directs expression in the anterior-most regions of the neurogenic ectoderm, including the cerebral vesicle, epidermis, and dorsal edge of primordial adhesive organ. Staining is sometimes seen in the hotspot within the cerebral vesicle (B). (D and E) Tail-bud-stage embryos were hybridized with a Ci-Dll-A RNA probe. Staining is detected in anterior regions of the neurogenic ectoderm. The staining pattern is similar to that obtained with the 2.20 transgene (e.g., compare D and B).
Discussion
This study establishes the feasibility of conducting a genome-wide search for tissue-specific enhancers. A small team of experimentalists could survey ≈40 megabases (Mb) of genomic DNA (≈25% of the entire genome) in a year. The outcome of such an effort would be a regulatory atlas of the Ciona genome, whereby tissue-specific enhancers are linked to identified genes. Computational methods could be used to determine whether coordinately regulated enhancers share certain features, a common “language.” Presumably, vertebrate evolution has been fostered by the addition of new enhancers and increased complexity in gene-expression patterns.
Between 5 and 11 tissue-specific enhancers were identified in a total of ≈250 kb of random genomic DNA. This frequency, 1 enhancer per 20–50 kb, is significantly lower than the distribution of genes in the Ciona genome (1 gene every ≈10 kb) (17). There are several explanations for this low frequency. First, the screen was not designed to identify cis-regulatory DNAs that direct general staining in all tissues. Second, tissue-specific enhancers that mediate expression during or after metamorphosis would not be detected. Third, many enhancers exhibit polarity when attached to heterologous promoters, and must be positioned in the same orientation as the target gene (e.g., refs. 18 and 19). Despite these various reservations, it is possible that Ciona has a low proportion of enhancers per gene, which might reflect its retrograde simplicity.
One of the enhancers that was identified in this study, 2.20, maps just 5′ of the Ci-Dll-A gene and recapitulates the major features of the Ci-Dll-A expression pattern (20). The staining pattern shares similarities with the expression of vertebrate Dlx genes, such as the mouse Dlx5 and Dlx6 genes (21, 22). Both genes exhibit expression in the anterior-most regions of the CNS, including the forebrain and presumptive olfactory bulb. Two related sequences, ≈400 bp apiece, were identified in the intergenic region separating the divergently transcribed Dlx5 and Dlx6 genes (23). These sequences are conserved in the Dlx4/Dlx6 intergenic region in zebrafish (23). Both the mouse and zebrafish DNAs direct lacZ reporter gene expression in the forebrain of transgenic mice (23). A similar pattern has been obtained with the 2.20 Ci-Dll-A enhancer. It will be interesting to determine whether the Ciona and vertebrate enhancers share common features and employ similar strategies of regulation. This pattern could be investigated by analyzing the expression of the mouse and zebrafish enhancers in electroporated Ciona embryos.
In principle, the screening method could be modified to identify additional classes of cis-regulatory elements. The present method focused on the identification of tissue-specific enhancers. However, other cis-elements are also important for the regulation of gene expression, including silencers and insulators (24–28). Silencers mediate transcriptional repression and exclude gene activity in inappropriate tissues. Insulator DNAs block the interaction of a distal enhancer with a target promoter when interposed between the two (27, 28). The systematic identification of enhancers, silencers, and insulators in Ciona would provide a “blueprint” for identifying cis-regulatory DNAs in vertebrate genomes.
Acknowledgments
We thank Vince Calhoun for reviewing the manuscript, and Anna Di Gregorio for the DllA cDNA. This study was funded by National Institutes of Health Program Project Grant P01 HD37105.
Abbreviations
- CNS
central nervous system
- X-Gal
5-bromo-4-chloro-3-indolyl βd-galactoside
Note Added in Proof.
A similar approach has been used to identify Ciona Hox enhancers (D. N. Keys et al., unpublished data).
References
- 1.Lander E S, Linton L M, Birren B, Nusbaum C, Zody M C, Baldwin J, Devon K, Dewar K, Doyle M, FitzHugh W, et al. Nature (London) 2001;409:860–921. doi: 10.1038/35057062. [DOI] [PubMed] [Google Scholar]
- 2.Venter J C, Adams M D, Myers E W, Li P W, Mural R J, Sutton G G, Smith H O, Yandell M, Evans C A, Holt R A, et al. Science. 2001;291:1304–1351. doi: 10.1126/science.1058040. [DOI] [PubMed] [Google Scholar]
- 3.Duret L, Bucher P. Curr Opin Struct Biol. 1997;7:399–406. doi: 10.1016/s0959-440x(97)80058-9. [DOI] [PubMed] [Google Scholar]
- 4.Hardison R C. Trends Genet. 2000;16:369–372. doi: 10.1016/s0168-9525(00)02081-3. [DOI] [PubMed] [Google Scholar]
- 5.Onyango P, Miller W, Lehoczky J, Leung C T, Birren B, Wheelan S, Dewar K, Feinberg A P. Genome Res. 2000;10:1697–1710. doi: 10.1101/gr.161800. [DOI] [PubMed] [Google Scholar]
- 6.Corbo J C, Di Gregorio A, Levine M. Cell. 2001;106:535–538. doi: 10.1016/s0092-8674(01)00481-0. [DOI] [PubMed] [Google Scholar]
- 7.Davidson E H. Genomic Regulatory Systems: Development and Evolution. San Diego: Academic; 2001. [Google Scholar]
- 8.Satoh N. Differentiation. 2001;68:1–12. doi: 10.1046/j.1432-0436.2001.068001001.x. [DOI] [PubMed] [Google Scholar]
- 9.Satoh N. Developmental Biology of Ascidians. Cambridge, U.K.: Cambridge Univ. Press; 1994. [Google Scholar]
- 10.Erives A, Corbo J C, Levine M. Dev Biol. 1998;194:213–225. doi: 10.1006/dbio.1997.8810. [DOI] [PubMed] [Google Scholar]
- 11.Di Gregorio A, Corbo J C, Levine M. Dev Biol. 2001;229:31–43. doi: 10.1006/dbio.2000.9964. [DOI] [PubMed] [Google Scholar]
- 12.Takahashi H, Hotta K, Erives A, Di Gregorio A, Zeller R W, Levine M, Satoh N. Genes Dev. 1999;13:1519–1523. doi: 10.1101/gad.13.12.1519. [DOI] [PMC free article] [PubMed] [Google Scholar]
- 13.Hotta K, Takahashi H, Asakura T, Saitoh B, Takatori N, Satou Y, Satoh N. Dev Biol. 2000;224:69–80. doi: 10.1006/dbio.2000.9765. [DOI] [PubMed] [Google Scholar]
- 14.Hotta K, Takahashi H, Erives A, Levine M, Satoh N. Dev Growth Differ. 1999;41:657–664. doi: 10.1046/j.1440-169x.1999.00467.x. [DOI] [PubMed] [Google Scholar]
- 15.Corbo J C, Levine M, Zeller R W. Development (Cambridge, UK) 1997;124:589–602. doi: 10.1242/dev.124.3.589. [DOI] [PubMed] [Google Scholar]
- 16.Corbo J C, Erives A, Di Gregorio A, Chang A, Levine M. Development (Cambridge, UK) 1997;124:2335–2344. doi: 10.1242/dev.124.12.2335. [DOI] [PubMed] [Google Scholar]
- 17.Simmen M W, Leitgeb S, Clark V H, Jones S J, Bird A. Proc Natl Acad Sci USA. 1998;95:4437–4440. doi: 10.1073/pnas.95.8.4437. [DOI] [PMC free article] [PubMed] [Google Scholar]
- 18.Surinya K H, Cox T C, May B K. J Biol Chem. 1998;273:16798–16809. doi: 10.1074/jbc.273.27.16798. [DOI] [PubMed] [Google Scholar]
- 19.Kim C H, Ardayfio P, Kim K S. J Biol Chem. 2001;276:24797–24805. doi: 10.1074/jbc.M101279200. [DOI] [PubMed] [Google Scholar]
- 20.Caracciolo A, Di Gregorio A, Aniello F, Di Lauro R, Branno M. Mech Dev. 2000;99:173–176. doi: 10.1016/s0925-4773(00)00474-3. [DOI] [PubMed] [Google Scholar]
- 21.Simeone A, Acampora D, Pannese M, D'Esposito M, Stornaiuolo A, Gulisano M, Mallamaci A, Kastury K, Druck T, Huebner K, et al. Proc Natl Acad Sci USA. 1994;91:2250–2254. doi: 10.1073/pnas.91.6.2250. [DOI] [PMC free article] [PubMed] [Google Scholar]
- 22.Liu J K, Ghattas I, Liu S, Chen S, Rubenstein J L. Dev Dyn. 1997;210:498–512. doi: 10.1002/(SICI)1097-0177(199712)210:4<498::AID-AJA12>3.0.CO;2-3. [DOI] [PubMed] [Google Scholar]
- 23.Zerucha T, Stuhmer T, Hatch G, Park B K, Long Q, Yu G, Gambarotta A, Schultz J R, Rubenstein J L, Ekker M. J Neurosci. 2000;20:709–721. doi: 10.1523/JNEUROSCI.20-02-00709.2000. [DOI] [PMC free article] [PubMed] [Google Scholar]
- 24.Blackwood E M, Kadonaga J T. Science. 1998;281:61–63. doi: 10.1126/science.281.5373.60. [DOI] [PubMed] [Google Scholar]
- 25.Gray S, Levine M. Curr Opin Cell Biol. 1996;8:358–364. doi: 10.1016/s0955-0674(96)80010-x. [DOI] [PubMed] [Google Scholar]
- 26.Ogbourne S, Antalis T M. Biochem J. 1998;331:1–14. doi: 10.1042/bj3310001. [DOI] [PMC free article] [PubMed] [Google Scholar]
- 27.Geyer P K. Curr Opin Genet Dev. 1997;7:242–248. doi: 10.1016/s0959-437x(97)80134-7. [DOI] [PubMed] [Google Scholar]
- 28.Bell A C, Felsenfeld G. Curr Opin Genet Dev. 1999;9:191–198. doi: 10.1016/S0959-437X(99)80029-X. [DOI] [PubMed] [Google Scholar]


