

Abstract
Visual transduction in retinal photoreceptors operates through a dynamic interplay of two second messengers, Ca2+ and cGMP. Ca2+ regulates the activity of guanylate cyclase (GC) and the synthesis of cGMP by acting on a GC-activating protein (GCAP). While this action is critical for rapid termination of the light response, the GCAP responsible has not been identified. To test if GCAP1, one of two GCAPs present in mouse rods, supports the generation of normal flash responses, transgenic mice were generated that express only GCAP1 under the control of the endogenous promoter. Paired flash responses revealed a correlation between the degree of recovery of the rod a-wave and expression levels of GCAP1. In single cell recordings, the majority of the rods generated flash responses that were indistinguishable from wild type. These results demonstrate that GCAP1 at near normal levels supports the generation of wild-type flash responses in the absence of GCAP2.
Keywords: guanylate cyclase-activating proteins/paired flash electroretinograms/rod photoreceptors/single cell recordings/visual transduction
Introduction
Vision begins with the conversion of light into an electrical response by the retina’s photoreceptors (for a recent review see McBee et al., 2001). The receptor light response involves changes in two intracellular second messengers, cGMP and Ca2+. In darkness, high intracellular [cGMP] keeps cyclic nucleotide gated ion channels (CNG channels) open and a steady current (carried by Na+ and Ca2+) flows into the outer segment. Light activates a G-protein coupled enzyme cascade that stimulates cGMP-specific phosphodiesterase (PDE). The resulting fall in [cGMP] causes the CNG channels to close and decreases Ca2+ influx. Efflux of Ca2+ by Na+/Ca2+,K+ exchange persists, causing a fall in intracellular Ca2+. The fall in Ca2+ stimulates synthesis of cGMP by guanylate cyclase (GC) and leads to timely recovery of the light response. Here we examine the molecular mechanism responsible for the Ca2+-regulation of photoreceptor GC.
The mammalian retina contains two particulate GCs (GC1 and GC2), and two different GC-activating proteins (GCAP1 and GCAP2). A third GCAP has been identified only in humans (Haeseleer et al., 1999) and zebrafish (Imanishi et al., 2002). In vitro, at low Ca2+, GCAP1 stimulates GC1 while GCAP2 stimulates both GC1 and GC2; both GCAPs are inactive when free Ca2+ is high (Haeseleer et al., 1999). The distribution of GC1 and GC2 in rods and cones appears to be species dependent (Yang et al., 1999; Imanishi et al., 2002). Immunocytochemistry in bovine and mouse retina has shown that GCAP1 is present in rods and cones, while GCAP2 is seen nearly exclusively in rods (Cuenca et al., 1998; Kachi et al., 1999).
The genes encoding GCAP1 and GCAP2 are arranged in an autosomal tail-to-tail array (Howes et al., 1998). This arrangement allows for generation of a double knockout mouse (GCAP–/–) in which expression of both GCAPs is disabled. Rod outer segment (ROS) membranes from GCAP–/– mice show no Ca2+ regulation of GC activity. The Ca2+ insensitivity of cGMP synthesis causes the flash response in these rods to be larger and slower than in wild type (Mendez et al., 2001). The Ca2+ dependence of GC activity is rescued by overexpression of bovine GCAP2 in GCAP–/– rods and the time for rod recovery from saturating flashes is returned to normal (Mendez et al., 2001). Overexpression of GCAP2 does not, however, restore the normal kinetics of responses evoked by subsaturating flashes. This suggests that GCAP1, either by itself or in conjunction with GCAP2, participates in the recovery of the rod flash response.
To investigate the role of GCAP1 in rod phototransduction, transgenic mice were generated and bred with GCAP–/– mice to produce a mouse that expressed GCAP1 under the control of its endogenous promoter on a GCAP-null background. We present evidence that GCAP1 expression in GCAP–/– rods can restore the wild-type properties of the rod light response in the absence of GCAP2.
Results
Generation of transgenic mice expressing GCAP1
To evaluate the role of GCAP1 in phototransduction, we generated mice expressing GCAP1 under the control of the endogenous promoter. A transgene containing the entire mouse GCAP1 gene, including the polyadenylation site and a 5.4 kb upstream regulatory region (Figure 1A), was microinjected into single-cell embryos. Four GCAP1 transgenic (G1T) founder mice were generated, two of which (G1T3+ and G1T4+) passed the transgene to F1 offspring with 50% penetrance, as expected from genetically non-mosaic mice. Lines could not be established from the other two G1T founders. Southern blots showed that the G1T3+ founder contained approximately two to three copies, and the G1T4+ founder three to five copies of the transgene (data not shown).

Fig. 1. Gene constructs and promoter analysis of the G1T+ transgenic lines. (A) Wild-type GCAP gene array, disrupted gene array and GCAP1 transgene construct. The arrows above the GCAP array indicate the direction of transcription (the mGCAP1 and mGCAP2 genes are located on opposite strands). The specific fragments used for genotyping (wild-type fragment 1, neo fragment 3 and transgene fragment 2, see also Figure 2A) are shown as bars below the constructs (for details of sense and antisense primer pairs, see Materials and methods). Black boxes depict GCAP1 exons, gray boxes GCAP2 exons. Relevant restriction sites used for the constructs are: H, HindIII; X, XhoI; E, EcoRI. Hatched boxes indicate multiple cloning site sequences derived from the original cloning vector. (B) Amplified fragments of the GCAP1 promoter region indicating the presence and absence of a 1.8 kb deletion. Primers corresponding to sequences 0.5–3 kb upstream of ATG (in 500 bp increments) together with an anchoring antisense primer located at –170 were used to amplify upstream regulatory fragments. GCAP+/+ and the G1T4+GCAP+/+ transgenic line show the expected 3.0 kb product when amplified with the anchoring primer and primer –3379. The G1T3+GCAP+/+ transgenic line exhibits an additional band of 1.4 kb. This band was derived from the G1T3 promoter region from which 1.8 kb were deleted. (C) Schematic depiction of the G1T promoter region and identification of the deletion in the upstream region of the G1T3+ line. The wild-type promoter region contains two repeats (a and b), which are developmentally regulated by retinoic acid, a retinoic acid enhancer element (c) on the antisense strand, and an overlapping AP1 enhancer element (d) on the sense strand in a region between –1337 and –3201 (–1 is the first nucleotide upstream of the translation initiator ATG). This region, identified by a gray bar and marked as Δ, is deleted in the G1T3+ line.
Irregularities in expression patterns (see below) prompted us to examine more closely both transgenes in offspring of the two founders. Analysis of the G1T3 transgene by primers generated in 500 bp increments revealed a deletion in the upstream region (Figure 1B and C). The deletion removes an ∼1.8 kb fragment 1337 bp upstream of the translation start codon, such that the sequence at position –1337 bp was contiguous with the sequence at –3201 bp. The deletion was seen consistently in PCRs of tail DNA from all G1T3+ mice assayed. No alterations were seen in the transgene present in G1T4+ mice, suggesting that the G1T3 upstream deletion occurred during integration of the transgene into the mouse genome by an unknown mechanism.
The transcription start point of the mouse GCAP1 gene is predicted to be 294 bp upstream of ATG [by eukaryotic neural network promoter prediction (Ohler et al., 1999) and 5′ RACE; results not shown], and a putative TATA box is present 28 bp upstream of the transcription start point. Proximal regulatory elements, located within a 121 bp region, are highly conserved between the human and mouse GCAP1 genes. Within this region, retinoic acid and/or thyroid hormone, AP1, possibly RET1 and CRX responsive consensus elements are found, consistent with other photoreceptor-expressed genes. More distally, the mouse promoter region contains a large unsequenceable (CA)n repeat (position >–3.7 kb), which spans >500 bp. A similar but much smaller microsatellite sequence consisting of a (GA)n repeat is present in the first intron.
The two transgenic lines, one with an intact promoter (G1T4+) and one with a partial deletion (G1T3+), provide the desired tools to determine whether GCAP1 can restore normal rod function and to analyze the consequences of the deletion for effects on GCAP1 expression levels and cellular distribution.
Generation of transgenic mice expressing GCAP1 on a GCAP–/– background
GCAP–/– mice were generated recently by replacing C-terminal exons of the GCAP1/2 gene array with a neo cassette (Figure 1A) (Mendez et al., 2001). When raised under normal light conditions, the null mice were shown to have normal retinal morphology and reduced a-wave electroretinogram (ERG) responses under dark-adapted conditions (Hurley and Chen, 2001). However, light responses of single GCAP–/– rods showed a prolonged rising phase of the light response and a pronounced slowing of the recovery phase (Mendez et al., 2001), consistent with an absence of the Ca2+-dependent stimulation of cGMP synthesis that normally accelerates the recovery process.
Crossbreeding of G1T4+GCAP+/– mice with GCAP+/– mice generates offspring expressing GCAP1 on a null background (G1T4+GCAP–/–), as well as five other genotypes (Figure 2A). A corresponding set of six genotypes was also generated using the G1T3+ transgenic line. Genotyping of all three alleles (wild-type GCAP array, disrupted gene array and GCAP1 transgene) was performed simultaneously by PCR amplification, yielding diagnostic fragments of approximately 800, 200 and 500 bp, respectively (Figure 2A). Expression levels for the GCAP1 transgenes were determined with several western blots using G1T3+ and G1T4+ on the null background and comparison with GCAP1 signals in GCAP+/+ mice. G1T3+GCAP–/– transgenic retinas always showed ∼10–30% of wild-type GCAP1 expression, and GCAP1 expression in G1T4+GCAP–/– lines was ∼30–50% that of wild-type levels (Figure 2B).
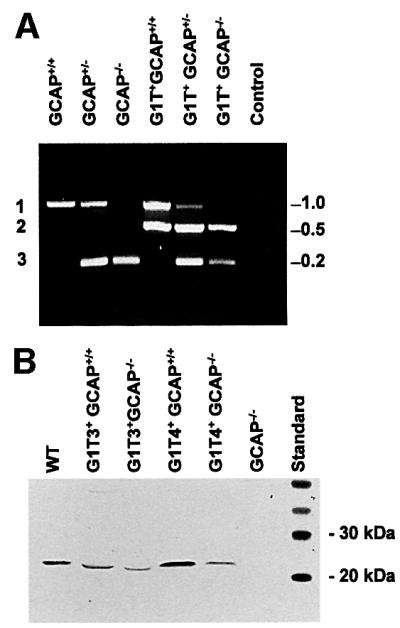
Fig. 2. Genotyping of transgenic lines and analysis of GCAP1 expression. (A) Mobilities of diagnostic amplicons 1–3 for the various genotypes as outlined schematically in Figure 1A. The fragments were generated in single PCRs containing all primers using genomic DNA isolated from tail biopsies. The amplicons were separated on 1% agarose gels. The control lane contains the three primer pairs, but no genomic template. Fragment 1 is diagnostic of the wild-type GCAP array, fragment 2 of the G1T transgene (both G1T3+ and G1T4+ lines), and fragment 3 for the knockout construct. Genomic DNA amplifying only fragment 1 is GCAP+/+, genomic DNA amplifying fragment 3 is GCAP–/–, while DNA amplifying both fragments 1 and 3 is GCAP+/–. Correspondingly, all lines amplifying fragment 2 carry the G1T transgene. (B) Western blot of retinal homogenates. Polyclonal antibody UW14 (Gorczyca et al., 1995) was used to identify GCAP1 transgene expression in G1T3+/GCAP–/– and G1T4+/GCAP–/– retinas relative to wild-type levels. Retinal protein (10 µg) was run for each sample. The slightly faster mobility of GCAP1 in the G1T3+GCAP–/– retina sample was seen consistently in many western blots. Faster mobilities may be caused by the different amounts of calcium bound (Li et al., 2001) or by differential acylation of the GCAP1 protein (Sokal et al., 2001) in cones, since the G1T3 line shows predominantly cone expression. WT, wild type.
GC stimulation levels at low Ca2+ were found consistently to be in between those for knockout and wild-type retinas (data not shown). Expression levels of 30–50% are consistent with expression of a heterozygous transgene (homozygous transgenics were not generated) and represent an average expression level in all photoreceptors. However, as shown below, expression in individual rods varies significantly.
Cellular distribution of GCAP1 in GCAP1 transgenic lines
GCAP1 transgene expression in photoreceptors of G1T3+ and G1T4+ lines on the wild-type background were determined by immunocytochemistry (Figure 3) and by functional analyses (Figures 4–6). To identify cellular and subcellular locations of transgenic GCAP1, we performed immunocytochemistry with a GCAP1-specific polyclonal antibodies (UW101 and UW14) on retinas collected from the nine genetic variations produced in this study (Figure 3A–I). As expected, GCAP–/– retinas were immunonegative for GCAP1 (Figure 3G). G1T lines on a GCAP–/– background were immunopositive for GCAP1 and immunonegative with the anti-GCAP2 antibody (data not shown) as opposed to wild-type GCAP2 staining. GCAP1 transgene expression was specifically targeted to photoreceptor cells in both G1T3+ and G1T4+ lines. The results are consistent with the ability of the intact endogenous GCAP1 promoter (5.4 kb) to direct expression of GCAP1 to both rods and cones. The G1T3+ GCAP+/+ and G1T4+GCAP+/+ transgenic mice (Figure 3B and C) showed additional GCAP1 expression, seen as intense immunoreactive packets in the outer segments, particularly in cones, relative to wild-type levels. Interestingly, GCAP1 immunolocalization was quite variable across photoreceptor outer segments in all lines except those expressing near normal GCAP1 levels, including the wild-type and G1T4+GCAP+/– mice.

Fig. 3. Immunocytochemical localization of GCAPs in retinas from all genotypes generated. GCAP1 was identified with polyclonal antibody UW101 by indirect immunofluorescence (FITC), and mouse cones were labeled with rhodamine-conjugated peanut agglutinin (PNA). The first row (A, D, G) contains GCAP+/+, GCAP+/– and GCAP–/– retinas without transgene, the second row (B, E, H) retinas from G1T3+GCAP+/+, G1T3+GCAP+/– and G1T3+ GCAP–/–, and the third row (C, F, I) from the G1T4+GCAP+/+, G1T4+GCAP+/– and G1T4+GCAP–/– retinas. Bar = 20 µm for all figure parts. Retinal layers are identified as OS (outer segments), IS (inner segments), ONL (outer nuclear layer containing photoreceptor nuclei) and OPL (outer plexiform layer).

Fig. 4. Rod response families in different mouse lines. Panels show superimposed mean responses (n ≥ 10), recorded from either GCAP+/+ (A), GCAP–/– (B) or G1T4+GCAP–/– (C–F) rods, to 10 ms flashes that increase in intensity in ∼2-fold steps from starting values (equivalent 500 nm photons/µm2/flash) of: 0.6, 2.0, 8.4, 2.0, 8.4 and 8.4, respectively. In all panels, responses were normalized to the rod’s resting dark current (R/Rmax), which was: (A) –21.8 pA, (B) –13.6 pA, (C) –13.1 pA, (D) –12.8 pA, (E) –21.4 pA and (F) –11.3 pA. All flashes were delivered at 0.1 s.

Fig. 6. Paired flash ERGs. (A) Left, paired flash response of different lines of transgenic mice at 1000 ms. A conditioning flash produced 5500 isomerizations/rod and a probe flash produced 350 000 isomerizations/rod. Each trace represents the average of three mice. Right, response to the probe flash alone. (B) Graphical representation of normalized a-wave recovery of the probe flash for varying times after the test flash. Each point represents the average for 4–10 mice. Data were fit to a single exponential with the form: e[–(t–T)/tau]. GCAP+/+ mice: T = 481 ms, tau = 481; G1T4+GCAP–/– mice: T = 511 ms, tau = 567 ms; G1T3+GCAP–/– mice: T = 722 ms, tau = 1102 ms; GCAP–/–: T = 511 ms, tau = 2476 ms. The response of each probe flash alone has been normalized to 1, and other traces are scaled accordingly.
G1T4+GCAP+/+ mice, which express ∼30–50% more GCAP1 than wild type (Figure 2B), exhibit a loss of two to three photoreceptor cell layers by 4 weeks of age (Figure 3C), but do not exhibit any further degeneration even as late as 6 months of age (Baehr et al., 2000; and data not shown). The number of cone photoreceptors at 6 months of age appears to be normal. The degenerative effect in some rods is presumably due to overexpression of GCAP1, since G1T4+ mice on heterozygous and GCAP–/– backgrounds (with reduced wild-type GCAP1 levels) showed normal outer nuclear layer (ONL) thickness at advanced ages. Photoreceptor degeneration due to overexpression has commonly been seen in transgenic rhodopsin lines (Olsson et al., 1992). The lower G1T3 transgene expression level does not appear to exhibit an additive deleterious affect on the ONL in G1T3+ mice on a GCAP+/+ background. Interestingly, the G1T3+ transgenic line exhibits enhanced cone GCAP1 expression, while rod expression is greatly reduced (Figure 3H). Unlike the immunostaining seen in wild-type retina cone cells, GCAP1 in the G1T3+GCAP–/– retina is localized intensely throughout cone cells.
The results seen with the G1T3+ line indicate that regulatory elements directing expression to rod photoreceptors or rod-specific enhancer elements may be located in a region –1337 to –3201 bp upstream of the translation start site. This region revealed numerous repetitive elements, including direct repeats, palindromes and developmentally regulated retinoic acid repeats (DR) (Sam et al., 1996). This region therefore is highly susceptible to structural folding, which may have contributed to rearrangement and subsequent deletion of this area during transgene insertion in the G1T3+ founder. Two DR repeats lie at positions –2244 to –2036 bp and –1883 to –1803 bp upstream of the ATG start site (Figure 1C, a and b). DR expression has been shown to be induced by retinoic acid in cultured ES cells and is expressed with tissue specificity in embryos as well as the adult mouse brain. Interestingly, between these two repetitive regions, on opposite strands, lie overlapping consensus binding sites for retinoic acid and AP1 enhancers (Figure 1C, c and d, respectively). Although little is understood concerning rod versus cone specificity in gene expression, there is evidence that retinoic acid can induce progenitor photoreceptor cells to adopt a rod cell fate (Kelley et al., 1999). Loss of this region and subsequent lack of expression of GCAP1 in rods in the G1T3+ transgenic line may have revealed a developmentally regulated program for rod expression of GCAP1 by retinoic acid. In addition, although less intense than in the G1T3+ line, the G1T4+ line also appears to show slightly higher GCAP1 staining in cone cell bodies and synaptic pedicles. This line, however, does not show a promoter deletion. It is conceivable that the transgene containing the 5.4 kb upstream regulatory sequence does not contain the necessary ‘fine-tuning’ regulatory elements, which may be located further upstream and contribute to the lower levels of expression in cones.
Rescue of rod function by GCAP1
Light responses of rods from GCAP–/– mice are markedly slower than those of GCAP+/+ rods. Overexpression of bovine GCAP2 on a GCAP–/– background restored normal rod responses to saturating flashes but failed to restore the normal recovery kinetics to responses evoked by subsaturating flashes (Mendez et al., 2001). We used two recording techniques to determine whether GCAP1 in the absence of GCAP2 could rescue normal rod function. Responses of single rods to dim and moderate strength flashes were recorded using suction electrodes. Responses to bright flashes were evaluated by recording the ERG responses to paired flashes. Together these functional assays indicated that GCAP1 alone could rescue normal rod behavior over a broad range of light levels.
Rod single-cell recordings
Suction electrodes (Yau et al., 1977) were used to record light-evoked changes in circulating dark current from the outer segments of rods from wild-type and genetically modified mice. Representative response families are shown in Figure 4. As reported previously (Mendez et al., 2001), flash responses in GCAP–/– rods were more sensitive to light and slower to reach peak and recover than responses in wild-type rods (Figure 4A and B).
To compare rods from mice of different genotypes, three features of the flash response were measured: the light intensity that evokes a half-saturating response (I0.5), and the time-to-peak (tpeak) and integration time (tinteg) of the linear range response (see Table I). The three response parameters were determined for recorded rods and are plotted against each other in Figure 5. In the three panels, data from wild-type (open circles) and GCAP–/– rods (filled circles) fall into separate clusters. Compared with wild-type cells, GCAP–/– rods generate flash responses that take on average about three times longer to reach peak, are nearly four times more sensitive to light and have 2- to 3-fold longer integration times (Table I). In contrast, the three properties of the flash responses recorded from the G1T4+GCAP–/– rods show large rod-to-rod variations. In some rods the responses are indistinguishable from wild-type while in others they are slower, with properties between those of wild-type and GCAP–/– rods. This is apparent in Figure 4C–F, where response families have been selected from G1T4+GCAP–/– rods to illustrate the range of rod-to-rod variation in the kinetics of the responses.
Table I. Flash response properties for all recorded cells.
| Rod type | Integ. time (ms) ± SEM | Range (low–high) | Time to peak (ms) ± SEM | Range (low–high) | Intensity I0.5 ± SEM | Range (low–high) | Imax (pA) ± SEM | Range (low–high) | No. of cells |
|---|---|---|---|---|---|---|---|---|---|
| Wild type | 313 ± 20 | 192–472 | 206 ± 11 | 157–320 | 29.5 ± 1.5 | 21.5–41.9 | –14 ± 0.9 | –6.4 to –21.8 | 17 |
| GCAP–/– | 759 ± 32 | 624–1009 | 609 ± 20 | 481–731 | 6.9 ± 0.4 | 4.8–10.2 | –12.7 ± 0.4 | –9 to –14.7 | 13 |
| G1T4+GCAP–/– (all cells) | 410 ± 33 | 121–654 | 284 ± 26 | 164–542 | 24.5 ± 2.2 | 9.4–40.4 | –15 ± 0.7 | –10.1 to –21.4 | 22 |
| G1T3+GCAP–/– | 694 ± 65 | 567–970 | 513 ± 25 | 483–618 | 6.7 ± 0.7 | 4.5–8.3 | –12.1 ± 0.4 | 9.1 to –14.7 | 6 |
| G1T4+GCAP+/+ | 408 ± 24 | 339–607 | 245 ± 23 | 188–411 | 26.9 ± 1.8 | 16.1–35.2 | –14.4 ± 1.1 | –10.7 to –22.7 | 10 |
| G1T4+GCAP–/– with integ. time <472 ms | 314 ± 27 | 122–453 | 217 ± 21 | 163–480 | 30.9 ± 1.7 | 18–40.4 | –15.1 ± 0.8 | –10.8 to –21.4 | 14 |
| G1T4+GCAP–/–with integ. time >472 ms | 578 ± 17 | 518–653 | 402 ± 31 | 246–542 | 13.1 ± 1.3 | 9.4–19.3 | –14.9 ± 1.3 | –10.1 to –21.3 | 8 |
The mean ± SEM and range of individual measures are reported for each rod type. Integ. time, integration time (response area/peak amplitude); Imax, maximal current [pA].

Fig. 5. Flash response properties. Collected results were plotted for each recorded rod half-saturating flash intensity (I0.5 in equivalent 500 nm photons/µm2/flash), dim flash response integration time (response area/peak amplitude), and time-to-peak for GCAP+/+ (open circles), GCAP–/– (filled circles), G1T4+GCAP–/– (filled triangles), G1T3+GCAP–/– (open triangles) and G1T4+GCAP+/+ (filled squares).
Measurements of the three standard response parameters for all the recordings from G1T4+GCAP–/– rods are plotted in Figure 5 (filled triangles). The results from the different rods do not form a single cluster of data points. The data points intersperse with wild-type, but also extend into part of the range of the results from GCAP–/– rods. This observation is consistent with variable expression of GCAP1 in the G1T4+GCAP–/– rods (see below). In the bottom rows of Table I, G1T4+GCAP–/– rods are divided into two groups based on whether the integration time of the linear range response is less than or greater than the longest wild-type integration time (472 ms). Fourteen of 22 G1T4+GCAP–/– rods that fall into the group with shorter integration times and have mean values of I0.5, tpeak and tinteg that do not differ significantly from wild type (Table I). This indicates that despite rod-to-rod variation, the majority of G1T4+GCAP–/– rods generate flash responses with wild-type properties.
Flash responses of rods from the G1T3+ line (G1T3+GCAP–/–) do not show a similar rescue of wild-type properties. Indeed these cells generate flash responses that were more similar to the responses recorded from GCAP–/– rods than wild type (Figure 5, open triangles). Responses from rods of mice overexpressing GCAP1 (G1T4+GCAP+/+) were also measured. The light responses of these rods closely resemble wild type (Figure 5, filled squares), suggesting that the amount of endogenous GCAP1 in wild-type mice is sufficient to cause maximal activation of GC.
Paired flash ERG responses in transgenic rods
The single-cell recordings described above indicate that GCAP1 restores normal rod responses to subsaturating flashes. ERGs allowed us to determine whether the ability of GCAP1 to rescue normal function extended to bright flashes.
We used the paired flash ERG method (Lyubarsky and Pugh, 1996) to monitor the time course of recovery of the photoresponse following a strongly saturating conditioning flash (5500 isomerizations). Response recovery was estimated by measuring the amplitude of the a-wave evoked by a probe flash (350 000 isomerizations) delivered at different intervals following the conditioning flash (Pepperberg et al., 1997). Although both rods and cones are excited by the conditioning and probe flashes, the recording primarily reflects rod activity, since cones represent only ∼3% of the receptor population and have been reported to contribute <5% to the saturated a-wave (Lyubarsky et al., 1999). Hence, the amplitude of the a-wave evoked by the second flash depends on the extent to which the rod response to the first flash has recovered.
Figure 6A shows an example of this procedure for a 1 s interval between the conditioning and probe flashes. The response to the probe flash alone is shown on the right. The extent of a-wave recovery in the 1 s interval between conditioning and probe flashes depends on the genotype of the mouse. Wild-type mice showed substantial a-wave recovery in 1 s, while GCAP–/– mice showed little recovery. G1T3+ and G1T4+ mice showed levels of recovery between wild type and null.
The differences in recovery time course among different genotypes are summarized in Figure 6B. To correct for differences in the response to the probe flash in different mouse lines, a-wave amplitudes were normalized to the amplitude of the response evoked by the probe flash alone. Figure 6B plots these normalized amplitudes against the time interval between the conditioning and probe flashes. All lines of mice show suppression of the rod a-wave for an interval of 600 ms. Wild-type mice demonstrate a nearly complete recovery of a wave amplitude when the inter-stimulus interval is 3 s. Mice lacking both GCAP1 and GCAP2 (GCAP–/–) show incomplete recovery, even after 5 s. Mice from the G1T3 line (G1T3+GCAP–/–) show a somewhat faster a-wave recovery than those lacking GCAP, while G1T4+GCAP–/– mice showed a-wave recovery similar to wild type (Figure 6). Mice expressing the G1T4+ transgene on the wild-type background showed a-wave recoveries very similar to wild type.
Levels of GCAP1 expression in single rods
Due to the variability in single-cell recordings in the G1T4+ lines, immunocytochemistry was performed and GCAP1 immunointensities were compared among rod outer segments (Figure 7). Using a recoverin monoclonal antibody to counterstain rod outer segments, the relative intensity of GCAP1 signal was determined on a scale of 0–250%. Whereas wild-type signal intensities are consistently high across the rod outer segments, G1T4+GCAP–/– rods show variable intensities among the outer segments, and G1T3+GCAP–/– signals are consistently diminished in all rod outer segments (ROS). These results are in agreement with the electrophysiological data. GCAP1 transgene expression in the G1T4+GCAP–/– line shows a range of immunointensities, suggesting that the transgene is variably expressed among the rod photoreceptors. The lowered G1T3+ transgene expression in ROS may be explained by the deletion in the regulatory sequence of the transgene.

Fig. 7. Relative GCAP1 signal profiles. Retinas were immunostained for GCAP1 (UW101 FITC) and recoverin (RCV10 rhodamine). Double-labeled confocal images were split for analyzing relative GCAP1 expression levels among the G1T4+GCAP−/− (A), GCAP+/+ (B) and G1T3+GCAP−/− (C) retinas. Recoverin immunolocalization (red signal) within the outer segments in each retina is invariant, while GCAP1 transgene expression shows variable staining among the outer segments. The relative GCAP1 (green) signal was normalized for each retina such that signals ranged from 0 to 250% signal intensity for each image. Normalized signals were then compared across ∼20 outer segments for each retina. The GCAP+/+ retina clearly shows a fairly equivalent intensity of staining for GCAP1 across all outer segments. Outer segments from G1T4+GCAP–/– retinas exhibit a range of GCAP1 intensities, while G1T3+GCAP–/– retinas show few intensely stained rod outer segments. Co-localization is shown in yellow.
Variations in expression patterns have been observed previously and addressed in other transgenic studies. Most recently, variegated expression of a rhodopsin–GFP (green fluorescent protein) fusion protein was described in the retinas of transgenic Xenopus laevis (Moritz et al., 2001). Variable transgene expression was first reported in non-mosaic transgenic mice ∼10 years ago (Lem et al., 1991; Zack et al., 1991). These authors suggested that chromatin structure surrounding the transgene integration site may be causative to variable expression among the targeted cell population. We suggest that a similar mechanism causes variable expression of GCAP1 in G1T4+GCAP–/–. This can account for the fact that GCAP1 expression can rescue wild-type response properties in most but not all rods in G1T4+GCAP–/– mice, and incompletely restores normal recovery from a strongly saturating flash in the ERG measurements.
Discussion
To convert light into an electrical signal, vertebrate photoreceptors use an enzymatic transduction cascade to control the circulating current that flows into the cell through cGMP-gated channels. The intracellular level of cGMP depends on the relative activities of light-stimulated PDE and Ca2+-dependent GC. The present study investigates the molecular mechanisms responsible for the Ca2+ regulation of cGMP synthesis. This issue has not been resolved and is complicated by the fact that rods contain two distinct particulate guanylate cyclases (GC1 and GC2) and two different Ca2+-sensitive activators (GCAP1 and GCAP2).
The GCAPs are among the best characterized Ca2+ binding proteins of the calmodulin superfamily, many of which are specifically expressed in neurons. The genes encoding GCAP1 and GCAP2 are related evolutionarily. They were generated by ancient gene duplication/inversion events and share an identical gene structure. On the protein level, however, the two GCAPs share only ∼45% homology, although they have identical domain distributions (EF hands) and similar three-dimensional structures. There are also several characteristic biochemical and functional differences between them. GCAP1 stimulation is specific for GC1, while GCAP2 stimulates both GC1 and GC2, consistent with the two activator proteins and enzymes having different interaction sites (reviewed in Palczewski et al., 2000). In addition, GCAP1 is active as a monomer (Sokal et al., 2001) and is associated with the membrane and/or GC1 over the full range of physiological [Ca2+] (Gorczyca et al., 1995). GCAP2, on the other hand, is active as a dimer and its solubility has been reported to increase upon binding of Ca2+ (Olshevskaya et al., 1999).
Immunocytochemistry using monospecific antibodies has shown that both GCAP1 and GCAP2 are expressed in mouse ROS (Howes et al., 1998), raising questions about their relative roles in the transduction process. In mouse rods lacking both GCAPs, cGMP synthesis occurred at its normal basal dark rate but was not stimulated by exposure to low Ca2+ (Mendez et al., 2001). The GCAP double knockout rods had normal morphologies yet generated light responses with greatly slowed recovery phases (Mendez et al., 2001) (Figure 4B). Overexpression of bovine GCAP2 in the GCAP–/– rods speeded recovery from strongly saturating flashes but did not restore to normal the recovery kinetics of responses evoked by dim to moderate intensity flashes and, in particular, failed to rescue the fast initial phase of recovery that is a characteristic feature of the wild-type flash response (Mendez et al., 2001).
We used a conceptually similar approach to evaluate the role of GCAP1 in the rod recovery process. First, a GCAP1 transgenic mouse line was established in which GCAP1 expression, governed by the endogenous mouse GCAP1 promoter, was accurately targeted to photoreceptor cells. Secondly, mice were generated expressing only GCAP1 on a GCAP–/– background. We found that in the majority of cases, expression of GCAP1 in GCAP–/– rods restored wild-type recovery kinetics to responses evoked by dim, moderate and strongly saturating flash intensities. This was apparent in the results of both single-cell electrophysiology and ERG recordings from the intact retina (Figures 4–6). A small but significant fraction of the rods that expressed GCAP1 on a null background (G1T4+GCAP–/–) generated responses that recovered with a time course between that of wild-type and double knockout rods. The variation in recovery kinetics was attributed to cell-to-cell differences in GCAP1 expression levels, as shown by immunocytochemistry (Figure 7). In spite of this variation, in most cells GCAP1 expression in the absence of GCAP2 rescued the phenotype of the wild-type rod flash response, including the initial rapid phase of recovery that follows the peak of the response (Figures 4 and 5). This was not the case in rods from the G1T3+GCAP–/– line, in agreement with the near absence of GCAP1 expression in these cells. The recovery of cone photoreceptors in these different transgenic mouse lines is currently under investigation using the paired flash ERG method. Preliminary results indicate that GCAP1, as expected, also plays a key role in cone recovery.
Our results show that the phenotype of the wild-type flash response can be rescued by GCAP1 expression in the absence of GCAP2. They also demonstrate that GCAP1 is responsible for the initial rapid phase of response recovery. The key to this role of GCAP1 is most likely its close association with GC1 under high- and low-Ca2+ conditions. This would enable GC1 to be stimulated as soon as the light-evoked fall in Ca2+ is sufficient for Ca2+ dissociation from GCAP1, which has been shown to occur in <100 ms (Sokal et al., 1999). While the results have established a prominent role for GCAP1 in rod phototransduction, they provide little information about the role played by GCAP2. Although clearly present, its contribution to rod function is uncertain and thus is an important subject for future research.
Materials and methods
GCAP1 transgene and GCAP1/GCAP2 knockout constructs
The λMG3 murine GCAP1 genomic clone and GCAP1/2 double knockout constructs have been described previously (Figure 1). Briefly, the genomic clone contains the complete coding region with intervening introns, a 5.4 kb upstream GCAP1 regulatory sequence, and an ∼2.5 kb downstream region, which includes the endogenous polyadenylation site. After subcloning into pBSKS(+), the NotI-digested fragment was used as the transgene for injection into fertilized single-cell mouse embryos. The murine GCAP genes are arranged in a tail-to-tail array, separated by ∼2.5 kb. XbaI digest of a 129/SV clone and insertion of a neocassette resulted in the elimination of GCAP1 exons 2–4 and GCAP2 exons 3 and 4. Generation and characterization of GCAP1/GCAP2 knockouts are described elsewhere (Mendez et al., 2001).
PCR genotyping transgenic and endogenous GCAP1/GCAP2 alleles
In order to discriminate between the endogenous GCAP1 allele and the GCAP1 genomic transgene, a PCR primer was generated to include the pBluescript multiple cloning site (MCS) downstream of the NotI site, which was used to cut out the transgene insert for microinjection. The MCS transgene primer 5′-CAC TAT AGG GCG TCG ACT CGA TCA CGC AGC (bold letters, MCS; italicized letters, genomic sequence) and the GCAP1 transgene primer 5′-AAG GGC GGA AGA TCA CGG AGG TAG CCC TC, located 500 bp downstream, were used to amplify the transgene. The primers used to identify the double knockout were the GCAP2 intron B primer 5′-GAA GCA GCC AGG CCA AGC CAC ACC CAT CACA and the Neo primer 5′-CGG TGG ATG TGG AAT GTG TGC GAG GCC AGA. For identification of the endogenous GCAP1/GCAP2 allele, GCAP2 exon 3 primer 5′-GGC AGG GTT TCT TCA GCT TGT AAA TCG CCT GCC AGA was used. All five primers were used in single PCRs (Promega) for each tail DNA sample. Results from a tail DNA PCR in which the mouse was transgene positive, on a wild-type and knockout endogenous GCAP1/GCAP2 background, would yield 500, 800 and 200 bp products, respectively (Figure 2A). For deletion analysis of the G1T3 promoter, a 3′ antisense anchoring primer at position –170 (5′-CAC CCA AAC TAG AGA TGC) was used in separate reactions with the following 5′ primers: –1185 (5′-TGA GTA TTG AAG GGA GCC), –1716 (5′-GAC TGC AGA CTG TAA GTC), –2252 (5′-CCA TTA GGA AGG TAG CCA), –2773 (5′-GGA TCT GCC ATC TCA TTC) and –3379 (5′-CCC TCT CCT TTG TGT AAC).
Immunocytochemistry
Eyes were fixed in 4% paraformaldehyde/0.1 M phosphate buffer (pH 7.4) overnight at 4°C and then cryoprotected in 30% buffered sucrose. Cryosections (14 µm thick) were preincubated with 10% normal goat serum (NGS). Primary and secondary antibodies were diluted with 0.1 M phosphate buffer/0.05% Triton X-100 for all reactions. Sections were incubated overnight at 4°C with UW101 or UW14 antibodies at dilutions of 1:2000 and 1:3000, respectively. Polyclonal antibodies UW14 and UW101 were raised against bacterially expressed, truncated bovine GCAP1 as described previously (Gorczyca et al., 1995) and characterized for mouse retinal tissue (Howes et al., 1998). Fluorescein isothiocyanate (FITC)-conjugated goat anti-rabbit IgG (Vector Laboratories, Inc.) was used at a dilution of 1:100 for 1 h at room temperature. Immunofluorescence was photographed with an LSM510 Inverted Laser Scan confocal microscope (Zeiss, Germany) and pictures were composed using Adobe Photoshop. In some sections, rhodamine-conjugated PNA (Vector Laboratories, Inc.), which specifically labels cone photoreceptor outer segment sheaths, was used at a concentration of 25 µg/ml for 1 h at room temperature. For double labeling experiments, a monoclonal antibody for mouse recoverin (Rcv10) (kindly provided by Dr Jim McGinnis, University of Oklahoma) was used at a concentration of 1:2000 and indirectly labeled with a rhodamine-conjugated goat anti-mouse secondary antibody.
Guanylate cyclase activity assays
Three different preparations of GC were carried out (Tsang et al., 1998). The retinas were carefully dissected from mouse eyes, homogenized with 50 mM HEPES pH 7.8, 20 mM NaCl, 60 mM KCl (50 µl per eye), and used directly in the GC assay (Otto-Bruc et al., 1997). Intact ROS was prepared according to the procedure described by Arshavsky and colleagues with some modifications (Tsang et al., 1998). The mouse retinas from 12 animals were removed from the eyecups, placed in 120 µl of 8% OptiPrep (Nycomed, Oslo, Norway) in Ringer’s buffer, and vortexed at maximum speed for 1 min. The samples were then centrifuged at 1500 r.p.m. for 1 min (Eppendorf centrifuge), and the supernatant containing the ROS was gently removed. The retina tube was added again to 120 µl of 8% OptiPrep, vortexed and centrifuged using the same method. The vortexing and sedimentation sequence was repeated five times. The collected ROS supernatant (∼1200 µl) was loaded on the Optiprep discontinuous gradient made with 10, 20 and 30% OptiPrep in Ringer’s solution in a 15 ml centrifuge tube. The tube was centrifuged at 13 000 r.p.m. for 50 min using swing bucket rotor JS13.1. The ROS was collected from 20%/30% OptiPrep interface. The ROS harvest was divided between three tubes and diluted three times with Ringer’s solution. It was then centrifuged for 30 min at 13 000 r.p.m. on the same rotor. The sedimented material contained ROS. Crude preparations of mouse ROS were obtained under dim red light by vortexing 4–12 retinas in 45% sucrose, 67 mM potassium phosphate pH 7.5 for 5 min at room temperature. Samples were centrifuged for 7 min at 7000g. The supernatants were collected, diluted 1.5 times with 67 mM potassium phosphate pH 7.5 and centrifuged at 10 000g for 10 min. The outer segment pellets were resuspended in 50 mM HEPES pH 7.8, 20 mM NaCl, 60 mM KCl, and used immediately for GC assays or frozen at –80°C. The protein concentration in each sample was determined by Bradford assay. GC activity from mouse ROS was assayed under dim red light at either low (45 nM) or high (2 µM) free Ca2+ as described previously (Haeseleer et al., 1999).
Single cell recordings
All animal procedures conformed with protocols approved by the Administrative Panel on Laboratory Animal Care at the University of Washington. Mice were dark adapted for 12–15 h, killed by cervical dislocation, and the eyes removed. The retina was isolated and stored on ice for up to 12 h in HEPES-buffered Ames solution (10 mM HEPES, pH adjusted to 7.4 with NaOH). Isolated rods were obtained by shredding a small piece of retina (∼1 mm2) with fine needles in a 160 µl drop of solution. The drop was then injected into a recording chamber mounted on the stage of an inverted microscope (Nikon Eclipse) equipped with an infrared video viewing system. The recording chamber was continuously superfused at 2–3 ml/min with bicarbonate-buffered Ames solution warmed to 37°C (pH 7.4 when equilibrated with 5%CO2/95% O2). The entire dissection was carried out under infrared illumination using a dissecting microscope equipped with infrared/visible image converters.
An isolated rod was drawn by suction into a heat-polished, silanized borosilicate electrode with an opening 1.2–1.5 µm in diameter. The electrode was filled with HEPES-buffered Ames media. Electrical connections to the bath and suction electrode were made by NaCl-filled agar bridges that contacted calomel half-cells. Bath voltage was held at ground by an active clamp circuit (Baylor et al., 1984). Membrane current collected by the suction electrode was amplified by an Axopatch 200A patch clamp amplifier (Axon Instruments, Foster City, CA), filtered at 30 Hz (–3 dB point) with an 8-pole Bessel low-pass filter, and digitized at 1 kHz.
Light from light-emitting diodes (LEDs) with peak outputs at 470, 570 and 640 nm were combined using a trifurcated fiber optic and focused on the preparation using a water-immersion lens (20× NA 0.4) in place of the microscope condensor. The light stimulus was spatially uniform and illuminated a circular area, 0.57 mm in diameter, centered on the recorded cell. Light intensities measured at the preparation were converted to equivalent photons at the wavelength of the rod’s peak sensitivity (500 nm) using the absorption spectrum of rhodopsin and the measured LED spectrum. Equivalent intensities for each experiment are given in the figure legends.
Paired flash analysis
Prior to testing, mice were allowed to adapt to the dark overnight. Under dim red light, mice were anaesthetized with a solution of ketamine (100 mg/ml) and xylazine (10 mg/ml). Pupils were dilated with a single drop of 0.5% mydryacil and 2.5% phenylephrine. Mice were placed on a heating pad maintained at 39°C, inside a Ganzfeld dome coated with reflective white paint. A small amount of 1% methylcellulose gel was applied to the eye and a platinum electrode was placed in contact with the center of the cornea. Similar platinum reference and ground electrodes were placed in the forehead and tail, respectively. After placement in the dome, mice were allowed to remain in complete darkness for 5 min. Signals were amplified with a Grass P122 amplifier (bandpass 0.1–1000 Hz). Data was acquired using a National Instruments Lab-PC DAQ board (sampling rate 10 000 Hz). Traces were averaged and analyzed with custom software written in Matlab.
Light stimulation was provided by two Novatron xenon flash lamps positioned at the top of the dome. The intensity of the test flash was ∼5500 photoisomerizations/rod. The intensity of the probe flash was calculated as 350 000 photoisomerizations/rod. Flashes were calibrated in a manner similar to that described in Lyubarsky et al. (1996). In order to deliver probe flashes intense enough to saturate the rod photocurrent, it was necessary to use white light. To calculate the number of photoisomerizations produced by the white flashes, the 500 nm to white efficacy was calculated using the methods described in Lyubarsky and Pugh (1996) and Pugh et al. (1998). A conversion factor of 1.35 log units was used.
The protocol for paired flashes was adapted from methods published previously (Lyubarsky and Pugh, 1996; Pepperberg et al., 1997). First, a test flash was delivered to suppress the circulating current of the rod photoreceptors. The recovery of this current was monitored by delivering a second flash, termed the probe flash. The interstimulus interval between the two flashes was varied from 500 to 5000 ms. For an interstimulus of 500 ms the conditioning flash completely suppressed the rod a-wave. Each trial was separated by at least 120 s of darkness to allow the retina time to dark-adapt. The amplitude of the probe flash alone was monitored throughout the experiment to ensure that this time was sufficient. These ‘probe alone’ flashes were also used to normalize the response of probe flashes following a test flash. The normalized amplitude of the probe flash a-wave versus the interstimulus interval were plotted and fit to the following equation: 1–e[–(t–T)/tau]. T is the critical time before which there is no rod recovery, and tau is the recovery time constant.
Acknowledgments
Acknowledgements
Dr James McGinnis (University of Oklahoma) provided the anti-recoverin monoclonal antibody used in Figure 7. We would like to thank Dr Jeannie Chen for critically reading the manuscript. We are indebted to J.Preston Van Hooser for helpful comments and assistance. We would like to acknowledge David Birch for help designing the ERG setup, and Ed Pugh and Arkady Lyubarsky for help with calibrations. This research was supported in part by grants EY08123 (to W.B.), EY08061 (to K.P.), EY0248 (to P.B.D.), EY11850 (to F.R.), EY04446 (to S.W.), EY07001 (to S.W.) and EY02520 (to S.W.) from the National Eye Institute. We further acknowledge grants from Research to Prevent Blindness, Inc. (RPB) to the Departments of Ophthalmology at the University of Washington and the University of Utah, a Center Grant from Foundation Fighting Blindness, Inc., to the University of Utah, the Ruth and Milton Steinbach Fund (Seattle, WA), the E.K. Bishop Foundation, a grant from the Macular Vision Research Foundation to W.B and K.A.H., the Retina Research Foundation, Houston, TX. W.B. and K.P. are recipients of an RBP Senior Investigator Award. M.P. is supported by the Baylor Research Advocates for Student Scientists (BRASS) and the Medical Scientist Training Program (MSTP).
References
- Baehr W., Schmidt,B., Church-Kopish,J. and Howes K.A. (2000) Generation of GCAP1 transgenic mice. Invest. Ophthalmol. Vis. Sci., 41, S606. [Google Scholar]
- Baylor D.A., Nunn,B.J. and Schnapf,J.L. (1984) The photocurrent, noise and spectral sensitivity of rods of the monkey Macaca fascicularis. J. Physiol., 357, 575–607. [DOI] [PMC free article] [PubMed] [Google Scholar]
- Cuenca N., Lopez,S., Howes,K. and Kolb,H. (1998) The localization of guanylyl cyclase-activating proteins in the mammalian retina. Invest. Ophthalmol. Vis. Sci., 39, 1243–1250. [PubMed] [Google Scholar]
- Gorczyca W.A., Polans,A.S., Surgucheva,I., Subbaraya,I., Baehr,W. and Palczewski,K. (1995) Guanylyl cyclase activating protein: a calcium-sensitive regulator of phototransduction. J. Biol. Chem., 270, 22029–22036. [DOI] [PubMed] [Google Scholar]
- Haeseleer F., Sokal,I., Li,N., Pettenati,M., Rao,N., Bronson,D., Wechter,R., Baehr,W. and Palczewski,K. (1999) Molecular characterization of a third member of the guanylyl cyclase-activating protein subfamily. J. Biol. Chem., 274, 6526–6535. [DOI] [PubMed] [Google Scholar]
- Howes K. et al. (1998) Gene array and expression of mouse retina guanylate cyclase activating proteins 1 and 2. Invest. Ophthalmol. Vis. Sci., 39, 867–875. [PubMed] [Google Scholar]
- Hurley J.B. and Chen,J. (2001) Evaluation of the contributions of recoverin and GCAPs to rod photoreceptor light adaptation and recovery to the dark state. In Kolb,H., Ripps,H. and Wu,S.M. (eds), Progress in Brain Research. Elsevier Science, Amsterdam, The Netherlands, pp. 395–405. [DOI] [PubMed]
- Imanishi Y., Li,N., Sowa,M.E., Lichtarge,O., Wensel,T.G., Saperstein,D.A., Baehr,W. and Palczewski,K. (2002) Characterization of retinal guanylate cyclase-activating protein 3 (GCAP3) from zebrafish to man. Eur. J. Neurosci., 15, 63–78. [DOI] [PMC free article] [PubMed] [Google Scholar]
- Kachi S., Nishizawa,Y., Olshevskaya,E., Yamazaki,A., Miyake,Y., Wakabayashi,T., Dizhoor,A. and Usukura,J. (1999) Detailed localization of photoreceptor guanylate cyclase activating protein-1 and -2 in mammalian retinas using light and electron microscopy. Exp. Eye Res., 68, 465–473. [DOI] [PubMed] [Google Scholar]
- Kelley M.W., Williams,R.C., Turner,J.K., Creech-Kraft,J.M. and Reh,T.A. (1999) Retinoic acid promotes rod photoreceptor differentiation in rat retina in vivo. Neuroreport, 10, 2389–2394. [DOI] [PubMed] [Google Scholar]
- Lem J., Applebury,M.L., Falk,J.D., Flannery,J.G. and Simon,M.I. (1991) Tissue-specific and developmental regulation of rod opsin chimeric genes in transgenic mice. Neuron, 6, 201–210. [DOI] [PubMed] [Google Scholar]
- Li N., Sokal,I., Bronson,J.D., Palczewski,K. and Baehr,W. (2001) Identification and functional regions of guanylate cyclase-activating protein 1 (GCAP1) using GCAP1/GCIP chimeras. Biol. Chem., 382, 1179–1188. [DOI] [PubMed] [Google Scholar]
- Lyubarsky A.L. and Pugh,E.N.,Jr (1996) Recovery phase of the murine rod photoresponse reconstructed from electroretinographic recordings. J. Neurosci., 16, 563–571. [DOI] [PMC free article] [PubMed] [Google Scholar]
- Lyubarsky A.L., Falsini,B., Pennesi,M.E., Valentini,P. and Pugh,E.N.,Jr (1999) UV- and midwave-sensitive cone-driven retinal responses of the mouse: a possible phenotype for coexpression of cone photopigments. J. Neurosci., 19, 442–455. [DOI] [PMC free article] [PubMed] [Google Scholar]
- McBee J.K., Palczewski,K., Baehr,W. and Pepperberg,D.R. (2001) Confronting complexity: the interlink of phototransduction and retinoid metabolism in the vertebrate retina. Prog. Retin. Eye Res., 20, 469–529. [DOI] [PubMed] [Google Scholar]
- Mendez A., Burns,M.E., Sokal,I., Dizhoor,A.M., Baehr,W., Palczewski,K., Baylor,D.A. and Chen,J. (2001) Role of guanylate cyclase-activating proteins (GCAPs) in setting the flash sensititvity of rod photoreceptors. Proc. Natl Acad. Sci. USA, 98, 9948–9953. [DOI] [PMC free article] [PubMed] [Google Scholar]
- Moritz O.L., Tam,B.M., Papermaster,D.S. and Nakayama,T. (2001) A functional rhodopsin-green fluorescent protein fusion protein localizes correctly in transgenic Xenopus laevis retinal rods and is expressed in a time-dependent pattern. J. Biol. Chem., 276, 28242–28251. [DOI] [PubMed] [Google Scholar]
- Ohler U., Harbeck,S., Niemann,H., Noth,E. and Reese,M.G. (1999) Interpolated markov chains for eukaryotic promoter recognition. Bioinformatics, 15, 362–369. [DOI] [PubMed] [Google Scholar]
- Olshevskaya E.V., Ermilov,A.N. and Dizhoor,A.M. (1999) Dimerization of guanylyl cyclase-activating protein and a mechanism of photoreceptor guanylyl cyclase activation. J. Biol. Chem., 274, 25583–25587. [DOI] [PubMed] [Google Scholar]
- Olsson J.E. et al. (1992) Transgenic mice with a rhodopsin mutation (Pro23His): a mouse model of autosomal dominant retinitis pigmentosa. Neuron, 9, 815–830. [DOI] [PubMed] [Google Scholar]
- Otto-Bruc A. et al. (1997) Functional reconstitution of photoreceptor guanylate cyclase with native and mutant forms of guanylate cyclase activating protein 1. Biochemistry, 36, 4295–4302. [DOI] [PubMed] [Google Scholar]
- Palczewski K., Polans,A.S., Baehr,W. and Ames,J.B. (2000) Calcium binding proteins in the retina: structure, function, and the etiology of human visual diseases. BioEssays, 22, 337–350. [DOI] [PubMed] [Google Scholar]
- Pepperberg D.R., Birch,D.G. and Hood,D.C. (1997) Photoresponses of human rods in vivo derived from paired-flash electroretinograms. Vis. Neurosci., 14, 73–82. [DOI] [PubMed] [Google Scholar]
- Pugh E.N. Jr, Falsini,B. and Lyubarski,A.L. (1998) The origin of the major rod- and cone driven components of the rodent electroretinogram, and the effect of age and light-rearing history on the magnitudes of these components. In Williams,T.P. and Thistle,A.B. (eds), Photostasis and Related Topics. Plenum, New York, pp. 93–128.
- Sam M., Wurst,W., Forrester,L., Vauti,F., Heng,H. and Bernstein,A. (1996) A novel family of repeat sequences in the mouse genome responsive to retinoic acid. Mamm. Genome, 7, 741–748. [DOI] [PubMed] [Google Scholar]
- Sokal I., Otto-Bruc,A.E., Surgucheva,I., Verlinde,C.L., Wang,C.K., Baehr,W. and Palczewski,K. (1999) Conformational changes in guanylyl cyclase-activating protein 1 (GCAP1) and its tryptophan mutants as a function of calcium concentration. J. Biol. Chem., 274, 19829–19837. [DOI] [PubMed] [Google Scholar]
- Sokal I., Li,N., Klug,C.S., Filipek,S., Hubbell,W.L., Baehr,W. and Palczewski,K. (2001) Calcium-sensitive regions of GCAP1 as observed by chemical modifications, flourescence and EPR spectroscopies. J. Biol. Chem., 276, 43361–43373. [DOI] [PMC free article] [PubMed] [Google Scholar]
- Tsang S.H., Burns,M.E., Calvert,P.D., Gouras,P., Baylor,D.A., Goff,S.P. and Arshavsky,V.Y. (1998) Role for the target enzyme in deactivation of photoreceptor G protein in vivo. Science, 282, 117–121. [DOI] [PubMed] [Google Scholar]
- Yang R.B., Robinson,S.W., Xiong,W.H., Yau,K.W., Birch,D.G. and Garbers,D.L. (1999) Disruption of a retinal guanylyl cyclase gene leads to cone-specific dystrophy and paradoxical rod behavior. J. Neurosci., 19, 5889–5897. [DOI] [PMC free article] [PubMed] [Google Scholar]
- Yau K.W., Lamb,T.D. and Baylor,D.A. (1977) Light-induced fluctuations in membrane current of single toad rod outer segments. Nature, 269, 78–80. [DOI] [PubMed] [Google Scholar]
- Zack D.J., Bennet,J., Wang,Y., Davenport,C., Klaunberg,B., Gearhart,J. and Nathans,J. (1991) Unusual topography of bovine rhodopsin promoter-lacZ fusion gene expression in transgenic mouse retinas. Neuron, 6, 187–199. [DOI] [PubMed] [Google Scholar]