



ABSTRACT
Alterations to the community structure and function of the microbiome are associated with changes to host physiology, including immune responses. However, the contribution of microbe‐derived RNAs carried by outer membrane vesicles (OMVs) to host immune responses remains unclear. This study investigated the role of OMVs and OMV‐associated small RNA (sRNA) species from pathogenic and commensal Bacteroides fragilis (ETBF and NTBF, respectively) in eliciting different immune responses from intestinal epithelial cells. To distinguish the differences in the sRNA profiles of the two strains and their OMVs, RNA‐seq, qRT‐PCR, and northern blotting were conducted to identify enrichment of discrete sRNA species in OMVs, which were also differentially expressed between the two strains. Specifically, coding and non‐coding RNAs were enriched in OMVs from NTBF and ETBF, with BF9343_RS22680 and BF9343_RS17870 being significantly enriched in ETBF OMVs compared to NTBF. To understand the effects of OMVs on pattern recognition receptors, reporter cells of Toll‐like receptor (TLR) activation were treated with OMVs, demonstrating activation of TLRs 2, 3, and 7. Treatment of Caco‐2 and HT29‐MTX cells with OMVs demonstrated increased expression of IL‐8. Surprisingly, we discovered that degradation of RNase‐accessible RNAs within ETBF OMVs, but not NTBF OMVs, resulted in vesicles with enhanced capacity to stimulate IL‐8 expression, indicating that these extravesicular RNAs exert an immunosuppressive effect. This suggests a dual role for OMV‐associated RNAs in modulating host immune responses, with implications for both bacterial pathogenesis and therapeutic applications.
Keywords: Bacteroides fragilis, outer membrane vesicles, small RNA
Outer membrane vesicles (OMVs) from Bacteroides fragilis carry distinct coding and non‐coding RNAs that influence host inflammatory signaling. Extravesicular RNAs from OMVs suppress IL‐8 expression in intestinal epithelial cells, while removal of these RNAs enhances pro‐inflammatory IL‐8 responses. These findings reveal dual immunomodulatory roles for OMV‐associated RNAs, highlighting a mechanism by which pathogenic B. fragilis may fine‐tune host immune responses.

1. Introduction
Colorectal cancer (CRC) is the third most commonly diagnosed cancer in the United States and represents the second most common cause of global cancer‐related mortality ([Link], [Link]). Chronic intestinal inflammation is a key factor driving CRC pathogenesis (Sharma et al. 2022; Hanahan and Weinberg 2011), as exemplified by patients with inflammatory bowel disease (IBD) who face an elevated risk of developing colitis‐associated CRC (CAC) (Wanders et al. 2014; Eaden 2001; Baker et al. 2018). Over time, persistent inflammation associated with IBD disrupts the intestinal barrier, promotes epithelial injury, and fosters an environment conducive to tumorigenesis (Arthur et al. 2012; Meira et al. 2008; Stidham and H 2018; Petkau et al. 2017).
A crucial determinant of this inflammatory milieu is the composition and functional state of the gut microbiome. The intricate community of bacteria, viruses and fungi within the gut typically exists in a symbiotic relationship with the host. However, alterations in the microbial community structure can lead to sustained inflammation (Cho and Blaser 2012; VB 2017; Glassner et al. 2020), predisposing to CRC development (Cipe et al. 2015; Lazar et al. 2018). Among the microbial constituents implicated in CRC pathogenesis is Bacteroides fragilis, which is commonly found in the gut as a non‐enterotoxic (NTBF) strain that generally supports immunotolerance (Huang et al. 2011; Round and Mazmanian 2010). In contrast, enterotoxigenic B. fragilis (ETBF) produces a toxin (BFT or fragilysin) that cleaves E‐cadherin in tight junctions, thereby compromising the epithelial barrier and promoting pro‐inflammatory signalling (Wu et al. 1998; Moncrief et al. 1995). Although BFT is well‐characterized, other bacterial factors also appear to drive inflammation (Mancuso et al. 2005; Wick et al. 2014), and their precise modes of secretion and delivery to host cells remain under investigation.
One avenue for bacterial‐host communication is the release of outer membrane vesicles (OMVs) (Zakharzhevskaya, Tsvetkov, et al. 2017; Zakharzhevskaya, Vanyushkina, et al. 2017). These 50–250 nm vesicles, shed by Gram‐negative bacteria including B. fragilis, carry a variety of biologically active components, proteins, lipids, lipopolysaccharides (LPS), peptidoglycans (PGs) and nucleic acids (Choi et al. 2017; Elhenawy et al. 2014; Bitto et al. 2017), that can directly interact with host cells (Sheikh et al. 2021; Kaparakis‐Liaskos and Ferrero 2015; Domingues and Nielsen 2017, 2012). OMVs have been shown to activate pattern recognition receptors (PRRs), such as the Toll‐like receptor (TLR) family, leading to downstream immune cascades. TLRs recognize pathogen‐associated molecular patterns (PAMPs) and can be categorized as extracellular and intracellular (endosomal) entities (Sheikh et al. 2021). Extracellular TLRs recognize lipooligosaccharides (LOS), LPS, PGs, and flagellin, among other ligands, whereas endosomal TLRs bind to foreign DNA, dsRNA, and ssRNA taken up by host cells (Sheikh et al. 2021; Abe et al. 2012; Abreu et al. 2001; Asami et al. 2013; Bu et al. 2010). TLR activation typically results in a cascade that leads to cytoplasmic phosphorylation of the NFκB and IRF transcription factors, which can translocate to the nucleus and induce the expression of pro‐inflammatory (e.g., TNF‐α, IL‐1β, IL‐6, and IL‐8) or anti‐inflammatory (e.g., IL‐10) cytokines. Although most research on OMV‐mediated TLR activation has focused on canonical bacterial ligands such as LPS and PGs, recent studies highlight OMV‐associated RNAs as potential drivers of host immune responses (Choi et al. 2017; Marion et al. 2019; Satarian et al. 2019; Soderblom et al. 2005; Lee et al. 2018; Koeppen et al. 2016; Wang et al. 2024; Rodriguez and Kuehn 2020).
Despite growing awareness of the importance of vesicular RNA, significant questions remain regarding the specific RNA sequences that become enriched in OMVs, and how these RNAs may influence host cells differently when derived from pathogenic versus commensal strains. To address these gaps, we profiled OMVs from NTBF and ETBF, assessing their size, protein enrichment, and RNA cargo. We identified distinct RNA species, some protected from, and others susceptible to, RNase degradation, that appear to modulate the inflammatory response. Notably, RNase‐sensitive OMV‐associated RNAs conferred an immunosuppressive effect, reducing the ability of OMVs to induce IL‐8 expression. By revealing an unexpected role for vesicular RNAs in shaping immune responses, our study provides insight into how bacterial RNA cargo can either exacerbate or temper inflammation in the intestinal environment. This knowledge holds promise for guiding the development of OMV‐based therapeutics aimed at modulating gut inflammation and mitigating CRC risk.
2. Materials and Methods
2.1. Bacteria Strain and Culture Preparation
Enterotoxigenic B. fragilis (ETBF; 86‐5443‐2‐2) and non‐toxigenic B. fragilis (NTBF; NCTC 9343) were provided as a gift by Dr. Cindy Sears at Johns Hopkins University. Bacteria were cultured in brain heart infusion (BHI) broth under anaerobic conditions overnight at 37°C until an OD600 reading of 0.8–1.0 was achieved, which is characterized as the exponential phase for this bacterium. All OMV isolations proceeded using the same OD600 for the exponential phase.
2.2. Ultracentrifugation Isolation of OMVs
One litre of NTBF and ETBF cultures was spun down at 8000 × g for 15 min at 4°C, and the resulting supernatant was filtered through a 0.45 µm vacuum filter (Thermo Scientific, 168‐0045). The filtered supernatant was ultracentrifuged at 100,000 × g for 2 h at 4°C (Beckman Coulter 70 Ti), and pelleted vesicles were resuspended in PBS. All preparations were either immediately used for downstream experiments or kept for no more than 24 h at 4°C. Vesicular sample concentrations were determined with the Pierce BCA Protein Assay Kit (Thermo Scientific, 23227).
2.3. Column Isolation and Concentration of OMVs
OMVs were isolated from NTBF and ETBF using the ExoBacteria OMV Isolation Kit (System Biosciences, EXOBAC100A‐1), which is a precipitation‐free, ion‐exchange chromatography system, as per the manufacturer's instructions. Briefly, 250 mL of ETBF and NTBF cultures were spun down at 8000 × g for 15 min at 4°C, and the resulting supernatant was filtered through a 0.45 µm vacuum filter (Thermo Scientific, 168‐0045). Filtered supernatant was run through the ExoBacteria OMV isolation column, and each column yielded 1.5 mL of eluted OMVs. Five columns were used per culture, resulting in 15 mL of each strain. The resulting solution of OMVs was concentrated using centrifugal concentration tubes (Thermo Scientific, 88532) at 5500 × g for 15 min. Vesicular sample protein concentrations were determined by disruption using RIPA buffer and quantification with the Pierce BCA Protein Assay Kit (Thermo Scientific, 23227).
2.4. OMV Protein Characterization
OMV samples were diluted in SDS buffer to concentrations of 1500, 1000, 500 and 200 µg/mL. All samples were run on a 10% SDS‐PAGE gel (Bio‐Rad, 4568033) at 175 V. The gel was subjected to silver staining using the Pierce Silver Stain Kit (Thermo Scientific, 24612) as per the manufacturer's instructions.
2.5. OMV Size Profiling
Nanoparticle tracking analysis was conducted using the Exoid (Izon Science Limited) with default parameters.
2.6. Transmission Electron Microscopy
Concentrated OMVs were prepared for TEM imaging by staining with uranyl acetate and osmium tetroxide separately, as described previously (Sheikh et al. 2023), then co‐staining with osmium tetroxide and uranyl acetate. For uranyl acetate, copper grids were incubated on 10 µL drops of OMVs for 5 min, followed by two washes on DI water drops for 2.5 min each and finally stained with 2% uranyl acetate for 1 min. For the osmium tetroxide and uranyl acetate co‐stain, 10 µL of OMVs were mixed with an equivalent volume of 4% osmium tetroxide for 10 min on copper grids, followed by staining with 2% uranyl acetate for 1 min. All grids had excess liquid blotted off with filter paper and were allowed to dry overnight. The grids were then imaged with a TEM (JEM‐1010, JEOL Inc., Tokyo, Japan), and a minimum of seven images per test condition were obtained.
2.7. Mass Spectrometry
Proteins were identified using liquid chromatography tandem mass spectrometry (LC‐MS/MS). Proteins from NTBF and ETBF OMVs were excised from the 25, 40, 55, 70, and 100 kDa bands of SDS‐PAGE gels and prepared by in‐gel digestion. LC‐MS/MS data were searched against a B. fragilis reference proteome to identify proteins. A full description of the proteomics methodology can be found in the Supporting Information.
2.8. Small RNA Isolation
Matched samples of RNA isolated from whole bacteria and corresponding OMVs were isolated in three individual preparations. RNA samples were isolated using the GeneJET RNA Purification Kit (Thermo Scientific, K0732) as per the manufacturer's instructions for bacterial RNA isolation. RNA quality was assessed with a Bioanalyzer (Agilent Technologies, Santa Clara, CA, USA), and RNA concentrations were determined using the Qubit3 RNA HS Assay Kit (Invitrogen, Q32852).
2.9. RNase Protection Assay and Total RNA Isolation
Concentrated OMVs were incubated with 10 µg/mL of RNase A at 37°C for 1 h. The solution was then treated with RNAsecure RNA Inactivation Reagent (Invitrogen; AM7006) for 10 min. Three matched preparations of whole cell pellets, RNase‐treated OMVs, and untreated OMVs were subjected to hot phenol RNA extraction. Whole cell pellets were treated in 1.5 mL of 0.5 mg/mL of lysozyme in 10 mM Tris‐HCl solution and incubated at 37°C for 5 min. For each 1.5 mL of whole cell and OMV samples, 150 µL of 10% SDS and 30 µL of 7.5 M ammonium acetate were added, followed by equal amounts of phenol:chloroform:isoamyl alcohol (25:24:1; pH ∼5.2), which was then vortexed until the solution was emulsified. Samples were incubated at 65°C for 15 min with a brief vortex every 5 min and then chilled on ice for 5 min. Samples were centrifuged at 15,000 × g for 10 min at 4°C, and the aqueous layer was collected before an equal amount of chloroform was added. Samples were centrifuged again at 15,000 × g for min at 4°C, and the aqueous layer was removed. 100 µL of 7.5 M ammonium acetate and 2X chilled 95% ethanol were added to the mixture, vortexed and centrifuged at 15,000 × g for 20 min at room temperature. The supernatant was decanted, and 80% ethanol was added to wash the RNA pellet before centrifugation at 15,000 × g for 20 min at 4°C. Lastly, the supernatant was decanted and allowed to air dry briefly before resuspension in 100 µL of ultrapure water.
2.10. RNA Sequencing and Analysis of B. fragilis Small RNAs
Small RNA extractions were quantified by Quant‐iT RiboGreen RNA assay (Life Technologies, Thermo‐Fisher) and assessed for purity using a Thermo Scientific Nanodrop 2000 spectrophotometer. To create indexed sequencing libraries, the Takara Biosciences (formerly Clontech) SMARTer smRNA‐Seq kit for Illumina (catalog 635029) was used, which is suitable for sequencing small RNAs from low‐yield samples. Illumina adapter and index sequences were incorporated without ligation to ensure diverse small RNAs are represented. Fifty nanograms of starting material was used for each library.
Resulting libraries were quantified using Biotium Accuclear 7 DNA standards High Sensitivity assay (fluorometric quantitation) and the size distribution determined by Agilent Bioanalyzer using the High Sensitivity DNA assay. Fragment molarity and samples were normalized to 1.0 nM before pooling for sequencing at a loading concentration of 1.8 pM on the Illumina NextSeq 500 using a High output 75 cycle reagent kit v2. Sequence reads were then demultiplexed using bcl2fastq2 before subsequent bioinformatic analysis.
Reads from all samples were trimmed and aligned to each B. fragilis genome (ETBF: 86‐5443‐2‐2, NTBF: NCTC 9343) using the STAR aligner with default parameters. RNA enrichment analysis and visualization were completed using R (version 4.2.1 – “Funny‐Looking Kid”) and RStudio (version 2022.07.2 – “Spotted Wakerobin”). Data analysis and visualization were completed using tidyverse (version 1.3.2), DESeq2 package (version 1.4.2), ggplot2 (version 3.3.6), EnhancedVolcano (version 1.14.0), and pheatmap (version 1.0.12). Data tables provided as Supplemental files 2 (ETBF aligned) and 3 (NTBF aligned).
2.11. Read Coverage Analysis
RNA coverage from sequencing data was visualized with Integrative Genome Viewer (Version 2.8.12). Northern blot probes were created by taking the complementary sequence of the densest read regions of the identified genes and intergenic regions of interest.
2.12. qRT‐PCR of Bacterial RNAs
Total RNA (1 µg) was reverse‐transcribed using the High‐Capacity cDNA Reverse Transcription Kit (Applied Biosystems, 4368814) as per the manufacturer's instructions. The qPCR was performed with diluted cDNA using primer sets for genes identified through RNA‐seq analysis. PCR amplification of RNA was performed using Power SYBR Green PCR Master Mix (Applied Biosystems, 4367659). All qPCR experiments were run in technical quadruplicates and biological triplicates, and a mean value was used for the determination of RNA levels. Images were generated using GraphPad Prism 9.
2.13. Northern Blotting of Bacterial RNAs
Northern blots of total RNA samples were conducted as follows. Northern blot probes were created by taking the complementary sequence to regions‐of‐interest with high coverage in OMV‐enriched RNA‐seq data. Probes were labelled with DIG using the 2nd generation DIG oligonucleotide 3′‐end labelling kit (Roche, 03353575910) according to the manufacturer's instructions and diluted to a concentration of 1 ng/mL in 10 mL of ULTRAhyb ultrasensitive hybridization buffer (Invitrogen, AM8670). Thirty micrograms of RNA samples were loaded onto 15% Mini‐PROTEAN Tris‐borate EDTA (TBE)‐Urea gel (Bio‐Rad, 4566053) and run for 2 h at 90 V in 1X TBE buffer. Transfer of RNA was completed in 1X TBE buffer onto a positively charged nylon membrane (Invitrogen, AM10102) for 3 h at 60 V in cold conditions. Blots were UV crosslinked and incubated in hybridization buffer for 1 h before being probed overnight at 42°C. Probes were poured off and blots were washed twice in 2X SSC with 0.1% SDS buffer for 15 min, twice in 0.1X SSC with 0.1% SDS buffer for 5 min, and once in 1X SSC buffer for 10 min. Blots were processed using the DIG wash and block buffer set (Roche, 11585762001) as per the manufacturer's instructions and imaged using ChemiDoc MP Imaging System (Bio‐Rad, 12003154) for 20 min.
2.14. Cell Lines
Caco‐2 and HT29‐MTX cells purchased from ATCC (Manassas, Virginia, USA), and HEK‐Blue TLR cells were obtained from InvivoGen. All cell lines were cultured in Dulbecco's Modified Eagle's Medium (DMEM) (Corning Inc.; Kennebuck, ME, USA) supplemented with 10% foetal bovine serum (FBS) (Equitech‐Bio Inc.; Kerrville, Texas, USA) and 1X antibiotics (Penicillin/Streptomycin, Lonza; Basel, Switzerland). HEK‐Blue TLR cells were additionally supplemented with 100 µg/mL of Normocin (Invivogen, ant‐nr‐1), 1X HEK‐Blue Selection (Invivogen, hb‐sel), 100 µg/mL of Zeocin (Invivogen, ant‐zn‐05), and 30 µg/mL of blasticidin (Invivogen, ant‐bl‐05). Cell lines were tested for mycoplasma every 2 weeks. Incubation occurred at 37°C with 5% CO2.
2.15. TLR Reporter Assays
HEK‐Blue TLR reporter assays (Invivogen) were carried out as per the manufacturer's specifications for specific TLRs. Cells were treated with 100 and 10 µg/mL of ETBF and NTBF vesicles.
2.16. RNA Extraction and qRT‐PCR
Caco‐2 and HT29 cells were treated with 100 and 10 µg/mL of unconcentrated NTBF and ETBF vesicles for 2 and 8 h. Cells were lysed in the presence of Trizol Reagent (Invitrogen, 15596026). RNA was extracted following the manufacturer's instructions. RNA (250 ng) was reverse‐transcribed using the High‐Capacity cDNA Reverse Transcription Kit (Applied Biosystems, 4368814) as per the manufacturer's instructions. The qPCR was performed with diluted cDNA using primer sets for cytokine genes. PCR amplification of RNA was performed using Power SYBR Green PCR Master Mix (Applied Biosystems, 4367659). All qRT‐PCR experiments were run in technical quadruplicates and biological triplicates, and a mean value was used for the determination of RNA levels. Images were generated using GraphPad Prism 9.
2.17. Fluorescent Imaging of RNA and OMVs in Colonic Epithelial Cells
Staining of RNA and OMVs in colonic epithelial cells was performed as follows. Isolated OMVs from ETBF and NTBF strains were stained with SytoRNASelect (Thermo Fisher Scientific) to detect RNA. OMVs were incubated with SytoRNASelect at a final concentration of 5 µM in phosphate‐buffered saline (PBS) for 30 min at 37°C in the dark. After staining, OMVs were washed twice by ultracentrifugation at 100,000 × g for 1 h at 4°C to remove excess dye. For membrane labelling, RNA‐stained OMVs were further incubated with Vybrant DiD (Thermo Fisher Scientific) at a final concentration of 1 µM for 30 min at 37°C in the dark. OMVs were washed again in PBS by centrifugation to remove unbound dye and resuspended in PBS for further use. Caco2 colonic epithelial cells were seeded on glass coverslips in 24‐well plates at a density of 1 × 10⁵ cells per well and incubated in Dulbecco's Modified Eagle Medium (DMEM; Thermo Fisher Scientific) supplemented with 10% FBS, 1% non‐essential amino acids, and 1% penicillin‐streptomycin at 37°C in a humidified atmosphere with 5% CO2. Cells were treated with stained OMVs (100 µg/mL) for 30 min at 37°C. Following treatment, cells were washed three times with PBS to remove unbound OMVs and fixed with 4% paraformaldehyde for 15 min at room temperature. Cells were then permeabilized with 0.1% Triton X‐100 in PBS for 5 min and washed again with PBS. For nuclear staining, cells were incubated with DAPI (4',6‐diamidino‐2‐phenylindole, Thermo Fisher Scientific) at a concentration of 1 µg/mL in PBS for 5 min at room temperature in the dark. After staining, cells were washed three times with PBS. Coverslips were mounted onto glass slides using ProLong Gold Antifade Mountant (Thermo Fisher Scientific). For endoplasmic reticulum (ER) staining, cells were incubated with an anti‐protein disulfide isomerase (PDI) antibody (1:200 dilution; Abcam) in PBS containing 1% bovine serum albumin (BSA) overnight at 4°C, followed by washing and incubation with Alexa Fluor 594‐conjugated secondary antibody (1:500 dilution; Thermo Fisher Scientific) for 1 h at room temperature in the dark. Stained cells were mounted and imaged using a Leica SP8 confocal laser scanning microscope, with image acquisition parameters optimized to avoid signal bleed‐through between channels.
3. Results
3.1. Differentially Enriched RNA Contents Between ETBF and NTBF OMVs and Whole‐Cell
Our initial step was to explore the potential differential signalling of ETBF versus NTBF encapsulated RNAs. To do this, we isolated and sequenced small RNA from ETBF and NTBF OMVs, along with whole‐cell lysates of their reference bacterial cultures. Cross‐alignment of reads to both ETBF and NTBF genomes was conducted to detect differentially enriched and unique sequences using DESeq2 analysis. We first characterized the proportion of gene coding sequence types in each of the samples (Figure 1A,B). In the OMV samples, we found a significant enrichment of mRNAs and a depletion of rRNA and tRNA sequences, when compared to the whole cell (WC) samples, though both rRNA and tRNA reads were relatively abundant within OMVs.
FIGURE 1.

RNA sub‐type enrichment is significantly different between ETBF and NTBF OMVs and whole cells. (A, B) The average proportion of sequencing reads mapped to the NTBF (A) and ETBF (B) genomes and represented by RNA class. Data represent the mean of n = 3 biological replicates. (C, D) Unsupervised hierarchical clustering of DESeq2 analysis of gene coding regions using DESeq2 reveals enrichment of RNA sequences in OMVs and whole cell (WC) samples when they are aligned to the NTBF (C) and ETBF (D) genomes. (E, F) Unsupervised hierarchical clustering of DESeq2 analysis of intergenic, non‐coding regions aligned to the NTBF (E) and ETBF (F) genomes. E = ETBF and N = NTBF. (G, H) Proportion of transcript types represented in data aligned to the NTBF genome (G) or the ETBF genome (H). Statistical significance was determined using a paired t‐test, and a p value of <0.05 was considered significant.
Because selective loading of specific transcripts could underlie strain‑specific host responses, we next profiled the top‐enriched small RNAs in ETBF versus NTBF OMVs. We identified the most enriched RNA species in OMV samples by strain using DESeq2. For this, we first focused on sequences that mapped to known genes. RNAs loaded into OMVs by both strains of B. fragilis are more similar to each other than to the RNA retained in the whole cell; however, sufficient differences remained to distinguish OMVs from each strain (Figure 1C,D). Although most sequences detected were depleted in OMVs relative to whole cell, a subset of protein‐coding sequences was significantly enriched (Figure 1C,D). As sRNAs may result from transcription of intergenic regions as well as from protein‐coding or other functional categories, we next analysed enrichment of reads that do not map to known genes. Similarly, analysis of intergenic reads confirms the loading of a subset of non‐coding transcripts within both NTBF and ETBF OMVs (Figure 1E,F).
Analysis of known transcripts present within OMVs successfully distinguished OMVs from intact cells, as well as distinguishing OMVs derived from NTBF and ETBF. To identify the specific RNAs responsible for these distinctions, we analysed the RNA‐seq data for statistical significance and fold change. Although dozens of transcripts were depleted in OMVs (Figure 2A–D), only two were significantly enriched in ETBF OMVs versus NTBF OMVs (Figure 2E,F). One, BF9343_RS22680, partially encodes for a hypothetical protein, and the other, BF9343_RS17870, partially encodes for a DUF4373 domain‐containing protein.
FIGURE 2.

Bacteroides fragilis OMV RNA transcripts show differential abundance between ETBF and NTBF. (A, B) Enrichment of transcripts from established gene coding regions for combined OMV and whole cell (WC) samples when they are aligned to the NTBF (A) and ETBF (B) genomes. (C, D) Enrichment of transcripts from intergenic regions for combined OMV and WC samples when they are aligned to the NTBF (C) and ETBF (D) genomes. (E, F) Enrichment of transcripts from established gene coding regions for OMV samples from ETBF and NTBF when they are aligned to the NTBF (E) and ETBF (F) genomes. All panels are derived from the same RNA‐seq dataset; RNA transcript IDs are in the supplemental datasets. Limits of biological and statistical significance are log2FC was set at 5, and the adjusted p value was set to 10−4. (G) qRT‐PCR for indicated known transcripts and intergenic regions. Normalized to rubredoxin and referenced to NTBF WC. n = 3; n.d. = not detected. (H, I) To confirm the size of tRNA (H) and CoA Ligase (I) transcripts, northern blot probes complementary to the RNAseq reads were used and successfully detected transcripts in OMVs at a lower length than in WC samples (denoted by arrows).
To validate both protein‐coding and intergenic transcripts detected via RNA‐seq, we selected a set of transcripts that were highly abundant or differentially enriched for validation with qRT‐PCR and northern blotting. We targeted genes that met our enrichment criteria (Log2FC = 5, p value = 10−4) and had high count numbers (∼2000 counts) from both established and intergenic transcripts. The two transcripts that were enriched in ETBF OMVs over NTBF OMVs (Figure 2E) were also included. For normalization by qRT‐PCR, we used the rubredoxin transcript, which was not differentially expressed between OMV and whole cell (WC) samples and was abundant in all samples. Twenty of 22 RNAseq‐defined differentially expressed transcripts were verified by qRT‐PCR (Figure 2G). Notable enrichments include depletion of intergenic transcript AC141_RS05405:AC141_RS05410 in OMVs, NTBF‐specific detection of type I deoxyribonuclease HsdR and intergenic transcript BF9343_RS22680, enrichment of glutamate decarboxylase in ETBF OMVs relative to NTBF OMVs, and enrichment of intergenic transcript BF9343_RS22615:BF9343_RS11010 in ETBF OMVs (Figure 2G).
To validate the size of detected transcripts, we selected two RNAs for northern blotting. Probes for tRNA‐Phe and O‐succinylbenzoic acid‐CoA ligase (CoA ligase) were designed to be complementary to the highest coverage region of OMV‐derived RNAseq read alignments (using the same RNA‐seq data shown in Figure 2A–F). The tRNA‐Phe was detected as both a multi‐tRNA transcript and a shorter, 80‐nt fragment in NTBF and ETBF whole cell as well as in a ∼50‐nt length version (arrow) in OMV samples (Figure 2H). The CoA ligase transcript was detected at full length (>1000 nt) in all samples, but also in a shorter 80‐nt form in whole cell samples and in a 60–70‐nt form in OMVs (Figure 2I). For both tRNA‐Phe and CoA ligase northern blots, we observed a lower intensity signal and smaller sized RNA transcripts in OMVs as compared to whole cell samples, indicating a differential loading of RNAs. Thus, our data suggest that ETBF and NTBF selectively load OMVs with a variety of transcripts that include full‐length and partial transcripts.
3.2. OMVs Deliver RNA Cargo to Epithelial Cell and Co‐Localize With the ER
Having established strain‑specific RNA signatures, we assessed the relevant cellular compartments that RNAs reached in host epithelial cells. Using OMVs isolated from ETBF or NTBF, we first confirmed our co‐staining of both RNA and OMVs using SytoRNASelect or Vybrant DiD, respectively (Figures 3A and S2). Using Caco2 cells incubated for 30 min with OMVs from ETBF, we demonstrate that OMVs with RNA cargo are taken up by epithelial cells (Figure 3B). To better understand where the OMV and RNA cargo were localizing, we stained the endoplasmic reticulum (ER) using a fluorescent antibody against PDI and treated the Caco2 cells with pre‐stained OMV containing RNA, as described previously. Confocal microscopy images of these experiments demonstrate high co‐localization (Mander's split coefficient; average 0.85) of the OMV and RNA cargo with the ER (Figure 3C,D). These results support the hypothesis that RNA cargo from B. fragilis OMVs is taken up by epithelial cells and delivered to the ER.
FIGURE 3.

RNA cargo from ETBF and NTBF OMVs is taken up and localized to the endoplasmic reticulum in colonic epithelial cells. (A) Confocal microscopy images showing co‐staining of RNA and OMVs using SytoRNASelect (green) and Vybrant DiD (red) in OMVs isolated from NTBF. The merged image indicates colocalization (yellow) of RNA and OMVs. Scale bar: 10 µm. (B) Confocal microscopy images of Caco2 cells incubated for 30 min with OMVs from ETBF. The images show the nuclei stained with DAPI (blue), RNA stained with SytoRNASelect (green), OMVs stained with Vybrant DiD (red), and the merged image showing colocalization (yellow) of RNA and OMVs within the cells. Scale bar: 10 µm. (C) Confocal microscopy images of Caco2 cells treated with pre‐stained OMVs containing RNA, showing nuclei stained with DAPI (blue), OMV RNA stained with SytoRNASelect (green), OMVs stained with Vybrant DiD (magenta), endoplasmic reticulum (ER) stained with protein disulfide isomerase (PDI) (red), and the merged image showing colocalization of OMV RNA with the ER (yellow). Scale bar: 5 µm. (D) Boxplot depicting the normalized Mander's split colocalization coefficients for images in (C) NTBF OMV and RNA cargo colocalization within colonic epithelial cells. The coefficients for Red‐Green and Green‐Red channels show significant colocalization in both channels.
3.3. Specific OMV‐Associated RNAs Are Protected From RNase‐Treatment
To determine whether specific transcripts were contained within the OMVs and not simply co‐purified, we treated intact OMVs with RNase prior to RNA extraction and quantified their abundances using qRT‐PCR and northern blotting. First, we confirmed that our RNase treatment had a measurable impact on the total RNA concentration of our OMV samples (Figure 4A), indicating that a portion of the RNA component of OMVs is susceptible to degradation. The ability to detect tRNA‐Phe by northern blot was compromised by treatment with RNase (Figure 4B), indicating that the tRNA‐Phe could be present on the surface of the OMVs, but might also be co‐purifying during the OMV preparation from lysed cells. By contrast, the truncated RNA species of the CoA Ligase transcript remained detectable despite RNase treatment (Figure 4C), indicating encapsulation within the OMVs or a specific modification that protects it from RNase degradation. We validated additional transcripts via qRT‐PCR and noted that the majority remained equally abundant, relative to rubredoxin, following RNase treatment (Table S1), suggesting encapsulation within OMVs.
FIGURE 4.

Specific OMV‐associated RNAs are protected from RNase degradation. (A) Quantification of RNA recovered from equivalent amounts of OMVs with and without RNase treatment; individual points represent biological replicates (n = 4), and data are presented as mean standard error of the mean. Statistical significance was determined using a Welch's test. *p < 0.05; **p < 0.01. (B, C) To confirm the size of tRNA‐Phe (4B) and CoA Ligase (4C), northern blot probes complementary to the most abundant RNAseq reads in the genes were used. Arrows denote the successfully detected transcript fragments in Rnase‐treated OMVs. Probes bound to OMV‐associated RNAs at shorter length in the blot compared to the whole cell samples, suggesting that the sequences contained in the OMVs are fragment of the larger RNA transcript.
3.4. OMVs Activate TLRs in a Dose‐Dependent Manner
We next tested the functional consequence of the RNA profiles by measuring TLR activation in reporter cells. Innate immune receptors, including TLRs, respond to bacterial components, including macromolecules secreted within OMVs. We compared the capacity of ETBF and NTBF OMVs to activate TLR2 (which senses peptidoglycans), TLR3 (which recognizes dsRNA), TLR4 (which recognizes LPS), and TLR7 (which recognizes ssRNA). Treatment of reporter cells with either ETBF or NTBF OMVs showed strong activation of TLR2 at just 100 µg/mL (Figure 5A), whereas activation of RNA‐sensing TLR3 and TLR7 required 2000 µg/mL of OMV (Figure 5B,C), and TLR4 activation was not observed (Figure 5D). This data shows a dose‐dependent relationship of OMVs activating TLRs, with a primary response by non‐RNA sensing TLRs at lower OMV concentrations as opposed to RNA‐sensing TLRs.
FIGURE 5.

NTBF and ETBF OMVs activate TLRs in a dose‐dependent manner. (A–D) OMVs from ETBF and NTBF were administered to HEK‐293T cells expressing the indicated TLR proteins and an NFκB‐responsive SEAP reporter gene. TLR activity was calculated by comparing vesicle and positive control treatments (grey columns) to the corresponding TLR cells treated with PBS (PBS treatment activity is represented by the dashed lines at y = 1). Points on the graph represent biological replicates (n = 3), and data are presented as mean S.E.M. Statistical significance was found using Dunnett's multiple comparison test. Stars represent a significant difference from PBS control. **p < 0.01, ****p < 0.0001. LPS = TLR4 agonist, Poly I:C = TLR3 agonist, CL307 = TLR7 agonist.
3.5. OMVs From NTBF Amplify the IL‐8 Response in Colorectal Adenocarcinoma Cells
The activation of various TLR receptors in the presence of NTBF and ETBF OMVs prompted us to investigate the role that the vesicles of different strains of B. fragilis have in contributing to immune signalling in colon cancer. For these experiments, we used two different colorectal adenocarcinoma cell lines: Caco‐2 and HT29‐MTX (Fig. S3A,B). Caco‐2 cells closely mimic the tight junction barrier of the colon, allowing the cell line to serve as a model to observe the interactions of the vesicles with host cells (O, 2016). HT29‐MTX cells are a stable sub‐population of the HT29 cell line that are differentiated into a goblet cell phenotype and can produce mucosal proteins that are found in the gastrointestinal tract (Gagnon et al. 2013). The distinct phenotypes of these cell lines represent distinct cell populations of the colon, allowing us to investigate the differential effects of vesicles on these cell types. We treated the cells for 2 or 8 h with either 10 or 100 µg/mL of column‐isolated vesicles, or PBS, and observed a significant induction of IL‐8 expression in both cell lines in response to 100 or 10 µg/mL of both NTBF and ETBF OMVs (Fig. S3A,B). However, the response to these OMVs was unique to each cell line. Specifically, Caco‐2 cells had a stronger response to OMVs from both NTBF and ETBF as compared to HT‐29 cells, and at the lower dose, but both cell lines had the strongest response to NTBF OMVs as compared to ETBF. Contrary to our initial hypothesis that OMVs from ETBF would elicit a greater inflammatory response, marked by higher IL‐8 expression, we observed a stronger response from high concentrations of OMVs from NTBF compared to ETBF. To determine if this disparate response to NTBF versus ETBF OMVs was related to RNAse‐protected RNA species, we quantified IL‑8 transcripts following OMV treatment, with or without OMV surface‑RNA removal (Figure 6). Interestingly, only RNAse‐treated OMVs from ETBF at 100 µg/mL were able to increase IL‐8 expression in Caco‐2 cells significantly (Figure 6). These results indicate not only a dose‐ and strain‐dependent response, but also a cell‐type‐specific response to OMVs that distinguishes the commensal and pathogenic behaviour of this bacterial species.
FIGURE 6.
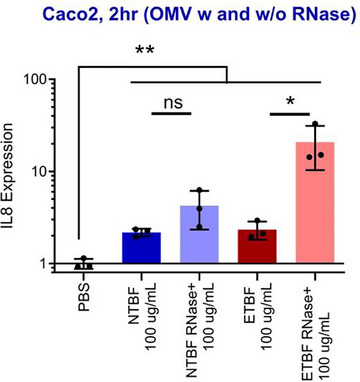
RNase‐treated OMVs from ETBF amplify the IL‐8 response in colorectal adenocarcinoma cells. Caco‐2 cells treated with PBS, RNase‐naïve or RNase‐treated OMVs from NTBF and ETBF and were assayed by qRT‐PCR for IL8 expression. Points on the graph represent biological replicates, and data are presented as mean standard deviation. Statistical significance was found using Dunnett's multiple comparison test. * p < 0.05, ** p < 0.01.
3.6. Protein Components of B. fragilis OMVs
Finally, because OMVs also carry proteins that might modulate TLR responses and represent an additional biomarker for distinguishing differential effects between these strains, we compared the proteomic profiles of ETBF and NTBF OMVs. To characterize the differential loading of protein components by strains of B. fragilis into OMVs, we extracted total protein from OMVs and identified specific proteins using mass spectrometry. Analysis of electrophoretically separated proteins following silver staining shows distinctive bands between NTBF and ETBF OMVs (Figure 7A), suggesting that OMV cargo differs between strains. We next sought to identify individual proteins that corresponded to high‐intensity bands and which differed between ETBF and NTBF samples by extracting the proteins from gel fragments and analysing by MS/MS. Assessing the confidently identified proteins that matched the molecular weight associated with the gel bands, five distinct proteins were identified in the ETBF samples and two in the NTBF samples (Figure 7B). Our results show that proteins identified in ETBF samples are primarily associated with carbohydrate metabolism, while proteins identified in NTBF samples are associated with hydrolase and DNA‐binding activities (Figure 7B). These distinct protein functions agree with previous studies (Zakharzhevskaya, Vanyushkina, et al. 2017), as NTBF and ETBF enzymes have been associated with carbohydrate metabolism; specifically, with hydrolases providing nutrition to NTBF and with energy‐enriching metabolic pathways regulated by exported proteins in ETBF (Zakharzhevskaya, Vanyushkina, et al. 2017; Pierce et al. 2021). Thus, our results demonstrate similarities and differences in proteins identified between OMVs produced ETBF and NTBF.
FIGURE 7.

Protein components of Bacteroides fragilis OMVs differ between ETBF and NTBF. (A) Silver staining of OMV samples of ETBF and NTBF shows different protein profiles. ETBF and NTBF OMVs at different concentrations were run on a 10% SDS‐PAGE gel, followed by silver staining. (B) Protein identifications detected for ETBF and NTBF with >1 peptide match and which possess a molecular weight within the range of the excised gel band.
4. Discussion
In this study, we sought to better understand the mechanistic basis for the differential phenotypic effects of OMVs from two strains of the same species of B. fragilis, apart from the genotoxin BFT, observed in previous studies (Zakharzhevskaya, Vanyushkina, et al. 2017; Shen et al. 2012; Shagaleeva et al. 2024). Our hypothesis focused on the contribution of the OMV‐derived RNA species as one of the factors eliciting this difference. Thus, we initially profiled and characterized the RNA species contained within OMVs from two strains of B. fragilis, commensal (NTBF) and pathogen (ETBF), due to their distinct effects on chronic inflammation and CRC (Zakharzhevskaya, Vanyushkina, et al. 2017; Chan et al. 2019; Johnson et al. 2015; HM 2007). Profiling the OMV‐derived RNA reads to the general classes of gene coding regions of both genomes revealed an enrichment for protein‐coding‐aligned RNA reads and a depletion of reads that aligned to tRNAs, rRNAs and pseudogenes. Many factors affect the distribution of RNA classes contained in OMVs, including stress, pH, phase of growth and other culture conditions. In our experiments, we were careful to maintain consistency in all conditions throughout, including the optical density (OD) at which OMVs were isolated. In comparison to other studies, the protein‐coding to non‐protein‐coding class can vary greatly. As demonstrated by Malabirade et al. (2018) culture conditions can dramatically affect this ratio. In this study specifically, the majority of OMV RNA cargo was rRNA species in low OD samples, but decreased in the high OD samples. Studies also show the size of the small RNA is differentially abundant by RNA class, with large (>200 nt) RNAs being predominantly rRNA while smaller RNAs (<50 nt) making up a larger portion of tRNAs in E. coli but no other bacteria (Blenkiron et al. 2016; Diallo et al. 2022). In studies of A. pleuropneumonia, OMV tRNA and rRNA were most abundant, with tRNAs being enriched in OMVs compared to whole cells (Da Silva et al. 2023). Specifically, tRNAs were enriched in OMVs as compared to whole‐cell RNA classes. Although tRNA enrichment is a characteristic of OMVs from other bacterial species, there are a variety of factors that affect the distribution of RNA types, which also vary by bacterial species. These factors may help to explain the depletion of tRNA and rRNAs in our study as compared to others. Overall, the presence of these general categories of reads in proportions that are different in OMVs from their cells of origin suggests that bacteria have a molecular mechanism that directs more fragments of protein‐coding RNA reads into OMVs compared to other intergenic‐aligned classes.
To further understand the differences in the RNA read profiles of OMV and whole cell samples, we performed differential expression analysis to identify specific genes and intergenic regions of interest that are enriched in each sample condition, and two transcripts enriched in ETBF OMVs as compared to NTBF. Using this dataset in conjunction with the read alignment count numbers, we identified several RNAs of interest for further validation. We were able to successfully detect and validate transcripts initially identified through sequencing using qPCR and northern blotting, including phenylalanine tRNA and O‐succinylbenzoic acid CoA ligase, using both OMV and whole cell samples. In similar studies of OMVs from P. aeruginosa, tRNA fragments abundant in OMVs showed inhibitory effects on inflammatory cell signalling (Koeppen et al. 2016; Xie et al. 2024). Likewise, in our study, the phenylalanine tRNA was enriched in ETBF OMVs compared to ETBF whole cell transcripts. Additionally, sRNA from Flavobacterium psychrophilum and Helicobacter pylori are enriched in OMVs, including methionine tRNA, that affect inflammatory signalling, suggesting a common microbial mechanism of sRNA control of host transcription (Zhang et al. 2020; Chapagain et al. 2024). Together, researchers have demonstrated the presence of specific OMV‐associated RNA species of several bacterial species for genes that are known to be enriched in the vesicles of their species of interest, which impact host transcriptional regulation (Koeppen et al. 2016; Blenkiron et al. 2016). These data suggest that OMVs contain full‐length and smaller fragments of the transcript, and that they specifically impact host cell signalling.
It has been demonstrated that sRNA species located inside OMVs are generally resistant to RNase, indicating that they are more likely to survive cellular uptake and target host RNA binding proteins or mRNA (Xie et al. 2024; Zhang et al. 2020). To ensure that the detection of our target sequences was due to internalization of transcripts within vesicles and not from external presentation on the outer membrane or secretion into the culture broth, we treated OMVs with RNase. We found that there was a modest decrease in the concentration of RNA isolated from RNase‐treated vesicles compared to their untreated counterpart, suggesting that a portion of the RNA we initially isolated was not contained within the vesicles, but also that some RNAs were loaded into the OMVs, protecting them from RNase treatment. These findings correspond with other studies investigating RNA fragments in OMVs (Koeppen et al. 2016). Both H. pylori and P. aeruginosa have been reported to load a tRNA fragment into its OMVs for delivery to eukaryotic cells, where the fragment can act similarly to miRNAs and down regulate IL‐8 expression in the cells (Koeppen et al. 2016). Overall, a common shared mechanism among bacterial species is the loading of RNase‐protected sRNA species inside OMVs to allow regulation of host cell signalling.
To further understand the interactions of B. fragilis OMV‐delivered RNA with host cellular targets, we focused on RNA‐sensing PRRs. We observed that TLR3 and TLR7 cells were activated with treatments of OMVs at high concentration (2000 µg/mL), suggesting that the RNAs contained inside the vesicles may not be driving immune responses through TLRs. Nevertheless, vesicles of both strains induce expression of the pro‐inflammatory cytokine IL‐8. Likewise, other researchers have demonstrated that OMVs from commensal E. coli strains can induce CXCL8 expression in Caco‐2 and HT‐29 cells in a dose‐dependent manner (Patten et al. 2017). These findings suggest a possible beneficial effect by priming the intestine to better respond to challenges from pathogen colonization, as IL‐8 is a chemokine that attracts neutrophils and macrophages to the affected site (Patten et al. 2017; Hébert and Baker 1993).
Although OMVs containing both internal and external sRNA species had dose‐dependent effects on PRRs, we unexpectedly discovered that when RNAs co‐purified with OMVs are degraded by RNase, a significantly greater stimulation of IL‐8 transcription is achieved, indicating a potential immunosuppressive role for these biomolecules. Notably, RNase‐treated ETBF vesicles lose the 75 nt fragment of CoA ligase but retain the longer RNA species. RNA fragments originally transcribed from intergenic regions are also retained in RNase‐treated vesicles. Whether specific gene products or classes of RNAs mediate these differential effects remains to be elucidated. Other studies have demonstrated that specific sRNA species found inside OMVs can specifically reduce IL‐8 transcription and protein secretion in eukaryotic cells (Koeppen et al. 2016; Zhang et al. 2020). In total, the results from our research and others indicate that specific OMV‐associated sRNA species are capable of controlling host IL‐8 expression.
Altogether, our data demonstrate that NTBF and ETBF OMVs are enriched in specific RNA sequences from coding and intergenic regions of the B. fragilis genome. Through this work, we validated the presence of previously uncharacterized RNA sequences using qPCR and northern blotting. We demonstrated that these sequences are contained within vesicles and differentially protected from RNase degradation. We further showed that OMVs activate certain classes of TLRs, suggesting a role for these receptors in host‐vesicle interactions and that ETBF and NTBF vesicles can produce strong inflammatory responses in epithelial CRC cells, dependent on the loading of intravesicular and extravesicular RNAs. Future research will be focused on understanding the specific sRNA species, their host targets, and the biological implications of these small RNA cargos on host inflammatory responses, especially in the context of inflammatory‐related diseases like CRC.
Author Contributions
Aadil Sheikh: data curation, formal analysis, investigation, methodology, validation, visualization, writing–original draft, writing–review and editing. Colin Scano: data curation, formal analysis, investigation, methodology, visualization, writing–review and editing. Julia Xu: data curation, formal analysis, methodology, visualization. Tolulope Ojo: data curation, formal analysis, investigation, methodology, visualization, writing–review and editing. Jessica M. Conforti: data curation, formal analysis, investigation, methodology, validation, visualization, writing–review and editing. Kayla L. Haberman: data curation, formal analysis, investigation, validation, visualization, writing–review and editing. Bryan King: data curation, formal analysis, methodology, software, visualization, writing–review and editing. Alysia S. Martinez: data curation, formal analysis. Michelle Pujol: data curation, formal analysis, validation, visualization. Juli Watkins: data curation, formal analysis, validation, visualization. James Lotter: data curation, investigation, methodology. Emily L. Lin: data curation, formal analysis, investigation, methodology. Bernd Zechmann: data curation, formal analysis, methodology, resources, software, visualization. Amanda Sevcik: data curation, formal analysis, methodology, resources. Christie Sayes: formal analysis, methodology, project administration, resources, supervision, writing–review and editing. Elyssia S. Gallagher: data curation, formal analysis, investigation, methodology, project administration, supervision, visualization, writing–original draft, writing–review and editing. Steven P. Lang: data curation, resources, software. Joshua Mell: conceptualization, data curation, formal analysis, investigation, methodology, project administration, resources, software, visualization, writing–review and editing. Garth D. Ehrlich: investigation, methodology, project administration, resources, supervision, writing–review and editing. Joseph H. Taube: data curation, formal analysis, investigation, methodology, project administration, resources, software, supervision, validation, visualization, writing–original draft, writing–review and editing. K. Leigh Greathouse: conceptualization, data curation, formal analysis, funding acquisition, investigation, methodology, project administration, resources, supervision, validation, visualization, writing–original draft, writing–review and editing.
Conflicts of Interest
The authors declare no competing interests.
Supporting information
Supplementary Material: jex270086‐sup‐0002‐SuppMat.xlsx
Supplementary Material: jex270086‐sup‐0002‐SuppMat.xlsx
Supplemental Figure 1: TEM imaging and size profiling of ETBF and NTBF OMVs.
Supplemental Figure 2: Additional confocal imaging showing OMV RNA localization to the endoplasmic reticulum in Caco2 cells.
Supplemental Figure 3: OMVs stimulate IL8 expression in colorectal adenocarcinoma cells.
Supplemental Table 1: RNA species selected for analysis, along with PCR primers, northern blot probe sequences and a summary of qPCR results.
Acknowledgements
The authors wish to acknowledge the contributions of Dr. Cindy Sears for gifting B. fragilis strains, as well as Andrew Cox and Harry Ojeas for technical assistance.
Sheikh, A. , Scano C., Xu J., et al. 2025. “Outer Membrane Vesicles From Bacteroides fragilis Contain Coding and Non‐Coding Small RNA Species That Modulate Inflammatory Signalling in Intestinal Epithelial Cells.” Journal of Extracellular Biology 4, no. 10: e70086. 10.1002/jex2.70086
Data Availability Statement
The data that support the findings of this study are available from the corresponding author upon reasonable request.
References
- Abe, Y. , Fujii K., Nagata N., et al. 2012. “The Toll‐Like Receptor 3‐Mediated Antiviral Response Is Important for Protection Against Poliovirus Infection in Poliovirus Receptor Transgenic Mice.” Journal of Virology 86: 185–194. [DOI] [PMC free article] [PubMed] [Google Scholar]
- Abreu, M. T. , Vora P., Faure E., Thomas L. S., Arnold E. T., and Arditi M.. 2001. “Decreased Expression of Toll‐Like Receptor‐4 and MD‐2 Correlates With Intestinal Epithelial Cell Protection Against Dysregulated Proinflammatory Gene Expression in Response to Bacterial Lipopolysaccharide.” Journal of Immunology 167: 1609–1616. [DOI] [PubMed] [Google Scholar]
- Arthur, J. C. , Perez‐Chanona E., Mühlbauer M., et al. 2012. “Intestinal Inflammation Targets Cancer‐Inducing Activity of the Microbiota.” Science 338: 120–123. [DOI] [PMC free article] [PubMed] [Google Scholar]
- Asami, T. , Ishii M., and Fujii H., et al. 2013. “Modulation of Murine Macrophage TLR7/8‐Mediated Cytokine Expression by Mesenchymal Stem Cell‐Conditioned Medium.” Mediators of Inflammation 2013: 264260. 10.1155/2013/264260. [DOI] [PMC free article] [PubMed] [Google Scholar]
- Baker, K. T. , Salk J. J., Brentnall T. A., and Risques R. A.. 2018. “Precancer in Ulcerative Colitis: The Role of the Field Effect and Its Clinical Implications.” Carcinogenesis 39: 11–20. [DOI] [PMC free article] [PubMed] [Google Scholar]
- Bitto, N. J. , Chapman R., Pidot S., et al. 2017. “Bacterial Membrane Vesicles Transport Their DNA Cargo Into Host Cells.” Scientific Reports 7: 7072. [DOI] [PMC free article] [PubMed] [Google Scholar]
- Blenkiron, C. , Simonov D., Muthukaruppan A., et al. 2016. “Uropathogenic Escherichia coli Releases Extracellular Vesicles That Are Associated With RNA.” PLOS ONE 11: e0160440. [DOI] [PMC free article] [PubMed] [Google Scholar]
- Bu, H.‐F. , Wang X., Tang Y., Koti V., and Tan X.‐D.. 2010. “Toll‐Like Receptor 2‐mediated Peptidoglycan Uptake by Immature Intestinal Epithelial Cells From Apical Side and Exosome‐associated Transcellular Transcytosis.” Journal of Cellular Physiology 222: 658–668. [DOI] [PMC free article] [PubMed] [Google Scholar]
- Cancer of the Colon and Rectum—Cancer Stat Facts . https://seer.cancer.gov/statfacts/html/colorect.html.
- Chan, J. L. , Wu S., Geis A. L., et al. 2019. “Non‐Toxigenic Bacteroides fragilis (NTBF) Administration Reduces Bacteria‐Driven Chronic Colitis and Tumor Development Independent of Polysaccharide A.” Mucosal Immunology 12: 164–177. [DOI] [PMC free article] [PubMed] [Google Scholar]
- Chapagain, P. , Ali A., Kidane D. T., Farone M., and Salem M.. 2024. “Characterisation of sRNAs Enriched in Outer Membrane Vesicles of Pathogenic Flavobacterium psychrophilum Causing Bacterial Cold Water Disease in Rainbow Trout.” Journal of Extracellular Biology 3: e161. 10.1002/jex2.161. [DOI] [PMC free article] [PubMed] [Google Scholar]
- Cho, I. , and Blaser M. J.. 2012. “The Human Microbiome: At the Interface of Health and Disease.” Nature Reviews Genetics 13: 260–270. [DOI] [PMC free article] [PubMed] [Google Scholar]
- Choi, J.‐W. , Kim S.‐C., Hong S.‐H., and Lee H.‐J.. 2017. “Secretable Small RNAs Via Outer Membrane Vesicles in Periodontal Pathogens.” Journal of Dental Research 96: 458–466. [DOI] [PubMed] [Google Scholar]
- Cipe, G. , Idiz U. O., Firat D., and Bektasoglu H.. 2015. “Relationship Between Intestinal Microbiota and Colorectal Cancer.” World Journal of Gastrointestinal Oncology 7: 233. [DOI] [PMC free article] [PubMed] [Google Scholar]
- Colorectal Cancer . https://www.iarc.who.int/cancer‐type/colorectal‐cancer/.
- Da Silva, G. C. , Rosa J. N., Fontes P. P., et al. 2023. “Identification of Novel Small RNAs in Extracellular Vesicles Produced by Actinobacillus Pleuropneumoniae.” Frontiers in Microbiology 14: 1291930. 10.3389/fmicb.2023.1291930. [DOI] [PMC free article] [PubMed] [Google Scholar]
- Diallo, I. , Ho J., Lalaouna D., Massé E., and Provost P.. 2022. “RNA Sequencing Unveils Very Small RNAs With Potential Regulatory Functions in Bacteria.” Frontiers in Molecular Biosciences 9: 914991. 10.3389/fmolb.2022.914991. [DOI] [PMC free article] [PubMed] [Google Scholar]
- Domingues, S. , and Nielsen K. M.. 2017. “Membrane Vesicles and Horizontal Gene Transfer in Prokaryotes.” Current Opinion in Microbiology 38: 16–21. [DOI] [PubMed] [Google Scholar]
- Eaden, J. A. 2001. “The Risk of Colorectal Cancer in Ulcerative Colitis: A Meta‐Analysis.” Gut 48: 526–535. [DOI] [PMC free article] [PubMed] [Google Scholar]
- Elhenawy, W. , Debelyy M. O., and Feldman M. F.. 2014. “Preferential Packing of Acidic Glycosidases and Proteases Into Bacteroides Outer Membrane Vesicles.” mBio 5: e00909–e914. [DOI] [PMC free article] [PubMed] [Google Scholar]
- Gagnon, M. , Zihler Berner A., Chervet N., Chassard C., and Lacroix C.. 2013. “Comparison of the Caco‐2, HT‐29 and the Mucus‐Secreting HT29‐MTX Intestinal Cell Models to Investigate Salmonella Adhesion and Invasion.” Journal of Microbiological Methods 94: 274–279. [DOI] [PubMed] [Google Scholar]
- Glassner, K. L. , Abraham B. P., and Quigley E. M. M.. 2020. “The Microbiome and Inflammatory Bowel Disease.” Journal of Allergy and Clinical Immunology 145: 16–27. [DOI] [PubMed] [Google Scholar]
- Hanahan, D. , and Weinberg R. A.. 2011. “Hallmarks of Cancer: The Next Generation.” Cell 144: 646–674. 10.1016/j.cell.2011.02.013. [DOI] [PubMed] [Google Scholar]
- Hébert, C. A. , and Baker J. B.. 1993. “Interleukin‐8: A Review.” Cancer Investigation 11: 743–750. [DOI] [PubMed] [Google Scholar]
- HM, W. 2007. “Bacteroides: The Good, the Bad, and the Nitty‐Gritty.” Clinical Microbiology Reviews 20: 593–621. [DOI] [PMC free article] [PubMed] [Google Scholar]
- Huang, J. Y. , Lee S. M., and Mazmanian S. K.. 2011. “The Human Commensal Bacteroides fragilis Binds Intestinal Mucin.” Anaerobe 17: 137–141. [DOI] [PMC free article] [PubMed] [Google Scholar]
- Johnson, J. L. , Jones M. B., and Cobb B. A.. 2015. “Polysaccharide A From the Capsule of Bacteroides fragilis Induces Clonal CD4+ T Cell Expansion.” Journal of Biological Chemistry 290: 5007–5014. [DOI] [PMC free article] [PubMed] [Google Scholar]
- Kaparakis‐Liaskos, M. , and Ferrero R. L.. 2015. “Immune Modulation by Bacterial Outer Membrane Vesicles.” Nature reviews. Immunology 15: 375–387. [DOI] [PubMed] [Google Scholar]
- Koeppen, K. , Hampton T. H., Jarek M., et al. 2016. “A Novel Mechanism of Host‐Pathogen Interaction Through sRNA in Bacterial Outer Membrane Vesicles.” PLOS Pathogen 12: e1005672. 10.1371/journal.ppat.1005672. [DOI] [PMC free article] [PubMed] [Google Scholar]
- Lazar, V. , Ditu L. M., and Pircalabioru G. G., et al. 2018. “Aspects of Gut Microbiota and Immune System Interactions in Infectious Diseases, Immunopathology, and Cancer.” Frontiers in Immunology 9: 1830. 10.3389/fimmu.2018.01830. [DOI] [PMC free article] [PubMed] [Google Scholar]
- Lee, J. , Yoon Y. J., Kim J. H., et al. 2018. “Outer Membrane Vesicles Derived From Escherichia coli Regulate Neutrophil Migration by Induction of Endothelial IL‐8.” Frontiers in Microbiology 9: 2268. 10.3389/fmicb.2018.02268. [DOI] [PMC free article] [PubMed] [Google Scholar]
- Malabirade, A. , Habier J., Heintz‐Buschart A., et al. 2018. “The RNA Complement of Outer Membrane Vesicles From Salmonella Enterica Serovar Typhimurium Under Distinct Culture Conditions.” Frontiers in Microbiology 9: 2015. 10.3389/fmicb.2018.02015. [DOI] [PMC free article] [PubMed] [Google Scholar]
- Mancuso, G. , Midiri A., Biondo C., et al. 2005. “ Bacteroides fragilis‐Derived Lipopolysaccharide Produces Cell Activation and Lethal Toxicity via Toll‐Like Receptor 4.” Infection and Immunity 73: 5620–5627. 10.1128/IAI.73.9.5620-5627.2005. [DOI] [PMC free article] [PubMed] [Google Scholar]
- Marion, C. R. , Lee J., and Sharma L., et al. 2019. “Toll‐Like Receptors 2 and 4 Modulate Pulmonary Inflammation and Host Factors Mediated by Outer Membrane Vesicles Derived From Acinetobacter baumannii.” Infection and Immunity 87: e00243‐19. 10.1128/IAI.00243-19. [DOI] [PMC free article] [PubMed] [Google Scholar]
- Meira, L. B. , Bugni J. M., and Green S. L., et al. 2008. “DNA Damage Induced by Chronic Inflammation Contributes to Colon Carcinogenesis in Mice.” Journal of Clinical Investigation 118: 2516–2525. [DOI] [PMC free article] [PubMed] [Google Scholar]
- Moncrief, J. S. , Obiso R., Barroso L. A., et al. 1995. “The Enterotoxin of Bacteroides fragilis Is a Metalloprotease.” Infection and Immunity 63: 175–181. [DOI] [PMC free article] [PubMed] [Google Scholar]
- Osakwe, O. , and Rizvi S. A. A.. 2016. “The significance of discovery screening and structure optimization studies.” In Social Aspects of Drug Discovery, Development and Commercialization: From Laboratory to Clinic, 109–128. Academic Press. 10.1016/C2014-0-02679-2. [DOI] [Google Scholar]
- Patten, D. A. , Hussein E., Davies S. P., Humphreys P. N., and Collett A.. 2017. “Commensal‐Derived OMVs Elicit a Mild Proinflammatory Response in Intestinal Epithelial Cells.” Microbiology (Reading, England) 163: 702–711. [DOI] [PubMed] [Google Scholar]
- Petkau, K. , Ferguson M., Guntermann S., and Foley E.. 2017. “Constitutive Immune Activity Promotes Tumorigenesis in Drosophila Intestinal Progenitor Cells.” Cell Reports 20: 1784–1793. [DOI] [PubMed] [Google Scholar]
- Pierce, J. V. , Fellows J. D., Anderson D. E.., and Bernstein H. D.. 2021. “A Clostripain‐Like Protease Plays a Major Role in Generating the Secretome of Enterotoxigenic Bacteroides fragilis .” Molecular Microbiology 115: 290–304. 10.1111/mmi.14616. [DOI] [PMC free article] [PubMed] [Google Scholar]
- Rodriguez, B. V ., and Kuehn M. J.. 2020. “ Staphylococcus aureus Secretes Immunomodulatory RNA and DNA via Membrane Vesicles.” Scientific Reports 10: 18293. 10.1038/s41598-020-75108-3. [DOI] [PMC free article] [PubMed] [Google Scholar]
- Round, J. L. , and Mazmanian S. K.. 2010. “Inducible Foxp3+ Regulatory T‐Cell Development by a Commensal Bacterium of the Intestinal Microbiota.” Proceedings of the National Academy of Sciences of the United States of America 107, no. 27: 12204–12209. [DOI] [PMC free article] [PubMed] [Google Scholar]
- Satarian, F. , Nejadsattari T., Vaziri F., and Siadat S. D.. 2019. “Comparative Study of Immune Responses Elicited by Outer Membrane Vesicles of Different Pseudomonas aeruginosa Strains.” Comparative Immunology, Microbiology and Infectious Diseases 66: 101328. [DOI] [PubMed] [Google Scholar]
- Shagaleeva, O. Y. , Kashatnikova D. A., Kardonsky D. A., et al. 2024. “Bacteroides Vesicles Promote Functional Alterations in the Gut Microbiota Composition.” Microbiology Spectrum 12: e0063624. 10.1128/spectrum.00636-24. [DOI] [PMC free article] [PubMed] [Google Scholar]
- Sharma, B. R. , Karki R., Sundaram B., Wang Y., Vogel P., and Kanneganti T.‐D.. 2022. “The Transcription Factor IRF9 Promotes Colorectal Cancer via Modulating the IL‐6/STAT3 Signaling Axis.” Cancers 14: 919. [DOI] [PMC free article] [PubMed] [Google Scholar]
- Sheikh, A. , Taube J., and Greathouse K. L.. 2021. “Contribution of the Microbiota and Their Secretory Products to Inflammation and Colorectal Cancer Pathogenesis: The Role of Toll‐Like Receptors.” Carcinogenesis 42: 1133–1142. [DOI] [PubMed] [Google Scholar]
- Sheikh, A. , Zechmann B., Sayes C. M., Taube J. H.., and Greathouse K. L.. 2023. “A Preparation of Bacterial Outer Membrane With Osmium Tetroxide and Uranyl Acetate Co‐Stain Enables Improved Structural Determination by Transmission Electron Microscopy.” Microscopy (Oxf) 72: 515–519. 10.1093/jmicro/dfad027. [DOI] [PMC free article] [PubMed] [Google Scholar]
- Shen, Y. , Giardino Torchia M. L., Lawson G. W., et al. 2012. “Outer Membrane Vesicles of a Human Commensal Mediate Immune Regulation and Disease Protection.” Cell Host & Microbe 12: 509–520. 10.1016/j.chom.2012.08.004. [DOI] [PMC free article] [PubMed] [Google Scholar]
- Shen, Y. , Giardino Torchia M. L., Lawson G. W., Karp C. L., Ashwell J. D., and Mazmanian S. K.. 2012. “Outer membrane vesicles of a human commensal mediate immune regulation and disease protection.” Cell host & microbe 12, no. 4: 509–520. 10.1016/j.chom.2012.08.004. [DOI] [PMC free article] [PubMed] [Google Scholar]
- Soderblom, T. , Oxhamre C., Wai S. N., et al. 2005. “Effects of the Escherichia coli Toxin Cytolysin A on Mucosal Immunostimulation via Epithelial Ca2+ Signalling and Toll‐Like Receptor 4.” Cellular Microbiology 7: 779–788. [DOI] [PubMed] [Google Scholar]
- Stidham, R. W. , and Higgins P. D. R.. 2018. “Colorectal Cancer in Inflammatory Bowel Disease.” Clinical Colon and Rectal Surgery 31: 168–178. [DOI] [PMC free article] [PubMed] [Google Scholar]
- VB, Y. 2017. “The Role of the Microbiome in Human Health and Disease: An Introduction for Clinicians.” British Medical Journal 356: j831. 10.1136/bmj.j831. [DOI] [PubMed] [Google Scholar]
- Wanders, L. K. , Dekker E., Pullens B., Bassett P., Travis S. P. L., and East J. E.. 2014. “Cancer Risk After Resection of Polypoid Dysplasia in Patients With Longstanding Ulcerative Colitis: A Meta‐Analysis.” Clinical Gastroenterology and Hepatology 12: 756–764. [DOI] [PubMed] [Google Scholar]
- Wang, S. , Song A., Xie J., et al. 2024. “Fn‐OMV Potentiates ZBP1‐Mediated PANoptosis Triggered by Oncolytic HSV‐1 to Fuel Antitumor Immunity.” Nature Communications 15: 3669. 10.1038/s41467-024-48032-7. [DOI] [PMC free article] [PubMed] [Google Scholar]
- Wick, E. C. , Rabizadeh S., Albesiano E., et al. 2014. “Stat3 Activation in Murine Colitis Induced by Enterotoxigenic Bacteroides fragilis .” Inflammatory Bowel Diseases 20: 821–834. 10.1097/MIB.0000000000000019. [DOI] [PMC free article] [PubMed] [Google Scholar]
- Wu, S. , Lim K.‐C., Huang J., Saidi R. F., and Sears C. L.. 1998. “ Bacteroides fragilis Enterotoxin Cleaves the Zonula Adherens Protein, E‐cadherin.” PNAS 95, no. 25: 14979–14984. [DOI] [PMC free article] [PubMed] [Google Scholar]
- Xie, Z. , Wang X., Huang Y., et al. 2024. “ Pseudomonas aeruginosa Outer Membrane Vesicle‐Packed sRNAs Can Enter Host Cells and Regulate Innate Immune Responses.” Microbial Pathogenesis 188: 106562. 10.1016/j.micpath.2024.106562. [DOI] [PubMed] [Google Scholar]
- Zakharzhevskaya, N. B. , Tsvetkov V. B., and Vanyushkina A. A., et al. 2017. “Interaction of Bacteroides fragilis Toxin With Outer Membrane Vesicles Reveals New Mechanism of Its Secretion and Delivery.” Frontiers in Cellular and Infection Microbiology 7: 2. 10.3389/fcimb.2017.00002. [DOI] [PMC free article] [PubMed] [Google Scholar]
- Zakharzhevskaya, N. B. , Vanyushkina A. A., Altukhov I. A., et al. 2017. “Outer Membrane Vesicles Secreted by Pathogenic and Nonpathogenic Bacteroides fragilis Represent Different Metabolic Activities.” Scientific Reports 7: 5008. 10.1038/s41598-017-05264-6. [DOI] [PMC free article] [PubMed] [Google Scholar]
- Zhang, H. , Zhang Y., Song Z., et al. 2020. “sncRNAs Packaged by Helicobacter pylori Outer Membrane Vesicles Attenuate IL‐8 Secretion in Human Cells.” International Journal of Medical Microbiology 310: 151356. 10.1016/j.ijmm.2019.151356. [DOI] [PubMed] [Google Scholar]
Associated Data
This section collects any data citations, data availability statements, or supplementary materials included in this article.
Supplementary Materials
Supplementary Material: jex270086‐sup‐0002‐SuppMat.xlsx
Supplementary Material: jex270086‐sup‐0002‐SuppMat.xlsx
Supplemental Figure 1: TEM imaging and size profiling of ETBF and NTBF OMVs.
Supplemental Figure 2: Additional confocal imaging showing OMV RNA localization to the endoplasmic reticulum in Caco2 cells.
Supplemental Figure 3: OMVs stimulate IL8 expression in colorectal adenocarcinoma cells.
Supplemental Table 1: RNA species selected for analysis, along with PCR primers, northern blot probe sequences and a summary of qPCR results.
Data Availability Statement
The data that support the findings of this study are available from the corresponding author upon reasonable request.