Abstract
Neurodegenerative diseases are characterized by the presence of filamentous aggregates of proteins. We previously established that lithostathine is a protein overexpressed in the pre-clinical stages of Alzheimer’s disease. Furthermore, it is present in the pathognomonic lesions associated with Alzheimer’s disease. After self-proteolysis, the N-terminally truncated form of lithostathine leads to the formation of fibrillar aggregates. Here we observed using atomic force microscopy that these aggregates consisted of a network of protofibrils, each of which had a twisted appearance. Electron microscopy and image analysis showed that this twisted protofibril has a quadruple helical structure. Three-dimensional X-ray structural data and the results of biochemical experiments showed that when forming a protofibril, lithostathine was first assembled via lateral hydrophobic interactions into a tetramer. Each tetramer then linked up with another tetramer as the result of longitudinal electrostatic interactions. All these results were used to build a structural model for the lithostathine protofibril called the quadruple-helical filament (QHF-litho). In conclusion, lithostathine strongly resembles the prion protein in its dramatic proteolysis and amyloid proteins in its ability to form fibrils.
Keywords: Alzheimer’s disease/atomic force and electron microscopy/image analysis/lithostathine/protofibril
Introduction
The term ‘cerebral proteopathies’ has been proposed to designate all brain diseases the hallmarks of which are the misfolding and subsequent aggregation of proteins (Walker and LeVine, 2000). These conformational diseases (Kopito and Ron, 2000) include three main, but disparate brain diseases: amyloidoses, tauopathies and α-synucleinopathies. Amyloidoses now include >18 human diseases, affecting not only the brain but also other organs, in which amyloid fibrils are deposited. Examples of proteins associated with amyloid diseases include islet amyloid polypeptide (reviewed in Kahn et al., 1999), transthyretin (reviewed in Plante-Bordeneuve and Said, 2000) and the amyloid-β peptide, Aβ, which is a proteolytic product of the much larger amyloid precursor protein (APP) (for a review see Bayer et al., 1999). Tauopathies are characterized by fibrillar deposits of Tau, a protein normally associated with microtubules (reviewed in Avila, 2000). α-synucleinopathies involve intracellular deposits of filamentous α-synuclein, but the function of this protein has not yet been elucidated (Goedert, 1999). However, there seems to be no clear-cut frontier between these diseases. For instance, in Alzheimer’s disease (AD), the most prevalent neurodegenerative disease, deposits of two types are to be found: intracellular neurofibrillary tangles containing paired helical filaments of Tau (PHF-Tau), and extracellular neuritic plaques consisting of fibrillar deposits of Aβ peptides. Lewy bodies disease is an α-synucleinopathy in which Aβ and PHF-Tau deposits also occur. The most characteristic feature of many neurodegenerative diseases is therefore the formation of fibrillar aggregates rather than the type of protein involved.
Deposits of lithostathine have also been observed in the brain of patients with AD (Duplan et al., 2001). Lithostathine is a secretory protein that is related to C-type lectins. It was first described in pancreatic juice (De Caro et al., 1979), where it may control the growth of calcium carbonate crystals, thus preventing clogging of the ducts, as observed in vitro (Geider et al., 1996; Gerbaud et al., 2000). Interestingly, the secretory form of lithostathine, called S2, displays highly aggregative properties under physiological conditions, and is extremely susceptible to self-proteolysis at the Arg–Ile bond in position 11–12. It generates a C-terminal polypeptide consisting of 133 amino acids, called S1, which is largely insoluble at physiological pH and readily polymerizes into fibrils (Cerini et al., 1999). Lastly, lithostathine is also overexpressed during the very early stages of AD, i.e. before the clinical symptoms appear (Duplan et al., 2001). All in all, these findings support the idea that lithostathine may play a role in the ethiology of AD. In this paper, we report on the three-dimensional (3D) structure of lithostathine protofibrils.
Results
Atomic force microscopy studies on lithostathine S1 protofibrils
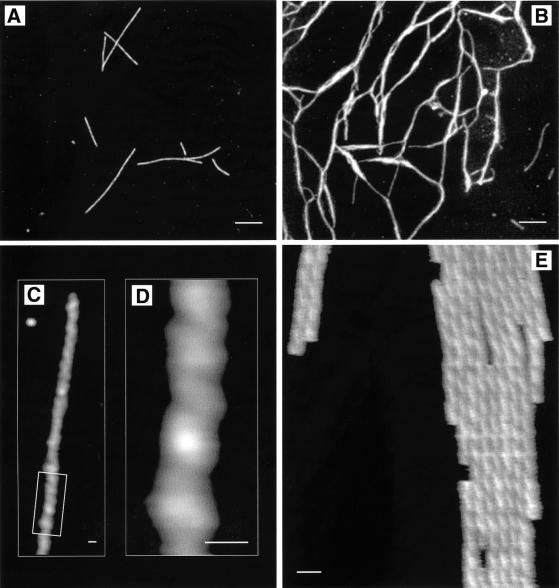
Atomic force microscopy (AFM) was performed in air to study the general morphology of S1 lithostathine protofibrils after self-proteolysis of the S2 form. The results showed that lithostathine polymerized into 20–25 nm diameter protofibrils (Figure 1A). Taking the broadening due to the sample–tip convolution into account (Keller and Franke, 1993), this value was highly consistent with the electron microscopy data (see below). The lengths of the protofibrils varied from 100 nm to 2 µm. Further structural assembly of these protofibrils gave a two-dimensional network (Figure 1B). Images recorded on individual protofibrils at higher magnification showed the existence of an axial periodicity of ∼20 nm (Figure 1C), and suggested that it was a helicoidal structure (Figure 1D). We then performed AFM imaging in solution, which is a suitable method for studying biological systems in their native-like environment without affecting their macromolecular shape. Graphite was used as the substrate in the liquid experiments because it was found to enhance the lithostathine protofilament adsorption levels. Tip–sample interactions were then minimized to improve the image quality. A typical AFM image recorded in solution is shown in Figure 1E. The typical mean value of the relative thickness measured between the substrate and the top of the protofilaments was 7.7 nm. The distance measured top-to-top between two adjacent protofilaments was not affected by the tip–sample convolution and gave a mean value of 8.0 ± 0.6 nm. The helicoidal structure of the protofilaments was clearly visible, showing a left-handed appearance and a mean axial periodicity of 17.1 ± 1.9 nm. In view of these findings, it was decided to examine the fine structure of these protofibrils by performing electron microscopy and image analysis, as described in the next section.
Fig. 1. Morphological characterization of lithostathine protofibrils by tapping mode AFM in air (A–D) and in solution (E). The S1 form of lithostathine polymerizes into protofibrils (A) that can form networks (B). Topography was coded from black to white corresponding to 0 and 4.5 nm full scale in (A), and 0–6.9 nm in (B). (C) Image of an individual protofibril, recorded at higher magnification. (D) Zooming in on the protofibril (box in C) shows an axial periodicity along the structure with an apparent spacing of ∼20 nm. (E) Imaging under solution made it possible to observe the helicoidal structure of lithostathine protofibrils with greater accuracy (mean peak-to-peak distance along the axial repeat: 17.1 ± 1.9 nm), and to measure their heights in a fully hydrated state (7.7 nm). Topography was coded from black to white corresponding to 0 and 10 nm full scale. Tapping frequency was set between 200 and 300 kHz in air and 8 and 10 kHz in solution. Images were recorded at scan rates of between 1 and 3 Hz per line. Scale bars represent 400 nm in (A) and (B), and 20 nm in (C)–(E).
Low resolution structure of lithostathine S1 protofibrils
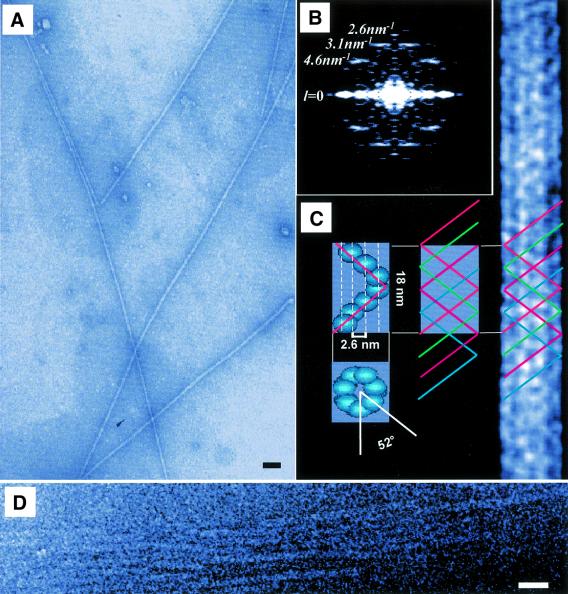
As shown by the negative staining patterns obtained with uranyl acetate, self-proteolysis of lithostathine led to the formation of long protofibrils with an outer diameter of ∼11.7 nm (Figure 2A). To identify the layer lines in Fourier transforms (FTs), the diffraction patterns obtained with individual protofibrils were combined. This increased the intensity of the weak reflections, as described previously (Watts et al., 1998). The FTs computed for the protofibrils exhibited reflections at distances of 1/4.6, 1/3.1 and 1/2.6 nm–1 from the equator (l = 0) (Figure 2B). We noted that the reflections observed at 1/3.1 and 1/2.6 nm–1 seemed to belong to adjacent layer lines. By analysing the distance between these two reflections in various diffraction patterns, it was therefore possible to estimate the layer line spacing at ∼1/18 nm–1. Based on this value, the reflections belonging to layer lines 4, 6 and 7 could then be predicted to occur at 4 × 1/18 = 1/4.5, 6 × 1/18 = 1/3.0 and 7 × 1/18 ≈ 1/2.6 nm–1 from the equator, respectively (Figure 2B). These values are in good agreement with the experimental data. In addition, they confirm that the reflections observed at 1/3.1 and 1/2.6 nm–1 belonged to adjacent layer lines, and thus made it possible to solve the helix pitch (P).
Fig. 2. Image analysis of electron micrographs of lithostathine protofibrils. (A) Electron microscopy field of lithostathine protofibrils. Scale bar represents 50 nm. (B) FTs from protofibrils showed a helical arrangement. Layer line spacing corresponds to 1/18 nm–1. (C) Model of the helical structure and average image of a lithostathine protofibril. Left: a single helix turn in which subunits are arranged according to the FT parameters (top: seven monomers per pitch; bottom: angle of 52° between the first and the seventh monomer in the helix). Middle: four single helices forming a protofibril. Right: average computed image from 250 lithostathine images filtered at 29 Å. (D) Cryomicroscopy image of lithostathine protofibrils. Scale bar represents 50 nm.
As the layer line spacing corresponds to 1/P, the helix pitch was estimated to be 18 nm (Figure 2B and C). This value is in good agreement with the AFM data (17.1 ± 1.9 nm). To determine the inter-subunit distance (p), we made use of the fact that the distance between the equator and the spots on the meridian line was 1/p, and that reflections occurred at 1/2.6 nm–1 on the meridian line. The inter-subunit distance was therefore estimated to be 2.6 nm (Figure 2B and C). All these measurements, combined with an average image at 29 Å resolution, led us to predict that lithostathine protofibrils comprise four basic helices composed of seven subunits per turn, set at angles of 52° to each other (Figure 2C). This arrangement forms a quadruple helical structure called quadruple-helical filament (QHF-litho) by analogy with PHF-Tau. Cryomicroscopy analysis of self-proteolysed lithostathine confirmed the presence of long protofibrils with a similar diameter (13 nm) to that recorded under negatively stained conditions (Figure 2D). Fourier analysis of these fibres confirmed the presence of a 1/4.6 nm–1 layer line. These data confirm the results of the analysis performed on negatively stained samples in order to calculate the QHF-litho model, thus indicating that protofilaments do not seem to be modified by the acidic pH of uranyl acetate. In the next section, it is proposed to look at the lithostathine monomer interactions.
Reconstruction of a lithostathine protofibril
Lithostathine S1 formed hydrophobic dimers and tetramers that were visible under denaturing electrophoresis conditions. Figure 3 shows an SDS–PAGE of lithostathine samples after self-proteolysis. When the whole form of lithostathine (S2) was predominant, no polymers were detected. These results are in agreement with unpublished data which showed that S2 aggregates were not resistant to 2% SDS (E.Wanker, personal communication). In addition, electrospray ionization mass spectrometry did not show the presence of any S2 polymers (not shown), contrary to what was observed in the case of calmodulin, which was found to contain non-covalent electrostatic dimers (Lafitte et al., 1999); whereas after the cleavage of the N-terminal undecapeptide, i.e. when the S1 concentration increased reflecting the demise of S2, dimers (D, apparent mol. wt 30 kDa) and tetramers (T, apparent mol. wt ∼67 kDa), but no trimers, appeared after a couple of weeks (Figure 3, 15 days). Adding exogenous S1 to the sample also resulted in a faster increase in the S1–S1 dimers, and to a lesser extent in the tetramers (not shown). Since protein–protein electrostatic interactions are not preserved in SDS–PAGE, these results suggested that S1–S1 interactions are essentially hydrophobic. Similar hydrophobic Aβ–Aβ interactions have also been described through the sequence KLVFF (Hughes et al., 1996; Tjernberg et al., 1996).
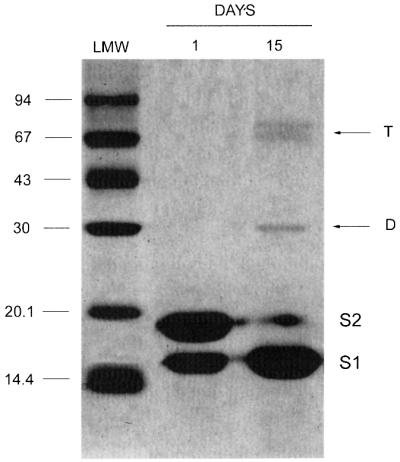
Fig. 3. SDS–PAGE of lithostathine. Gel electrophoresis of lithostathine incubated in 200 mM phosphate buffer pH 8 for 2 weeks at 37°C. Aliquots of 4 µg were withdrawn at t = 1 and 15 days, and loaded onto a 15% SDS–PAGE. D, dimers; T, tetramers. The molecular weight markers (LMW; Amersham Pharmacia Biotech) are indicated on the left. S2 corresponds to the whole form of lithostathine, whereas S1 is the N-terminally truncated form.
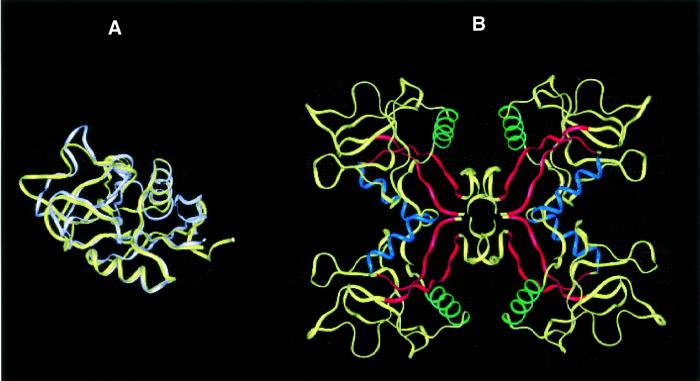
Lithostathine–lithostathine lateral hydrophobic interactions. The overall pattern of folding of lithostathine is similar to that of the C-type lectin domains (Bertrand et al., 1996). Human tetranectin also displays a domain of this kind, called TN3 (Nielsen et al., 1997; Kastrup et al., 1998). Although the sequence identity between TN3 and lithostathine is only 22%, as determined with ALIGN software (Myers and Miller, 1988), it was observed upon superimposing their backbones that there existed some striking similarities between their general folding patterns, with a root mean square deviation of 6.9 Å (Figure 4A). Under these conditions, each of the two α-helices of lithostathine and TN3 were exactly superimposable. Interestingly, the main differences were located in the N-terminal domain, i.e. very close to the self-proteolytic site of lithostathine (Arg11–Ile12) and the first disulfide bridge (Cys14–Cys25). These results indicate that both lithostathine and TN3 have very similar 3D structures.
Fig. 4. Lithostathine tetramer. (A) Superimposition of lithostathine and TN3 backbones. Lithostathine backbone is in yellow, TN3 backbone is in white. The greatest differences can be seen to lie in the N-terminal extremities and in the loop regions. (B) Model for tetrameric lithostathine obtained after superimposition of TN3 tetramer and energy minimization. Hydrophobic sheets containing aromatic residues (24–33 and 136–143) are shown in red. The H2 helix (35–45) is in blue and the H3 helix (56–68) in green. The majority of the hydrophobic residues are located inside the tetramer. Interestingly, it can be noted that in the H3 helix lithostathine showed a four-residue motif, 59-GAFV-62, which commonly occurs among amyloidogenic proteins such as the islet amyloid polypeptide, the Aβ peptide, the non-amyloid component of Alzheimer’s disease and the prion protein (El-Agnaf and Irvine, 2000).
TN3 crystallizes into a dimer (Kastrup et al., 1998), but can be assembled into a tetramer by applying crystallographic symmetry procedures (Henrick and Thornton, 1998). We then superimposed each monomer of lithostathine onto one TN3 tetramer. After an energy minimization step, we obtained a tetrameric model for lithostathine. A hydrophobic side formed by a cluster of aromatic residues was located on the inside and was involved in the tetrameric association. Hydrophilic residues were in contact with the solvent (Figure 4B). These results are in good agreement with those presented in Figure 3.
Lithostathine–lithostathine longitudinal electrostatic interactions. The formation of QHF-litho protofibrils involves the elongation of the stacked tetramers as the result of longitudinal interactions. Lithostathine is a highly polarized protein with a surface charge distribution. Most of the acidic residues are located on one side, whereas most of the basic residues form a cluster on the opposite side (Bertrand et al., 1996). This prompted us to examine these putative interactions. First, we screened cellulose-bound peptide scans to map the lithostathine protein– protein interactions. The results showed that three clusters of amino acids were involved in these interactions (Figure 5). These regions (two basic, one acidic) were highlighted by the lithostathine binding pattern. The first basic region encompassed the 81-HDPKKNRRW-89 sequence present in the three successive spots, Nos 39, 40 and 41, and in part of No. 44, which contains R87 and R88. However, the reason why Nos 42 and 43 were not highlighted here is not clear. The second basic region corresponded to the sequence 99-YKSWGIGAPSSVN-111 (spot No. 50). The acidic region detected contained the terminal sequence EDRE (21-YRSYCYYFNEDRE-33, spot No. 11). All three sequences are very accessible on the surface of the protein.
Fig. 5. Lithostathine binding to cellulose-bound peptide scans. A gridded array of synthetic peptides corresponding to lithostathine was incubated with POD-lithostathine. Bound lithostathine was labelled using chemiluminescence procedures. The strongest signals occurred in the 81-HDPKKNRRW-89 region (spot Nos 39, 40 and 41). Other highlighted regions were 99-YKSWGIGAPSSVN-111 (spot No. 50) and 21-YRSYCYYFNEDRE-33 (spot No. 11). The rather heavy background of the membrane labelling was due to traces of free peroxidase. However, the signals obtained were specific, since no signals were observed in the control experiments, in which incubation was performed with POD alone.
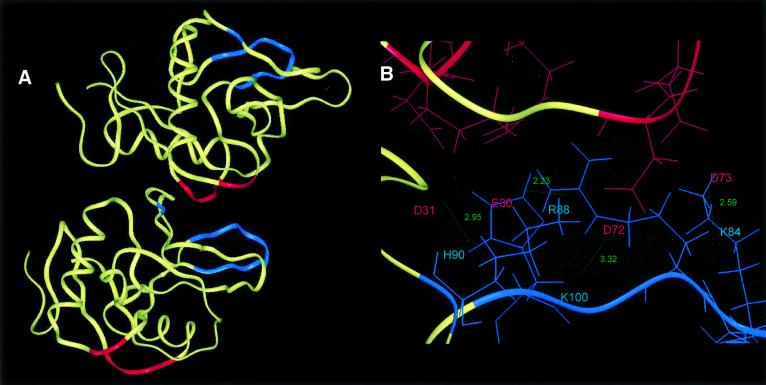
Secondly, we performed a molecular modelling study on the dimer, based on the protein–protein mapping data. The N-terminal undecapeptide (1–11) of lithostathine was removed from the structure coordinates. Under these conditions, it was observed that residues previously identified by performing a cellulose-bound peptide scan formed potential electrostatic interactions between two lithostathine monomers. Neighbouring acidic and basic lateral chains <3 Å apart were connected to each other. The dimer was fixed except in the regions involved in the interaction. After performing energy minimization and dynamics simulation, we determined the general orientation of two successive monomers in one helix (Figure 6A). Region E30–E33, and also D72–D73, formed a cluster of acidic residues that was able to interact with region H81–H90 and K100 (Figure 6B). Interestingly, the interaction involving D72–D73 was not observed in the cellulose-bound peptide scan (c.f. Figure 5, spot No. 31, which corresponds to the sequence 61-FVASLIKE SGTDD-73). However, it is often observed that clustered negative charges at the termini of peptides interfere with protein binding. We observed this interference in the epitope mapping of a monoclonal antibody to lithostathine in a highlighted series of spots, one of which contained the C-terminal end DAD (not shown). These results indicated that electrostatic interactions are involved in the longitudinal interactions leading to the formation of QHF-litho.
Fig. 6. Molecular modelling of electrostatic bonds between two monomers of lithostathine. (A) General view showing the interaction of two monomers. Acidic residues (30–33 and 72–73) are in red, basic residues (81–90 and 100) are in blue. Note the high level of polarization of lithostathine. (B) Enlargement of the main electrostatic interacting region. E30 interacts with R88, D31 with H90, D72 with K100, and D73 with K84. It is also possible that during dimer formation, structural changes may increase the number of electrostatic bonds.
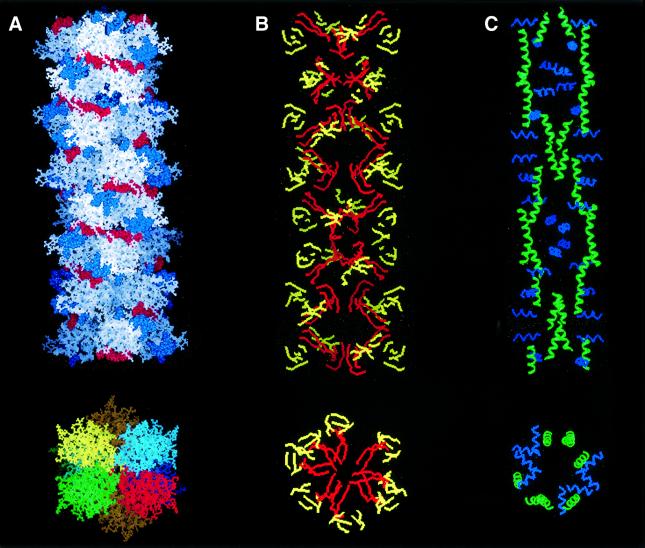
3D reconstruction of QHF-litho. We stacked the two tetramers together, using the angle of 52° determined by image analysis. By duplicating the tetramer–tetramer interactions, we built a 3D model for the QHF-litho protofibrils (Figure 7). The hydrophobic regions were located inside the structure, whereas the charged residues were involved in longitudinal interactions. The final model consists of seven successively repeated monomers with a pitch of 18 nm and a diameter of 10 nm. This model is in excellent agreement with data obtained by AFM and electron microscopy (Figure 7A). In addition, the two hydrophobic N- and C-terminal β-sheets (24–33 and 136–143) are buried inside the protofibril (Figure 7B). Furthermore, analysis of the α-helix distribution showed that H3 is parallel to the protofibril axis, whereas H2 is perpendicular (Figure 7C).
Fig. 7. Lithostathine protofibril. Reconstructed image of a lithostathine protofibril obtained as described in Results. (A) View of the protofibril axis and section. Electrostatic interactions involving acidic residues (in red) and basic residues (in blue) are shown (top). Four helices (green, red, blue or yellow) form the protofibril with seven monomers per turn (bottom). The helix pitch is 18 nm. Eight tetramers are shown. A rotation of 52° was applied between each tetramer of lithostathine after energy minimization. The diameter of the protofibril is 10 nm. (B) Same view as in (A) but with β-sheets only. Hydrophobic β-sheets corresponding to 24–33 and 136–143 regions are shown in red, the other in yellow. (C) Same view as in (A) but with α-helices only. H2 (in blue) is perpendicular to the protofibril axis, whereas H3 (in green) is parallel.
Discussion
The most noteworthy property of lithostathine is its ability to form protofibrils, resulting in a network of fibrillar aggregates. The heterogeneity observed in the length of the protofibrils, as measured by AFM, may be due to differences between their growth rates, which could be checked by performing time-lapse AFM as was previously done in the case of Aβ protofibrils (Harper et al., 1999). In addition, each protofibril has a helical arrangement that generates diffraction patterns. Fourier analysis performed on electron microscopy data showed that these patterns reflect a quadruple helical structure called QHF-litho. Similar tetrameric associations have previously been observed in designed proteins, including various β- amyloid sequences in the S6 ribosomal protein (Otzen et al., 2000), lysozyme fibrils (Chamberlain et al., 2000), and even in the Ftl3 receptors interacting-lectin, which form quadruple super-helix structures (Hamelryck et al., 2000). Interestingly, although lithostathine has some properties in common with amyloid proteins, we recently observed (data to be published elsewhere) that QHF-litho are not of the amyloid type, i.e. they do not show the typical cross-β pattern of amyloid fibrils (Sunde et al., 1997).
There are various possible reasons why proteins undergo fibril precipitation. For instance, post-translational modifications such as the hyperphosphorylation of Tau may lead to the detachment of Tau from the microtubules, resulting in the formation of PHF-Tau (Biernat et al., 1992), although this hypothesis has recently been challenged (Schneider et al., 1999). In fronto-temporal dementia with Parkinsonism linked to chromosome 17, mutations in the tau gene are responsible for twisted ribbons and PHF formation (Goedert, 1999). In fronto-temporal dementia with Pick body-like inclusions, a tau gene mutation led to a reduced ability to promote microtubule assembly (Murrell et al., 1999). In other diseases such as senile systemic amyloidosis, the fibrillation of transthyretin occurs under partially denaturing conditions (Lashuel et al., 1998). Protein misfolding can also cause fibrillar precipitation (reviewed in Dobson, 1999). This process has been particularly closely studied in the prion protein responsible for mad cow disease (Prusiner, 1997). In terms of lithostathine, neither post-translational modifications, mutations, denaturation nor protein misfolding was found to be involved in the formation of QHF-litho.
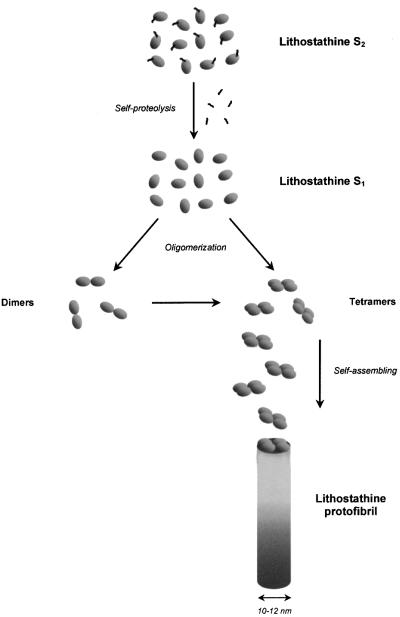
Self-proteolysis of lithostathine, i.e. N-terminal truncation, constitutes a necessary and critical prefibrillogenic event, contrary to what occurs in the case of α-synuclein, for instance, which becomes truncated after its assembly in Parkinson’s disease (Serpell et al., 2000). Furthermore, this autocatalytic nucleating process controls fibril growth (Gajdusek, 1988). Interestingly, this behaviour resembles that of the prion protein: N-terminal truncation of the PrPsc form responsible for the disease results in PrP27-30, which forms amyloid (McKinley et al., 1991). Lithostathine was thus surprisingly found to mimic the behaviour of the prion protein. The specific factors or structural changes leading to the self-proteolysis of lithostathine have not yet been identified. However, the N-terminal undecapeptide is very flexible and can display an extended structure (Bertrand et al., 1996; Gerbaud et al., 2000). It may protect lithostathine from partial unfolding by hiding the hydrophobic clusters involved in the tetrameric association, thus preventing lithostathine from forming fibrils (not shown). When cleavage occurs, these hydrophobic residues may become accessible and form dimers or tetramers. These tetramers may elongate, forming full-length protofibrils. This process is summarized in Figure 8.
Fig. 8. Proposed scheme for QHF-litho formation. Lithostathine S2 undergoes self-proteolysis of the N-terminal undecapeptide, resulting in S1. Oligomerization of S1 leads to the formation of dimers and tetramers. Dimers can also evolve into tetramers. However, several types of oligomer may co-exist in solution. These four subunits forming the tetramer then simultaneously join the end of the protofibril. Tetramers therefore constitute the structural basis of the QHF-litho. This model ressembles the nucleated conformational conversion (NCC) model recently proposed by Serio et al. (2000), except that in our case, the oligomers do not seem to form a micelle-like structure.
Various apparently non-related proteins undergo fibrillar aggregation processes in neurodegenerative diseases (Crowther, 1991; Harper et al., 1999; Perutz, 1999; El-Agnaf and Irvine, 2000; Rochet et al., 2000; Serpell, 2000). It is therefore plausible that common mechanisms may be involved in these protein aggregation processes, although the triggering of these events may be disease specific. The question as to whether or not these aggregates are the cause or the consequence of the disease still remains to be elucidated. Common sense suggests that they may result from an upstream dysregulation. However, the accumulation of amyloid fibrils is definitely destructive to the brain. For instance, in familial encephalopathy with neuroserpin inclusion bodies, abnormal protein aggregation alone suffices per se to induce neuronal degeneration (Davis et al., 1999). Moreover, in an astonishing recent paper, Brown et al. (2000) have reported that after ashing the infectious β-pleated PrP isoform at 600°C, PrP lattice ‘ghosts’ surviving the combustion were found to be responsible for trace amounts of infectivity after being intracerebrally inoculated into healthy hamsters. All in all, these findings strongly support the idea that these aggregates may play a decisive role in the development of neurodegenerative disorders. Further studies on the fundamental aspects of protein folding, truncation and assembly occurring prior to fibril formation should therefore provide some vital clues for developing strategies for use in the treatment of these devastating diseases.
Materials and methods
Polyacrylamide gel electrophoresis
Non-reducing SDS–PAGE was performed on 15% polyacrylamide slab gels using standard procedures. The gels were then stained with 0.1% Coomassie Brilliant Blue R-250.
Screening of lithostathine cellulose-bound peptide scan to detect lithostathine binding
The primary sequence of lithostathine was synthesized successively with 13mer peptides with two overlapping residues, giving 67 different peptides (Jerini Bio Tools, Berlin, Germany), and thus presenting all the potential lithostathine-binding sites. Peptides were then attached to cellulose via β-(Ala)2 spacer as described by Rüdiger et al. (1997). Three-hundred micrograms of lithostathine were labelled with horseradish peroxidase (POD) and incubated with the cellulose membrane. The interactions between POD-lithostathine and the peptides were then detected using the BM chemiluminescence ELISA POD kit (Boehringer Mannheim, Mannheim, Germany).
Lithostathine fibril preparation
Lithostathine was purified as previously described (Cerini et al., 1999). Fifty microliters of a 0.34 mg/ml solution were incubated in 200 mM Tris–Cl, 5 mM EDTA pH 8, for 4 days at 37°C. After a centrifugation run at 13 000 g for 5 min, the supernatant was discarded, washed twice with water, and the pellets were used in AFM and electron microscopy experiments.
Atomic force microscopy
AFM experiments were performed at room temperature in air and in liquid with a Nanoscope IIIa scanning probe microscope equipped with an ‘E head’ scanner (Digital Instruments, Santa Barbara, CA). For the air experiments, ten microliters of a lithostathine fibril solution (at a concentration of ∼30 µg/ml in 10 mM Tris–Cl pH 8) were allowed to settle on freshly cleaved mica surfaces (Provac, Balzers, Liechtenstein) for 2 min. The mica disk was then rinsed with deionized water, the excess liquid was removed using filter paper, and the sample was dried at room temperature before the imaging procedure was carried out. For the liquid experiments, the lithostathine solution was deposited onto freshly cleaved highly oriented pyrolytic graphite (HOPG, Le Carbone Loraine, Paris, France). The sample was then mounted in the microscope with the specific fluid cell without the O-ring, and a 100 µl drop of the same buffer was added. Images were then acquired in the tapping mode using commercial cantilevers with sharpened silicon nitride tips (Olympus, Tokyo, Japan) and Nanoprobe cantilevers (Digital Instruments) for air and liquid imaging, respectively. AFM measurements (lengths and widths at half of the maximum heights) were performed using a home-made image analysis software program. Topographic images were processed by performing mean plane subtraction and colour coded from black to white in the Z-direction (from bottom to top, respectively).
Electron microscopy and image analysis
Lithostathine samples were applied to holey-film grids and frozen in liquid ethane using standard protocols (Lepault and Dubochet, 1986) for cryomicroscopy, and applied to glow-discharged, Formvar-carbon-coated copper grids for negative staining. In this case, staining was performed in 1.5% uranyl acetate for 1 min. T4 tail-sheaths were used as internal magnification standards. Observations were performed with a CM12 transmission electron microscope (Phillips, Eindhoven, The Netherlands) equipped with a minimum electron dosage system. Low dose micrographs were recorded on S0163 film (Eastman Kodak Company, Rochester, NY) at an electron accelerating voltage of 100 kV and a magnification of 60 000×. Average defocus value was –1200 nm.
Selected negatives were digitized onto a P1000 drum densitometer (Oxford Optronix Ltd, Oxford, UK) using a 25 µm window, resulting in a 0.42 nm square pixel. Pixel size was estimated from T4 tail-sheath diffraction patterns. A total number of 250 individual lithostathine images were windowed and aligned to obtain an average image using the X-MIPP software program (Marabini et al., 1996). The final average resolution was estimated by means of the spectral signal-to-noise ratio method (SSNR) (Unser et al., 1987). FTs from individual images were computed with the SPIDER software program (Frank et al., 1996). As all of the images displayed the same orientation, the equatorial and meridian axis of their diffraction patterns were also aligned. It was therefore possible to improve the intensity of the reflections with a view to estimating the helical parameters, by taking the modules of FTs as images and combining them into an average diffraction pattern as described previously in the case of HIV-1 Rev protein filaments (Watts et al., 1998). A low resolution three-dimensional model was built from helical parameters, using the SIGMA software program (Taveau, 1996).
Molecular modelling
A high resolution model of S1 lithostathine forms, packed into the quadruple helical structure, was assembled with the Insight II and Discover software programs (MSI Technologies Inc., San Diego, CA) running on an R10000 workstation (SGI, Mountain View, CA). The pH was set at 8. The atomic coordinates resulting from the 1.55 Å resolution refinement of lithostathine (Protein Data Bank code 1QDD) were used as the starting model. The structural complexes were optimized with a CVFF force-field in terms of the internal energies in order to monitor each modelling step. An initial energy minimization step was carried out with the conjugate gradient algorithm, down to a maximum derivative of 0.001 kcal/Å. A dynamic step was then performed at 300 K for 1.1 ps. The analysis of the trajectory was carried out with 110 different dimers selected every 10 fs from the dynamic step. The lower energy complex was selected from this trajectory.
Acknowledgments
Acknowledgements
We thank R.Michel for purifying lithostathine. We also thank J.Barbet (UPRES EA 32-90) for providing the AFM software. This work was partly supported by grants from GRAL (Groupe de Recherche sur la maladie d’Alzheimer). L.D. and E.L. are supported by GRAL.
References
- Avila J. (2000) Tau aggregation into fibrillar polymers: taupathies. FEBS Lett., 476, 89–92. [DOI] [PubMed] [Google Scholar]
- Bayer T.A., Cappai,R., Masters,C.L., Beyreuther,K. and Multhaup,G. (1999) It all sticks together—the APP-related family of proteins and Alzheimer’s disease. Mol. Psychiatry, 4, 524–528. [DOI] [PubMed] [Google Scholar]
- Bertrand J.A., Pignol,D., Bernard,J.P., Verdier,J.M., Dagorn,J.C. and Fontecilla-Camps,J.C. (1996) Crystal structure of human lithostathine, the pancreatic inhibitor of stone formation. EMBO J., 15, 2678–2684. [PMC free article] [PubMed] [Google Scholar]
- Biernat J. et al. (1992) The switch of tau protein to an Alzheimer-like state includes the phosphorylation of two serine-proline motifs upstream of the microtubule binding region. EMBO J., 11, 1593–1597. [DOI] [PMC free article] [PubMed] [Google Scholar]
- Brown P., Rau,E.H., Johnson,B.K., Bacote,A.E., Gibbs,C.J.,Jr and Gajdusek,D.C. (2000) New studies on the heat resistance of hamster-adapted scrapie agent: threshold survival after ashing at 600°C suggests an inorganic template of replication. Proc. Natl Acad. Sci. USA, 97, 3418–3421. [DOI] [PMC free article] [PubMed] [Google Scholar]
- Cerini C. et al. (1999) Biophysical characterization of lithostathine. Evidences for a polymeric structure at physiological pH and a proteolysis mechanism leading to the formation of fibrils. J. Biol. Chem., 274, 22266–22274. [DOI] [PubMed] [Google Scholar]
- Chamberlain A.K., MacPhee,C.E., Morozova-Roche,L.A., Zurdo,J., Hill,H.A.O., Dobson,C.M. and Davis,J.J. (2000) The ultrastructural organization of amyloid fibrils by atomic force microscopy. Biophys. J., 79, 3282–3293. [DOI] [PMC free article] [PubMed] [Google Scholar]
- Crowther R.A. (1991) Straight and paired helical filaments in Alzheimer disease have a common structural unit. Proc. Natl Acad. Sci. USA, 88, 2288–2292. [DOI] [PMC free article] [PubMed] [Google Scholar]
- Davis R.L. et al. (1999) Familial dementia caused by polymerization of mutant neuroserpin. Nature, 401, 376–379. [DOI] [PubMed] [Google Scholar]
- De Caro A., Lohse,J. and Sarles,H. (1979) Characterization of a protein isolated from pancreatic calculi of men suffering from chronic calcifying pancreatitis Biochem. Biophys. Res. Commun., 87, 1176–1182. [DOI] [PubMed] [Google Scholar]
- Dobson C.M. (1999) Protein misfolding, evolution and disease. Trends Biochem. Sci., 24, 329–332. [DOI] [PubMed] [Google Scholar]
- Duplan L. et al. (2001) Lithostathine and pancreatitis-associated protein are involved in the very early stages of Alzheimer’s disease. Neurobiol. Aging, 22, 79–88. [DOI] [PubMed] [Google Scholar]
- El-Agnaf O.M.A. and Irvine,G.B. (2000) Formation and properties of amyloid-like fibrils derived from α-synuclein and related proteins. J. Struct. Biol., 130, 300–309. [DOI] [PubMed] [Google Scholar]
- Frank J., Radermacher,M., Penczek,P., Zhu,J., Li,Y., Ladjadj,M. and Leith,A. (1996) Spider and Web: processing and visualization of images in 3D electron microscopy and related fields. J. Struct. Biol., 116, 190–199. [DOI] [PubMed] [Google Scholar]
- Gajdusek D.C. (1988) Transmissible and non-transmissible amyloidoses: autocatalytic post-translational conversion of host precursor proteins to β-pleated sheet configurations. J. Neuroimmunol., 20, 95–110. [DOI] [PubMed] [Google Scholar]
- Geider S. et al. (1996) Pancreatic lithostathine as a calcite habit modifier. J. Biol. Chem., 271, 26302–26306. [DOI] [PubMed] [Google Scholar]
- Gerbaud V., Pignol,D., Loret,E., Bertrand,J.A., Berland,Y., Fontecilla-Camps,J., Canselier,J.P., Gabas,N. and Verdier,J.M. (2000) Mechanism of calcite crystal growth inhibition by the N-terminal undecapeptide of lithostathine. J. Biol. Chem., 275, 1057–1064. [DOI] [PubMed] [Google Scholar]
- Goedert M. (1999) Filamentous nerve cell inclusions in neurodegenerative diseases: tauopathies and α-synucleinopathies. Philos. Trans. R. Soc. Lond. B, 354, 1101–1118. [DOI] [PMC free article] [PubMed] [Google Scholar]
- Hamelryck T.W., Moore,J.G., Chrispeels,M.J., Loris,R. and Wyns,L. (2000) The role of weak protein–protein interactions in multivalent lectin–carbohydrate binding: crystal structure of cross-linked FRIL. J. Mol. Biol., 299, 875–883. [DOI] [PubMed] [Google Scholar]
- Harper J.D., Wong,S.S., Lieber,C.M. and Lansbury,P.T.,Jr (1999) Assembly of Aβ amyloid protofibrils: an in vitro model for a possible early event in Alzheimer’s disease. Biochemistry, 38, 8972–8980. [DOI] [PubMed] [Google Scholar]
- Henrick K. and Thornton,J.M. (1998) PQS: a protein quaternary structure file server. Trends Biochem. Sci., 23, 358–361. [DOI] [PubMed] [Google Scholar]
- Hughes S.T., Goyal,S., Sun,J.E., Gonzalez-DeWhitt,P., Fortes,M.A., Riedel,N.G. and Sahasrabudhe,S.R. (1996) Two-hybrid system as a model to study the interaction of β-amyloid peptide monomers. Proc. Natl Acad. Sci. USA, 93, 2065–2070. [DOI] [PMC free article] [PubMed] [Google Scholar]
- Kahn S.E., Andrikopoulos,S. and Verchere,C.B. (1999) Islet amyloid: a long-recognized but underappreciated pathological feature of type 2 diabetes. Diabetes, 48, 241–253. [DOI] [PubMed] [Google Scholar]
- Kastrup J.S., Nielsen,B.B., Rasmussen,H., Holtet,T.L., Graversen,J.H., Etzerodt,M., Thogersen,H.C. and Larsen,I.K. (1998) Structure of the C-type lectin carbohydrate recognition domain of human tetranectin. Acta Crystallogr. D, 54, 757–766. [DOI] [PubMed] [Google Scholar]
- Keller D.J. and Franke,F.S. (1993) Envelope reconstruction of probe microscope images. Surf. Sci., 294, 409–419. [Google Scholar]
- Kopito R.R. and Ron,D. (2000) Conformational disease. Nature Cell Biol., 2, E207–E209. [DOI] [PubMed] [Google Scholar]
- Lafitte D., Heck,A.J.R., Hill,T.J., Jumel,K., Harding,S.E. and Derrick,P.J. (1999) Evidence of noncovalent dimerization of calmodulin. Eur. J. Biochem., 261, 337–344. [DOI] [PubMed] [Google Scholar]
- Lashuel H.A., Lai,Z. and Kelly,J.W. (1998) Characterization of the transthyretin acid denaturation pathways by analytical ultra centrifugation: implications for wild-type, V30M, and L55P amyloid fibril formation. Biochemistry, 37, 17851–17864. [DOI] [PubMed] [Google Scholar]
- Lepault J. and Dubochet,J. (1986) Electron microscopy of frozen hydrated specimens: preparation and characteristics. Methods Enzymol., 127, 719–730. [DOI] [PubMed] [Google Scholar]
- Marabini R., Masegosa,I.M., San Martín,C., Marco,S., Fernández,J.J., de la Fraga,L.G., Vaquerizo,C. and Carazo,J.M. (1996) Xmipp: an image processing package for electron microscopy. J. Struct. Biol., 116, 237–240. [DOI] [PubMed] [Google Scholar]
- McKinley M.P., Meyer,R.K., Kenaga,L., Rahbar,F., Cotter,R., Serban,A. and Prusiner,S.B. (1991) Scrapie prion rod formation in vitro requires both detergent extraction and limited proteolysis. J. Virol., 65, 1340–1351. [DOI] [PMC free article] [PubMed] [Google Scholar]
- Murrell J.R. et al. (1999) Tau gene mutation G389R causes a tauopathy with abundant Pick body-like inclusions and axonal deposits. J. Neuropathol. Exp. Neurol., 58, 1207–1226. [DOI] [PubMed] [Google Scholar]
- Myers E.W. and Miller,W. (1988) Optimal alignments in linear space. Comput. Appl. Biosci., 4, 11–17. [DOI] [PubMed] [Google Scholar]
- Nielsen B.B., Kastrup,J.S., Rasmussen,H., Holtet,T.L., Graversen,J.H., Etzerodt,M., Thogersen,H.C. and Larsen,I.K. (1997) Crystal structure of tetranectin, a trimeric plasminogen-binding protein with an α-helical coiled coil. FEBS Lett., 412, 388–396. [DOI] [PubMed] [Google Scholar]
- Otzen D.E., Kristensen,O. and Oliveberg,M. (2000) Designed protein tetramer zipped together with a hydrophobic Alzheimer homology: a structural clue to amyloid assembly. Proc. Natl Acad. Sci. USA, 97, 9907–9912. [DOI] [PMC free article] [PubMed] [Google Scholar]
- Perutz M.F. (1999) Glutamine repeats and neurodegenerative diseases: molecular aspects. Trends Biochem. Sci., 24, 58–63. [DOI] [PubMed] [Google Scholar]
- Plante-Bordeneuve V. and Said,G. (2000) Transthyretin related familial amyloid polyneuropathy. Curr. Opin. Neurol., 13, 569–573. [DOI] [PubMed] [Google Scholar]
- Prusiner S.B. (1997) Prion diseases and the BSE crisis. Science, 278, 245–251. [DOI] [PubMed] [Google Scholar]
- Rochet J.C., Conway,K.A. and Lansbury,P.T.,Jr (2000) Inhibition of fibrillization and accumulation of prefibrillar oligomers in mixtures of human and mouse α-synuclein. Biochemistry, 39, 10619–10626. [DOI] [PubMed] [Google Scholar]
- Rüdiger S., Germeroth,L., Schneider-Mergener,J. and Bukau,B. (1997) Substrate specificity of the DnaK chaperone determined by screening cellulose-bound peptide libraries. EMBO J., 16, 1501–1507. [DOI] [PMC free article] [PubMed] [Google Scholar]
- Schneider A., Biernat,J., von Bergen,M., Mandelkow,E. and Mandelkow,E.-M. (1999) Phosphorylation that detaches tau protein from microtubules (Ser262, Ser214) also protects it against aggregation into Alzheimer paired helical filaments. Biochemistry, 38, 3549–3558. [DOI] [PubMed] [Google Scholar]
- Serio T.R., Cashikar,A.G., Kowal,A.S., Sawicki,G.J., Moslehi,J.J., Serpell,L., Arnsdorf,M.F, and Linquist,S.L. (2000) Nucleated conformational conversion and the replication of conformational information by a prion determinant. Science, 289, 1317–1321. [DOI] [PubMed] [Google Scholar]
- Serpell L.C. (2000) Alzheimer’s amyloid fibrils: structure and assembly. Biochim. Biophys. Acta, 1502, 16–30. [DOI] [PubMed] [Google Scholar]
- Serpell L.C., Berriman,J., Ross,J., Goedert,M. and Crowther,R.A. (2000) Fiber diffraction of synthetic α-synuclein filaments shows amyloid-like cross-β conformation. Proc. Natl Acad. Sci. USA, 97, 4897–4902. [DOI] [PMC free article] [PubMed] [Google Scholar]
- Sunde M., Serpell,L.C., Bartlam,M., Fraser,P.E., Pepys,M.B. and Blake,C.C.F. (1997) Common core structure of amyloid fibrils by synchrotron X-ray diffraction. J. Mol. Biol., 273, 729–739. [DOI] [PubMed] [Google Scholar]
- Taveau J.C. (1996) Presentation of the sigma software: software of imagery and graphics for molecular architecture. J. Struct. Biol., 116, 223–229. [DOI] [PubMed] [Google Scholar]
- Tjernberg L.O., Näslund,J., Lindqvist,F., Johansson,J., Karlström,A.R., Thyberg,J., Terenius,L. and Norstedt,C. (1996) Arrest of β-amyloid fibril formation by a pentapeptide ligand. J. Biol. Chem., 271, 8545–8548. [DOI] [PubMed] [Google Scholar]
- Unser M., Trust,B. and Steven,A.C. (1987) A new resolution criterion based on spectral signal-to-noise ratios. Ultramicroscopy, 23, 39–52. [DOI] [PubMed] [Google Scholar]
- Walker L.C. and LeVineH.,III (2000) The cerebral proteopathies. Neurobiol. Aging, 21, 559–561. [DOI] [PubMed] [Google Scholar]
- Watts N.R., Misra,M., Wingfield,P.T., Stahl,S.J., Cheng,N., Trus,B.L., Steven,A.C. and Williams,R.W. (1998) Three-dimensional structure of HIV-1 Rev protein filaments. J. Struct. Biol., 121, 41–52. [DOI] [PubMed] [Google Scholar]


