

Abstract
Gemcitabine is a potent inhibitor of DNA replication and is a mainstay therapeutic for diverse cancers, particularly pancreatic ductal adenocarcinoma (PDAC). However, most tumors remain refractory to gemcitabine therapies. To define the cancer cell response to gemcitabine, we performed genome-scale CRISPR-Cas9 chemical-genetic screens in PDAC cells and found selective loss of cell fitness upon disruption of the cytidine deaminases APOBEC3C and APOBEC3D. Following gemcitabine treatment, APOBEC3C and APOBEC3D promote DNA replication stress resistance and cell survival by deaminating cytidines in the nuclear genome to ensure DNA replication fork re-start and repair in PDAC cells. We provide evidence that the chemical-genetic interaction between APOBEC3C or APOBEC3D and gemcitabine is absent in non-transformed cells but is recapitulated across different PDAC cell lines, in PDAC organoids, and in PDAC xenografts. Thus, we uncover roles for APOBEC3C and APOBEC3D in DNA replication stress resistance and offer plausible targets for improving gemcitabine-based therapies for PDAC.
Introduction
Accurate and complete DNA replication is fundamental to the faithful transmission of genetic information, genome stability, and cellular survival. However, numerous obstacles pose a threat to the fidelity of DNA replication, many of which cause DNA replication stress. Replication stress, defined as a dysregulation of DNA replication fork speed, is a prominent feature of cancer cells and is an important event in carcinogenesis1,2. The sustained proliferative signaling induced by oncogenes is an early driver of replication stress and genome instability that ultimately promote cancer progression. In addition, alterations in DNA damage response and repair genes are prevalent in tumors3 and contribute to the DNA repair deficits and genomic aberrations in cancer cells. As such, replication stress has gained substantial traction as a therapeutic target as it provides a selective means to eliminate tumor cells4. Furthermore, many chemotherapeutic agents exploit the proliferative advantage of cancer cells by targeting DNA replication and increasing the levels of replication stress. Understanding how tumor cells respond to replication stress presents a critical gap in defining the response to therapy and offers the opportunity to identify actionable drug targets and the potential to elucidate novel combination therapies.
Gemcitabine (2’2’-difluoro-deoxycytidine; dFdC) is a nucleoside analogue used clinically as a broad-spectrum chemotherapeutic for almost three decades5, most notably for pancreatic, breast, non-small cell lung, ovarian, and bladder cancers. Gemcitabine exerts its anticancer effects by targeting DNA replication and repair in two ways. In the first, gemcitabine is converted in vivo to a dNDP analogue, which inhibits ribonucleotide reductase, an enzyme required for dNTP production6, thereby decreasing the intracellular pool of nucleotides. In the second, following conversion of gemcitabine to its triphosphate form, it competes with dCTP for incorporation into nascent DNA. Once incorporated into DNA, it causes DNA chain termination after the addition of a single nucleotide7, thereby preventing exonucleolytic removal of the faulty nucleotide. Although gemcitabine is extensively used in combination with other therapies in the clinic, most tumors remain unresponsive to gemcitabine regimens. It remains poorly understood how tumor cells respond to the replication stress and genome instability caused by gemcitabine8–12, information that is essential to identify predictors of patient response that could reveal new therapeutic avenues.
We systematically interrogated the human genome for genes that modulate the response to gemcitabine in pancreatic ductal adenocarcinoma (PDAC) cells using CRISPR-Cas9 gene disruption to elucidate the cancer cell response to therapeutic replication stress. As gemcitabine remains a standard of care for advanced and metastatic PDAC, in combination with the microtubule stabilizing agent paclitaxel13, we focused our studies on PDAC as there remains an unmet need to improve therapeutic options for this aggressive cancer type. We find that the APOBEC3 family cytidine deaminases APOBEC3C (A3C) and APOBEC3D (A3D) are necessary for gemcitabine resistance in PDAC cell lines, organoids, and xenografts, but not in non-transformed pancreatic epithelial cells. We show that A3C and A3D mRNA expression is strongly induced by gemcitabine in PDAC cells and that A3C and A3D promote replication stress resistance in a manner independent of their established roles in innate immunity. We elucidate functions for A3C and A3D in promoting DNA replication fork re-start by genome deamination upon therapeutic replication stress, whereby absence of either protein leads to incomplete DNA repair, genome instability, and ultimately PDAC cell death. Together, our work defines roles for A3C and A3D in replication stress resistance, advancing the molecular understanding of PDAC and identifying appealing targets for combination treatment with gemcitabine.
Results
CRISPR-Cas9 screens reveal modulators of gemcitabine sensitivity
To probe the cancer cell response to therapeutic replication stress, we performed genome-wide CRISPR-Cas9 screens in combination with gemcitabine on two PDAC cell lines (HPAF-II and Panc 08.13) with different genetic backgrounds and gemcitabine sensitivities (Supplementary Table 1), engineered to stably express Cas9 (Extended Data Fig. 1a-b). We transduced cells with the TKOv2 sgRNA library, grew cells for ~18 population doublings in the presence and absence of gemcitabine, and computed a normalized depletion score (normZ) for each gene to identify chemical-genetic interactions (Fig. 1a). Our screens performed robustly, as assessed by the detection of essential genes (Extended Data Fig. 1c). We identified known gemcitabine resistance genes (DCK, which encodes for the kinase that mono-phosphorylates gemcitabine14) and sensitizers (the replication stress response genes CHEK1, HUS1, and RAD110,15), demonstrating the potential of our screens to reveal uncharacterized gemcitabine response modulators (Fig. 1b,c). Using cut-offs of normZ ≤ −2 to identify sensitizers and normZ ≥ 4 to identify resistance genes at false discovery rates < 15%, we found modest overlap between the two screens (Fig. 1d), likely due to the substantial differences in genetic background between the cell lines. The 36 genes that scored as resistance genes in both screens showed a strong enrichment for rRNA processing and mitochondrial gene expression biological processes (Fig. 1e), which is interesting given the link between mitochondrial gene mutations and worse overall PDAC patient survival16.
Fig. 1. Genome-wide CRISPR-Cas9 screens reveal modulators of gemcitabine sensitivity.

a, Schematic illustrating the workflow of the genome-wide CRISPR-Cas9 screens with gemcitabine in pancreatic cancer cells. b, NormZ score plots illustrating the enrichment and depletion for genes targeted in the chemical-genetic HPAF-II and Panc 08.13 screens with gemcitabine. Genes chosen for mechanistic analyses are labeled (APOBEC3C and APOBEC3D), and genes that are known modulators of gemcitabine sensitivity are bolded. c, Venn diagram of gene hits (normZ score of ≤ −2 for sensitizers and ≥ 4 for sensitizers and resistance genes with false discovery rates (FDR) lower than 15%) in the two cell lines screened. d, Gene ontology (GO) Biological Process term enrichment for the 36 resistance genes that overlapped between the HPAF-II and Panc 08.13 screens. Circle size indicates the number of genes out of the 36 enriched in each GO term, circle color indicates the negative log FDR value, and x-axis position indicates fold-enrichment of each GO term compared to the whole genome reference set. Statistical support was determined using a Fisher’s exact test with Bonferroni correction. e, Heatmap illustrating the response to gemcitabine of five pancreatic cancer cell lines and the non-transformed pancreatic epithelial cell line HPDE harboring the indicated CRISPR-Cas9 knockouts. Individual sgRNAs targeting the genes of interest were introduced into each Cas9 stable cell line and each polyclonal cell population was treated with 1 µM gemcitabine. Cell viability was measured after 72 hours using alamarBlue and normalized to the viability of the same respective cell line expressing sgLacZ (control). Genes whose loss conferred resistance or sensitivity in at least four out of six cell lines are labeled as ‘pan-resistance genes’ or ‘pan-sensitizers’. Heatmap scale extends from a relative cell viability value of 0.4 (sensitive; magenta) to 1.2 (resistant; teal), with white representing no change in gemcitabine sensitivity (relative cell viability of 0.8). n = 3 independent transductions and cell viability experiments.
We chose 31 genes to validate based on three criteria: i) genes that are frequently mutated in PDAC17, ii) genes encoding proteins that localize to DNA replication forks challenged with replication stress18, and iii) genes that were strong sensitizers or resistors in at least one of the two screens. We validated the gemcitabine sensitivity of each gene following CRISPR-Cas9 disruption using individual sgRNAs in five PDAC cell lines (HPAF-II, Panc 08.13, Panc 10.05, AsPC-1, and BxPC-3) and in the pancreatic epithelial cell line HPDE (a non-transformed comparison). Sensitivity data was clustered, revealing chemical-genetic profiles for the 31 gene knockouts and for the six cell lines (Fig. 1f). 25 of the 31 gene disruptions recapitulated the gemcitabine sensitivity observed in the screens, thus most of the genes chosen were true positives. Disruption of three genes (DCK, C1orf109, and MRPL20) conferred resistance to gemcitabine in all the PDAC cell lines, and inactivation of five genes (APOBEC3D, BRCC3, BRIP1, BRD9, and RNF113A) promoted gemcitabine hypersensitivity in at least four of the five PDAC lines. Of particular interest, inactivation of A3D or BRD9 had no effect in non-transformed HPDE cells despite sensitizing all five PDAC lines to gemcitabine, indicating that these genes could harbor cancer cell-specific roles in the response to gemcitabine.
A3C- and A3D-deficient PDAC cells are sensitive to gemcitabine
The sensitivity of A3D-deficient cells to gemcitabine was intriguing as little is known about the cellular functions of A3D. A3D is one of seven paralogs in the APOBEC3 family of cytidine deaminases, which are important for the restriction of viruses and endogenous retroelements19. Other paralogs, notably APOBEC3A (A3A) and APOBEC3B (A3B), cause replication stress and chromosome instability when overexpressed19–22, and likely have roles in cancer progression as genome mutators19,23–25. A3A and A3B have been connected to drug resistance in lung and breast cancer models, with the mechanism posited to involve genome mutagenesis during tumor evolution25–27. APOBEC3G (A3G) has been implicated in promoting resistance to irradiation in blood and cervical cancer cells by facilitating double-strand break repair28,29. Roles for A3D in therapeutic resistance or in the replication stress response have not been described.
To confirm that A3D inactivation confers gemcitabine hypersensitivity, we performed competitive growth assays in the presence and absence of gemcitabine (Fig. 2a). A3D-deficient HPAF-II and Panc 08.13 cells were quickly depleted from the population in the presence of gemcitabine whereas cells transduced with a control sgRNA were unaffected (Fig. 2b). To determine whether the gemcitabine hypersensitivity of A3D-deficient cells is shared with other APOBEC3 genes, we assessed the sensitivity of knockouts of each of the seven paralogs. Inactivation of A3C hypersensitized PDAC cells to gemcitabine similar to A3D disruption, in both cell viability and clonogenic survival assays, whereas the other APOBEC3 paralogs did not (Fig. 2c-e and Extended Data Fig. 2a). A3C and A3D knockouts had little effect on non-transformed pancreatic epithelial cells HPDE and HPNE-hTERT, or on RPE1-hTERT p53−/− cells (Fig. 2f-h). Thus, PDAC cells appear to have a unique vulnerability to loss of A3C or A3D that is absent in non-transformed cells.
Fig. 2. APOBEC3C and APOBEC3D promote DNA replication stress resistance in pancreatic cancer.
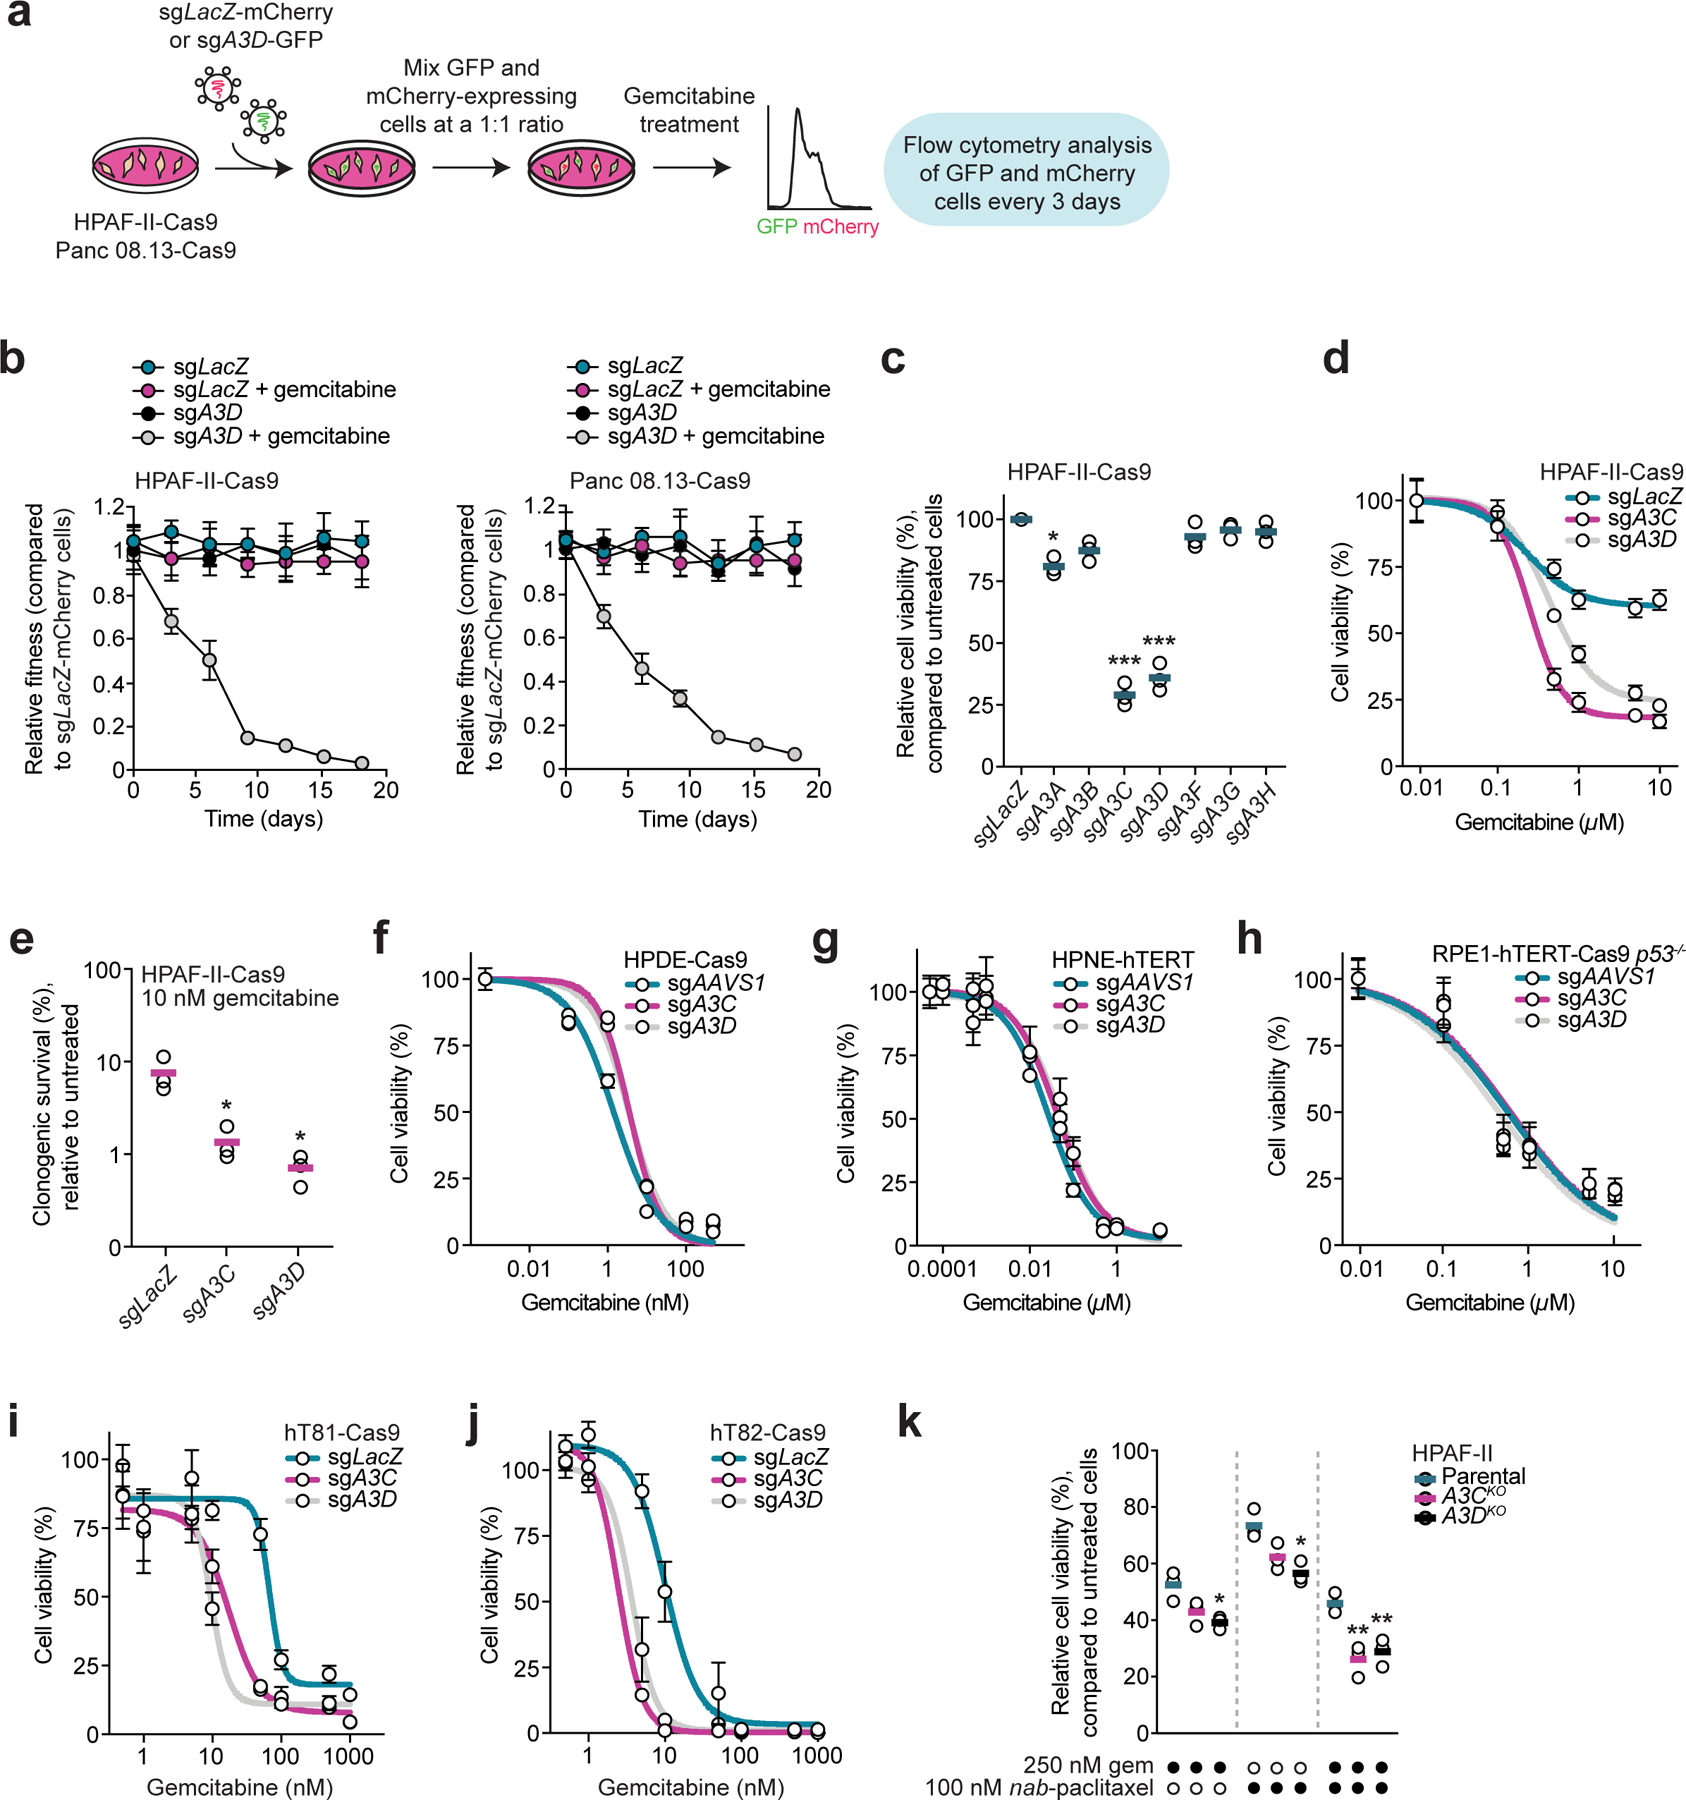
a, Schematic of two-color competitive growth assays in the presence and absence of gemcitabine. b, Two-color competitive growth assays where HPAF-II-Cas9 (left panel) or Panc 08.13-Cas9 (right panel) cells co-expressing mCherry and sgLacZ (control) were mixed with cells expressing either GFP and sgLacZ or GFP and sgA3D, and cultured in the presence or absence of 100 nM (HPAF-II) or 200 nM (Panc 08.13) gemcitabine for 18 days. The number of mCherry- and GFP-expressing cells was determined every three days, and the relative fraction of each GFP-positive population at each time point is plotted. n = 3 independent transductions and competitive growth assays. Circles and error bars indicate the mean and standard deviation. c, Viability of HPAF-II-Cas9 cells transduced with a sgRNA targeting LacZ or one of the seven APOBEC3 genes following 10 µM gemcitabine treatment. Cell viability was measured after 72 hours using alamarBlue and normalized to each untreated cell population. n = 3 independent transductions and cell viability experiments. Horizontal bars indicate the means. * p < 0.05 (sgA3A: 0.0118) and *** p < 0.001 (sgA3C: 0.0014 and sgA3D: 0.0025); two-tailed unpaired t-test. d, Viability of HPAF-II-Cas9 cells transduced with sgLacZ, sgA3C, or sgA3D and treated with a range of gemcitabine concentrations for 72 hours. alamarBlue was used to measure cell viability. e, Quantification of colony formation of HPAF-II-Cas9 cells transduced with sgLacZ, sgA3C, or sgA3D. Cells were treated with 10 nM gemcitabine for three days and propagated in drug-free media for 11 days before colonies were stained and counted. Horizontal bars indicate the means (n = 3 independent transductions and clonogenic survival assays). * p < 0.05 (sgA3C: 0.0332 and sgA3D: 0.0235); two-tailed unpaired t-test. f,g, Viability of HPDE-Cas9 (panel f) and HPNE-hTERT (panel g) cells transduced with sgAAVS1 (control), sgA3C, or sgA3D following gemcitabine treatment. Cell viability was measured after 72 hours using CellTiter-Glo. h, Viability of RPE1-hTERT-Cas9 p53−/− cells transduced with sgAAVS1, sgA3C, or sgA3D and treated with a range of gemcitabine concentrations for 72 hours. Cell viability was measured using CellTiter-Glo. i,j, Viability of hT81-Cas9 (panel i) and hT82-Cas9 (panel j) pancreatic cancer organoids transduced with sgLacZ, sgA3C, or sgA3D and treated with the indicated gemcitabine concentrations. Cell viability was measured after five days using CellTiter-Glo. k, Viability of parental and A3C- and A3D-deficient HPAF-II cells treated with 250 nM gemcitabine in the presence of 0 or 100 nM nab-paclitaxel for seven days, measured using CellTiter-Glo. n = 3 independent cell viability experiments, with horizontal bars representing the means. * p < 0.05 (sgA3D + 250 nM gem: 0.0149 and sgA3D + 100 nM nab-paclitaxel: 0.0109) and ** p < 0.01 (sgA3C + combination: 0.0069 and sgA3D + combination: 0.0088); two-tailed unpaired t-test. For panels d,f-j, n = 3 independent transductions and cell viability experiments, except for panel d where n = 4. Circles and error bars in the plots represent the mean and standard deviation of the independent experiments.
We also asked whether A3C or A3D deficiency confers gemcitabine hypersensitivity in patient-derived PDAC organoid models, choosing two with differing gemcitabine sensitivity and PDAC subtype, hT81 and hT82 (Supplementary Table 4). We engineered hT81 and hT82 cells to stably express FLAG-Cas9 (Extended Data Fig. 2f) and transduced each organoid culture with a lentiviral vector co-expressing eGFP and a sgRNA targeting A3C or A3D prior to assessing gemcitabine sensitivity (Extended Data Fig. 2g-i). We observed higher sensitivity to gemcitabine in A3C- and A3D-deficient hT81 and hT82 organoids (Fig. 2i,j), providing a complement to our cell line data.
Finally, as gemcitabine is frequently used in combination with nab-paclitaxel for PDAC treatment13, we asked whether A3C and A3D modulate PDAC cell sensitivity upon treatment with gemcitabine and nab-paclitaxel. Using a gemcitabine concentration that does not greatly sensitize PDAC cells lacking A3C and A3D and a nab-paclitaxel concentration that leads to a 2.3-fold increase in multinucleated cells (Extended Data Fig. 3a,b), we found that nab-paclitaxel sensitized A3C- and A3D-deficient PDAC cells and that combining nab-paclitaxel with gemcitabine further increased cell death (Fig. 2k). Hence, A3C and A3D also promote resistance to a current PDAC standard-of-care regimen, gemcitabine plus nab-paclitaxel.
A3C and A3D expression is induced by gemcitabine
A3D is expressed at low levels in PDAC cell lines (including HPAF-II and Panc 08.13), organoids, and tumors (Fig. 3a and Extended Data Fig. 4a). This prompted the question as to how we were observing gemcitabine hypersensitivity in A3D-deficient cells when A3D is expressed at minimal levels in PDAC. Interestingly, we found that A3D mRNA levels increase by 11.7- and 16.4-fold, and A3C mRNA levels by 35- and 30-fold following gemcitabine treatment of PDAC cells (Fig. 3b). By contrast, A3C and A3D are induced less than six-fold in non-transformed cells (Fig. 3b). The difference in A3C and A3D induction levels between PDAC and non-transformed cells could explain the PDAC-specific gemcitabine hypersensitivity we observe upon A3C or A3D loss.
Fig. 3. APOBEC3C and APOBEC3D expression regulation.

a, mRNA levels of A3C and A3D in pancreatic cancer cell lines and organoids from DepMap CCLE data (n = 55), and in pancreatic tumors from the ICGC PACA-CA and COMPASS trial cohorts (n = 430). Levels of A3C and A3D in HPAF-II and Panc 08.13 cells are highlighted. PGK1, housekeeping gene. b, Fold-change in A3C and A3D mRNA levels following 72 hours of 25 nM (HPNE-hTERT), 5 nM (HPDE), or 500 nM (HPAF-II, Panc 08.13, RPE1-hTERT-Cas9 p53−/−) gemcitabine treatment, measured by RT-qPCR analysis, and normalized to GAPDH or ACTB. Horizontal bars indicate the means (n = 3 independent RT-qPCR experiments). * p < 0.05 (HPDE A3C: 0.0237), ** p < 0.01 (Panc 08.13 A3C: 0.0022), and *** p < 0.001 (HPAF-II A3C: 0.0006, HPAF-II A3D: 0.0001, and Panc 08.13 A3D: 0.0001); two-tailed unpaired t-test. c, Scatterplots comparing mRNA levels of A3C and A3D in pancreatic tumors from ICGC PACA-CA and the COMPASS trial (n = 430) or from the TCGA-PAAD cohort (n = 183). Regression lines are plotted, and one-tailed Pearson’s coefficients and the corresponding p-values are indicated. d, Induction of A3C and A3D mRNA expression following 500 nM gemcitabine treatment for 72 hours in control (sgLacZ) and A3C- and A3D-deficient HPAF-II cells. Data were normalized to GAPDH levels, and fold-change in expression compared to untreated cells is plotted. n = 2 independent transductions and RT-qPCR experiments. Horizontal bars represent the means. e, HPAF-II-Cas9 cells transduced with sgLacZ, sgA3C, or sgA3D were treated with 500 nM gemcitabine for 72 hours, and levels of A3A and A3B mRNA were measured by RT-qPCR. Data were normalized to ACTB. n = 2 independent transductions and RT-qPCR experiments, where horizontal bars represent the means. f, Induction of A3C and A3D mRNA following treatment of HPAF-II cells with the indicated DNA damaging and replication stress-inducing agents for 72 hours. Expression was measured by RT-qPCR and normalized to ACTB mRNA. Data from n = 2 RT-qPCR experiments is plotted, with cytidine analogues indicated. Dashed lines indicate a fold-change of one. Horizontal bars indicate the means of the independent experiments. g, mRNA levels of A3A, A3B, A3C, and A3D following 24 hour treatment of HPAF-II cells with interferon β, analyzed by RT-qPCR. Data were normalized to ACTB expression, and the fold-change of each mRNA was determined by comparing to untreated cells. n = 3 independent RT-qPCR experiments. h, Fold-change in A3C and A3D mRNA levels following 72 hours of 500 nM gemcitabine treatment in HPAF-II cells transduced with sgAAVS1 (control), sgIRF3, sgSTAT1, sgSTAT2, or sgRELA. Expression levels were measured by RT-qPCR and normalized to ACTB. Horizontal bars represent the means (n = 3 independent transductions and RT-qPCR experiments). * p < 0.05, ** p < 0.01; two-tailed unpaired t-test.
Given that all seven human APOBEC3 genes reside on a single locus on chromosome 22, we investigated whether A3C and A3D expression is co-regulated. Analysis of mRNA expression levels in PDAC tumors revealed a correlation between A3C and A3D (Pearson’s r = 0.59 and 0.63 in ICGC/COMPASS and TCGA data; Fig. 3c) that in most cases is stronger than any other pairwise APOBEC3 comparison30 (Extended Data Fig. 4b). Moreover, we found that gemcitabine induction of A3C mRNA expression depends on A3D, and that the induction of A3D depends on A3C (Fig. 3d). As we find that A3A and A3B expression is also stimulated by gemcitabine (Fig. 3e), we tested whether A3C or A3D are necessary for the gemcitabine induction of A3A or A3B. Surprisingly, the induction of A3B, but not A3A, requires A3C or A3D (Fig. 3e), suggesting that A3B, A3C, and A3D might belong to an expression regulatory network.
Expression of APOBEC3 genes, especially A3A, A3F, and A3G, is stimulated by type I interferon in response to viral infection31–37. We tested whether the induction of A3C and A3D by gemcitabine is due to immune response activation. Although the innate immune response is activated by gemcitabine (Extended Data Fig. 5a), we found that treatment of PDAC cells with the type I interferon IFN-β induced A3C and A3D expression by less than three-fold (Fig. 3g and Extended Data Fig. 4c), contrasting with the 30- and 9-fold inductions we see for A3A and A3B. Consistent with this, inactivation of the transcription factor IRF3, a key stimulator of type I interferon production, resulted in no change in gemcitabine-induced A3C and A3D mRNA levels (Fig. 3h and Extended Data Fig. 4d), and disruption of additional transcription factors essential for interferon-stimulated gene expression, STAT1, STAT2, and RELA, only modestly reduced A3C and A3D mRNA levels (Fig. 3h and Extended Data Fig. 4e-g). Since A3C and A3D expression is not completely abrogated upon STAT1, STAT2, or RELA loss, we infer that gemcitabine induced A3C and A3D expression likely includes pathways that are distinct from those regulated by the innate immune response.
DNA damage and replication stress are important regulators of A3A, A3B, A3C, and A3G expression in cancer cells37–42, thus we tested whether A3C and A3D are transcriptionally upregulated by genotoxic agents in PDAC cells. We tested a panel of DNA damaging and replication stress-inducing agents, including cytidine analogues used in chemotherapeutic interventions and 5-fluorouracil, an agent used in the PDAC therapy FOLFIRINOX. None of the genotoxins induced A3C or A3D expression as strongly as gemcitabine (Fig. 3f and Extended Data Fig. 4h,i). Induction of A3C expression by other genotoxins was at least five-fold less than with gemcitabine in the PDAC cell lines tested. Induction of A3D was similarly modest, except in Panc 08.13 cells where cytarabine, hydroxyurea, and camptothecin promoted strong upregulation. Taken together, our data suggest that the induction of A3C and A3D expression by gemcitabine is coordinated, has innate immune response-dependent and -independent contributions, is stronger in PDAC cells than in non-transformed cells, and is generally specific to gemcitabine.
A3C and A3D are not required for innate immune signaling in gemcitabine
Since replication stress induces DNA release into the cytoplasm4, and A3A mediates cytosolic DNA removal33, we hypothesized that A3C and A3D could function in removing cytosolic single-stranded DNA (ssDNA) following gemcitabine treatment, dampening the immune response to ensure cell viability. We assessed whether cytoplasmic DNA was present upon gemcitabine treatment and found that gemcitabine led to an increase in cytosolic ssDNA (Fig. 4a,b). However, A3C- and A3D-deficient cells showed no change in cytosolic ssDNA compared to wildtype cells, indicating that A3C and A3D are not involved in the clearance of cytosolic ssDNA. We confirmed that A3C and A3D are not required for innate immune signaling during or following gemcitabine treatment by immunoblotting for phosphoSTAT1 Tyr701 (Fig. 4c), a marker of innate immune response activation, through use of an interferon-activated reporter cell line (Fig. 4d), and by assessing the expression of interferon-stimulated genes (Extended Data Fig. 5b). No differences in immune response activation between wildtype and A3C- and A3D-deficient cells were evident. Together, these data indicate that A3C and A3D are not protecting PDAC cells from gemcitabine by dampening innate immune signaling through the removal of cytosolic DNA.
Fig. 4. APOBEC3C and APOBEC3D promote DNA replication stress resistance independent of their roles in innate immunity.

a, Quantification of mean fluorescence intensity of cytosolic ssDNA in HPAF-II-Cas9 cells transduced with a sgRNA targeting LacZ (control), A3C, or A3D, following treatment with 1 µM gemcitabine for 72 hours. Cells were quantified for untreated (n = 207 (wildtype), n = 208 (A3C-deficient), n = 202 (A3D-deficient)) and gemcitabine ((n = 274 (wildtype), n = 210 (A3C-deficient), n = 212 (A3D-deficient)) conditions. n = 3 independent transductions and immunostainings. Statistical support was assessed using a two-tailed unpaired Mann-Whitney U test. n.s., not significant (p > 0.05). b, Representative micrographs showing cytosolic ssDNA following 1 µM gemcitabine treatment for 72 hours from the immunostainings from panel a. Scale bars, 10 µm. c, Immunoblot analysis of phosphoSTAT1 Tyr701, a marker of innate immune response activation, in HPAF-II-Cas9 cells transduced with sgLacZ, sgA3C, or sgA3D. Cells were treated with 1 µM gemcitabine for 24 hours and recovered for 0, 24, 48, or 72 hours prior to assessing activation of the innate immune response. α-Tubulin was used as a loading control. Data is representative of n = 3 independent immunoblots. d, Degree of type I interferon response activation in HPAF-II-Cas9 cells transduced with sgLacZ, sgA3C, sgA3D, or sgTREX1 treated with 0 or 500 nM gemcitabine and recovered for 0 or 72 hours in drug-free media. Supernatant was collected from cells following the indicated treatment and recovery periods, co-incubated with the type I interferon reporter cell line HEK-Blue IFN α/β for 24 hours and used to assess the relative amounts of type I interferon produced. Inactivation of TREX1 served as a positive control for type I interferon response activation. Horizontal bars indicate the means (n = 3 independent transductions and type I interferon reporter assays). Statistical support was evaluated using a two-tailed unpaired t-test. n.s., not significant (p > 0.05).
A3C and A3D confer gemcitabine resistance by deaminating nuclear cytidines
Alternatively, A3C and A3D could deaminate cytidines in nuclear ssDNA exposed during gemcitabine treatment to initiate an effective replication stress response, promote the restart of gemcitabine-stalled replication forks, and resolve DNA damage. Given that gemcitabine is a deoxycytidine analogue, it is also plausible that A3C and A3D deaminate gemcitabine bases, thereby inactivating or removing the drug to promote cell survival. We first tested whether the deaminase functions of A3C and A3D are required to protect PDAC cells from gemcitabine. We generated doxycycline-inducible cell lines to express wildtype or deaminase-dead mutants of A3C or A3D in A3C- and A3D-deficient HPAF-II cells and assessed gemcitabine sensitivity. Expression of each wildtype gene, but not the deaminase-dead mutants, rescued gemcitabine sensitivity to basal levels (Fig. 5a). Interestingly, expression of A3C did not completely rescue the gemcitabine hypersensitivity of A3D-deficient cells, and A3D did not completely rescue the sensitivity of A3C-deficient cells, indicating non-redundant roles in replication stress resistance. Finally, as A3A is strongly upregulated upon gemcitabine, we tested whether A3A expression could rescue the gemcitabine hypersensitivity of A3C- and A3D-deficient cells. A3A failed to rescue gemcitabine sensitivity of either knockout (Fig. 5a), which we confirmed was not confounded by cellular toxicity due to A3A expression. Thus, A3C and A3D are responsible for the gemcitabine resistance we observe, and transcriptional activation of A3A in response to gemcitabine does not correlate with gemcitabine resistance.
Fig. 5. APOBEC3C and APOBEC3D confer DNA replication stress resistance by genomic cytidine deamination.

a, Quantification of colony formation of A3C- and A3D-deficient HPAF-II cells engineered to stably express doxycycline-inducible A3A, A3C, or A3D, the indicated deaminase-dead mutants of A3C or A3D, or carrying the empty vector. Cells were treated with 5 nM gemcitabine for three days and propagated in drug-free media for 11 days before colonies were stained, counted, and normalized to untreated cells. n = 3 independent clonogenic survival assays. Horizontal bars indicate the means. * p < 0.05 (HPAF-II A3CKO + A3D: 0.0175), ** p < 0.01 (HPAF-II A3DKO + A3C: 0.0013), and *** p < 0.001 (HPAF-II A3CKO + A3C: 0.0001 and HPAF-II A3DKO + A3D: 0.0001); two-tailed unpaired t-test. b,c, In vitro cytidine deaminase assays with the indicated concentrations of wildtype or deaminase dead (C97S/C100S) A3C (panel b), or A3A (panel c) with ssDNA substrate containing deoxycytidine (dC) or gemcitabine (dFdC). n = 3 independent in vitro assays, with representative gel images shown on the right. d, Quantification of deaminated gemcitabine nucleosides (dFdU) in genomic DNA isolated from HPAF-II cells by liquid chromatography coupled to mass spectrometry (LC/MS) following 500 nM or 1 µM gemcitabine treatment for 24 or 72 hours. n = 3 independent experiments. Horizontal bars represent the means. e-g, Quantification of intracellular gemcitabine nucleosides (dFdC, dFdU, and dFdCTP) from parental or A3C- or A3D-deficient HPAF-II cells treated with 500 nM gemcitabine for 4 or 24 hours by LC/MS. Horizontal bars indicate the means (n = 3 independent experiments). Statistical support was evaluated using a two-tailed unpaired t-test. n.s., not significant (p > 0.05). h, Quantification of uracils in genomic DNA isolated from UNG-deficient HPAF-II cells by dot blot analysis following 1 µM gemcitabine treatment for 72 hours. n = 3 independent experiments. Horizontal bars indicate the means and error bars indicate the standard deviations. A two-tailed unpaired t-test was used to determine statistical support.
Since the deaminase activities of A3C and A3D are required for gemcitabine resistance, we tested whether A3C and A3D can deaminate gemcitabine (dFdC) bases in ssDNA substrates in vitro. We expressed and purified recombinant A3A, A3C, and deaminase-dead A3C C97S/C100S (Extended Data Fig. 6a) and quantified cytidine deaminase activity (Extended Data Fig. 6b). Although A3C effectively deaminates cytidines in ssDNA, it does not have detectable activity on dFdC (Fig. 5b and Extended Data Fig. 6c). By contrast, A3A is highly active on gemcitabine bases in ssDNA (Fig. 5c), likely due to the more open active site in A3A23,43–45. These data are consistent with A3C and A3D deaminating cytidine bases in ssDNA exposed by gemcitabine-induced replication stress and argue against models where gemcitabine bases are deaminated.
To complement our biochemical analyses, we assessed whether deaminated gemcitabine bases (dFdU) are present in the genome of gemcitabine treated PDAC cells, as would be expected if dFdC is deaminated after incorporation into DNA (Extended Data Fig. 7a). Using liquid chromatography-tandem mass spectrometry (LC-MS/MS), we were unable to detect dFdU in genomic DNA isolated from gemcitabine-treated cells using a method capable of detecting dFdU at a limit of detection of 6.2 ng/mL (Fig. 5d and Extended Data Fig. 7b). By contrast, dFdC was readily detected in the genome of cells treated with gemcitabine, and disruption of A3C or A3D had no effect on the levels of dFdC in nuclear DNA (Extended Data Fig. 7c). Thus, we conclude that gemcitabine nucleosides incorporated into the genome are not deaminated by A3C or A3D at a substantial level.
The efficacy of gemcitabine is limited by the deamination of intracellular dFdC nucleosides to yield dFdU, typically by the cytidine deaminase CDA46,47. Structural and biochemical data indicate that cytidine deamination by the APOBEC3 proteins occurs primarily in the context of ssDNA and RNA48. However, to exclude the possibility that A3C and A3D are deaminating dFdC bases before incorporation into DNA, we quantified the intracellular levels of deoxycytidine and gemcitabine nucleosides in PDAC cells (Extended Data Fig. 7a). Levels of free dFdC, dFdU, dFdCTP, and other deoxycytidine and gemcitabine metabolites were similar between parental and A3C- and A3D-deficient cell lines (Fig. 5e-g and Extended Data Fig. 7d-j), demonstrating that all cell lines take up similar amounts of gemcitabine and convert it to the triphosphate form, and that A3C and A3D do not deaminate gemcitabine nucleosides prior to incorporation into DNA. Our data argue against models where A3C and A3D deaminate gemcitabine bases, either in ssDNA or as nucleosides, to promote therapeutic resistance and cell survival.
Given that A3C or A3D inactivation did not alter the levels of deoxycytidine and deoxyuridine metabolites (Extended Data Fig. 7d-f, h-j), it is probable that A3C and A3D act on cytidines in nuclear ssDNA produced in response to gemcitabine. We assessed uracil levels in genomic DNA using the ΔUNG uracil sensor49. Since uracils are rapidly excised by UNG, we inactivated UNG in HPAF-II cells to allow for improved uracil detection (Extended Data Fig. 7k). We observed a 4-fold increase in genomic uracil content upon gemcitabine treatment (Fig. 5h), indicating the action of cytidine deaminases on nuclear DNA.
A3C and A3D promote DNA replication and replication fork re-start in gemcitabine
To define the mechanisms by which A3C and A3D promote PDAC cell survival, we measured the effects of A3C and A3D on the replication stress and genome instability induced by gemcitabine. Immunoblot and flow cytometric analysis of RPA2 in A3C- and A3D-deficient PDAC cells following gemcitabine treatment revealed increased phosphoRPA2 levels (Extended Data Fig. 8a) and increased abundance of chromatin-bound RPA2 in S phase cells (Fig. 6a and Extended Data Fig. 8b), indicating increased ssDNA and replication stress. By contrast, RPE1-hTERT p53-/ - cells showed no increase in replication stress upon A3C or A3D depletion (Extended Data Fig. 8c-e). We also find an increase in chromatin-bound 53BP1 in A3C- and A3D-deficient PDAC cells in G1, indicative of unresolved replication stress from the previous cell cycle (Fig. 6b and Extended Data Fig. 8f,g). Moreover, micronuclei increased by 3.3-fold in HPAF-II cells upon gemcitabine treatment and increased further upon A3C or A3D loss (Fig. 6c), consistent with A3C and A3D relieving replication stress in PDAC cells treated with gemcitabine.
Fig. 6. Cytidine deamination by APOBEC3C and APOBEC3D promotes DNA replication fork re-start and repair in gemcitabine conditions.

a, Quantification of chromatin-bound RPA2 fluorescence intensity in S phase cells. Parental and A3C- and A3D-deficient HPAF-II cells were treated with 0 or 1 µM gemcitabine for 24 hours prior to flow cytometric analysis of EdU content and chromatin-bound RPA2. Untreated: n = 4291 (parental), n = 3314 (A3C-deficient), n = 3579 (A3D-deficient). Gemcitabine: n = 9161 (parental), n = 9014 (A3C-deficient), n = 8317 (A3D-deficient). Data is representative of n = 3 independent experiments. Statistical support was assessed using a two-tailed unpaired Mann-Whitney U test. b, Analysis of fluorescence intensity of chromatin-bound 53BP1 in G1 HPAF-II cells (EdU-negative 1C DNA content cells) following 24 hour treatment with 1 µM gemcitabine. Untreated: n = 11607 (parental), n = 11956 (A3C-deficient), n = 13691 (A3D-deficient). Gemcitabine: n = 3953 (parental), n = 6628 (A3C-deficient), n = 2907 (A3D-deficient). Data is representative of n = 3 independent experiments. Two-tailed unpaired Mann-Whitney U tests were used to determine statistical support. Center lines represent the median and box limits indicate the 25th and 75th percentiles of each sample. Whiskers extend 1.5x the interquartile range and individual data points indicate outliers in a,b. c, Quantification of micronuclei in HPAF-II-Cas9 cells transduced with sgAAVS1 (control), sgA3C, or sgA3D and treated with 0 or 1 µM gemcitabine for 72 hours. Untreated: n = 978 (wildtype), n = 987 (A3C-deficient), n = 1003 (A3D-deficient). Gemcitabine: n = 942 (wildtype), n = 922 (A3C-deficient), n = 923 (A3D-deficient). A minimum of 303 cells were quantified per sample in each experiment (n = 3 independent transductions and micronuclei counts). Horizontal bars indicate the means. Representative micrographs are shown on the right, with micronuclei labeled with arrowheads. Scale bar, 10 µm. * p < 0.05 (A3CKO: 0.0159 and A3DKO: 0.0397) and *** p < 0.001 (A3CKO + gem: 0.0001 and A3DKO + gem: 0.0006); two-tailed unpaired t-test. d, Quantification of EdU fluorescence intensity in parental and A3C- and A3D-deficient HPAF-II cells following treatment with 0 or 1 µM gemcitabine for 24 hours. Untreated: n = 8606 (parental), n = 7059 (A3C-deficient), and n = 7400 (A3D-deficient). Gemcitabine: n = 15280 (parental), n = 16794 (A3C-deficient), and n = 20858 (A3D-deficient). Data is representative of n = 3 independent experiments. Statistical support was assessed using a two-tailed unpaired Mann-Whitney U test. Center lines represent the median and box limits indicate the 25th and 75th percentiles. Whiskers extend 1.5x the interquartile range and individual data points indicate outliers. e, DNA combing analysis of parental and A3C- and A3D-deficient HPAF-II cells. Cells were pulsed with CldU for 30 minutes, followed by a pulse with IdU for 30 minutes in the presence or absence of 1 µM gemcitabine. Untreated: n = 599 (parental), n = 614 (A3C-deficient), n = 443 (A3D-deficient). Gemcitabine: n = 438 (parental), n = 361 (A3C-deficient), n = 352 (A3D-deficient). A minimum of 169 replication tracks were analyzed per experiment (n = 2 independent DNA combing experiments). Horizontal bars indicate the means. Statistical support was assessed with a two-tailed unpaired Mann-Whitney U test. *** p < 0.001. f, Percentage of stalled replication forks in the DNA combing experiments from panel e, with representative images of stalled replication forks shown. CldU tracks with no adjacent IdU label or with a single pixel of IdU were categorized as stalled replication forks. Greater than 300 replication tracks were analyzed per sample for each of the two independent DNA combing experiments. Horizontal bars indicate the means. g, Replication fork re-start assay in parental and A3C- and A3D-deficient HPAF-II cells. Cells were pulsed with CldU for 30 minutes, followed by treatment with 1 µM gemcitabine for 30 minutes and a 30 minute IdU pulse in drug-free media to assess the ability of replication forks to re-start DNA synthesis. The percentage of elongated and stalled replication forks after gemcitabine recovery is plotted. n = 1798 (parental), n = 1516 (A3C-deficient), n = 1724 (A3D-deficient) replication tracks, with a minimum of 229 replication tracks analyzed per sample for each experiment (n = 2 independent replication fork re-start assays). * p < 0.05 (A3CKO: 0.0244 and A3DKO: 0.0296); two-tailed unpaired t-test. h, Colony formation of HPAF-II-Cas9 cells transduced with sgLacZ or sgUNG. Cells were treated with 10 nM gemcitabine for three days and propagated in drug-free media for 11 days before colonies were stained and counted. n = 3 independent transductions and clonogenic survival assays, with representative micrographs shown. Horizontal bars indicate the means. * p = 0.0224; two-tailed unpaired t-test. i, Analysis of RAD51 foci in parental and A3C- and A3D-deficient HPAF-II cells following 1 µM gemcitabine treatment for 24 hours. The number of RAD51 foci per S phase cell are plotted, where circles with black outlines indicate the median of each experiment and black bars represent the median and first and last quartiles of all three independent immunostainings. Untreated: n = 1443 (parental), n = 2544 (A3C-deficient), n = 1480 (A3D-deficient), n = 1414 (A3C- and A3D-deficient). Gemcitabine: n = 974 (parental), n = 2218 (A3C-deficient), n = 1625 (A3D-deficient), n = 913 (A3C- and A3D-deficient). Greater than 205 cells were analyzed per sample for each independent experiment. Statistical support was assessed with a two-tailed unpaired Mann-Whitney U test. *** p < 0.001. n.s., not significant (p > 0.05). j, Viability of HPAF-II-Cas9 cells transduced with sgAAVS1 or sgPOLH and treated with the indicated gemcitabine concentrations for seven days. CellTiter-Glo was used to measure cell viability. n = 3 independent transductions and cell viability experiments. Circles indicate the means and error bars represent the standard deviations. k, Replication fork re-start assay in wildtype and POLH-deficient HPAF-II cells. Cells were pulsed with CldU for 30 minutes, followed by treatment with 1 µM gemcitabine for 30 minutes and a 30 minute IdU pulse in the presence or absence of 5 µM JH-RE-06. n = 1014 (wildtype), n = 1616 (POLH-1-deficient), n = 1866 (POLH-2-deficient), and n = 1700 (JH-RE-06-treated) replication tracks were quantified, with a minimum of 229 replication tracks analyzed per sample for each experiment (n = 3 independent transductions and replication fork re-start assays). Percentage of elongated and stalled replication forks following gemcitabine recovery is plotted. * p < 0.05 (sgPOLH-1: 0.0271) and ** p < 0.01 (sgPOLH-2: 0.005 and JH-RE-06: 0.0073); two-tailed unpaired t-test.
Flow cytometric analysis indicated that S phase could be defective in A3C- and A3D-deficient PDAC cells as there were fewer cells in S phase (Extended Data Fig. 8h,i). A3C- and A3D-deficient cells show reduced DNA synthesis relative to parental cells, indicating that A3C and A3D are important for DNA replication when replication stress is induced by gemcitabine (Fig. 6d and Extended Data Fig. 8h,i). We directly tested whether A3C and A3D influence DNA replication fork rate by measuring DNA synthesis on individual DNA fibers (Fig. 6e). The absence of A3C or A3D reduced replication fork rate by 17–20% in PDAC and RPE1-hTERT p53-/ - cells (Fig. 6e and Extended Data Fig. 8j), indicating that A3C and A3D have roles in unperturbed DNA replication. In gemcitabine conditions, we found both a reduction in replication fork rate (Fig. 6e) and a two-fold increase in stalled replication forks (Fig. 6f) in A3C- and A3D-deficient PDAC cells. We next modified the DNA combing experiment to measure the recovery of gemcitabine-stalled replication forks (Fig. 6g). We found that A3C and A3D are indeed involved in promoting replication fork re-start as 83.5% or 82.2% of replication forks remained stalled in the absence of A3C or A3D compared to 60.7% in parental PDAC cells (Fig. 6g). Parallel experiments in RPE1-hTERT p53-/ - cells revealed no differences in replication fork re-start upon A3C or A3D depletion (Extended Data Fig. 8k), highlighting the heightened requirement for A3C and A3D in PDAC cells. Our data reveal a striking importance for A3C and A3D in maintaining DNA synthesis capacity during gemcitabine treatment.
In addition to directly stalling DNA replication forks, gemcitabine depletes dNTP pools by inhibiting ribonucleotide reductase, which is evident in our measurements of intracellular dCTP (Extended Data Fig. 7i). We found that A3C and A3D knockouts have no detectable effects on intracellular dCTP levels (Extended Data Fig. 7i) and that A3C or A3D deficiency does not sensitize cells to the ribonucleotide reductase inhibitor hydroxyurea (Extended Data Fig. 7l). Therefore, we favor a model where ssDNA exposed by gemcitabine-induced replication stress provides a substrate for deamination of cytidines by A3C and A3D. Cytidine deamination promotes DNA synthesis and recovery of gemcitabine-stalled replication forks, resulting in increased PDAC cell survival.
Base excision, RAD51, and translesion synthesis promote recovery of gemcitabine-stalled replication forks
We next sought to define the mechanism by which genome deamination by A3C and A3D promotes gemcitabine resistance in PDAC. The base excision repair (BER) pathway can act downstream of APOBEC3-catalyzed cytidine deamination19 and is a key determinant of the type of mutational signature generated by APOBEC3 proteins in cancer genomes24. Analysis of our gemcitabine CRISPR-Cas9 screen data revealed that disruption of the uracil DNA glycosylase UNG promotes gemcitabine hypersensitivity, whereas inactivation of HMCES, which encodes a protein that protects abasic sites50, does not. We validated the roles of UNG and HMCES in gemcitabine resistance using individual sgRNAs targeting each gene (Fig. 6h and Extended Data Fig. 9a,b). Generation of abasic sites by UNG is important for gemcitabine resistance, whereas the protection of abasic site products by HMCES is not. Inactivation of HMCES does not impact replication fork re-start in gemcitabine (Extended Data Fig. 9c), further indicating that abasic site protection is not important for replication fork re-start promoted by A3C and A3D.
We envision several ways in which abasic sites could promote replication fork re-start. Abasic sites could proceed through canonical BER to resolve replication stress. However, we found that disruption of other BER genes SMUG1, APEX1, and APEX2 does not confer gemcitabine hypersensitivity (Extended Data Fig. 9d). Unshielded abasic sites could be subject to nuclease action, resulting in the formation of double-stranded DNA breaks that promote recombination-mediated replication fork re-start. However, foci of 53BP1 in S phase cells, a marker of double-strand breaks, remain unaffected by the loss of A3C or A3D (Extended Data Fig. 9h), suggesting that replication fork re-start by A3C and A3D is not proceeding through a double-strand break repair pathway. Stalled replication forks can also be re-started by the RAD51 recombinase by replication fork reversal51. RAD51 foci increase in S phase cells during gemcitabine treatment and the increase depends partially on A3C and A3D (Fig. 6i and Extended Data Fig. 9e,f). Inducing double-stranded DNA breaks with mitomycin C does not similarly reduce RAD51 focus formation in S phase cells upon A3C or A3D inactivation (Extended Data Fig. 9g), indicating that A3C and A3D likely do not harbor general roles in activating RAD51. These data are consistent with RAD51 playing a role in the re-start of gemcitabine-stalled replication forks in concert with A3C and A3D, and independent of double-stranded DNA breaks. Finally, since unshielded abasic sites promote recruitment of translesion synthesis (TLS) polymerases52, abasic sites could promote extension of the gemcitabine-stalled nascent DNA strand to re-start DNA replication. Consistent with this model, DNA polymerase η can extend 3’ DNA termini arrested by gemcitabine53 and inactivation of POLH in our gemcitabine CRISPR-Cas9 screens promotes gemcitabine hypersensitivity. We validated the role of POLH in gemcitabine resistance in cell viability assays (Fig. 6j and Extended Data Fig. 9i). Furthermore, analysis of replication fork re-start in POLH-deficient cells and in cells treated with the TLS inhibitor JH-RE-06 following gemcitabine treatment revealed persistent stalled replication forks (Fig. 6k), similar to our observations in A3C- and A3D-deficient cells (Fig. 6g). We conclude that the generation of abasic sites following deamination by A3C and A3D provides substrates for RAD51- and TLS-mediated replication fork re-start to promote recovery from and resistance to gemcitabine.
A3C and A3D mediate gemcitabine resistance in PDAC xenograft models
To explore whether A3C or A3D inactivation inhibits tumor growth upon gemcitabine treatment, we established tumors from parental and A3C- and A3D-deficient HPAF-II cells in NOD SCID mice and measured tumor volume following treatment with gemcitabine or vehicle. The absence of A3C led to a reduction in tumor growth that was further exacerbated upon gemcitabine treatment (Fig. 7a). Importantly, the combination of A3C- or A3D-deficiency with gemcitabine inhibited tumor growth more dramatically than either gene disruption or gemcitabine alone (Fig. 7a,b). Thus, the chemical-genetic interaction between A3C or A3D and gemcitabine that we observe in PDAC cell lines and organoids is recapitulated in an in vivo setting. Together, our data indicate that A3C or A3D loss enhances the vulnerability of PDAC tumors to gemcitabine and that A3C and A3D could therefore represent attractive therapeutic targets.
Fig. 7. APOBEC3C and APOBEC3D contribute to cell survival following therapeutic replication stress in pancreatic cancer cells.

a,b, Growth of tumor xenografts of parental and A3C- (panel a) or A3D-deficient (panel b) HPAF-II cells in NOD SCID mice treated with either gemcitabine or vehicle. Mice were treated with 50 mg/kg (panel a) or 75 mg/kg (panel b) gemcitabine intraperitoneally once a week for the duration of the experiments. Data are presented as mean tumor volume, with error bars representing the standard error of the mean. n = 8 mice per experimental group, except for A3C-deficient tumors treated with gemcitabine (n = 9). Statistical support was determined by a linear mixed-effects model with Geisser-Greenhouse correction. c, Model of how A3C and A3D contribute to promoting DNA replication stress resistance to gemcitabine in pancreatic cancer cells. A3C and A3D mRNA expression is transcriptionally induced by gemcitabine and the preferred substrate for APOBEC3 enzymes, ssDNA, is exposed at DNA replication forks due to the replication stress caused by gemcitabine. A3C and A3D likely deaminate deoxycytidines to deoxyuridine in the exposed ssDNA. Uracil bases are then removed by uracil DNA glycosylase (UNG), leaving abasic sites. Exposed abasic sites could subsequently recruit translesion synthesis (TLS) polymerases and RAD51 to sites of cytidine deamination to promote replication fork re-start, ultimately increasing cell survival following gemcitabine-induced replication stress.
Discussion
As we enter the realm of precision medicine, understanding the cellular response to therapies becomes increasingly important in predicting tumor response to treatment and ensuring optimal patient selection. Gemcitabine is the foundation of regimens used for different cancer types and remains an attractive choice for novel combination therapies with replication stress-inducing agents. Using chemical-genetic CRISPR-Cas9 screens with gemcitabine, we identified modulators of gemcitabine sensitivity in PDAC. Our finding that inactivation of A3C or A3D causes gemcitabine hypersensitivity across different PDAC backgrounds was particularly striking as there is little evidence implicating A3C or A3D in the replication stress response. Furthermore, the APOBEC3 paradigm, derived largely from analysis of A3A and A3B in overexpression contexts, is that APOBEC3 proteins drive genome mutagenesis and evolution in tumors. By contrast, we find that A3C and A3D protect cells from gemcitabine-induced DNA damage and replication stress. We provide evidence that A3C and A3D contribute to PDAC cell survival by promoting DNA replication and re-starting stalled replication forks to mitigate the replication stress caused by gemcitabine. We find that cytidine deamination by A3C and A3D, removal of uracil bases by UNG, and the action of the TLS DNA polymerase η are important to overcome the DNA replication fork stalling and cell death caused by gemcitabine. We propose a model (Fig. 7c) where gemcitabine treatment of PDAC cells arrests DNA replication forks, causing the formation of ectopic ssDNA, and transcriptionally induces A3C and A3D. Deamination of the exposed ssDNA by A3C and A3D results in abasic sites that promote recruitment of DNA polymerase η, which extends the gemcitabine-terminated DNA strands to re-start stalled replication forks. The exact mode by which abasic sites in the template DNA strand promote TLS polymerase action remains unclear, and it is likely that additional DNA repair activities contribute to gemcitabine resistance.
Our study highlights the intimate relationships between A3C and A3D. Connections between A3C and A3D function have emerged as data from large-scale genetic and proteomic analyses become increasingly available. Not only is expression of A3C and A3D at the mRNA level correlated across PDAC tumors30 (Fig. 3c and Extended Data Fig. 4b), but A3C was identified in AP-MS analysis of A3D54, suggesting that the two APOBEC3 proteins work collaboratively in cells. The relationship between A3C and A3D appears to be more robust than the relationship either APOBEC3 has with other APOBEC3 family members, highlighted by the unique roles of A3C and A3D in gemcitabine resistance (Fig. 2c), the reciprocal dependency for transcriptional induction (Fig. 3d), the similarity of A3C and A3D transcriptional induction profiles (Fig. 3f), and the partial reciprocal rescues of A3C and A3D knockouts (Fig. 5a). Together, these observations indicate intertwined yet non-redundant functions for A3C and A3D.
Despite evidence that A3D is localized to the cytoplasm55–57, our data indicate that both A3C and A3D have access to nuclear DNA and promote DNA replication (Fig. 6e and Extended Data Fig. 8j). Certain A3D splice variants encode truncated A3D proteins that localize to the nucleus and have the capacity to mutate DNA57, which could account for the nuclear activities we observe. Mining datasets from AP-MS studies revealed that A3D interacts with A3B54, which is the only APOBEC3 with constitutive nuclear localization, and that A3C interacts with DNA replication and repair proteins, including MCM2, MCM5, PARP1, FEN1, RAD18, RECQL, HMCES, XPC, BLM, Ku70, and Ku8058, many of which localize exclusively to the nucleus and function in S phase. Thus, diverse data indicate nuclear functions for A3C and A3D.
Of particular significance, we find that the DNA replication functions of A3C and A3D are important in gemcitabine treated PDAC cells. During gemcitabine-induced stress, PDAC cells lacking A3C or A3D have reduced DNA synthesis and slower replication fork rates (Fig. 6d,e), increased replication fork stalling (Fig. 6f), and fail to re-start stalled replication forks (Fig. 6g). These phenotypes correlate with the poor viability of A3C- and A3D-deficient PDAC cells, providing a plausible mechanism for the protective roles of A3C and A3D in gemcitabine stressed PDAC cells. The roles of A3C and A3D in gemcitabine resistance are not unique to cell lines, as we see the same protective roles in PDAC organoids (Fig. 2i,j) and in PDAC xenograft tumor models (Fig. 7a,b). Importantly, disruption of A3C or A3D had no effect in RPE1-hTERT, HPNE-hTERT, or HPDE cells (Fig. 1f, 2d-h and Extended Data Fig. 2a), indicating that non-transformed cells do not harbor the heightened requirement for A3C or A3D function observed in PDAC cells. The basis for the absence of a chemical-genetic interaction between A3C or A3D and gemcitabine in non-transformed cells is quite clear, as neither gene is strongly induced by gemcitabine in these cell lines (Fig. 3b) and gemcitabine-induced replication stress is not increased upon A3C or A3D loss in RPE1-hTERT cells (Extended Data Fig. 8c-e,j,k). We find that the key cancer genome mutator A3A cannot fulfill the gemcitabine resistance roles of A3C and A3D, despite A3A expression being greatly upregulated by gemcitabine in PDAC cells (Fig. 3e), and expression of A3A does not rescue the gemcitabine sensitivity of A3C- or A3D-deficient PDAC cells (Fig. 5a). The molecular basis of the APOBEC3 specificity is currently unclear, but it is evident that the different APOBEC3 proteins have distinct functions, intracellular localization, and expression regulation, as well as preferred DNA substrates and substrate contexts48. The mechanisms by which A3C and A3D preferentially promote gemcitabine resistance is a compelling area for future study.
Genome mutagenesis by A3A or A3B drives tyrosine kinase inhibitor resistance during tumor evolution in lung cancers25,27. Similarly, A3B mutagenesis can cause tamoxifen resistance in ER+ breast cancer models26. Enhanced tumor evolution driven by APOBEC3 mutagenesis is consistent with high expression levels of A3A, A3B, A3C, and A3G causing DNA replication defects21,59 and genome instability21,22,30,59,60, indicating that excess APOBEC3 expression is deleterious. In the context of replication stress induced by gemcitabine in PDAC cells, we find that A3C and A3D reduce DNA damage and gemcitabine sensitivity as an acute phenomenon occurring at the level of stalled DNA replication forks, independent of the longer time scales required for mutation-induced tumor evolution. From a therapeutic standpoint, the protection against gemcitabine conferred by A3C and A3D is highly undesirable, providing a unique rationale for inhibiting A3C and A3D in combination with gemcitabine treatment. Given that A3C disruption reduces PDAC tumor growth to a similar extent as gemcitabine-treated parental tumors (Fig. 7a), A3C inhibition alone could represent an attractive therapeutic strategy for PDAC. In addition, broader inhibition of APOBEC3 deamination would be expected to reduce mutagenesis, slow tumor evolution, and delay the emergence of therapy-resistant tumor cells.
In summary, we identify functions for A3C and A3D in genome deamination to promote DNA replication and cell survival during the replication stress response to gemcitabine. The functions of A3C and A3D are important specifically in the cancer context, suggesting that targeting either protein will enhance the efficacy of gemcitabine in PDAC cells.
Methods
Our research complies with all relevant ethical regulations. Animal experiments were carried out following the guidelines of the Canadian Council on Animal Care with the approved Animal Resources Centre protocol 5555.
Cell culture
HPAF-II and HEK293T cells were grown in Dulbecco’s modified Eagle’s medium (DMEM; Wisent) with 10% fetal bovine serum (FBS) and 1% penicillin/streptomycin. Panc 08.13 and Panc 10.05 cells were maintained in RPMI-1640 (Wisent) with 15% FBS, 10 μg/mL insulin, and 1% penicillin/streptomycin. BxPC-3 and AsPC-1 cells were propagated in RPMI-1640 with 10% FBS and 1% penicillin/streptomycin. HPDE cells were cultured in keratinocyte-serum free media (ThermoFisher) with 50 μg/mL bovine pituitary extract, 0.5 ng/mL epidermal growth factor, and 1% penicillin/streptomycin. HPNE-hTERT cells were grown in DMEM with low glucose and sodium pyruvate (ThermoFisher) with 10 ng/mL human EGF, 1.5 g/L sodium bicarbonate, 10% FBS, and 1% penicillin/streptomycin. RPE1-hTERT-Cas9 p53−/− cells were grown in DMEM/F-12 (Wisent) with 10% FBS and 1% penicillin/streptomycin. HEK-Blue IFN-α/β reporter cells were maintained in DMEM with 10% FBS, 1% penicillin/streptomycin, 30 μg/mL blasticidin, 100 μg/mL zeocin, and 100 μg/mL normocin. L-Wnt3A cells were grown in DMEM with 10% FBS, 1% penicillin/streptomycin, and 400 µg/mL G418. HEK293T HA-R-spondin1-Fc cells were maintained in advanced DMEM/F-12 (ThermoFisher) with 10% FBS, 1% penicillin/streptomycin, and 300 µg/mL zeocin. Human and mouse cell lines were grown at 37°C and 5% CO2 and were routinely monitored to ensure the absence of Mycoplasma contamination using MycoAlert PLUS (Lonza). Parental human cell lines were authenticated by short tandem repeat profiling. Sf9 and Hi5 insect cells were grown at 27°C in ambient CO2 with shaking at 120 rpm. Sf9 cells were cultured in Hyclone SFX medium (Cytiva). Hi5 cells were cultured in ESF 921 medium (Expression Systems).
Pancreatic cancer organoid culture
Patient-derived pancreatic cancer organoids, hT81 and hT82, were generated as previously described61. Organoids were plated in growth factor reduced Matrigel basement membrane matrix (Corning) and grown in advanced DMEM/F-12 with 10 mM HEPES, 1x GlutaMAX, 100 ng/mL mNoggin, 50 ng/mL human EGF, 100 ng/mL human FGF-10, 10 nM human gastrin I, 500 nM A 83–01, 1x B-27 supplement, 10 mM nicotinamide, 1.25 mM N-acetylcysteine, 100 μg/mL primocin, 10% (v/v) R-spondin1 conditioned media, and 50% (v/v) Wnt3A-conditioned media containing 10% FBS at 37°C and 5% CO2. L-Wnt3A cells were used to prepare Wnt3A-conditioned media, and HEK293T HA-R-spondin1-Fc cells were used to generate R-spondin1 conditioned media for organoid culture.
Plasmids
For genome editing, sgRNAs were cloned into lentiGuide-puro (Addgene #52963), lentiCRISPRv2 (Addgene #52961), lentiCRISPRv2 hygro (Addgene #98291), lentiCRISPRv2 blast (Addgene #98293), or into a modified form of lentiCRISPRv2 in which the Cas9 sequence was replaced with NLS-eGFP or -mCherry (lentiGuide-NLS-eGFP and lentiGuide-NLS-mCherry respectively62). The sgRNA sequences are in Supplementary Table 2. Lenti-Cas9–2A-Blast (Addgene #73310) was used to generate stable FLAG-Cas9-expressing cell lines and organoids. For expression of A3A, A3C, and A3D, coding sequences for each APOBEC3 were obtained from the human ORFeome v8.1 and site-directed mutagenesis was performed to generate deaminase-dead mutants of A3C and A3D. Coding sequences for wildtype or deaminase-dead mutant APOBEC3 were cloned into pCW57.1 (Addgene #41393) to generate doxycycline-inducible cell lines.
Drugs
Drugs used are listed in Supplementary Table 5. Drugs were dissolved in DMSO except for hydroxyurea and nab-paclitaxel where water or 0.9% saline solution were used. Drug concentrations and treatment durations are indicated below or in the figures.
Chemical-genetic CRISPR-Cas9 screens
HPAF-II and Panc 08.13 cells stably expressing FLAG-Cas9 were transduced with the lentiviral TKOv2 library62 at a low multiplicity of infection (MOI; ~0.3). 24 hours after transduction, media containing 2 μg/mL (HPAF-II) or 4 μg/mL (Panc 08.13) puromycin was added to the cells for 48 hours to select for transduced cells. 48 hours post-infection was considered T0, when cells were split into three technical replicates. Cells were subcultured at days 3 and 6, at which point cells from each of the three technical replicates were divided into an untreated group and a group treated with the gemcitabine LD20 concentration (100 nM for HPAF-II and 200 nM for Panc 08.13) to ensure 80% cell viability. Cells were propagated in the presence or absence of gemcitabine for 24 (Panc 08.13) or 32 (HPAF-II) days, with cells subcultured in fresh drug-containing media every 3 days. Cells were harvested at each passage of each screen and genomic DNA was extracted using the QIAamp Blood Maxi Kit (Qiagen). Genome-integrated sgRNA sequences were PCR amplified (primers listed in Supplementary Table 6) using KAPA HiFi HotStart ReadyMix (Roche). i5 and i7 barcodes were added in a second round of PCR using KAPA polymerase, and the gel-purified PCR products were sequenced on an Illumina NextSeq500. A sgRNA library coverage of ~300 cells per sgRNA was maintained at each step. The RPE1-hTERT-Cas9 p53−/− screen was described previously63.
Quality control and analysis of CRISPR-Cas9 screen data
Depletion of sgRNAs targeting essential genes and precision-recall curve generation for each screen was performed using BAGEL264, using default parameters (Extended Data Fig. 1c). Total mapped read counts and counts of sgRNAs targeting non-essential and essential genes for each screen using reference non-essential and essential gene lists64 were also computed (Extended Data Fig. 1d-i). DrugZ64 was used to calculate a normalized depletion score for each gene targeted in the screens to identify knockouts that were depleted or enriched in the cell populations treated with gemcitabine for 13 (HPAF-II), 16 (Panc 08.13), or 18 (RPE1-hTERT p53−/−) days compared to untreated cells. Time points were selected to avoid complete depletion of essential DNA replication and repair genes. NormZ score cut-offs of ≤ −2 and ≥ 4 with false discovery rates < 15% were applied to identify sensitizers and resistance genes. PANTHER65 v17 was used to perform GO biological process analysis, with statistical support determined by a Fisher’s exact test with Bonferroni correction. GO terms were filtered for those with a p-value < 0.05 and a maximum reference group size of 275. GO biological processes were further processed in REVIGO66 to remove redundant GO terms using a medium list size and the SimRel semantic similarity measure.
Lentiviral production and transduction
Lentiviral particles were produced in HEK293T cells by co-transfecting with transfer plasmid, psPAX2 (Addgene #12260), and pMDG.2 (Addgene #12259) using X-tremeGENE HP DNA Transfection Reagent (Roche). Cells were replenished with viral harvest media (DMEM with 10% BSA and 1% penicillin/streptomycin) 18 hours later, and viral supernatant was harvested ~40 hours post-transfection. Lentiviral transductions were performed in the presence of 8 μg/mL (cell lines) or 10 μg/mL (organoids) polybrene at a low MOI (< 1), unless indicated otherwise.
Stable cell line and organoid generation
To generate stable Cas9-expressing Panc 08.13, Panc 10.05, and HPDE cell lines, cells were transduced with lentivirus particles harboring Lenti-Cas9-2A-Blast and selected with 4 μg/mL (Panc 08.13), 16 μg/mL (Panc 10.05), or 1 μg/mL (HPDE) blasticidin for 7 days. Following selection, polyclonal cell populations were harvested, centrifuged at 900 x g for 5 minutes, and resuspended in 1 mM EDTA, 25 mM HEPES pH 7.0, and 1% heat-inactivated FBS in PBS. Propidium iodide-negative single cells were sorted into 96-well plates on an Aria IIIu cell sorter to isolate Cas9-expressing clones. FLAG-Cas9 expression was confirmed by immunoblotting (Extended Data Fig. 1a-b). Cas9 functionality was tested with the T7 endonuclease I assay on targeted loci, by assessing cell viability following essential gene targeting, and by immunoblotting for target gene protein depletion.
To generate Cas9-expressing hT81 and hT82 organoids, cells were transduced with Lenti-Cas9-2A-Blast as described above and selected with 5 μg/mL blasticidin for ~7–8 days. FLAG-Cas9 expression was assessed by immunoblot analysis (Extended Data Fig. 2f).
To disrupt the A3C or A3D locus, lentiviral particles harboring lentiGuide-puro or lentiCRISPRv2 constructs encoding sgA3C or sgA3D were transduced into cell lines or organoids followed by selection. For the A3C A3D double knockout cell line, HPAF-II cells were transduced with lentivirus harboring lentiCRISPRv2 blast encoding sgA3C and selected with 10 µg/mL blasticidin for 5 days. Polyclonal A3C-deficient HPAF-II cells were harvested, transduced with lentivirus harboring lentiCRISPRv2 hygro encoding sgA3D, and selected with 300 µg/mL hygromycin for 4 days. Single A3C or A3D knockout HPAF-II cells were generated in parallel. Effective editing was confirmed by PCR amplification of the targeted locus and Sanger sequencing followed by ICE analysis and by qPCR analysis of A3C or A3D mRNA levels. Primers used are listed in Supplementary Table 6. RT-qPCR and ICE editing analysis data is in Extended Data Fig. 2b-e,h,i and Supplementary Table 3. For generation of UNG-deficient HPAF-II cells, cells were transduced with lentivirus particles harboring lentiCRISPRv2 encoding a sgRNA targeting UNG and selected with 2 µg/mL puromycin for 48 hours. UNG depletion was confirmed by immunoblot analysis (Extended Data Fig. 7k).
Cell viability analysis
Cell lines stably expressing Cas9 were transduced with lentivirus harboring vectors for sgRNAs targeting each gene of interest in Fig. 1e, 2c and LacZ (control) at a MOI > 1. Media containing 2 μg/mL (HPAF-II, BxPC-3, HPDE), 4 μg/mL (Panc 08.13 and Panc 10.05), or 8 μg/mL (AsPC-1) puromycin was added to the cells the next day for 48 hours to select for transductants, followed by culturing the cells for a week prior to seeding. Cells were dissociated, counted, and seeded in 96-well plates at 4000 (BxPC-3 and HPDE), 9000 (HPAF-II), or 6000 (AsPC-1, Panc 08.13, Panc 10.05) cells per well, and treated with 1 μM gemcitabine the next day. Cell viability was evaluated 72 hours following gemcitabine treatment with alamarBlue (ThermoFisher). Fluorescence was measured at 560 nm excitation, 590 nm emission on a CLARIOstar Plus microplate reader.
For gemcitabine sensitivity of PDAC cells harboring disruptions in the base excision repair and POLH genes, HPAF-II cells were transduced with a sgRNA targeting AAVS1 (control), LacZ (control), HMCES, APEX1, APEX2, SMUG1, or POLH, selected with 2 μg/mL puromycin for 48 hours, then seeded into 96-well plates as described above. Cells were treated with a range of gemcitabine concentrations the next day as indicated in the figure legends. For gemcitabine sensitivity in non-transformed cells, RPE1-hTERT-Cas9 p53−/−, HPDE, and HPNE-hTERT cells were transduced with lentiviral vectors expressing sgAAVS1, sgA3C, or sgA3D. Media containing 16 µg/mL puromycin (RPE1-hTERT-Cas9 p53−/−), 2 μg/mL puromycin (HPDE), or 14 μg/mL blasticidin (HPNE-hTERT) was added to the cells the next day for 3, 2, or 7 days, respectively. Cells were seeded into 96-well plates at a density of 1250 (RPE1-hTERT-Cas9 p53−/−), 6500 (HPDE), or 2000 (HPNE-hTERT) cells per well. The following day, cells were treated with gemcitabine concentrations (0–500 nM for HPDE and 0–10 μM for HPNE-hTERT and RPE1-hTERT-Cas9 p53−/−) for 72 hours. Cell viability was analyzed with CellTiter-Glo (Promega), and luminescence was measured on a CLARIOstar Plus microplate reader.
For gemcitabine sensitivity of A3C- and A3D-deficient PDAC organoids, hT81-Cas9 and hT82-Cas9 cells were transduced with lentivirus particles for the co-expression of eGFP and sgRNAs targeting LacZ, A3C, or A3D, and selected with 2 μg/mL puromycin for 4 days. Following selection, cells were dissociated into single cells, counted, and seeded into 96-well plates (7500 cells per well) in complete organoid media with 10% Matrigel. Cells were then treated with different concentrations of gemcitabine (0.5–1000 nM) for 5 days, and CellTiter-Glo was used to measure organoid viability.
Gemcitabine plus nab-paclitaxel sensitivity
For gemcitabine plus nab-paclitaxel experiments, parental and A3C- and A3D-deficient HPAF-II cells were seeded into 96-well plates at a density of 9000 cells per well. Cells were treated with 0 or 250 nM gemcitabine and 0, 50, or 100 nM nab-paclitaxel the following day, with three wells per drug concentration combination. Cell viability was measured a week after drug treatment using CellTiter-Glo.
Two-color competitive growth assay
HPAF-II-Cas9 and Panc 08.13-Cas9 cells were transduced with lentiviral particles for the co-expression of NLS-mCherry and sgLacZ or NLS-eGFP and sgLacZ or sgA3D. Selection media containing 2 μg/mL (HPAF-II) or 4 μg/mL (Panc 08.13) puromycin was added the next day for 48 hours. 750,000 (HPAF-II) or 900,000 (Panc 08.13) mCherry- and eGFP-expressing cells were then mixed at a 1:1 ratio and seeded into two 10 cm2 dishes. 24 hours post-plating, cells were imaged to confirm that mCherry and eGFP signals were at an equal ratio, and 100 nM (HPAF-II) or 250 nM (Panc 08.13) gemcitabine was added to one of the two 10 cm2 dishes for each sample. Cells were then propagated for a total of 18 days, where they were subcultured every 3 days. 1×10⁶ cells were collected by centrifugation at each passage, resuspended in 1 mL of PBS containing 1x LIVE/DEAD fixable near-IR dead cell stain (ThermoFisher), and incubated for 30 minutes at room temperature, protected from light. Cells were washed twice in PBS containing 2% FBS, resuspended in 300 μL of PBS, and filtered through 35 μm cell strainer cap polystyrene tubes prior to flow cytometric analysis.
Clonogenic survival assay
HPAF-II-Cas9 cells were transduced with lentivirus harboring A3C, A3D, UNG, or LacZ sgRNAs. Media containing 2 μg/mL puromycin was added to the cells the next day for 48 hours, and cells were cultured for two weeks. 10,000 HPAF-II cells of each genotype were seeded in 10 cm2 dishes in the presence and absence of 10 nM gemcitabine or 1 µM hydroxyurea. For experiments with gemcitabine, drug-containing media was removed after 72 hours and cells were propagated in drug-free media for 11 days, with fresh medium added every 5 days. For experiments with hydroxyurea, cells were treated with drug for 14 days, with fresh drug-containing media added every 3 days. For HPAF-II cells transduced with the wildtype and deaminase-dead A3C and A3D mutant rescue pCW57.1 constructs, 10,000 HPAF-II cells of each genotype were seeded in 10 cm2 dishes in 1 μg/mL doxycycline, in the presence or absence of 5 nM gemcitabine for 72 hours. Fresh doxycycline-containing medium was then added every 3 days. After 14 days, cells were washed with PBS and stained with 0.4% (w/v) crystal violet in 20% methanol for 30 minutes at room temperature. Colonies were washed with distilled water twice and air-dried before counting.
Reverse transcription and quantitative real-time PCR
To assess APOBEC3 mRNA expression levels following drug or IFN-β (Abcam) treatment, 1×10⁵ (RPE1-hTERT p53−/− and HPNE-hTERT), 2×10⁵ (HPAF-II), 2.5×10⁵ (HPDE), or 3×10⁵ (Panc 08.13 and Panc 10.05) cells were seeded into each of two six-well plate wells for each condition and treated at the concentrations indicated in the figure legends for 24 or 72 hours. Cells were washed in ice-cold PBS and total RNA was extracted using the RNeasy Plus Mini Kit (Qiagen) with gDNA eliminator columns. RNA (1 μg) was reverse transcribed using the High-Capacity cDNA Reverse Transcription Kit (ThermoFisher) or SuperScript III First-Strand Synthesis SuperMix (ThermoFisher) and cDNAs were analyzed in 384-well plates by qPCR using the PowerUp SYBR Green MasterMix (ThermoFisher) in a QuantStudio 6 Flex Real-Time PCR system. Fold-change of APOBEC3 mRNA was determined using the ΔΔCt method67 following normalization of all samples to ACTB or GAPDH expression. qPCR primer sequences are in Supplementary Table 6.
Expression analysis of APOBEC3 genes in PDAC cells
RNA expression data for 55 PDAC cell lines and organoids was downloaded from the DepMap Public 2023 Q2 release. Log2(TPM+1) expression values for A3C, A3D, and PGK1 were converted to transcripts per million (TPM) values prior to analysis. RNA expression data for 430 PDAC tumors part of the International Cancer Genome Consortium (ICGC) and COMPASS clinical trial (NCT02750657) were obtained68–70 or processed as described70. In total, 179 resected primary tumors and 251 advanced or metastatic tumors were analyzed. For analysis of TCGA data, RNA-seq data for 183 tumors from the TCGA-PAAD cohort was obtained from the TCGA data portal. Fragments per kilobase of transcript per million mapped reads (FPKM) was used for expression analyses with ICGC/COMPASS and TCGA data.
Reporter assay for type I interferon response activation
2×10⁵ HPAF-II-Cas9 cells transduced with sgLacZ (control), sgA3C, sgA3D, or sgTREX1 were seeded per well of a six-well plate, treated with 0 or 500 nM gemcitabine for 72 hours, and recovered in drug-free media for 0 or 72 hours. 5×10⁴ HEK-Blue IFN-α/β reporter cells were seeded in 160 µL of DMEM with 10% heat-inactivated FBS and 1% penicillin/streptomycin per well of a 96-well plate and co-incubated with 40 µL of supernatant from each HPAF-II sample for 24 hours at 37°C. Secreted SEAP levels were detected by incubating 20 µL of HEK-Blue cell supernatant with 180 µL of QUANTI-Blue solution (InvivoGen) for 3 hours at 37°C, and measuring absorbance at 620 nm on a CLARIOstar Plus microplate reader.
Antibodies
Antibodies used, with vendor information, RRID numbers, and dilutions, are in Supplementary Table 7.
Baculovirus generation and amplification
N-terminal GST-tagged APOBEC3A, APOBEC3C, and APOBEC3CC97S/C100S codon optimized for expression in insect cells were gene synthesized (BioBasic) and cloned into pFastBac1. 10 ng of each plasmid was transformed into MAX Efficiency DH10Bac cells (ThermoFisher) to generate recombinant bacmids, with selection on LB plates containing 7 μg/mL gentamicin, 10 μg/mL tetracycline, and 50 μg/mL kanamycin with 100 μg/mL IPTG and 40 μg/mL X-Gal for blue-white screening.
For first passage (P1) baculovirus, 1 μg of bacmid DNA was transfected into each of two wells of a six-well plate containing 1×10⁶ Sf9 cells using FuGENE HD Transfection Reagent (Promega). 24 hours post-transfection, the media was replaced with fresh Hyclone SFX media and cells were incubated for 96 hours prior to harvesting P1 baculovirus by collecting the growth medium, centrifuging at 900 x g for 5 min at 4°C, transferring the supernatant to a new 15 mL conical tube, and adding FBS to 10% (v/v) final. Following baculovirus collection, the Sf9 cells from each well were resuspended in 5 mL of ice-cold PBS, centrifuged at 900 x g for 5 min at 4°C, and lysed in 500 μL of 2x Laemmli buffer for immunoblot analysis.
P1 baculovirus was amplified by infecting 1×10⁶ Sf9 cells/mL in 125 mL shake flasks with P1 baculovirus at an MOI of 0.1. 24 hours post-infection, cells were counted every 24 hours and the cultures were maintained at 1×10⁶ cells/mL. ~48 hours after the cells ceased proliferation, P2 baculovirus was harvested as described above. Baculovirus titers were determined with the BaculoQUANT All-in-One Titration Kit (Oxford Expression Technologies).
Purification of APOBEC3A and APOBEC3C
1×10⁹ Hi5 cells were infected with P2 baculovirus at an MOI of 1. 72 hours post-infection, cells were harvested at 1500 x g for 30 minutes at 4°C, washed with ice-cold PBS, and resuspended in 150 mM NaCl, 1% (v/v) Triton X-100, 20 mM HEPES pH 7.5, 10 mM EDTA, 10% (v/v) glycerol, 50 μg/mL RNase A, 10 mM DTT, 1 μg/mL leupeptin, 1 μg/mL pepstatin A, 1 mM PMSF, 10 mM NaF, and 1x cOmplete EDTA-free Protease Inhibitor Cocktail (Roche). Lysates were incubated on ice for 30 minutes, with gentle vortexing every 10 minutes, followed by sonication on ice (5 cycles of 15 seconds on, 30 seconds off) using a Branson Model 450 sonicator at 60% amplitude. Lysates were centrifuged at 10,000 x g for 1 h at 4°C, and the supernatant was loaded onto glutathione Sepharose 4B resin (GE HealthCare). The resin was washed with 500 mM, 1 M, and 150 mM NaCl in 1% (v/v) Triton X-100, and proteins were cleaved from the resin with 40 μg/mL PreScission protease (Cytiva) in 50 mM Tris pH 7.5, 1 mM EDTA, 150 mM NaCl, 10% (v/v) glycerol, 1 mM DTT, 1 μg/mL leupeptin, and 1 μg/mL pepstatin A, with mixing overnight at 4°C. The purity of each fraction was assessed by SDS-PAGE.
In vitro cytidine deaminase assay
An 80-nucleotide ssDNA substrate containing a single cytidine or 2’2’-difluoro-deoxycytidine were used. 10 μL reactions containing 100 nM substrate, 125 mM NaCl, 10 mM MgCl2, 1 mM DTT, 2.5% (v/v) glycerol, 1 μg/mL RNase A in 25 mM MES pH 5.5 with A3C (0, 100, or 250 nM) were prepared. Assays for A3A contained 100 fmol of ssDNA substrate, 25 mM Tris pH 7.0, and A3A (0, 100, 250, 500, 750, or 1000 nM). Reactions were incubated at 37°C for 2 hours, followed by 5 minutes at 95°C. Cytidine deamination was detected as described71, with 0.1 μL of each assay amplified in a 20 μL PCR, digested with MseI overnight at 37°C, resolved on a 15% nondenaturing polyacrylamide gel, and stained with SYBR Gold (ThermoFisher). Substrate with an uracil in place of cytidine was used as a positive control. DNA substrates and primer sequences are in Supplementary Table 6.
Analysis of gemcitabine nucleosides in genomic DNA
Nucleosides and gemcitabine analogues used as standards, along with catalog numbers, are in Supplementary Table 8. To quantify gemcitabine (dFdC) and 2’2’-difluoro-deoxyuridine (dFdU) in genomic DNA, 2×10⁶ HPAF-II cells (parental or A3C- or A3D-deficient) were cultured in 10 cm2 dishes. Cells were treated with 500 nM or 1 μM gemcitabine for 24 or 72 hours, and genomic DNA was isolated with the DNeasy Blood and Tissue Kit (Qiagen) and ethanol precipitated. Genomic DNA (2 µg) was hydrolyzed and dephosphorylated to nucleosides with nuclease P1 (Sigma-Aldrich), phosphodiesterase I (MyBioSource), and alkaline phosphatase (Sigma-Aldrich), as described72. Samples were lyophilized, reconstituted in 29 μL of LC-MS grade water, and spiked with 1 μL of 1 μg/mL 13C15N2-dFdC prior to analysis on an Agilent Infinity 1260 system with an AJS-EJI Agilent 6490 triple quadrupole mass spectrometer. Nucleoside separation was adapted from Bapiro et al., 201173, with the following modifications. 0.3 mL/minute starting flow rate, with the gradient started at 5% B for 2 minutes, then a 0.2 minute step to an isocratic separation at 13% B for 6.3 minutes, followed by a 0.2 minute transition to an isocratic step at 20% B for 5 minutes. The column was washed at 95% B for 5 minutes at 0.5 mL/minute, then flow rate was reduced to 0.3 mL/minute and 5% B for regeneration of the column. The needle was washed consecutively with 600 μL of water, 600 μL of 50% acetonitrile, and another 600 μL of water. Transitions were optimized using Optimizer (Agilent) and are in Supplementary Table 9. Source parameters for MS were: AJS ESI source gas temperature was set to 150°C with a flow rate of 14 L/minute and sheath gas was at 250°C with a flow rate of 12 L/minute. Nebulizer pressure was 45 psi, and the capillary voltage was at 2500 V. Data were acquired using MassHunter Data Acquisition Software vB.08.00 and integrated using MassHunter Quantitative Analysis for QQQ vB.07.00. Peak areas for dFdC and dFdU were subtracted from the values of each nucleoside in the blank runs, then normalized to the peak area of 13C15N2-dFdC in the same sample to obtain a ratio for genomic dFdC and dFdU levels.
Analysis of intracellular nucleosides
To quantify intracellular deoxycytidine and gemcitabine nucleosides, 4×10⁵ HPAF-II cells (parental or A3C- or A3D-deficient) were seeded in three six-well plate wells for each condition. Cells were treated with 500 nM or 1 μM gemcitabine for 4 or 24 hours, plates were placed on dry ice, and metabolites were extracted with 1 mL of 80% methanol per well. Each well was scraped, and cells were transferred to 5 mL tubes on ice. Samples were cycled between −20°C and −80°C three times to lyse the cells, centrifuged at 4000 x g for 5 min at 4°C, and supernatants were lyophilized. Pellets were flash frozen and stored at −80°C, and RNA was extracted to normalize sample volume to cell number. Prior to LC-MS/MS, the lyophilized samples were reconstituted in appropriate volumes of water containing 250 ng/mL 13C15N2-dFdC and transferred to polypropylene autosampler vials. Samples were analyzed using an HTS PAL-Xt LC autosampler (CTC Analytics) coupled to an AJS-EJI Agilent 6490 triple quadrupole mass spectrometer equipped with an ESI source. Samples were separated on a 100 × 2.1 mm PGC Hypercarb column (ThermoFisher) at 30°C. Mobile phase A was 10 mM ammonium acetate pH 10, and mobile phase B was acetonitrile. The gradient at a flow rate of 0.3 mL/minute was: 0–2 minutes 5% B; 2–2.2 minutes 5–13% B; 2.2–8.5 minutes 13% B; 8.5–8.7 minutes 13–20% B; 8.7–13.7 minutes 20% B; 13.7–14 minutes 20–99% B; 14–19 minutes 99% B; 19–19.1 minutes 99–50% B; 19.1–24 minutes 50% B; 24–24.1 minutes 50–5% B; and 24.1–30 minutes 5% B. The flow rate was increased to 0.5 mL/minute between 14.1 and 19 minutes. The autosampler needle was washed for the duration of the run using acetonitrile and water. Source parameters and data acquisition were as detailed above for analysis of nucleosides from genomic DNA. Acquisition details of multiple reaction monitoring are in Supplementary Table 10. Retention times were set according to those of standard solutions. Peak areas for each nucleoside were subtracted from the values of each nucleoside in the blank LC/MS runs prior to statistical analysis.
Quantification of genomic uracils by dot blot analysis
To investigate whether gemcitabine promotes cytidine deamination, 2.2×10⁶ UNG-deficient HPAF-II cells were cultured in 10 cm2 dishes. Cells were treated with 1 μM gemcitabine for 72 hours, and genomic DNA was isolated using the Quick-DNA Miniprep Plus Kit (Zymo Research). DNA samples were analysed on agarose gels to ensure the DNA was intact and RNA-free and quantified using the Qubit dsDNA Quantification Assay (ThermoFisher) prior to experimentation. Uracil content of the isolated genomic DNA was measured by dot blot analysis using the 3xFLAG-ΔUNG uracil sensor as described49,74, with genomic DNA from the CJ236 [dut-, ung-] Escherichia coli strain used as a standard75.
DNA combing analysis
To assess DNA replication fork progression or re-start in A3C-, A3D-, POLH-, or HMCES-deficient HPAF-II or RPE1-hTERT p53−/− cells, 3.5×10⁶ (HPAF-II) or 8×10⁵ (RPE1-hTERT p53−/−) cells of each genotype were cultured in 10 cm2 dishes for 24 hours. Cells were pulsed with 25 μM CldU (Sigma-Aldrich #C6891) for 30 minutes, washed with pre-warmed PBS, and then pulsed with 125 μM IdU (Sigma-Aldrich #I7125) in the presence or absence of 1 μM (HPAF-II) or 500 nM (RPE1-hTERT p53−/−) gemcitabine for 30 minutes. For replication fork re-start experiments, cells were pulsed with 25 μM CldU for 30 minutes, washed with pre-warmed PBS, treated with 1 μM gemcitabine for 30 minutes, washed with pre-warmed PBS, and then pulsed with 125 μM IdU in the presence or absence of 5 µM JH-RE-06 for 30 minutes. Cells were harvested by trypsinization, cast into 1% low melting point agarose (Bioshop) plugs at a density of 5,000,000 cells/mL, and processed as described76, except that antibody-DNA complexes were fixed with 4% (w/v) paraformaldehyde for 10 minutes at room temperature following anti-BrdU antibody incubations. Images were acquired using a Zeiss AxioImager Z1 microscope with a x63 oil immersion objective using Zeiss AxioVision v4.8.2.0. DNA replication fork speed (kbp/min) was calculated by determining the length of IdU tracks adjacent to CldU tracks using ImageJ v1.53k, converting the IdU lengths from pixels to kilobase pairs77, and dividing by the IdU incubation time. CldU tracks with no adjacent IdU label or CldU tracks followed by a single pixel of IdU were considered to be stalled replication forks.
Immunoblot analysis
Cell pellets were lysed in RIPA buffer (50 mM Tris pH 7.5, 150 mM NaCl, 0.1% SDS, 2 mM EDTA, 0.5% sodium deoxycholate, 1% (v/v) Triton X-100) with 1x cOmplete EDTA-free Protease Inhibitor Cocktail (Roche) and 1x PhosSTOP phosphatase inhibitor (Roche) for 30 minutes at 4°C with gentle agitation. For organoids, a single confluent six-well plate well was harvested for each culture. Liquid overlay media was removed and ice-cold Cell Recovery Solution (CRS; Corning) with 0.5x protease and phosphatase inhibitors was added to each well. Organoids were detached using a cell lifter, transferred to pre-cooled 1.5 mL tubes on ice, incubated for 10 minutes, and centrifuged at 4000 x g for 5 minutes at 4°C. Organoids were washed in CRS plus 0.5x protease and phosphatase inhibitors and lysed in RIPA buffer with 1x protease and phosphatase inhibitors for 30 minutes on ice. Extracts were clarified by centrifugation at 5000 x g for 15 minutes at 4°C, and supernatants were recovered. Protein concentrations were measured using the Pierce Rapid Gold BCA Protein Assay Kit.
Cell extracts (20–50 μg) were diluted in 4x Laemmli buffer (250 mM Tris pH 6.8, 5% SDS, 40% (w/v) glycerol, 0.02% bromophenol blue, 10% β-mercaptoethanol) and heated at 95°C for 5 minutes prior to separation by SDS-PAGE. Proteins were transferred to nitrocellulose, blocked in 5% (w/v) skim milk in TBS with 0.2% Tween-20 (TBST) or 5% (w/v) bovine serum albumin (BSA; Bioshop) in TBST (for phosphoSTAT1 Tyr701 analysis), and probed with primary antibodies overnight at 4°C. Membranes were then washed three times in TBST, probed with the appropriate secondary antibodies for 1 hour, then washed another three times in TBST. Proteins were detected using SuperSignal West Pico PLUS chemiluminescent substrate (ThermoFisher) and visualized on X-ray film.
Immunofluorescence microscopy
For cytosolic ssDNA, 3.5×10⁵ HPAF-II cells transduced with sgLacZ, sgA3C, or sgA3D were seeded onto glass coverslips and treated with 1 μM gemcitabine or left untreated for 72 hours. Cells were then washed with ice-cold PBS, fixed with 4% (w/v) paraformaldehyde in PBS for 15 minutes at room temperature, washed three times with PBS, and incubated in 0.02% (w/v) saponin in PBS for 5 minutes at room temperature to selectively permeabilize the plasma membrane. Cells were then washed thrice with PBS, blocked with 3% (w/v) BSA and 0.05% Tween-20 in PBS for 1 hour, and incubated in blocking buffer containing primary antibody overnight at 4°C. After three washes in PBS, cells were incubated in blocking buffer containing secondary antibody and 0.5 μg/mL 4’,6-diamidino-2-phenylindole (DAPI; Sigma-Aldrich) for 1 hour at room temperature, protected from light. Following washing with PBS, coverslips were mounted on glass slides with ProLong Gold mounting reagent (ThermoFisher). Images were acquired using a Zeiss AxioObserver Z1 confocal microscope with a x63 oil immersion objective using Zeiss ZEN 3.2. Nuclei with a diameter of 100 to 200 pixels were segmented using the DAPI channel and masked to quantify mean fluorescence intensity of cytosolic ssDNA, using CellProfiler v4.2.1.
For RAD51, RPA2, and 53BP1 foci, parental and A3C- and A3D-deficient HPAF-II or RPE1-hTERT p53−/− cells were seeded into 96-well plates (9000 or 10,000 HPAF-II cells/well for 72- or 24-hour drug treatments and 3000 RPE1-hTERT p53−/− cells/well). Cells were pulsed with 10 μM 5-ethynyl-2-deoxyuridine (EdU; ThermoFisher) for 10 minutes to identify cells in S phase. Cells were then treated with 1 μM gemcitabine or 5 µM mitomycin C for 24 or 72 hours, washed with ice-cold PBS, and pre-extracted with CSK buffer (300 mM sucrose, 100 mM NaCl, 3 mM MgCl2, 10 mM PIPES pH 7.0, 0.5% (v/v) Triton X-100) for 15 minutes on ice. Extracted cells were fixed with 4% (w/v) PFA in PBS for 10 minutes at room temperature, washed three times in PBS, and incubated in blocking buffer (10% goat serum, 0.5% NP-40, 5% (w/v) saponin in PBS) for 1 hour. Blocking buffer with the appropriate primary antibodies was added to the cells for 2 hours, followed by three PBS washes, and incubation in blocking buffer containing secondary antibodies and 0.5 μg/mL DAPI for 1 hour, protected from light. Cells were then washed with PBS and incubated in Click-iT reaction buffer (2 mM CuSO4, 100 mM sodium ascorbate, and 10 μM Alexa Fluor 647 azide dye (Invitrogen)) for 30 minutes to label EdU-positive cells. Wells were filled with 100 μL PBS, and images were acquired using an OPERA Phenix confocal microscope (PerkinElmer) with a 40x water immersion objective using Harmony High-Content Imaging and Analysis Software v4.9 (PerkinElmer). Micronuclei were counted manually. Foci in EdU-positive and -negative cells were quantified with CellProfiler following segmentation of nuclei. S phase cells were identified as those with nuclear EdU signal. The following thresholds were used to segment nuclei as gemcitabine treatment increases cell size: 55 to 140 pixels (untreated HPAF-II), 55 to 160 pixels (HPAF-II 24 hours gemcitabine), 95 to 210 pixels (HPAF-II 72 hours gemcitabine), 50 to 150 pixels (untreated RPE1-hTERT), and 50 to 180 pixels (RPE1-hTERT gemcitabine).
To confirm the nab-paclitaxel concentrations were sufficient to cause formation of multinucleated cells78, 9000 HPAF-II cells were seeded per 96-well plate well. Cells were treated with 0, 50, or 100 nM nab-paclitaxel for 72 hours, fixed with 4% (w/v) PFA in PBS for 10 minutes at room temperature, washed three times in PBS, and permeabilized with 0.3% (v/v) Triton X-100 in PBS for 5 minutes. After washing thrice with PBS, cells were incubated with 0.5 μg/mL DAPI in PBS for 1 hour, protected from light. Wells were washed thrice with PBS, filled with 100 μL of PBS, and imaged on the OPERA Phenix. Multinucleated cells were counted manually.
Flow cytometric analysis
9×10⁶ (HPAF-II) or 2×10⁶ (RPE1-hTERT p53−/−) cells of each genotype were cultured in 15 cm2 dishes, treated with 1 μM gemcitabine for 24 hours, and pulsed with 10 μM EdU in the last 2 hours of drug treatment prior to trypsinization and centrifugation (9000 x g, 5 min, 4°C). Cell pellets were washed with ice-cold PBS, pre-extracted in CSK for 5 minutes on ice, and ice-cold 1% (w/v) BSA in PBS was added before centrifugation. Cells were then fixed in 4% PFA for 15 minutes at room temperature and ice-cold 1% BSA in PBS was added to each sample before centrifugation. EdU was detected as described above. Following a wash with blocking buffer (0.1% NP-40, 1% BSA in PBS), cells were incubated with primary antibodies in blocking buffer overnight at 4°C then washed once in blocking buffer. The appropriate secondary antibodies in blocking buffer were added to the cells for 30 minutes at room temperature, following which the cells were pelleted and washed one additional time in blocking buffer. Cells were resuspended in 1% BSA, 0.5 μg/mL DAPI, 100 μg/mL RNase A in PBS, filtered through 35 μm cell strainer cap polystyrene tubes, and incubated for 30 minutes at 37°C. Samples were analyzed on a LSR II using BD FACSDiva v8.0.1, with a minimum of 10,000 events collected and analyzed using FlowJo v10. To evaluate chromatin-bound RPA2 and 53BP1 levels in S phase and G1 cells, populations corresponding to each cell cycle stage were gated in FlowJo using the cell cycle plots generated from the EdU and DAPI channels and the fluorescence values for RPA2 and 53BP1 in the S or G1 populations were exported for analysis and visualization.
Animals
Mouse xenograft tumor experiments were performed by the Princess Margaret Living Biobank (University Health Network, Toronto, Ontario) at the Animal Resources Centre. Male NOD SCID mice (NOD.Cg-Prkdcscid, 4–6 weeks old, The Jackson Laboratory #001303) were maintained under specific pathogen-free and housing conditions. Mice were housed in rooms on a standard 12-hour light-dark cycle, with a temperature range of 20–26°C and relative humidity of 40–60%. Mice had free access to autoclaved water and food, and animal care followed the guidelines of the Canadian Council on Animal Care. Mice were acclimatized in the animal facility for at least 3 days prior to experimentation. The number of mice used was above the minimum necessary to achieve an 80% statistical power at an alpha level of 0.05 to detect a medium effect size between treatment conditions, as previously reported79.
Cancer cell implantation and tumor measurements
Exponentially growing parental and A3C- and A3D-deficient HPAF-II cells (tested for murine pathogens and Mycoplasma using the Mouse 9 Agent CLEAR panel) were harvested, and 3,000,000 cells of each genotype were resuspended in 450 µL of DMEM media. Cells were injected subcutaneously in the flank of NOD SCID mice and serially passaged twice before experimentation. When tumors reached the target mean volume of 115–150 mm3 (40–252 mm3), mice of each genotype were randomized based on tumor volume using the Studylog Animal Study Workflow Software v4.2 into two (A3C- or A3D-deficient) or three (parental) study arms, with 8–9 mice per group, and gemcitabine treatment was initiated. Mice were treated with vehicle (saline) or 50 mg/kg (parental and A3C-deficient cells) or 75 mg/kg (parental and A3D-deficient cells) gemcitabine once a week by intraperitoneal injection. Tumor volume and body weight were measured two or three times per week and collected on the Studylog database. Tumor volume was measured using a microcaliper and calculated using as length x width2 × 0.5236. Mice were euthanized at clinical endpoints as guided by the Acceptable Use Policy for the project at the Princess Margaret Living Biobank or once a tumor volume of 2000 mm3 was reached, which was not exceeded for any experiment.
Statistics and reproducibility
The sample size (n), replication, and statistical test used for each experiment are specified in the figure legends and methods for each experiment. Samples were randomly assigned to the control or experimental groups. Power calculations were not performed to determine the sample size before each experiment. Sample sizes were chosen based on experience with the given experiments76,79 or were similar to those reported in previous studies80. Data distributions were assumed to be normal, but this was not formally tested. Experimental sample differences were evaluated by linear mixed-effect models, one-tailed Pearson correlation, two-tailed unpaired t-test, or two-tailed unpaired Mann-Whitney U test. Statistical analyses were performed using R v4.1.2, Python v3.8.12, or GraphPad PRISM v10.0.0. P values < 0.05 were considered as statistical support. No data were excluded from any experimental analysis. Data collection and quantification for DNA combing and immunofluorescence experiments were blinded. Data collection and outcome assessment for other experiments was not blinded.
Extended Data
Extended Data Fig. 1. Generation of Cas9 stable cell lines and quality control analysis of CRISPR-Cas9 screen data.

a-b, Immunoblot analysis of Panc 08.13 and Panc 10.05 (panel a), and HPDE (panel b) pancreatic cell lines generated to stably express FLAG-Cas9. GAPDH or α-tubulin was used as a loading control. Data is representative of three biological replicates. c, Precision-recall curves for gene essentiality in HPAF-II and Panc 08.13 CRISPR-Cas9 screens with gemcitabine. Gene essentiality for each screen was determined by calculating the Bayes Factor, and then compared to reference nonessential and essential gene training sets from Kim and Hart (2021) to determine how well each screen performed. d-e, Total mapped sequencing reads for each of the CRISPR-Cas9 screens performed. Dashed line indicates the expected total read count if 200-fold coverage of the sgRNA library was achieved (14,139,400 total reads). f-i, Read counts of sgRNAs targeting non-essential (panels f and g) or essential (panels h and i) genes in each CRISPR-Cas9 screen. Non-essential and essential genes were classified using the gene lists by Kim and Hart (2021). Center lines represent the median and box limits indicate the 25th and 75th percentiles of each sample. Whiskers extend 1.5x the interquartile range and individual data points indicate outliers.
Extended Data Fig. 2. Assessing APOBEC3C- and APOBEC3D-mediated gemcitabine resistance in pancreatic cell lines and organoids.

a, Heatmap of the viability of A3C- and A3D-deficient pancreatic cancer (HPAF-II, Panc 08.13, Panc 10.05, AsPC-1, and BxPC-3) and non-transformed cell lines (HPDE, HPNE-hTERT, and RPE1-hTERT p53−/−) following gemcitabine treatment. Cell viability was assessed following seven days of gemcitabine treatment using CellTiter-Glo. Gemcitabine sensitivity for each A3C- or A3D-deficient cell line was determined by normalizing cell viability to that of the same cell line expressing a control sgRNA (sgLacZ or sgAAVS1) and is indicated on the heatmap. Data from three independent biological replicates are plotted. b-e, Quantification of A3C and A3D mRNA levels in HPAF-II (panel b), HPDE-Cas9 (panel c), HPNE-hTERT (panel d), and RPE1-hTERT-Cas9 p53−/− (panel e) A3C- and/or A3D-deficient cells by RT-qPCR analysis. A3C and A3D mRNA levels in each CRISPR-Cas9 knockout cell population was determined by comparing to the expression levels of each respective gene in the wildtype cell line. Three independent biological replicates are plotted, with bars indicating the medians. f, Immunoblot analysis of hT81 and hT82 pancreatic cancer organoids generated to stably express FLAG-Cas9. α-tubulin was used as a loading control. Data is representative of three independent replicates. g, Representative micrographs of hT81-Cas9 and hT82-Cas9 organoids following transduction with lentivirus co-expressing sgRNAs targeting A3D or A3C and eGFP to assess transduction efficiency prior to performing cell viability experiments. Scale bars, 100 µm. Data is representative of three biological replicates. h-i, Relative A3C and A3D mRNA levels in A3C- or A3D-deficient hT81-Cas9 (panel h) and hT82-Cas9 (panel i) pancreatic cancer organoids in comparison to each wildtype organoid population expressing sgLacZ. Bars represent the medians of three independent replicates.
Extended Data Fig 3. Nab-paclitaxel increases gemcitabine sensitivity in PDAC cells lacking APOBEC3C or APOBEC3D.
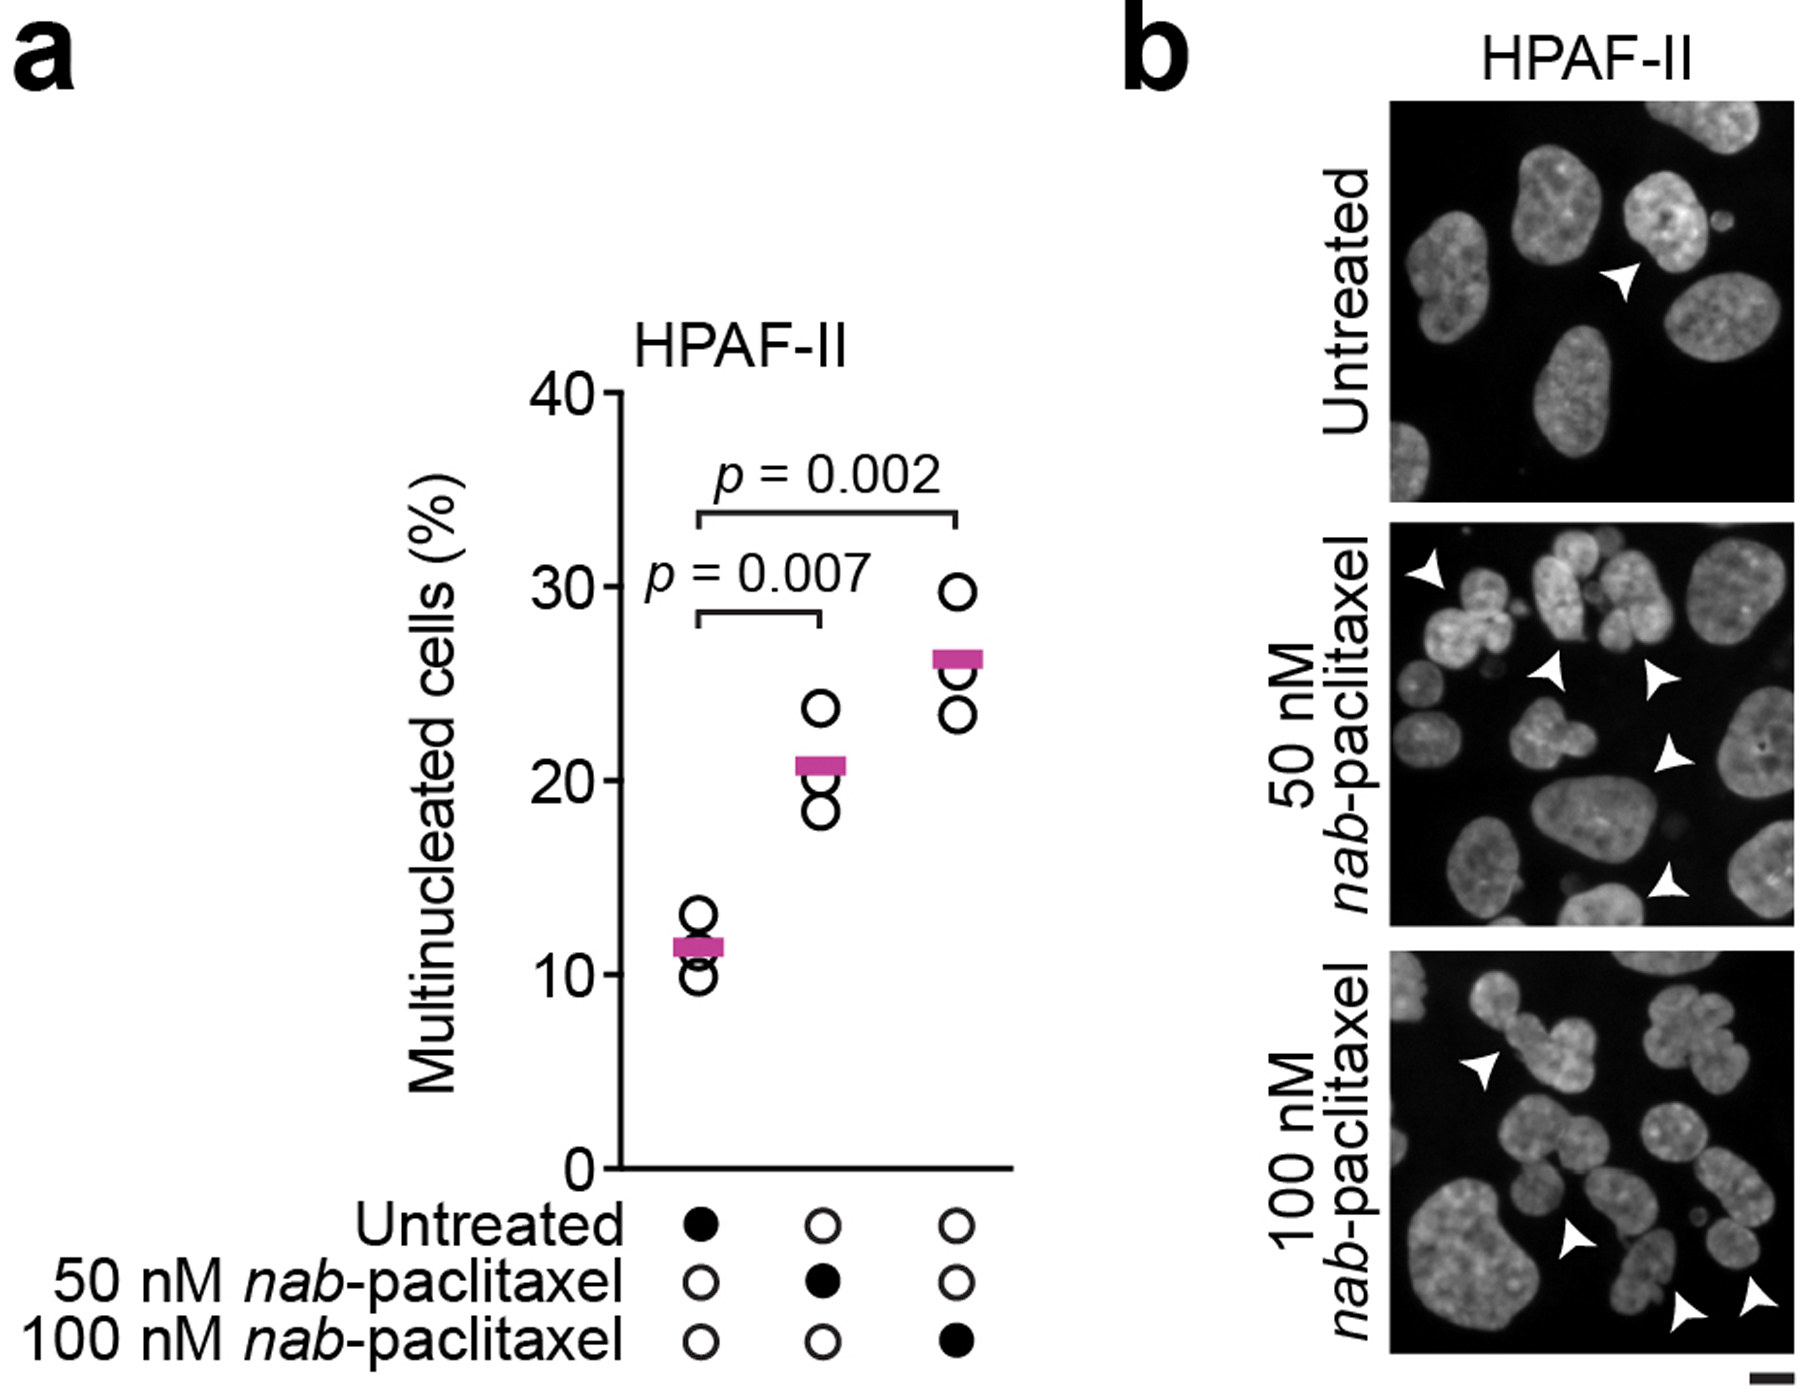
a, Quantification of multinucleated HPAF-II cells following 50 or 100 nM nab-paclitaxel treatment for 72 hours. A minimum of 1691 cells were quantified for untreated (n = 1691) and 50 nM (n = 1709) and 100 nM (n = 1734) nab-paclitaxel conditions, with greater than 411 cells quantified for each sample per biological replicate. Statistical support was determined using two-tailed unpaired t-tests. Horizontal bars indicate the means of three biological replicates. b, Representative micrographs of HPAF-II cells treated with 0, 50, or 100 nM nab-paclitaxel in the experiments from panel a, with multinucleated cells labeled with arrowheads. Scale bar, 10 µm. a,b, Relate to Fig. 2k.
Extended Data Fig. 4. APOBEC3C and APOBEC3D expression levels are correlated and induced by the innate immune response and DNA damaging and replication stress-inducing agents.

a, mRNA expression levels of A3C and A3D in pancreatic tumors from the TCGA-PAAD project (n = 183). Median expression level of each gene is indicated. PGK1, housekeeping gene. b, Scatterplot matrix comparing mRNA expression levels of each pairwise APOBEC3 combination in pancreatic tumors from the ICGC PACA-CA cohort and COMPASS clinical trial (n = 430). Bottom half of the matrix depicts individual pairwise APOBEC3 expression scatterplots, with regression lines plotted. Top half of the matrix indicates the one-tailed Pearson’s coefficient (r) for each pairwise combination. c, Induction of A3A, A3B, A3C, and A3D mRNA levels following 72 hour treatment of HPAF-II cells with a range of interferon β concentrations (0, 0.1, 1, or 10 ng/mL), analyzed by RT-qPCR. Data was normalized to ACTB expression, and the fold-change of each mRNA was determined by comparing to untreated cells. Three independent biological replicates are plotted. d-g, Immunoblot analysis of HPAF-II cells transduced with sgAAVS1 (control), sgIRF3 (panel d), sgSTAT1 (panel e), sgSTAT2 (panel f), or sgRELA (panel g). GAPDH was used as a loading control. Relates to Fig. 3h. h,i, mRNA expression levels of A3C and A3D following treatment of Panc 08.13 (panel h) or Panc 10.05 (panel i) with the indicated DNA damaging and replication stress-inducing agents for 72 hours. Expression levels were measured by RT-qPCR and normalized to ACTB mRNA. Drug concentrations used were 500 nM gemcitabine, 5 µM cytarabine, 5 µM decitabine, 5 µM 5’azacytidine, 500 µM hydroxyurea, 1 µM cisplatin, 25 nM camptothecin, 2.5 µM AZD6738, 100 nM etoposide, 500 nM talazoparib, and 50 µM 5-fluorouracil. Cytidine analogues are indicated on each plot. Dashed line represents no expression level changes (fold-change of one), and bars represent the means of the replicates. Data is from two biological replicates.
Extended Data Fig. 5. A3C and A3D do not modulate gemcitabine resistance by activation of the innate immune response in pancreatic cancer cells.

a, Immunoblot analysis of phosphoSTAT1 Tyr701 in Panc 08.13 cells treated with 1 µM gemcitabine for 0, 24, 48, or 72 hours. α-tubulin was used as a loading control. b, mRNA expression levels of interferon-stimulated genes (CCL5, ISG15, and ISG45) in HPAF-II-Cas9 cells transduced with a sgRNA targeting LacZ (control), A3C, or A3D following 500 nM gemcitabine treatment for 72 hours. Fold-change in mRNA expression of each interferon-stimulated gene in gemcitabine relative to untreated conditions is plotted. Three independent biological replicates are plotted, and bars represent the means of the replicates. Statistical support was determined using two-tailed unpaired t-tests. n.s., not significant (p > 0.05).
Extended Data Fig. 6. Cytidine deaminase assays with APOBEC3A and APOBEC3C.

a, SDS-PAGE of purified recombinant A3A, A3C, and deaminase-dead A3CC97S/C100S from expression in insect cells, visualized with Coomassie Blue. Data is representative of three biological replicates. Relates to Fig. 5b,c. b, Schematic of the PCR-based in vitro cytidine deaminase assay used to determine whether A3A or A3C can deaminate gemcitabine in ssDNA. Either of two ssDNA substrates (one containing a single deoxycytidine and other containing gemcitabine in place of the deoxycytidine) were incubated with A3A or A3C for 2 hours at 37°C. DNA substrates from the in vitro reactions were then used as templates for PCR amplification, where deamination of deoxycytidine or gemcitabine introduces an MseI restriction enzyme site upon amplification that is cleaved to identify A3A or A3C deamination. Restriction enzyme digest products are then resolved on a nondenaturing gel to reveal cytidine deamination. Relates to Fig. 5b,c. c, Representative images of the restriction digest products generated from the in vitro cytidine deaminase assays using 0, 100, or 250 nM deaminase-dead (C97S/C100S) A3C. Data is representative of three independent replicates. Relates to Fig. 5b.
Extended Data Fig. 7. APOBEC3C and APOBEC3D deaminate deoxycytidines in genomic DNA, but not intracellular deoxycytidine or gemcitabine nucleosides.

a, Different stages of intracellular metabolism at which gemcitabine can be deaminated, leading to its inactivation. Gemcitabine can be deaminated at the free base level (dFdC) to generate dFdU, which is the major mode of gemcitabine inactivation within cells, but can also be deaminated in its monophosphorylated form (dFdCMP) and after it is incorporated into genomic DNA. b, Standard curve for deaminated gemcitabine (dFdU) bases by LC/MS analysis to confirm the lack of dFdU in genomic DNA samples is not due to the sensitivity of the mass spectrometer. Relates to Fig. 5d. c, Quantification of gemcitabine bases in genomic DNA isolated from parental and A3C- and A3D-deficient HPAF-II cells following 500 nM or 1 µM gemcitabine treatment for 24 hours by LC/MS. Data is normalized to levels of 13C15N2-dFdC (heavy dFdC) spiked into each sample and is representative of three independent experiments. Bars represent the means of the replicates, and significance was determined using two-tailed unpaired t-tests. d-j, Quantification of intracellular deoxycytidine (dC, dU, dCMP, dUMP, dCTP, and dUTP) and gemcitabine (dFdCMP) bases or nucleosides from parental and A3C- and A3D-deficient HPAF-II cells treated with 500 nM gemcitabine for 4 or 24 hours by LC/MS. The reduction in dU, dUMP, and dCTP levels following gemcitabine treatment has been previously described and are due to the inhibition of ribonucleotide reductase and thymidylate synthetase, respectively. Three biological replicates are plotted, and bars represent the means of the replicates. Statistical significance was assessed using two-tailed unpaired t-tests. k, Immunoblot analysis of HPAF-II cells engineered to disrupt the uracil DNA glycosylase gene UNG to allow for improved detection of nascent genomic uracils. α-tubulin was used as a loading control. l, Quantification of colony formation of HPAF-II-Cas9 cells transduced with a sgRNA targeting LacZ (control), A3C, or A3D. Cells were treated with 1 µM hydroxyurea for 14 days before colonies were stained and counted. Bars indicate the means of the two biological replicates.
Extended Data Fig. 8. APOBEC3C or APOBEC3D inactivation increases DNA replication stress in pancreatic cancer cells, but not in non-transformed cells.

a, Immunoblot analysis of RPA2 in HPAF-II-Cas9 cells transduced with sgLacZ (control), sgA3C, or sgA3D. Cells were treated with 1 µM gemcitabine for 24 hours and recovered for 0, 24, 48, or 72 hours prior to assessing replication stress response activation. α-tubulin was used as a loading control. Data is representative of three independent replicates. b, Quantification of chromatin-bound S phase RPA2 fluorescence intensity in parental and A3C- and A3D-deficient HPAF-II cells treated with 1 µM gemcitabine treatment for 24 hours. Three independent experiments are plotted. Relates to Fig. 6a. c-d, RPE1-hTERT-Cas9 p53−/− cells transduced with sgAAVS1 (control), sgA3C, or sgA3D were treated with 1 µM gemcitabine for 24 hours and chromatin-bound RPA2 fluorescence intensity was measured for each of three independent replicates. A minimum of 21 000 cells were analyzed per sample. Center lines represent the median and box limits indicate the 25th and 75th percentiles of each sample. Whiskers extend 1.5x the interquartile range and individual data points indicate outliers. Quantification of each of the three biological replicates are shown in panel d. e, Median RPA2 intensity in RPE1-hTERT-Cas9 p53−/− cells transduced with sgAAVS1, sgA3C, or sgA3D following 24 hour treatment with 1 µM gemcitabine. Three biological replicates are plotted. Circles with black borders represent the median of each replicate and black bars represent the median and first and last quartiles of all replicates. Untreated: n = 988 (sgAAVS1), n = 1204 (sgA3C), n = 924 (sgA3D). Gemcitabine-treated: n = 791 (sgAAVS1), n = 808 (sgA3C), n = 749 (sgA3D). A minimum of 216 cells were measured per replicate. f, Analysis of 53BP1 nuclear bodies in EdU-negative parental and A3C- and A3D-deficient HPAF-II cells following 24 hour treatment with 1 µM gemcitabine. Circles with black outlines represent the median of each replicate and black bars represent the median and first and last quartiles of all three replicates. Untreated: n = 1558 (parental), n = 1831 (A3C-deficient), n = 1605 (A3D-deficient). Gemcitabine-treated: n = 2113 (parental), n = 1784 (A3C-deficient), n = 1983 (A3D-deficient). A minimum of 316 cells were measured per replicate. g, Analysis of fluorescence intensity of chromatin-bound 53BP1 in parental and A3C- and A3D-deficient HPAF-II G1 cells treated with 1 µM gemcitabine for 24 hours. Three biological replicates are plotted. Relates to Fig. 6b. h, Representative flow cytometry plots for EdU incorporation in parental and A3C- and A3D-deficient HPAF-II cells following treatment with 1 µM gemcitabine for 24 hours. Relates to Fig. 6d. i, Percentage of parental and A3C- and A3D-deficient HPAF-II cells in each cell cycle phase following treatment with 1 µM gemcitabine for 24 hours. Three independent replicates are plotted. Bars for each cell cycle stage represent the means of the replicates, with the error bars showing the standard deviation. j, DNA combing analysis of RPE1-hTERT-Cas9 p53−/− cells transduced with sgAAVS1, sgA3C, or sgA3D. Cells were pulsed with CldU for 30 minutes, followed by a pulse with IdU for 30 minutes in the presence or absence of 500 nM gemcitabine. Untreated: n = 251 (sgAAVS1), n = 240 (sgA3C), n = 280 (sgA3D). Gemcitabine-treated: n = 232 (sgAAVS1), n = 209 (sgA3C), n = 259 (sgA3D). Statistical support was assessed using a two-tailed unpaired Mann-Whitney U test. k, Replication fork re-start assay in control (sgAAVS1) and A3C- and A3D-deficient RPE1-hTERT-Cas9 p53−/− cells. Cells were pulsed with CldU for 30 minutes, followed by treatment with 1 µM gemcitabine for 30 minutes and a 30 minute IdU pulse in drug-free media to assess the ability of replication forks to re-start DNA synthesis following gemcitabine. Quantification of elongated and stalled replication forks upon gemcitabine recovery is displayed. A total of n = 538 (sgAAVS1), n = 508 (sgA3C), and n = 480 (sgA3D) replication tracks were quantified per sample, with a minimum of 200 replication tracks analyzed for each of two biological replicates.
Extended Data Fig. 9. Analysis of base excision repair-, RAD51-, and translesion synthesis-mediated replication fork re-start following gemcitabine treatment.

a, Immunoblot analysis of HMCES in HPAF-II-Cas9 cells transduced with sgAAVS1 (control) or sgHMCES. α-tubulin was used as a loading control. b, Viability of HPAF-II-Cas9 cells transduced with sgAAVS1 or sgHMCES and treated with a range of gemcitabine concentrations for 72 hours. CellTiter-Glo was used to measure cell viability. Three independent biological replicates are plotted. Circles represent the means of the replicates and error bars indicate the standard deviations. c, Replication fork re-start assay in wildtype and HMCES-deficient HPAF-II cells. Cells were pulsed with CldU for 30 minutes, followed by treatment with 1 µM gemcitabine for 30 minutes and a 30 minute IdU pulse to assess the ability of replication forks to re-start DNA synthesis following gemcitabine treatment. A total of n = 585 (wildtype), n = 510 (HMCES-1-deficient), and n = 593 (HMCES-2-deficient) replication tracks were quantified, with a minimum of 229 replication tracks analyzed per sample for each replicate. Quantification of elongated and stalled replication forks upon gemcitabine recovery is plotted. Bars indicate the means of the replicates. d, Cell viability analyses of HPAF-II-Cas9 cells transduced with sgLacZ (control), sgSMUG1, sgAPEX1, or sgAPEX2 and treated with the indicated gemcitabine concentrations for 72 hours, measured by CellTiter-Glo. Data from three independent replicates are plotted, with circles and error bars representing the means and standard deviations of the replicates. e, Representative micrographs of EdU-positive RAD51 foci in parental and A3C- and A3D-deficient HPAF-II cells following 1 µM gemcitabine treatment quantified in Fig. 6i. Scale bars, 10 µm. f, Median number of S phase RAD51 foci in each biological replicate of the experiments performed in Fig. 6i. g, Analysis of S phase (EdU-positive) RAD51 foci in parental and A3C- and A3D-deficient HPAF-II cells following 5 µM mitomycin C treatment for 24 hours. The number of RAD51 foci per cell are plotted, where circles with black outlines indicate the median of each replicate and black bars represent the median and first and last quartiles of all three replicates. Untreated: n = 1787 (parental), n = 1073 (A3C-deficient), n = 1058 (A3D-deficient). Mitomycin C: n = 1044 (parental), n = 718 (A3C-deficient), n = 636 (A3D-deficient). A minimum of 201 cells were analyzed per biological replicate. Statistical support was assessed using a two-tailed unpaired Mann-Whitney U test. n.s., not significant (p > 0.05). h, Quantification of S phase (EdU-positive) 53BP1 foci in parental and A3C- and A3D-deficient HPAF-II cells following 1 µM gemcitabine for 24 hours. Circles with black outlines represent the median of each replicate and black bars represent the median and first and last quartiles of all three replicates. Untreated: n = 843 (parental), n = 847 (A3C-deficient), n = 761 (A3D-deficient). Gemcitabine: n = 935 (parental), n = 960 (A3C-deficient), n = 847 (A3D-deficient). Two-tailed unpaired Mann-Whitney U tests were used to determine statistical significance and asterisks (***) indicate a p-value < 0.001 in each of the three independent experiments. n.s., not significant (p > 0.05). i, Immunoblot analysis of POLH in HPAF-II-Cas9 cells transduced with sgAAVS1 or sgPOLH. α-tubulin was used as a loading control. Data is representative of three independent replicates. Related to Fig. 6j,k.
Supplementary Material
Acknowledgements
We thank Stéphane Angers (University of Toronto) for the Cas9 stable HPAF-II, AsPC-1, and BxPC-3 cell lines, Daniel Durocher (LTRI) for the RPE1-hTERT-Cas9 p53−/− cell line and the lentiGuide-NLS-eGFP and lentiGuide-NLS-mCherry plasmids, Haley Wyatt (University of Toronto) for the Sf9 and Hi5 insect cell lines, Linda Chelico (University of Sakatchewan) for A3C purification advice, and the Donnelly Sequencing Centre at the University of Toronto for performing Illumina sequencing. Pancreatic tumor RNA expression data from the ICGC PACA-CA and COMPASS trial cohorts were generated by the Ontario Institute for Cancer Research (PanCuRx Translational Research Initiative) through funding provided by the Government of Ontario, the Wallace McCain Centre for Pancreatic Cancer supported by the Princess Margaret Cancer Foundation, the Terry Fox Research Institute, the Canadian Cancer Society Research Institute, Pancreatic Cancer Canada, and a charitable donation from the Canadian Friends of the Hebrew University (Alex U. Soyka). TU was supported by an Ontario Graduate Scholarship and a Frederick Banting and Charles Best Canadian Institutes of Health Research Doctoral Award. JM was supported by the Canadian Institutes of Health Research (PJT-463531) and holds the GlaxoSmithKline Chair in Genetics and Genome Biology at the Hospital for Sick Children. AB’s project no. FK137867 has been implemented with support provided by the Ministry for Culture and Innovation of Hungary from the National Research, Development and Innovation Fund, financed under the OTKA_FK_21 funding scheme. AB was also supported by the János Bolyai Research Scholarship of the Hungarian Academy of Science (BO/726/22/8) and by the ÚNKP-22-5-BME-295 New National Excellence Program of the Ministry for Culture and Innovation from the source of the National Research, Development and Innovation Fund. BGV was supported by the National Research, Development and Innovation Fund of Hungary (K135231, NKP-2018-1.2.1-NKP-2018-00005) and the TKP2021-EGA-02 grant, implemented with support provided by the Ministry for Innovation and Technology of Hungary from the National Research, Development and Innovation Fund. DAT is supported by the Lustgarten Foundation, where DAT is a distinguished scholar and Director of the Lustgarten Foundation–designated Laboratory of Pancreatic Cancer Research. DAT is also supported by the Thompson Foundation, the Cold Spring Harbor Laboratory and Northwell Health Affiliation, the Northwell Health Tissue Donation Program, the Cold Spring Harbor Laboratory Association, the National Institutes of Health (5P30CA45508, U01CA210240, R01CA229699, U01CA224013, 1R01CA188134, and 1R01CA190092), and by a gift from the Simons Foundation (552716). HLR was funded by the Canadian Institutes of Health Research (FRN 166094) and Canada Foundation for Innovation (grant 37660). GWB is a Tier I Canada Research Chair and was supported by the Canadian Cancer Society (Innovate grant 706293), the Canadian Institutes of Health Research (FDN-159913), and the Ontario Institute for Cancer Research (P.CTIP.1005). We are grateful to work on the lands of the Mississaugas of the Credit, the Anishnaabeg, the Haudenosaunee, and the Wendat peoples, land that is now home to many diverse First Nations, Inuit, and Métis peoples.
Competing interests
DAT receives stock options from Leap Therapeutics, Surface Oncology, Sonata Therapeutics, and Mestag Therapeutics outside of the published work. DAT is scientific co-founder of Mestag Therapeutics. DAT has received research grant support from the Fibrogen, Mestag, and ONO Therapeutics. DAT receives grant funding from the Lustgarten Foundation, the NIH, and the Thompson Foundation. None of this work is related to the publication. TU and GWB were consultants for Repare Therapeutics. GWB received research support from Repare Therapeutics. No competing interests were reported by the remaining authors.
Data availability
FASTQ files from Illumina sequencing of the CRISPR-Cas9 screens have been deposited in the NCBI Sequence Read Archive (https://www.ncbi.nlm.nih.gov/sra; study accession PRJNA844572). RNA-seq data for the ICGC-PACA samples is available from the ICGC data portal (https://dcc.icgc.org/releases/release_28/Projects/PACA-CA), and at https://ega-archive.org/datasets/EGAD00001006081 for samples from the COMPASS clinical trial cohort. RNA expression data for PDAC cell lines and organoids is available from the Broad Institute’s DepMap portal (DepMap CCLE Public 23Q2; https://depmap.org/portal/download/) and the TCGA data portal (https://portal.gdc.cancer.gov/projects/TCGA-PAAD) for PDAC tumors. Source data for Figs. 1–7 and Extended Data Figs. 1-9 are available with this article. Further information on research design and software is available in the Nature Research Reporting Summary linked to this article. All other data supporting the findings of this study are available from the corresponding author upon reasonable request.
Code availability
No non-standard code was used to generate, analyze, or plot any of the data presented in this study.
References
- 1.Gorgoulis VG et al. Activation of the DNA damage checkpoint and genomic instability in human precancerous lesions. Nature 434, 907–913 (2005). [DOI] [PubMed] [Google Scholar]
- 2.Bartkova J et al. DNA damage response as a candidate anti-cancer barrier in early human tumorigenesis. Nature 434, 864–870 (2005). [DOI] [PubMed] [Google Scholar]
- 3.Knijnenburg TA et al. Genomic and molecular landscape of DNA damage repair deficiency across The Cancer Genome Atlas. Cell Reports 23, 239–254 (2018). [DOI] [PMC free article] [PubMed] [Google Scholar]
- 4.Ubhi T & Brown GW Exploiting DNA replication stress for cancer treatment. Cancer Research 79, 1730–1739 (2019). [DOI] [PubMed] [Google Scholar]
- 5.Hertel LW et al. Evaluation of the antitumor activity of gemcitabine (2’,2’-difluoro-2’-deoxycytidine). Cancer Research 50, 4417–22 (1990). [PubMed] [Google Scholar]
- 6.Heinemann V et al. Inhibition of ribonucleotide reduction in CCRF-CEM cells by 2’,2’-difluorodeoxycytidine. Molecular Pharmacology 38, 567–572 (1990). [PubMed] [Google Scholar]
- 7.Huang P, Chubb S, Hertel LW, Grindey GB & Plunkett W Action of 2’,2’-difluorodeoxycytidine on DNA synthesis. Cancer Research 51, 6110–6117 (1991). [PubMed] [Google Scholar]
- 8.Jones RM, Kotsantis P, Stewart GS, Groth P & Petermann E BRCA2 and RAD51 promote double-strand break formation and cell death in response to gemcitabine. Molecular Cancer Therapeutics 13, 2412–2421 (2014). [DOI] [PMC free article] [PubMed] [Google Scholar]
- 9.George JW, Bessho M & Bessho T Inactivation of XPF sensitizes cancer cells to gemcitabine. Journal of Nucleic Acids 2019, 6357609 (2019). [DOI] [PMC free article] [PubMed] [Google Scholar]
- 10.Smith SC et al. A gemcitabine sensitivity screen identifies a role for NEK9 in the replication stress response. Nucleic Acids Research 42, 11517–11527 (2014). [DOI] [PMC free article] [PubMed] [Google Scholar]
- 11.Tsai MS, Kuo YH, Chiu YF, Su YC & Lin YW Down-regulation of Rad51 expression overcomes drug resistance to gemcitabine in human non–small-cell lung cancer cells. Journal of Pharmacology and Experimental Therapeutics 335, 830–840 (2010). [DOI] [PubMed] [Google Scholar]
- 12.Parvathaneni S & Sharma S The DNA repair helicase RECQ1 has a checkpoint-dependent role in mediating DNA damage responses induced by gemcitabine. Journal of Biological Chemistry 294, 15330–15345 (2019). [DOI] [PMC free article] [PubMed] [Google Scholar]
- 13.Von Hoff DD et al. Increased survival in pancreatic cancer with nab-paclitaxel plus gemcitabine. New England Journal of Medicine 369, 1691–1703 (2013). [DOI] [PMC free article] [PubMed] [Google Scholar]
- 14.Klanova M et al. Downregulation of deoxycytidine kinase in cytarabine-resistant mantle cell lymphoma cells confers cross-resistance to nucleoside analogs gemcitabine, fludarabine and cladribine, but not to other classes of anti-lymphoma agents. Molecular Cancer 13, 159 (2014). [DOI] [PMC free article] [PubMed] [Google Scholar]
- 15.Karnitz LM et al. Gemcitabine-induced activation of checkpoint signaling pathways that affect tumor cell survival. Mol Pharmacol 68, 1636–1644 (2005). [DOI] [PubMed] [Google Scholar]
- 16.Hopkins JF et al. Mutations in mitochondrial DNA from pancreatic ductal adenocarcinomas associate with survival times of patients and accumulate as tumors progress. Gastroenterology 154, 1620–1624.e5 (2018). [DOI] [PubMed] [Google Scholar]
- 17.Hudson TJ et al. International network of cancer genome projects. Nature 464, 993–998 (2010). [DOI] [PMC free article] [PubMed] [Google Scholar]
- 18.Dungrawala H et al. The replication checkpoint prevents two types of fork collapse without regulating replisome stability. Molecular Cell 59, 998–1010 (2015). [DOI] [PMC free article] [PubMed] [Google Scholar]
- 19.Rodríguez MG, Flath B & Chelico L The interesting relationship between APOBEC3 deoxycytidine deaminases and cancer: a long road ahead. Open Biology 10, 200188 (2020). [DOI] [PMC free article] [PubMed] [Google Scholar]
- 20.Buisson R, Lawrence MS, Benes CH & Zou L APOBEC3A and APOBEC3B activities render cancer cells susceptible to ATR inhibition. Cancer Research 77, 4567–4578 (2017). [DOI] [PMC free article] [PubMed] [Google Scholar]
- 21.Venkatesan S et al. Induction of APOBEC3 exacerbates DNA replication stress and chromosomal instability in early breast and lung cancer evolution. Cancer Discovery 11, 2456–2473 (2021). [DOI] [PMC free article] [PubMed] [Google Scholar]
- 22.Wörmann SM et al. APOBEC3A drives deaminase domain-independent chromosomal instability to promote pancreatic cancer metastasis. Nature Cancer 2, 1338–1356 (2021). [DOI] [PubMed] [Google Scholar]
- 23.Langenbucher A et al. An extended APOBEC3A mutation signature in cancer. Nature Communications 12, 1602 (2021). [DOI] [PMC free article] [PubMed] [Google Scholar]
- 24.Petljak M et al. Mechanisms of APOBEC3 mutagenesis in human cancer cells. Nature 607, 799–807 (2022). [DOI] [PMC free article] [PubMed] [Google Scholar]
- 25.Caswell DR et al. The role of APOBEC3B in lung tumor evolution and targeted cancer therapy resistance. Nature Genetics 56, 60–73 (2024). [DOI] [PMC free article] [PubMed] [Google Scholar]
- 26.Law EK et al. The DNA cytosine deaminase APOBEC3B promotes tamoxifen resistance in ER-positive breast cancer. Science Advances 2, e1601737 (2016). [DOI] [PMC free article] [PubMed] [Google Scholar]
- 27.Isozaki H et al. Therapy-induced APOBEC3A drives evolution of persistent cancer cells. Nature 620, 393–401 (2023). [DOI] [PMC free article] [PubMed] [Google Scholar]
- 28.Nowarski R et al. APOBEC3G enhances lymphoma cell radioresistance by promoting cytidine deaminase-dependent DNA repair. Blood 120, 366–375 (2012). [DOI] [PMC free article] [PubMed] [Google Scholar]
- 29.Britan-Rosich Y et al. APOBEC3G protects the genome of human cultured cells and mice from radiation-induced damage. The FEBS Journal 290, 1822–1839 (2023). [DOI] [PMC free article] [PubMed] [Google Scholar]
- 30.Qian Y et al. Aberrant APOBEC3C expression induces characteristic genomic instability in pancreatic ductal adenocarcinoma. Oncogenesis 11, 35 (2022). [DOI] [PMC free article] [PubMed] [Google Scholar]
- 31.Peng G, Ke JL, Jin W, Greenwell-Wild T & Wahl SM Induction of APOBEC3 family proteins, a defensive maneuver underlying interferon-induced anti–HIV-1 activity. Journal of Experimental Medicine 203, 41–46 (2006). [DOI] [PMC free article] [PubMed] [Google Scholar]
- 32.Argyris EG et al. The IFN-induced expression of APOBEC3G in human blood brain barrier exerts a potent intrinsic immunity to block HIV-1 entry to central nervous system. Virology 367, 440 (2007). [DOI] [PMC free article] [PubMed] [Google Scholar]
- 33.Stenglein MD, Burns MB, Li M, Lengyel J & Harris RS APOBEC3 proteins mediate the clearance of foreign DNA from human cells. Nature Structural and Molecular Biology 17, 222–229 (2010). [DOI] [PMC free article] [PubMed] [Google Scholar]
- 34.Wang Z et al. APOBEC3 deaminases induce hypermutation in human papillomavirus 16 DNA upon beta interferon stimulation. Journal of Virology 88, 1308–1317 (2014). [DOI] [PMC free article] [PubMed] [Google Scholar]
- 35.Niocel M, Appourchaux R, Nguyen XN, Delpeuch M & Cimarelli A The DNA damage induced by the cytosine deaminase APOBEC3A leads to the production of ROS. Scientific Reports 2019 9, 4714 (2019). [DOI] [PMC free article] [PubMed] [Google Scholar]
- 36.Conner KL et al. APOBEC3 enzymes mediate efficacy of cisplatin and are epistatic with base excision repair and mismatch repair in platinum response. NAR Cancer 2, zcaa033 (2021). [DOI] [PMC free article] [PubMed] [Google Scholar]
- 37.Oh S et al. Genotoxic stress and viral infection induce transient expression of APOBEC3A and pro-inflammatory genes through two distinct pathways. Nature Communications 12, 4917 (2021). [DOI] [PMC free article] [PubMed] [Google Scholar]
- 38.Kanu N et al. DNA replication stress mediates APOBEC3 family mutagenesis in breast cancer. Genome Biology 17, 185 (2016). [DOI] [PMC free article] [PubMed] [Google Scholar]
- 39.Tao L, Jiang Z, Xu M, Xu T & Liu Y Induction of APOBEC3C facilitates the genotoxic stress-mediated cytotoxicity of artesunate. Chemical Research in Toxicology 32, 2526–2537 (2019). [DOI] [PubMed] [Google Scholar]
- 40.Lin L et al. Comprehensive mapping of key regulatory networks that drive oncogene expression. Cell Reports 33, 108426 (2020). [DOI] [PMC free article] [PubMed] [Google Scholar]
- 41.Botvinnik A et al. APOBEC3G rescues cells from the deleterious effects of DNA damage. The FEBS Journal 288, 6063–6077 (2021). [DOI] [PubMed] [Google Scholar]
- 42.Constantin D, Dubuis G, Conde-Rubio M. del C. & Widmann C APOBEC3C, a nucleolar protein induced by genotoxins, is excluded from DNA damage sites. The FEBS Journal 289, 808–831 (2022). [DOI] [PMC free article] [PubMed] [Google Scholar]
- 43.Wijesinghe P & Bhagwat AS Efficient deamination of 5-methylcytosines in DNA by human APOBEC3A, but not by AID or APOBEC3G. Nucleic Acids Research 40, 9206 (2012). [DOI] [PMC free article] [PubMed] [Google Scholar]
- 44.Schutsky EK, Nabel CS, Davis AKF, DeNizio JE & Kohli RM APOBEC3A efficiently deaminates methylated, but not TET-oxidized, cytosine bases in DNA. Nucleic Acids Research 45, 7655–7665 (2017). [DOI] [PMC free article] [PubMed] [Google Scholar]
- 45.Buisson R et al. Passenger hotspot mutations in cancer driven by APOBEC3A and mesoscale genomic features. Science 364, eaaw2872 (2019). [DOI] [PMC free article] [PubMed] [Google Scholar]
- 46.Neff T & Blau CA Forced expression of cytidine deaminase confers resistance to cytosine arabinoside and gemcitabine. Experimental Hematology 24, 1340–1346 (1996). [PubMed] [Google Scholar]
- 47.Frese KK et al. Nab-paclitaxel potentiates gemcitabine activity by reducing cytidine deaminase levels in a mouse model of pancreatic cancer. Cancer Discovery 2, 260–269 (2012). [DOI] [PMC free article] [PubMed] [Google Scholar]
- 48.Pecori R, Di Giorgio S, Paulo Lorenzo J & Nina Papavasiliou F Functions and consequences of AID/APOBEC-mediated DNA and RNA deamination. Nature Reviews Genetics 23, 505–518 (2022). [DOI] [PMC free article] [PubMed] [Google Scholar]
- 49.Róna G et al. Detection of uracil within DNA using a sensitive labeling method for in vitro and cellular applications. Nucleic Acids Research 44, e28 (2016). [DOI] [PMC free article] [PubMed] [Google Scholar]
- 50.Mohni KN et al. HMCES maintains genome integrity by shielding abasic sites in single-strand DNA. Cell 176, 144–153.e13 (2019). [DOI] [PMC free article] [PubMed] [Google Scholar]
- 51.Liu W et al. RAD51 bypasses the CMG helicase to promote replication fork reversal. Science 380, 382–387 (2023). [DOI] [PMC free article] [PubMed] [Google Scholar]
- 52.Thompson PS & Cortez D New insights into abasic site repair and tolerance. DNA Repair 90, 102866 (2020). [DOI] [PMC free article] [PubMed] [Google Scholar]
- 53.Chen YW, Cleaver JE, Hanaoka F, Chang CF & Chou KM A novel role of DNA polymerase eta in modulating cellular sensitivity to chemotherapeutic agents. Molecular Cancer Research 4, 257–265 (2006). [DOI] [PubMed] [Google Scholar]
- 54.Huttlin EL et al. Dual proteome-scale networks reveal cell-specific remodeling of the human interactome. Cell 184, 3022–3040.e28 (2021). [DOI] [PMC free article] [PubMed] [Google Scholar]
- 55.Hultquist JF et al. Human and Rhesus APOBEC3D, APOBEC3F, APOBEC3G, and APOBEC3H demonstrate a conserved capacity to restrict Vif-deficient HIV-1. Journal of Virology 85, 11220–11234 (2011). [DOI] [PMC free article] [PubMed] [Google Scholar]
- 56.Lackey L, Law EK, Brown WL & Harris RS Subcellular localization of the APOBEC3 proteins during mitosis and implications for genomic DNA deamination. Cell Cycle 12, 762–772 (2013). [DOI] [PMC free article] [PubMed] [Google Scholar]
- 57.Takei H et al. Alternative splicing of APOBEC3D generates functional diversity and its role as a DNA mutator. International Journal of Hematology 112, 395–408 (2020). [DOI] [PMC free article] [PubMed] [Google Scholar]
- 58.Oughtred R et al. The BioGRID database: A comprehensive biomedical resource of curated protein, genetic, and chemical interactions. Protein Science 30, 187–200 (2021). [DOI] [PMC free article] [PubMed] [Google Scholar]
- 59.Mehta KPM, Lovejoy CA, Zhao R, Heintzman DR & Cortez D HMCES maintains replication fork progression and prevents double-strand breaks in response to APOBEC deamination and abasic site formation. Cell Reports 31, 107705 (2020). [DOI] [PMC free article] [PubMed] [Google Scholar]
- 60.Talluri S et al. Dysregulated APOBEC3G causes DNA damage and promotes genomic instability in multiple myeloma. Blood Cancer Journal 11, 1–11 (2021). [DOI] [PMC free article] [PubMed] [Google Scholar]
Methods-only references
- 61.Tiriac H et al. Organoid profiling identifies common responders to chemotherapy in pancreatic cancer. Cancer Discovery 8, 1112–1129 (2018). [DOI] [PMC free article] [PubMed] [Google Scholar]
- 62.Noordermeer SM et al. The shieldin complex mediates 53BP1-dependent DNA repair. Nature 560, 117–121 (2018). [DOI] [PMC free article] [PubMed] [Google Scholar]
- 63.Olivieri M et al. A genetic map of the response to DNA damage in human cells. Cell 182, 481–496 (2020). [DOI] [PMC free article] [PubMed] [Google Scholar]
- 64.Kim E & Hart T Improved analysis of CRISPR fitness screens and reduced off-target effects with the BAGEL2 gene essentiality classifier. Genome Medicine 13, 1–11 (2021). [DOI] [PMC free article] [PubMed] [Google Scholar]
- 65.Mi H, Muruganujan A, Casagrande JT & Thomas PD Large-scale gene function analysis with the PANTHER classification system. Nature Protocols 8, 1551–1566 (2013). [DOI] [PMC free article] [PubMed] [Google Scholar]
- 66.Supek F, Bošnjak M, Škunca N & Šmuc T REVIGO summarizes and visualizes long lists of gene ontology terms. PLOS ONE 6, e21800 (2011). [DOI] [PMC free article] [PubMed] [Google Scholar]
- 67.Bookout AL, Cummins CL, Mangelsdorf DJ, Pesola JM & Kramer MF High-throughput real-time quantitative reverse transcription PCR. Current Protocols in Molecular Biology 73, 15.8.1–15.8.28 (2006). [DOI] [PubMed] [Google Scholar]
- 68.Connor AA et al. Integration of genomic and transcriptional features in pancreatic cancer reveals increased cell cycle progression in metastases. Cancer Cell 35, 267–282.e7 (2019). [DOI] [PMC free article] [PubMed] [Google Scholar]
- 69.Chan-Seng-Yue M et al. Transcription phenotypes of pancreatic cancer are driven by genomic events during tumor evolution. Nature Genetics 52, 231–240 (2020). [DOI] [PubMed] [Google Scholar]
- 70.O’Kane GM et al. GATA6 expression distinguishes classical and basal-like subtypes in advanced pancreatic cancer. Clinical Cancer Research 26, 4901–4910 (2020). [DOI] [PubMed] [Google Scholar]
- 71.Jaguva Vasudevan AA et al. Enhancing the catalytic deamination activity of APOBEC3C is insufficient to inhibit Vif-deficient HIV-1. Journal of Molecular Biology 429, 1171–1191 (2017). [DOI] [PubMed] [Google Scholar]
- 72.Crain PF Preparation and enzymatic hydrolysis of DNA and RNA for mass spectrometry. Methods in Enzymology 193, 782–790 (1990). [DOI] [PubMed] [Google Scholar]
- 73.Bapiro TE et al. A novel method for quantification of gemcitabine and its metabolites 2′,2′-difluorodeoxyuridine and gemcitabine triphosphate in tumour tissue by LC-MS/MS: Comparison with 19 F NMR spectroscopy. Cancer Chemotherapy and Pharmacology 68, 1243–1253 (2011). [DOI] [PMC free article] [PubMed] [Google Scholar]
- 74.Pálinkás HL et al. Genome-wide alterations of uracil distribution patterns in human DNA upon chemotherapeutic treatments. eLife 9, e60498 (2020). [DOI] [PMC free article] [PubMed] [Google Scholar]
- 75.Horváth A & Vértessy BG A one-step method for quantitative determination of uracil in DNA by real-time PCR. Nucleic Acids Research 38, e196 (2010). [DOI] [PMC free article] [PubMed] [Google Scholar]
- 76.O’Brien S et al. FBXW7-loss sensitizes cells to ATR inhibition through induced mitotic catastrophe. Cancer Research Communications 3, 2596–2607 (2023). [DOI] [PMC free article] [PubMed] [Google Scholar]
- 77.Gallo D, Wang G, Yip CM & Brown GW Analysis of replicating yeast chromosomes by DNA combing. Cold Spring Harbor Protocols 2016, pdp.prot085118 (2016). [DOI] [PubMed] [Google Scholar]
- 78.Yvon A-MC, Wadsworth P & Jordan MA Taxol suppresses dynamics of individual microtubules in living human tumor cells. Molecular Biology of the Cell 10, 947–959 (1999). [DOI] [PMC free article] [PubMed] [Google Scholar]
- 79.Weiss J et al. Optimizing drug response study design in patient-derived tumor xenografts. Cancer Informatics 21, 11769351221136056 (2022). [DOI] [PMC free article] [PubMed] [Google Scholar]
- 80.Gallo D et al. CCNE1 amplification is synthetic lethal with PKMYT1 kinase inhibition. Nature 604, 749–756 (2022). [DOI] [PMC free article] [PubMed] [Google Scholar]
Associated Data
This section collects any data citations, data availability statements, or supplementary materials included in this article.
Supplementary Materials
Data Availability Statement
FASTQ files from Illumina sequencing of the CRISPR-Cas9 screens have been deposited in the NCBI Sequence Read Archive (https://www.ncbi.nlm.nih.gov/sra; study accession PRJNA844572). RNA-seq data for the ICGC-PACA samples is available from the ICGC data portal (https://dcc.icgc.org/releases/release_28/Projects/PACA-CA), and at https://ega-archive.org/datasets/EGAD00001006081 for samples from the COMPASS clinical trial cohort. RNA expression data for PDAC cell lines and organoids is available from the Broad Institute’s DepMap portal (DepMap CCLE Public 23Q2; https://depmap.org/portal/download/) and the TCGA data portal (https://portal.gdc.cancer.gov/projects/TCGA-PAAD) for PDAC tumors. Source data for Figs. 1–7 and Extended Data Figs. 1-9 are available with this article. Further information on research design and software is available in the Nature Research Reporting Summary linked to this article. All other data supporting the findings of this study are available from the corresponding author upon reasonable request.