Abstract
The prediction of functional sites in newly solved protein structures is a challenge for computational structural biology. Most methods for approaching this problem use evolutionary conservation as the primary indicator of the location of functional sites. However, sequence conservation reflects not only evolutionary selection at functional sites to maintain protein function, but also selection throughout the protein to maintain the stability of the folded state. To disentangle sequence conservation due to protein functional constraints from sequence conservation due to protein structural constraints, we use all atom computational protein design methodology to predict sequence profiles expected under solely structural constraints, and to compute the free energy difference between the naturally occurring amino acid and the lowest free energy amino acid at each position. We show that functional sites are more likely than non-functional sites to have computed sequence profiles which differ significantly from the naturally occurring sequence profiles and to have residues with sub-optimal free energies, and that incorporation of these two measures improves sequence based prediction of protein functional sites. The combined sequence and structure based functional site prediction method has been implemented in a publicly available web server.
INTRODUCTION
The prediction of functional sites in newly solved protein structures is an important challenge for structural genomics in which protein structures are determined without knowledge of the function. Most methods for functional site identification utilize measures of amino acid sequence conservation in homologous sequences (1–4), based on the assumption that functional sites are relatively conserved during evolution. Protein structural information has also been used to help identify protein functional sites (5–9).
A problem with sequence based methods for predicting functional sites is that residues may be conserved due to structural constraints which can confound the accurate prediction of functional sites (10). Fortunately, there has been considerable progress in recent years in the development of methods for identifying structural constraints on protein sequences. Computational methods have been developed for estimating the free energy changes upon amino acid substitutions using simple physically based potential functions (11,12), which have allowed the pinpointing of critical residues at protein–protein interfaces (12). These energy functions have also been tested in computational protein design (13,14) of proteins with novel structures (15) and functions (16). In the context of this paper, the important aspect of these methods is that they make possible the analysis of structural constraints on protein evolution independent of consideration of protein function.
In this paper, we describe a protein functional site prediction method which distinguishes functional and structural constraints on protein evolution using all atom computational protein design methodology (12,13). Proteins evolved under selective pressure to both maintain the stability of the overall structure and biochemical function. In principle, if we can separate the structure-based selective pressure from function-based selective pressure, we should be able to distinguish the functionally important residues from the structurally important residues. Earlier computational work along these lines includes the use of a low resolution protein design method in which protein side chain interactions are described using the Miyazawa–Jernigan contact potential to identify those aspects of evolutionary conservation which are likely to reflect structural constraints (17), the use of the change in electrostatic energy (18) upon in silico mutation to identify functional sites, and the use of measures of structural fitness and conservation to identify sites potentially conserved due to structural constraints (19). Complementary experimental studies have shown that mutations of functional studies can actually increase protein stability (20,21). Here, we build on these ideas, and use the Rosetta all atom computational protein design (13) and free energy calculation (12) methodologies to obtain measurements of the structural constraints in a protein structure, and show that combining these measures with sequence conservation improves prediction of protein functional sites. The algorithm has been implemented in a publicly available web server at http://tools.bakerlab.org/~gcheng/.
MATERIALS AND METHODS
Enzyme active site set
We used an enzyme active site set compiled in Janet Thornton's group (22) described previously. Duplicated entries were deleted and proteins with few known homologous sequences (<20) were removed from the test set. For testing the discriminatory power of our method, this set was further divided into a training set (78 proteins) and a test set (314 proteins).
Sequence alignment
Homologous sequences were gathered using five rounds of PSI-BLAST against a 90% non-redundant protein database (23), with an E-value cut-off of 1E-10. MUSCLE (24) was used to align the sequences. Sequences with <80% of the full length of the original sequences were removed from the alignment.
Sequence conservation score
Sequence conservation scores were evaluated with the SCORECONS (4) method using the multiple sequence alignment from MUSCLE as input.
Calculating the differences between designed and naturally occurring sequence profiles
The Rosetta design program was used to generate sequences predicted to be stable for each of the test proteins. Forty protein sequences were generated for each structure using Rosetta Design (9) and the PSI-blast software package was used to generate a position specific scoring matrix (PSSM) for the designed sequences as well as naturally occurring sequences. The Euclidian distance between the two PSSM's was computed for each residue, and rescaled within the range of 0–1 to provide comparable results across different proteins, with 0 corresponding to high similarity and 1 to low similarity.
Calculating native/optimal residue energy difference
The Rosetta ΔΔG module was used to calculate the free energy changes accompanying substitutions for each of the 20 amino acids at each position in the protein. The weight on the solvation term was increased 2-fold to capture a large fraction of the buried polar interactions which are frequently involved in function. Accurately estimating the tradeoff between the loss of solvation free energy and the formation of attractive polar interactions accompanying the burial of polar groups remains a challenge for computational modeling. The energy gap between the native amino acid and the lowest energy amino acid at each position was then determined.
Combining sequence conservation, natural/designed sequence profile difference, natural/optimal residue ΔΔG
Logistic regression with the generalized linear model module of R was used to determine weights on the sequence conservation, natural/designed sequence profile difference and natural/optimal residue free energy gap which optimize the separation between functional and non-functional residues.
WWW server
The WWW server was built using a combination of javascript, php, perl and python. The final results are provided in three different forms. First, 32 pictures from different angles are generated using pymol (25). Second, the temperature columns in the PDB file are replaced with the combined sequence-structure score. The modified PDB files are downloadable by clicking on any of the images. Third, the values of the three independent measures and the combined score for each residue are listed in a separate Table.
RESULTS
We use the Rosetta computational protein design and ΔΔG calculation methods together with evolutionary sequence information to obtain two related but distinct measures of the extent of structural versus functional constraints at each residue position in a protein structure. Rosetta design (13) generates sequences that are low in free energy for a specified protein structure independent of any functional constraints. We compare the sequences of the naturally occurring homologues of the protein under study with the designed sequences. The differences between these two sets of sequences reflect the functional pressures on the protein family evolution as these contribute to the natural sequence profiles but not the computed profiles. Our first measure of functional constraints is thus the deviation between the naturally occurring and computed sequence profiles. For the second measure, we use the Rosetta ΔΔG calculation method (12) to estimate the free energy gap between the naturally occurring amino acid and the energetically most favorable amino acid at the same position. This energy gap should reflect the extent of functional pressure exerted on the site: if there is strong selection for protein function, e.g. a critical role in enzyme catalysis, the naturally occurring residue may be far from optimal for protein stability (20).
Our goal is to combine these two measures with standard sequence conservation methods to improve protein functional site identification. For sequence conservation calculation, we use the recently described method, SCORECONS (4,26), which takes into account the alignment gaps, amino acid stereochemical properties and sequence weighing. A large data set of enzyme active sites compiled by Porter et al. (22) is used for testing our method.
In the following sections, first we evaluate the extent to which the sequence conservation measure and the two energy based measures described above can independently distinguish between functional and non-functional residues. We then describe the improvement of the accuracy of functional residue prediction using a combination of all three measures.
Distribution of sequence conservation scores for functional residue sites and all residue sites
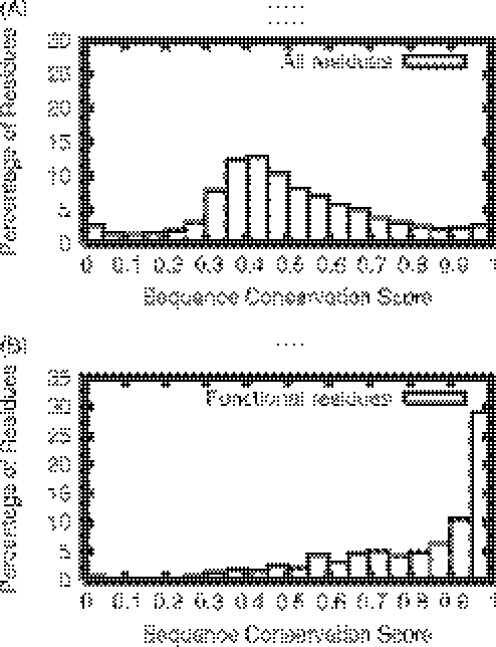
Figure 1 compares the distribution of sequence conservation scores for the functional residue sites to that for all the residues in the enzyme active site set (22). The histogram of sequence conservation scores for all residues peaks at a score value of 0.5. The functional sites are generally more conserved than non-functional sites, as indicated by the shift of the score distribution peak towards a higher value. The overlap between these two distributions is significant, possibly due to confounding factors such as the conservation of structurally important residues and sequence alignment errors. As this significant overlap of the two distributions makes it difficult to confidently identify functionally important sites based on sequence conservation alone, we need additional measures to further separate the functional sites from non-functional sites.
Figure 1.
Histogram of sequence conservation scores for all residue sites (A) and functional residue sites (B) for proteins in the enzyme active site set (22).
Distribution of differences between naturally-occurring and designed sequence profiles
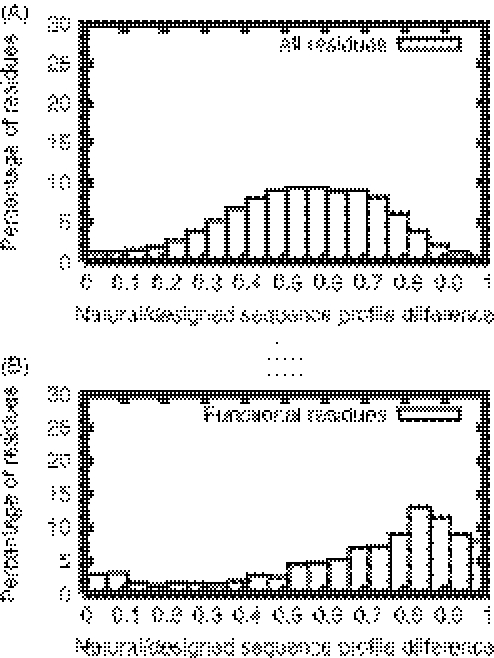
Next we compare the distribution of the differences between the naturally sequence profiles and the designed sequence profiles for functional residues to that for all residues. As noted above, our assumption is that the sites under strong functional selection pressure may have distorted amino acid distributions from those of the designed sequences, which were only subjected to selection for stability. Figure 2 shows that, indeed, for functional residue sites the geometric distances between designed sequence profiles and naturally occurring sequence profiles (for details see Materials and Methods) are generally larger than those for all the residue sites. This measure provides a new dimension to separate functional sites from non-functional sites.
Figure 2.
Histogram of the differences between naturally-occurring sequence profiles and designed sequence profiles for all residue sites (A) and functional residue sites (B).
Distribution of the energy differences between native and energetically most favorable residues
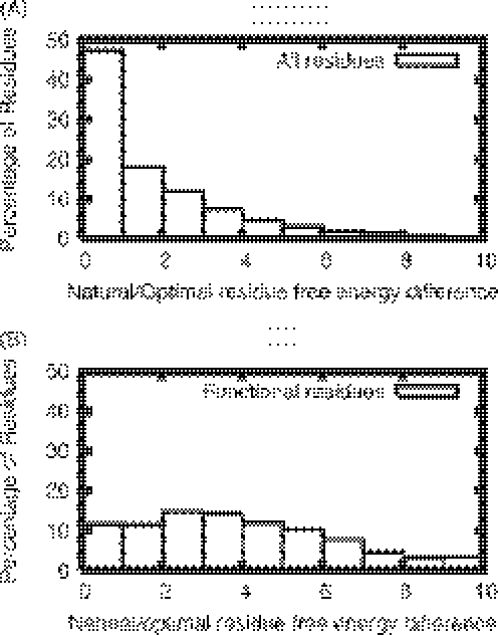
Next we compare the distribution of the energy differences between the naturally occurring amino acid and the energetically most favorable amino acid at a given sequence position. (see Materials and Methods). In the distribution for all residues (Figure 3A), nearly half of the sites have energy differences below 1.0 kcal/mol. In contrast, in the distribution for functional residue sites (Figure 3B), the majority of the sites have energy differences of >1.0 kcal/mol. This observation indicates that a large fraction of functional sites appear to be suboptimal for stability. The energy gap thus provides another dimension for separating functional constraints from structural constraints.
Figure 3.
Histogram of the energy gaps between the natural occurring residue and the energetically most favorable residue for all sites (A) and functional residue sites (B).
Predicting functional sites by combining sequence conservation, natural/designed sequence profile differences and native/optimal residue energy differences
Now we are ready to combine the above three sources of information—the sequence conservation scores, the differences between the naturally-occurring and designed sequence profiles and the energy gap between native and energetically most favorable residue, to better separate functional sites from non-functional sites. Logistic regression is used to achieve the optimal combination of these measures. To investigate whether or not these different measures are independent, we calculate the residual deviance in the accuracy of functional site prediction for each combination of the three information sources (the lower the residual deviance and, the more accurate the prediction). As summarized in Supplementary Table 1, all three measures make significant and independent contributions to the reduction in residual deviance. The reduction is greater than expected given the increase in the number of parameters, indicating that none of the information sources is redundant. We achieve the best model for identifying functional sites by a linear combination of all three measures, with the weights summarized in Supplementary Table 2.
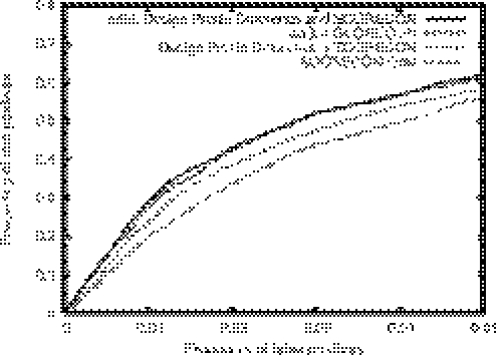
To test the discriminating power of the combined model, we randomly chose 20% of the proteins in the enzyme active site set for training the model parameters and use the remaining 80% of the proteins as the test set for functional site prediction. The results are summarized in the ROC plot in Figure 4. It is evident that the combination of the energy gap information with the sequence conservation information improves the discrimination of functional and non-functional sites. The further improvement upon addition of the profile difference measure is relatively small. In the tests below and on the web server which implements the method, the linear combination of the three measures is used.
Figure 4.
ROC plots comparing functional site prediction using the sequence and energy based methods alone and in combination. The horizontal axis is the frequency of false positives (non-functional residues predicted to be functional) and the vertical axis the frequency of true positives (functional residues predicted to be functional). For the same false positive level, adding in either the natural/designed PSSM difference or the natural/optimal energy gap to the SCORECONS method increases the frequency for true positives. The combination of the three measures has the best performance.
Illustrations of improved predictions
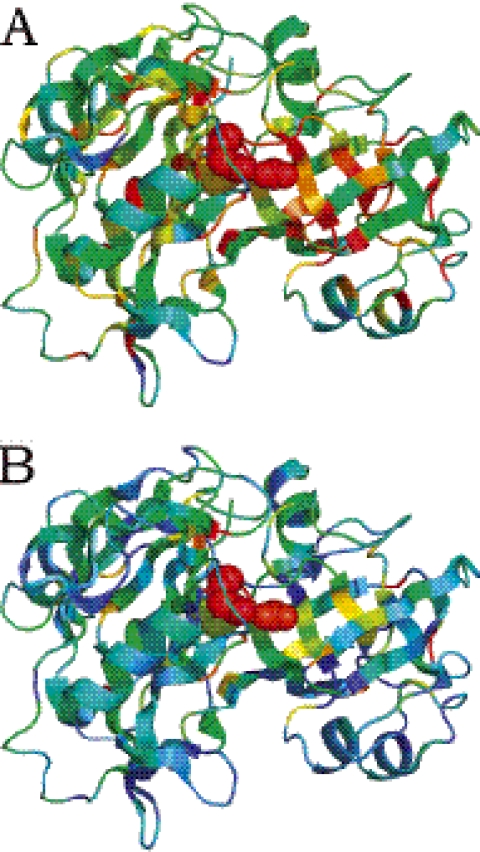
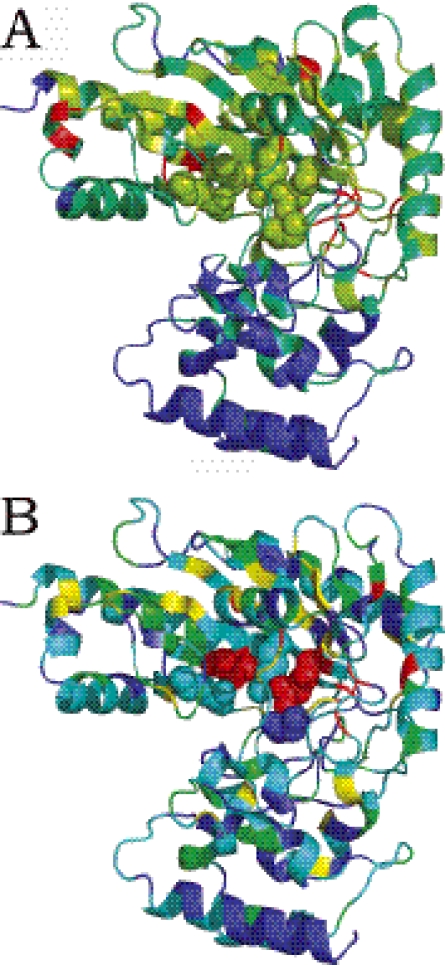
Figures 5 and 6 show structures of Arginine kinase and chymosin B colored according to sequence conservation scores (Figures 5A and 6A) and our combined measures (Figures 5B and 6B). In Figure 6A, the catalytic residues (plotted in space-fill view) are not among the most conserved residues. In Figure 5A, the functional residues are among the most conserved residues, but there are several residues in the hydrophobic core of the beta barrel with similar conservation scores, preventing the confident prediction of functional sites. As shown in Figures 5B and 6B, our combined measure increases prediction accuracy by reducing the number of false positives. In Figure 6B, the largest high scoring cluster correctly overlaps with the functional residues. Similarly, the conserved hydrophobic core residues in Figure 5B have lower scores than in Figure 5A, reducing the number of false positives.
Figure 5.
Structure of chymosin B (pdb id 1 cms) colored according to sequence conservation scores (A) and combined sequence and energy based scores (B) from red (most conserved or predicted to be most functionally important) to blue (least conserved, or predicted to be least functionally important). The experimentally determined enzyme active sites are plotted in space-fill view.
Figure 6.
Structure of Arginine kinase (pdb id 1bg0) colored according to sequence conservation scores (A) and combined energy and sequence based scores (B) from red (most conserved or predicted to be most functionally important) to blue (least conserved, or predicted to be least functionally important). The experimentally determined enzyme active sites are plotted in space-fill view.
Predictions for other test sets
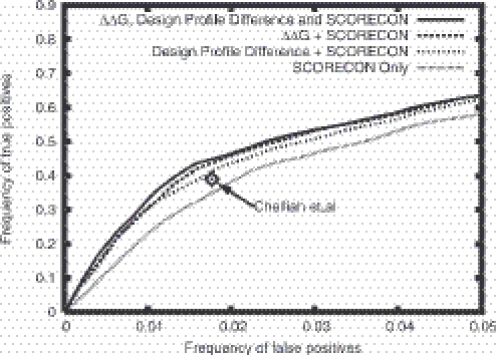
To test the generality of our method, we applied our functional prediction algorithm to an independent functional site set compiled by the Lovell group (19) which includes ligand binding sites in addition to enzyme active sites. As indicated in the ROC plots in Figure 7, the results closely parallel the results on the Thornton group test set with the combined sequence and structure method performing significantly better than SCORECONS (the two sets have a modest degree of overlap: 49 PDB codes are shared between the 490 proteins in the Thornton set and the 243 proteins in the Lovell set). Chelliah et al. (19) reported instead of a ROC plot the number of true positives and false positives for a particular threshold with their structure based method. As indicated by the star in Figure 7, the performance of their method on this set is better than SCORECONS but not as good as our combined sequence and structure based method.
Figure 7.
ROC plot for test set of Chelliah et al. (19). The result of Chelliah et al. (19) on this set corresponds to the single indicated point on the ROC plot, which is higher than SCORECONS but lower than our combined methods.
We also compared our method with the protein design based method by Pei et al. (17) on their test set. The results are summarized in Table 1, and a modest improvement in prediction accuracy is also observed.
Table 1.
Ligand binding site prediction comparison with Pei et al. (11)
| PDB code | Apo PDB | Number of ASZa within the top 25% conservation difference in Pei et al. (17) | Number of ASZ within the top 25% our score |
|---|---|---|---|
| 8pca | 2ctn | 11 | 13 |
| 2a8v | 1a8v | 6 | 8 |
| 1btz | 2ptn | 12 | 12 |
| 1rge | 1rgg | 6 | 7 |
| 148l | 5lzm | 11 | 13 |
aThe active site zone (ASZ) is defined as all the residues within 4.5 Å of the binding ligand.
DISCUSSION
Our work shows that the combination of sequence conservation information with structural information from all-atom protein design and free energy calculation improves protein functional site identification. Previous work has explored ways to improve the accuracy of functional site prediction by combining sequence and structural information (27,28). For example, Pei et al. (17) used a low resolution protein sequence design algorithm to predict protein ligand binding sites based on the differences between designed sequences and naturally occurring sequences. Wang et al. (10) proposed a method to separate the contribution of individual residue to structure and to function, and used it for protein function classification. Chelliah et al. (19) developed a method to distinguish structural constraints from general evolutionary constraints using both homologous sequences and homologous structures. Our approach goes beyond these earlier studies by using a physically realistic atomic level description of the protein, which has been validated by successful protein design efforts. Furthermore, our method combines multiple sources of information and achieves better results than any single source of information. Pei et al. (17) used the sequence profile differences between naturally occurring proteins and designed proteins, but did not use the sequence conservation score explicitly. Chelliah et al. (19) based their prediction on geometry comparisons, and did not use structure based energetic information.
There are a number of sources of errors in our predictions. Our approach, like the SCORECONS method on which it is based, is sensitive to the quality of the input multiple sequence alignments. Many functional sites are located in loop regions of protein structures, which can be problematic for sequence alignment algorithms. The structure based measures can in some cases be misleading, since functionally important residues can also contribute to stability. The method could be improved using better multiple sequence alignment algorithms, by spatial clustering of the high scoring residues (28) and by introducing backbone flexibility in the energy calculations. For proteins which have no detectable sequence homologs (singletons) (5,18), our method will work poorly because the structure based methods do not provide strong discriminations on their own (Figures 2 and 3) and the method is also clearly not applicable when the three dimensional structure of the protein is not known. However, with the rapid growth in the number of genomes sequenced and in the number of high resolution protein structures, automated functional site identification methods should play an increasingly important role in guiding experimental studies.
A web server which implements the method described in this paper is available at http://tools.bakerlab.org/~gcheng/.
SUPPLEMENTARY DATA
Supplementary Data are available at NAR Online.
Supplementary Material
Acknowledgments
We thank Philip Bradley, Dylan Chivian, Ora-Schuler Furman, Jim Havranek, Lin Jiang, Tanja Kortemme, Brian Kuhlman, Lars Malmstrom, Christopher Saunders, for helpful discussion. We thank Michal Guerquin and Keith Laidig for efficient computer cluster management. This work was supported by Searle Scholar Award, NSF Grant DBI-0217241, NIH Grant GM068152 to (RS). B.Q. is an American Leukemia and Lymphoma Society Fellow. This work was also supported by the NIH funded structural genomics of pathogenic parasites (SGPP), consortium P50GM64655 (DB). Funding to pay the Open Access publication charges for this article was provided by Howard Hughes Medical Institute (HHMI).
Conflict of interest statement. None declared.
REFERENCES
- 1.Taylor W.R. The classification of amino acid conservation. J. Theor. Biol. 1986;119:205–218. doi: 10.1016/s0022-5193(86)80075-3. [DOI] [PubMed] [Google Scholar]
- 2.Schneider T.D. Information content of individual genetic sequences. J. Theor. Biol. 1997;189:427–441. doi: 10.1006/jtbi.1997.0540. [DOI] [PubMed] [Google Scholar]
- 3.Lichtarge O., Bourne H.R., Cohen F.E. An evolutionary trace method defines binding surfaces common to protein families. J. Mol. Biol. 1996;257:342–358. doi: 10.1006/jmbi.1996.0167. [DOI] [PubMed] [Google Scholar]
- 4.Valdar W.S. Scoring residue conservation. Proteins. 2002;48:227–241. doi: 10.1002/prot.10146. [DOI] [PubMed] [Google Scholar]
- 5.Ondrechen M.J., Clifton J.G., Ringe D. THEMATICS: a simple computational predictor of enzyme function from structure. Proc. Natl Acad. Sci. USA. 2001;98:12473–12478. doi: 10.1073/pnas.211436698. [DOI] [PMC free article] [PubMed] [Google Scholar]
- 6.Madabushi S., Yao H., Marsh M., Kristensen D.M., Philippi A., Sowa M.E., Lichtarge O. Structural clusters of evolutionary trace residues are statistically significant and common in proteins. J. Mol. Biol. 2002;316:139–154. doi: 10.1006/jmbi.2001.5327. [DOI] [PubMed] [Google Scholar]
- 7.Laskowski R.A., Luscombe N.M., Swindells M.B., Thornton J.M. Protein clefts in molecular recognition and function. Protein Sci. 1996;5:2438–2452. doi: 10.1002/pro.5560051206. [DOI] [PMC free article] [PubMed] [Google Scholar]
- 8.Jones S., Thornton J.M. Searching for functional sites in protein structures. Curr. Opin. Chem. Biol. 2004;8:3–7. doi: 10.1016/j.cbpa.2003.11.001. [DOI] [PubMed] [Google Scholar]
- 9.Armon A., Graur D., Ben-Tal N. ConSurf: an algorithmic tool for the identification of functional regions in proteins by surface mapping of phylogenetic information. J. Mol. Biol. 2001;307:447–463. doi: 10.1006/jmbi.2000.4474. [DOI] [PubMed] [Google Scholar]
- 10.Wang K., Samudrala R. FSSA: a novel method for identifying functional signatures from structural alignments. Bioinformatics. 2005;21:2969–2977. doi: 10.1093/bioinformatics/bti471. [DOI] [PubMed] [Google Scholar]
- 11.Guerois R., Nielsen J.E., Serrano L. Predicting changes in the stability of proteins and protein complexes: a study of more than 1000 mutations. J. Mol. Biol. 2002;320:369–387. doi: 10.1016/S0022-2836(02)00442-4. [DOI] [PubMed] [Google Scholar]
- 12.Kortemme T., Baker D. A simple physical model for binding energy hot spots in protein–protein complexes. Proc. Natl Acad. Sci. USA. 2002;99:14116–14121. doi: 10.1073/pnas.202485799. [DOI] [PMC free article] [PubMed] [Google Scholar]
- 13.Kuhlman B., Baker D. Native protein sequences are close to optimal for their structures. Proc. Natl Acad. Sci. USA. 2000;97:10383–10388. doi: 10.1073/pnas.97.19.10383. [DOI] [PMC free article] [PubMed] [Google Scholar]
- 14.Dahiyat B.I., Mayo S.L. De novo protein design: fully automated sequence selection. Science. 1997;278:82–87. doi: 10.1126/science.278.5335.82. [DOI] [PubMed] [Google Scholar]
- 15.Kuhlman B., Dantas G., Ireton G.C., Varani G., Stoddard B.L., Baker D. Design of a novel globular protein fold with atomic-level accuracy. Science. 2003;302:1364–1368. doi: 10.1126/science.1089427. [DOI] [PubMed] [Google Scholar]
- 16.Looger L.L., Dwyer M.A., Smith J.J., Hellinga H.W. Computational design of receptor and sensor proteins with novel functions. Nature. 2003;423:185–190. doi: 10.1038/nature01556. [DOI] [PubMed] [Google Scholar]
- 17.Pei J., Dokholyan N.V., Shakhnovich E.I., Grishin N.V. Using protein design for homology detection and active site searches. Proc. Natl Acad. Sci. USA. 2003;100:11361–11366. doi: 10.1073/pnas.2034878100. [DOI] [PMC free article] [PubMed] [Google Scholar]
- 18.Elcock A.H. Prediction of functionally important residues based solely on the computed energetics of protein structure. J. Mol. Biol. 2001;312:885–896. doi: 10.1006/jmbi.2001.5009. [DOI] [PubMed] [Google Scholar]
- 19.Chelliah V., Chen L., Blundell T.L., Lovell S.C. Distinguishing structural and functional restraints in evolution in order to identify interaction sites. J. Mol. Biol. 2004;342:1487–1504. doi: 10.1016/j.jmb.2004.08.022. [DOI] [PubMed] [Google Scholar]
- 20.Shoichet B.K., Baase W.A., Kuroki R., Matthews B.W. A relationship between protein stability and protein function. Proc. Natl Acad. Sci. USA. 1995;92:452–456. doi: 10.1073/pnas.92.2.452. [DOI] [PMC free article] [PubMed] [Google Scholar]
- 21.Beadle B.M., Shoichet B.K. Structural bases of stability-function tradeoffs in enzymes. J. Mol. Biol. 2002;321:285–296. doi: 10.1016/s0022-2836(02)00599-5. [DOI] [PubMed] [Google Scholar]
- 22.Porter C.T., Bartlett G.J., Thornton J.M. The catalytic site atlas: a resource of catalytic sites and residues identified in enzymes using structural data. Nucleic Acids Res. 2004;32:D129–133. doi: 10.1093/nar/gkh028. [DOI] [PMC free article] [PubMed] [Google Scholar]
- 23.Benson D.A., Karsch-Mizrachi I., Lipman D.J., Ostell J., Wheeler D.L. GenBank. Nucleic Acids Res. 2005;33:D34–38. doi: 10.1093/nar/gki063. [DOI] [PMC free article] [PubMed] [Google Scholar]
- 24.Edgar R.C. MUSCLE: a multiple sequence alignment method with reduced time and space complexity. BMC Bioinformatics. 2004;5:113. doi: 10.1186/1471-2105-5-113. [DOI] [PMC free article] [PubMed] [Google Scholar]
- 25.DeLano W.L. The PyMOL User's Manual. San Carlos, CA, USA: DeLano Scientific; 2002. [Google Scholar]
- 26.Valdar W.S., Thornton J.M. Protein–protein interfaces: analysis of amino acid conservation in homodimers. Proteins. 2001;42:108–124. [PubMed] [Google Scholar]
- 27.Gutteridge A., Bartlett G.J., Thornton J.M. Using a neural network and spatial clustering to predict the location of active sites in enzymes. J. Mol. Biol. 2003;330:719–734. doi: 10.1016/s0022-2836(03)00515-1. [DOI] [PubMed] [Google Scholar]
- 28.Landgraf R., Xenarios I., Eisenberg D. Three-dimensional cluster analysis identifies interfaces and functional residue clusters in proteins. J. Mol. Biol. 2001;307:1487–1502. doi: 10.1006/jmbi.2001.4540. [DOI] [PubMed] [Google Scholar]
Associated Data
This section collects any data citations, data availability statements, or supplementary materials included in this article.


