

Abstract
Chemotactic stimulation of Dictyostelium cells results in a transient increase in cGMP levels, and transient phosphorylation of myosin II heavy and regulatory light chains. In Dictyostelium, two guanylyl cyclases and four candidate cGMP-binding proteins (GbpA– GbpD) are implicated in cGMP signalling. GbpA and GbpB are homologous proteins with a Zn2+-hydrolase domain. A double gbpA/gbpB gene disruption leads to a reduction of cGMP-phosphodiesterase activity and a 10-fold increase of basal and stimulated cGMP levels. Chemotaxis in gbpA–B– cells is associated with increased myosin II phosphorylation compared with wild-type cells; formation of lateral pseudopodia is suppressed resulting in enhanced chemotaxis. GbpC is homologous to GbpD, and contains Ras, MAPKKK and Ras-GEF domains. Inactivation of the gbp genes indicates that only GbpC harbours high affinity cGMP-binding activity. Myosin phosphorylation, assembly of myosin in the cytoskeleton as well as chemotaxis are severely impaired in mutants lacking GbpC and GbpD, or mutants lacking both guanylyl cyclases. Thus, a novel cGMP signalling cascade is critical for chemotaxis in Dictyostelium, and plays a major role in myosin II regulation during this process.
Keywords: cGMP/cloning/GEF/PDE/Ras
Introduction
cAMP and cGMP are important signalling molecules in prokaryotes and eukaryotes. These molecules are produced by cyclases, degraded by phosphodiesterases (PDEs), and exert their functions by binding to specific proteins. In prokaryotes, cAMP regulates gene expression by binding to the cyclic nucleotide-binding (cNB) domain of catabolic repressor transcription factors (Passner et al., 2000). In eukaryotes, cAMP and cGMP regulate enzyme and channel activity, mainly via cAMP- and cGMP-dependent protein kinases or by direct binding of cGMP to channels (Houslay and Milligan, 1997). Other recently identified targets are proteins of the Epac family; besides a cAMP-binding region, these proteins contain a Rap1 or Ras guanine exchange factor (GEF) domain (de Rooij et al., 1998). In addition, some PDEs contain a GAF domain, which is an unrelated cGMP-binding domain that regulates PDE activity (Francis et al., 2000).
cAMP-dependent protein kinase appears to be a universal target, even occurring in primitive eukaryotes. Much less is known about the synthesis and function of cGMP in lower eukaryotes. Yeast seems to lack cGMP signalling, since the genome of Saccharomyces cerevisiae does not appear to encode putative guanylyl cyclases or proteins containing cGMP-binding domains. Guanylyl cyclases have been identified in Paramecium, Tetra hymena and Plasmodium, but the role of cGMP in these organisms is not yet resolved (Linder et al., 1999).
In Dictyostelium, cGMP synthesis is stimulated by the chemoattractants cAMP and folic acid, which bind to G-protein-coupled receptors (reviewed by Van Haastert and Kuwayama, 1997). Guanylyl cyclase is activated for only a few seconds, followed by adaptation of signal transduction. The cGMP produced is degraded rapidly, mainly by a cGMP-stimulated cGMP-specific PDE (Van Haastert et al., 1982b). As a consequence of the brief activation of guanylyl cyclases and cGMP stimulation of PDE activity, cGMP accumulation is transient, reaching a maximum at 10 s and returning to basal levels after 30 s. It has been proposed that cGMP mediates chemotaxis by modulating the phosphorylation and localization of myosin II (reviewed by de la Roche and Cote, 2001).
Myosin II is activated transiently after chemotactic stimulation by two mechanisms. First, phosphorylation of the regulatory light chain (RLC) increases the ATPase activity of myosin II. Secondly, myosin II is recruited to the cytoskeleton, a process regulated by phosphorylation of myosin heavy chain (MHC) at three threonines located in the coiled-coil tail (see Berlot et al., 1987; Vaillancourt et al., 1988; Egelhoff et al., 1993; de la Roche and Cote, 2001). Cells have a decreased chemotactic index when the gene encoding MHC is disrupted, or replaced by a mutant gene converting the three threonines to alanines, which results in the constitutive overassembly of MHC into the cytoskeleton (Wessels et al., 1988; Egelhoff et al., 1993; Stites et al., 1998). Cells expressing a mutant RLC with an alanine at the phosphorylated serine also show defects in chemotaxis (Zhang et al., 2002).
Studies with mutants suggest that cGMP signalling plays a critical role in orchestrating these changes in myosin phosphorylation and localization. In stmF mutants, which make increased amounts of cGMP in response to chemoattractants, MHC and RLC phosphorylation are delayed or enhanced, while in KI-10 mutants, which do not produce cGMP in response to chemoattractants, no changes in RLC and MHC phosphorylation or translocation of myosin to the cytoskeleton are observed (Liu et al., 1993; Liu and Newell, 1994; Dembinsky et al., 1996). However, the relationship between myosin regulation, cGMP formation and chemotaxis is complicated by the fact that the impaired genes of both stmF and KI-10 have not been identified. To understand the function of cGMP in Dictyostelium, it is essential to identify the genes that encode cGMP-metabolizing enzymes and cGMP target proteins.
Recently, we characterized two unusual guanylyl cyclases in Dictyostelium, GCA and sGC, that are not related to vertebrate guanylyl cyclases, but are homologous to 12-transmembrane and soluble adenylyl cyclase, respectively (Roelofs et al., 2001a,b). We have also identified four genes that encode proteins with putative cGMP-binding domains, GbpA–GbpD (Goldberg et al., 2002). Here we use gene disruptions to show that GbpA and GbpB encode novel cGMP-stimulated PDEs and are thus involved in controlling the cGMP signal. GbpC and GbpD encode putative cGMP target proteins containing domains homologous to Ras, a protein kinase and Ras-GEF. Mutants defective in guanylyl cyclase activity or cGMP targets show impaired regulation of myosin II, while computer-assisted motion analysis indicates that these mutants are defective in chemotaxis.
Results
Gene inactivation
The genes encoding GbpA–GbpD were disrupted by homologous recombination in the Dictyostelium uracil auxotroph DH1. Four single and two double knock-outs (gbpA and gbpB, and gbpC and gbpD) were made in this strain by using two selection markers, Bsr and pyr5/6. The positions of disruption of the open reading frames (ORFs) are indicated in Figure 1. Knock-out strains were identified by PCR and confirmed by Southern blot analysis (data not shown). In Dictyostelium, the interruption of a gene with a selection marker often leads to the absence of the (truncated) mRNA, probably because it is unstable. This was observed on northern blots for disruption of gbpA, gbpB and gbpD. In contrast, gbpC– null cells show high expression of the truncated mRNA, which may lead to expression of truncated proteins (data not shown). Therefore, for this study, we made a disruption of the gbpC gene resulting in a 2.5 kb deletion at the beginning of the ORF (see Figure 1). The phenotypes of the mutants are described below in the section on chemotaxis.

Fig. 1. Four unusual putative cGMP-binding proteins in Dictyostelium. Schematic of the topology of GbpA–GbpD. The positions of disruption of the protein sequences in the knock-out cell lines are indicated by asterisks. The bar refers to 100 amino acids. GbpA and GbpB have the same domain topology; a Zn2+-hydrolase (red) and two cNB domains (blue). GbpC and GbpD are also homologues, sharing an N-terminal Ras-GEF-associated domain (light green) a Ras-GEF domain (green), a GRAM domain (dark blue) and two cNB domains (blue). GbpC has additional N-terminal sequence containing leucine-rich repeats (yellow), a Ras (orange), a MAP kinase kinase kinase (pink) and a DEP (turquoise) domain.
cGMP-stimulated cGMP-specific phosphodiesterase activity
Dictyostelium contains at least two cGMP PDE activities, one from the cloned DdPDE3 (Kuwayama et al., 2001) and a second enzyme that has been characterized biochemically as cGMP PDE that is stimulated by the analogue 8-bromo-cGMP (8bcGMP) (Van Haastert et al., 1982b). GbpA and GbpB contain a Zn2+-hydrolase domain that is distantly related to class II PDEs (Goldberg et al., 2002). To test whether gbpA and/or gbpB encode a PDE, we analysed gbp-null strains developed till the tight aggregate stage when both genes are expressed at high levels. Table I shows the PDE activity measured with [3H]cAMP or [3H]cGMP in the absence or presence of 8bcAMP and 8bcGMP. Wild-type cells contain significant cGMP PDE activity that is stimulated 2- to 3-fold by 8bcGMP, but not by 8bcAMP. Wild-type cells also contain a cAMP PDE activity that is stimulated by both 8bcAMP and 8bcGMP. These enzyme activities are not significantly different in lysates from gbpC–D– cells (data not shown). gbpA– cells show a strong decrease of cGMP PDE activity, and 8bcGMP no longer stimulates the remaining enzyme activity; in contrast, cAMP PDE activity is not changed in gbpA–. On the other hand, the cGMP PDE activity is not strongly reduced in gbpB– cells, in contrast to the significant reduction of cAMP PDE activity. In gbpA–/B– cells, the activity of both cGMP PDE and cAMP PDE is low, and they are not activated by 8bcAMP and 8bcGMP. These results suggest that GbpA and GbpB are PDEs
Table I. PDE activity in Dictyostelium mutants.
| Cell lines | PDE activity (pmol/min/mg) |
|||||
|---|---|---|---|---|---|---|
| cAMP |
cGMP |
|||||
| – | 8bcAMP | 8bcGMP | – | 8bcAMP | 8bcGMP | |
| Wild-type | 2.90 ± 0.08 | 4.07 ± 0.20 | 3.91 ± 0.13 | 5.04 ± 0.28 | 5.44 ± 0.31 | 11.5 ± 0.59 |
| gbpA– | 2.90 ± 0.12 | 4.36 ± 0.20 | 3.63 ± 0.14 | 2.90 ± 0.13 | 3.42 ± 0.10 | 3.17 ± 0.06 |
| gbpB– | 1.58 ± 0.03 | 1.64 ± 0.10 | 1.62 ± 0.10 | 4.32 ± 0.13 | 4.51 ± 0.19 | 11.0 ± 0.41 |
| gbpA–B– | 1.62 ± 0.10 | 1.61 ± 0.06 | 1.71 ± 0.12 | 2.51 ± 0.19 | 2.45 ± 0.12 | 2.57 ± 0.25 |
| Characterization of GbpA | ||||||
| Wild-type – gbpA– | <0.15 | <0.28 | <0.20 | 2.14 ± 0.31 | 2.02 ± 0.33 | 8.31 ± 0.59 |
| gbpB– – gbpA–B– | <0.10 | <0.11 | <0.16 | 1.80 ± 0.23 | 2.06 ± 0.23 | 8.43 ± 0.48 |
| Characterization of GbpB | ||||||
| Wild-type – gbpB– | 1.32 ± 0.09 | 2.43 ± 0.21 | 2.29 ± 0.17 | 0.72 ± 0.31 | 0.93 ± 0.36 | <0.72 |
| gbpA– – gbpA–B– | 1.28 ± 0.16 | 2.75 ± 0.21 | 1.92 ± 0.18 | 0.38 ± 0.22 | 0.97 ± 0.16 | 0.60 ± 0.26 |
PDE activity was measured in the lysates from tight aggregates with 10 nM [3H]cAMP or [3H]cGMP as substrate in the absence or presence of the activators 8bcAMP or 8bcGMP. The data shown are the means and standard error of triplicate determinations from two experiments. The activity of GbpA was deduced by subtraction of the activities of two cell lines that have the same mixture of PDE enzymes except GbpA. The < sign means that the difference in activity is lower than the standard deviation.
Dictyostelium contains several PDE activities besides GbpA and GbpB that are still present in the gbpA– and gbpB– cells. GbpA and GbpB may be characterized by calculating the difference of PDE activity between the appropriate cell lines. Thus, GbpA PDE activity is defined as the difference in PDE activity observed in wild-type cells and gbpA– cells, or the difference in activity in gbpB– and gbpA–B– cells (Table I). This demonstrates that GbpA is a cGMP-specific PDE that is stimulated by 8bcGMP but not by 8bcAMP; cAMP is not hydrolysed by GbpA. These properties are essentially identical to those of the cGMP-stimulated cGMP PDE characterized previously (Van Haastert and Van Lookeren Campagne, 1984). GbpB PDE activity is defined as the difference in PDE activity between wild-type and gbpB– cells, or between gbpA– and gbpA–B– cells (Table I). This reveals that GbpB preferentially hydrolyses cAMP while cGMP is hydrolysed at an ∼4-fold lower rate; both 8bcAMP and 8bcGMP stimulate the enzyme. These properties have been confirmed by overexpressing GbpB in gbpA–B– cells (L.Bosgraaf, H.Russcher, H.Snippe, S.Bader, J.Wind and P.J.M.Van Haastert, submitted for publication).
Figure 2A reveals the effect of disruption of gbpA and gbpB on cAMP-stimulated cGMP levels in vivo. Wild-type cells show a rapid increase in cGMP levels from a basal level of ∼1 pmol/107 cells to 6 pmol/107 cells 10 s after stimulation; basal levels are recovered after ∼30 s. This cGMP response is nearly identical in gbpB– cells, but is strongly enhanced in gbpA– cells, with basal cGMP levels of 3 pmol/107 cells and the response increased to 15 pmol/107 cells; basal levels are recovered after ∼120 s. The increased cGMP response in vivo is consistent with the reduced cGMP PDE activity in vitro, confirming that gbpA encodes the cGMP-stimulated cGMP PDE activity.

Fig. 2. cGMP response in gbp-null cells. The cell were starved for 5 h followed by stimulation with 0.1 µM cAMP. Responses were terminated with perchloric acid, and cGMP levels were measured. (A) The symbols refer to wild-type DH1 (filled circles); gbpA– (open triangles); gbpB– (open squares); and gbpA–B– (closed squares). (B) Wild-type DH1 (filled circles); gbpC– (open inverted triangles); gbpD– (open circles); and gbpC–D– (filled inverted triangles). Identical data are presented for wild-type DH1 in (A) and (B). The results shown are the means of triplicate determinations from a typical experiment repeated once.
Disruption of gbpB leads to only a slight increase of cGMP levels. However, disruption of gbpB in a gbpA– background results in a very pronounced increase in basal cGMP levels from 3 pmol/107 cells in gbpA– to 12 pmol/107 cells in gbpA–B–. The cAMP-induced cGMP response is also substantially enhanced and prolonged from a maximum of 15 pmol/107 cells at 10 s after stimulation in gbpA– to 40 pmol/107 cells at 30 s after stimulation in gbpA–B–; basal levels were reached after ∼3–4 min. These results confirm the observation that gbpB encodes an enzyme with low cGMP PDE activity that becomes apparent when the much more active GbpA enzyme is deleted.
cAMP- and cGMP-binding capacity
The cNB domains of GbpA–GbpD are potential cGMP-binding sites, but may also bind cAMP or other compounds. The binding of 10 nM cAMP or cGMP to lysates from different null cell lines is presented in Figure 3. The binding of cAMP to the cytosolic fraction of wild-type cells and the two double-null strains gbpA–B– and gbpC–D– is essentially identical (Figure 3A), indicating that the Gbp proteins do not comprise a large fraction of the observed cAMP-binding capacity. The binding of 10 nM cGMP is not affected much by disruption of gbpA, gbpB or gbpD, whereas disruption of gbpC results in a 80–90% reduction in cGMP binding (Figure 3B).

Fig. 3. cAMP and cGMP binding to proteins from gbp-null cells. The binding of 10 nM [3H]cAMP (A) or 10 nM [3H]cGMP (B) to the cytosolic fraction of wild-type DH1 and different null cell lines was measured. The means and standard deviations of two (A) or three (B) experiments with triplicate determinations are shown.
Analysis of the affinity and number of cGMP-binding sites in different gbp-null mutants is presented as Scatchard plots (Figure 4). The slope in these curves indicates the affinity, whereas the intercept with the abscissa refers to the number of binding sites. Wild-type cells, as well as mutants gbpA–B– and gbpD–, show non-linear Scatchard plots. Curve fitting with a two-component model indicates the presence of ∼200 fmol/mg protein high affinity cGMP-binding sites with a Kd of ∼4 nM, and ∼1200 fmol/mg protein low affinity cGMP-binding sites with a Kd of ∼250 nM. The figure clearly demonstrates that lysates from gbpC– and gbpC–D– cells have lost high affinity cGMP-binding sites. Residual cGMP binding is very low, which complicates its analysis. Curve fitting statistics indicate that data should be fitted according to a one-component model, yielding low affinity cGMP-binding sites with a capacity of ∼1200 fmol/mg protein and a Kd of ∼500 nM (for statistics see legend of Figure 4).

Fig. 4. Scatchard plot of cGMP binding to proteins from gbp-null cells. The binding of different concentrations of [3H]cGMP to the cytosolic fraction was determined. The symbols refer to wild-type DH1 (filled circles); gbpA–B– (filled squares); gbpC– (open inverted triangles); gbpD– (open circles); and gbpC–D– (filled inverted triangles). Curve fitting with a two-component model indicates two binding forms in wild-type, gbpA–B– and gbpD– showing 200 ± 35 fmol high affinity cGMP-binding sites/mg protein with a Kd of 3.9 ± 1.5 nM and 1165 ± 134 fmol low affinity cGMP-binding sites/mg protein with a Kd of 257 ± 83 nM. Mutant gbpC– and double mutant gbpC–D– show only a low affinity cGMP binding component with 1235 ± 333 fmol cGMP-binding sites/mg protein with a Kd of 557 ± 220 nM. The data points shown are the means of two experiments with triplicate determinations; the estimated binding constants are the means and standard error of the data pooled from three cell lines (wild-type, gbpA–B– and gbpD–) or two cell lines (gbpC– and gbpC–D–).
The consequence of gbpC and gbpD disruption on the cAMP-mediated cGMP response is presented in Figure 2B, revealing essentially normal cGMP responses in the gbpC–, gbpD– and gbpC–D– cells.
Myosin II phosphorylation and assembly
cGMP signalling is implicated in controlling myosin II phosphorylation and localization during chemotaxis, but the mechanism of this regulation is as yet largely unknown. By isolating genetically engineered mutants in guanylyl cyclases (Roelofs and Van Haastert, 2002), cGMP PDEs and cGMP target proteins, we are now able to test the role of cGMP in myosin II regulation more directly.
In wild-type cells, cAMP induces the transient phosphorylation of RLC and MHC, yielding maximal values at ∼30 and 90 s after stimulation, respectively. (Figure 5). Quantification of the blots for RLC phosphorylation reveals a 2.41 ± 0.09-fold increase over pre-stimulated levels (Table II). In gbpA–B– cells, which have very high basal and receptor-stimulated cGMP levels, the stimulation of RLC phosphorylation is significantly larger and persists longer than in wild-type cells. In gca–/sgc– cells, which lack cGMP formation, cAMP induces a very small but statistically significant 1.33 ± 0.16-fold increase in RLC phosphorylation; this stimulation shows approximately the same kinetics as in wild-type cells. The RLC phosphorylation response is also very small in gbpC–D– cells, which lack two cGMP target proteins; in addition, basal phosphorylation of RLC in unstimulated cells was consistently lower than in the other strains.
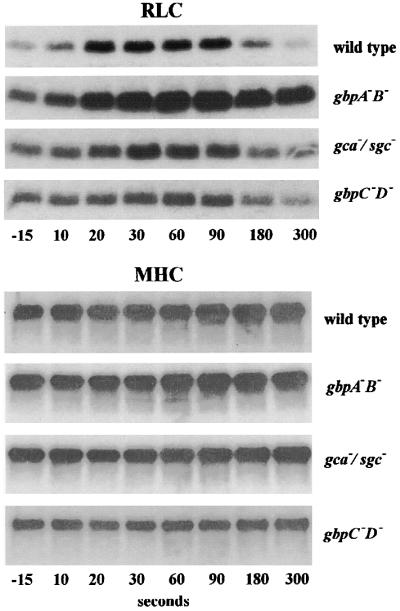
Fig. 5. cAMP-induced phosphorylation of myosin heavy chain II (MHC) and regulatory light chain (RLC). Starved cells were incubated with [32P]phosphate for 30 min, followed by stimulation with 1 μM cAMP at t = 0 s. Samples were taken at the times indicated and immunoprecipitated with antibodies against RLC and MHC. The immunoprecipitates were analysed by SDS–PAGE and autoradiography. Typical experiments are presented and were repeated at least once. A quantitative analysis of these data is presented in Table II.
Table II. Myosin II modification in Dictyostelium mutants.
| Response | Wild-type | gca–/sgc– | gbpA–B– | gbpC–D– |
|---|---|---|---|---|
| RLC phosphorylation | ||||
| Fold increase | 2.41 ± 0.09a | 1.33 ± 0.16a | 3.16 ± 0.37a | 1.55 ± 0.16a |
| % response | 100 | 23 ± 18b | 153 ± 47b | 39 ± 18b |
| MHC phosphorylation | ||||
| Fold increase | 1.34 ± 0.07a | 1.15 ± 0.03a | 1.39 ± 0.05a | 1.14 ± 0.04a |
| % response | 100 | 45 ± 16b | 115 ± 31 NS | 41 ± 18b |
| MHC cytoskeleton (% of total) | ||||
| Basal | 52.8 ± 5.3 | 49.4 ± 4.6 NS | 26.0 ± 3.7c | 37.1 ± 3.7c |
| Stimulated increase | 11.2 ± 3.4a | –7.1 ± 1.2a,b | 25.5 ± 4.3a,b | –7.3 ± 2.5a,b |
Phosphorylation data: the radioactivity incorporated into RLC and MHC was quantified using a phosphoimager. The data are presented as fold increase relative to unstimulated samples within the same experiment, using stimulated levels at 30, 60 and 90 s for RLC, and 60, 90 and 180 s for MHC. The percentage response is defined as (fold increase –1 in mutant)/(fold increase –1 in wild-type). The statistical significance was tested with Students t-test. aThe fold increase is significantly different from 1; bthe response in the mutant is significantly different from the 100% response in wild-type, all at P < 0.05; NS, not significant.
Cytoskeleton data: the distribution of MHC between the Triton-insoluble cytoskeleton and the soluble fraction was determined as described in Figure 6. Data are presented as the percentage of total myosin that is present in the cytoskeleton. The stimulated increase refers to the increase observed relative to basal levels in the same experiment. For calculation of the increase, data are taken at 40–120 s for wild-type, 40–300 s for gbpA–B–, and 10–80 s for gca–/sgc– and gbpC–D– cells. The data shown are the means and standard deviations of 2–3 independent experiments. aThe stimulated increase is significantly different from 0; bthe increase in the mutant is significantly different from the increase seen in wild-type cells, cbasal levels are significantly different from wild-type; all at P < 0.05.
The cAMP stimulation of MHC phosphorylation shows essentially the same characteristics as phosphorylation of RLC, except that MHC phosphorylation attains a maximum at 90 s versus 30 s for RLC phosphorylation. In addition, the MHC phosphorylation response in wild-type cells is rather small; thus, the effects of the mutations are less pronounced than for RLC phosphorylation (see Table II). In the PDE mutant gbpA–B–, the response is prolonged, whereas in the guanylyl cyclase mutant gca–/sgc– and the cGMP target mutant gbpC–/gbpD– the phosphorylation of MHC is significantly less than in wild-type cells.
About 50% of the myosin is found in the cytoskeleton of wild-type cells; cAMP induces a small depletion at 10 s which is followed by a transient increase of myosin in the cytoskeleton with a maximum at ∼90 s after stimulation (Figure 6). A similar pattern, with an initial dissociation followed by a slower association of myosin with the cytoskeleton, was observed by Liu and Newell (1991), whereas a transient association without an initial dissociation was observed by Berlot et al. (1987). Basal levels of MHC in the cytoskeleton are much lower in gbpA–B– cells (26 ± 4% in gbpA–B–, compared with 53 ± 5% in wild-type). Addition of cAMP to gbpA–B– cells induces a relatively large increase in myosin in the cytoskeleton, with a maximum approaching the level seen in wild-type cells. In gca–/sgc– and gbpC–D– cells, basal levels of myosin in the cytoskeleton are somewhat lower than in wild-type cells. Addition of cAMP does not lead to the association of myosin in the cytoskeleton; instead a transient depletion between 20 and 80 s after stimulation was observed (Figure 6). Statistical analysis of the data on myosin phosphorylation and recruitment to the cytoskeleton indicates that the differences between the wild-type and mutant strains are significant (Table II).

Fig. 6. Association of MHC with the Triton-insoluble cytoskeleton. Starved cells were stimulated with 1 μM cAMP at t = 0 s. At the times indicated, 0.5% Triton was added, and lysates were separated into a supernatant and a Triton-insoluble cytoskeleton. The levels of MHC were determined by western blotting using antibody against MHC. The means of two or three experiments are shown. A quantitative analysis of these data is presented in Table II. The symbols refer to wild-type DH1 (filled circles); guanylyl cyclase gca–/sgc– null cells (open triangles); cGMP phosphodiesterase gbpA–B– null cells (filled inverted triangles); and gbpC–D– null cells lacking two cGMP targets (open squares).
Chemotaxis of mutants
Cell aggregation on filters is as rapid in gbpA–B– double-null cells as in wild-type cells, but is delayed significantly in gbpC–D– and gca–/sgc– cells by ∼3 h (Table III). All strains eventually form fruiting bodies that have approximately the same size as in wild-type cells. The mutants gbpC–D– and gca–/sgc– cells show a reduced chemotactic response towards cAMP as measured with the semi-quantitative small population assay (data not shown).
Table III. Cell aggregation, locomotion and chemotaxis in Dictyostelium mutants.
| Property | Wild-type | gca–/sgc– | gbpA–B– | gbpC–D– |
|---|---|---|---|---|
| Aggregation | (n = 3) | (n = 3) | (n = 3) | (n = 3) |
| Aggregation time (h) | 8.2 ± 1.0 | 11.5 ± 1.5* | 8.3 ± 0.7 NS | 11.2 ± 1.3* |
| Locomotion in buffer | (n = 23) | (n = 13) | (n = 23) | (n = 19) |
| Speed (µm/min) | 8.2 ± 3 | 3.9 ± 1.1*** | 5.6± 1.7** | 4.1 ± 1.2*** |
| Roundness (%) | 55 ± 14 | 77 ± 9*** | 71 ± 15** | 71 ± 15** |
| Direction change (°/min) | 35.6 ± 9.4 | 42.8 ± 7.0* | 47.4 ± 8.1*** | 52.7 ± 10.7*** |
| Chemotaxis | (n = 31) | (n = 36) | (n = 31) | (n = 37) |
| % positive cells | 88 | 61 | 97 | 59 |
| Chemotaxis index | +0.46 ± 0.29 | +0.06 ± 0.22*** | +0.61 ± 0.26* | +0.05 ± 0.12*** |
| Speed (µm/min) | 9.3 ± 4.7 | 4.5 ± 1.2*** | 6.3 ± 3.0** | 3.5 ± 1.4*** |
| Roundness (%) | 64 ± 8 | 80 ± 8*** | 60 ± 12 NS | 77 ± 11*** |
| Direction change (°/min) | 24.0 ± 8.6a | 39.1 ± 11.2*** | 29.6 ± 12.4 NSa | 53.2 ± 13.4*** |
Cells were deposited on filter paper and allowed to develop till the onset of aggregation. For analysis of locomotion in buffer, cells were deposited on a glass support. The chemotactic response of these cells was measured in a chemotaxis chamber with a spatial gradient of cAMP. Cells were videorecorded for 10 min. The perimeter and the centroid of the cells were determined by computer-assisted analysis. This allows calculation of the speed, roundness (ratio of the long and short axis of the cell), direction change and chemotactic index (the net distance moved towards the source of chemoattractant divided by the total distance moved). The data are derived from 3–5 independent experiment; n = the number of cells analysed. The statistical significance with wild-type cells was calculated using a t-test; *P < 0.05; **P < 0.01; ***P < 0.001; NS, not significant at P > 0.05.
aThe direction change in a spatial gradient is significantly different from the direction change in buffer.
Quantitative data on cell locomotion and chemotaxis were obtained by computer-assisted motion analysis of cells in buffer (the basic motile behaviour) and in defined spatial gradients of cAMP (Table III). The basic motile behaviour of cells in buffer is significantly different among the three mutants when compared with wild-type cells. Mutant cells are rounder, translocation velocity is reduced by about half, and cells show an increased direction change, which is a parameter that reflects the frequency of turning. Traces of cells moving in a chemotactic gradient are presented in Figure 7. It is evident that wild-type and gbpA–B– cells exhibit a strong chemotactic response (all cells move in a directed and persistent fashion up the spatial gradient of cAMP), while gbpC–D– and gca–/sgc– cells show impaired chemotaxis. During the chemotactic response, wild-type cells extend lateral pseudopodia. The cell traces reveal that these lateral pseudopodia are suppressed in gbpA–B– cells. In contrast, gbpC–D– and gca–/sgc– cells translocate in spatial gradients of cAMP at dramatically reduced velocities and in all directions. In a field of wild-type cells, ∼90% of the cells exhibit a positive chemotactic response, while only ∼60% of gca–/sgc– or gbpC–D– cells move in the direction of the gradient.

Fig. 7. Cell movement in cAMP gradients. Aggregation-competent cells were deposited in a chemotaxis chamber with a cAMP gradient pointing to the right. Cells were videorecorded for 10 min at a rate of 15 frames per min. The cell perimeters were outlined and are presented for five representative cells as a stack of successive outlines at 8 s interval. The first outline is indicated by an asterisk. (A) Wild-type DH1 cells; (B) guanylyl cyclase gca–/sgc– null cells; (C) cGMP phosphodiesterase gbpA–B– null cells; and (D) gbpC–D– cells lacking the two cGMP targets.
The quantitative data on cell movement in chemotactic gradients are presented in Table III. The speed of movement in the mutants is still significantly slower than in wild-type cells. Movement of wild-type cells exhibits a significantly smaller direction change in the chemotactic gradient in comparison with movement in buffer. The reduction in turning and increased persistence induced by cAMP are also observed in gbpA–B– cells, but not in gca–/sgc– and gbpC–D– cells. The chemotaxis index is a measure of the efficiency of moving in the direction of the chemotactic gradient. A chemotactic index of +1.00 reflects direct movement up a spatial gradient, and a chemotactic index of 0.00 reflects random movement. The chemotactic index of wild-type DH1 cells was +0.46 ± 0.29 (Table III), which is within the range of other wild-type strains (Varnum and Soll, 1984; Zhang et al., 2002). The chemotactic index of gbpA–B– cells is +0.61 ± 0.26, which is significantly larger than the chemotactic index of wild-type cells (P < 0.05). The suppression of lateral pseudopodia is sufficient to explain the increased chemotactic efficiency of gbpA–B– cells. In contrast, the chemotactic efficiency of gbpC–D– and gca–/sgc– cells is severely reduced. The chemotactic indices of gbpC–D– and gca–/sgc– cells are +0.06 and +0.05, respectively, very close to the value for random movement. Poor chemotaxis can be caused by impaired movement or by poor orientation in the gradient, or by both. The fastest gbpC–D– and gca–/sgc– cells, which crawled as fast as the slowest DH1 cells, exhibited an average chemotactic index of +0.12, while the slowest DH1 cells exhibited an average chemotactic index above +0.24. Furthermore, the cell traces and the data show that ∼40% of gbpC–D– and gca–/sgc cells move in the wrong direction, supporting the conclusion that orientation in a spatial gradient is defective.
Discussion
cGMP phosphodiesterases
GbpA and GbpB have, in addition to the two cNB domains, a Zn2+-hydrolase domain. This domain is found in many metal-dependent hydrolases (Carfi et al., 1995), such as β-lactamases, glyoxalases and type II PDEs from yeast (Nikawa et al., 1987) and Dictyostelium (Lacombe et al., 1986). Disruption of gbpA demonstrates that the gene encodes the previously characterized cGMP-stimulated cGMP PDE; cAMP does not activate the enzyme and is not hydrolysed (Van Haastert et al., 1982a). GbpB appears to encode a previously unrecognized dual- specificity enzyme with respect to both substrate and activation. This conclusion is confirmed by detailed kinetic analysis of GbpB overexpressed in gbpA–B– null cells: GbpB hydrolyses cAMP between 4- and 8-fold faster than cGMP and is half-maximally activated by 0.7 µM cAMP and 2.2 µM cGMP (L.Bosgraaf, H.Russcher, H.Snippe, S.Bader, J.Wind and P.J.M.Van Haastert, submitted for publication). We propose that GbpA and B hydrolyse the substrate in the Zn2+-hydrolase domains, whereas the cNB domains mediate activation by cAMP or cGMP. It is intriguing that the biochemical properties of GbpA are very similar to those of human cGMP-stimulated PDE2 with respect to Km value and activation mechanism, although the protein sequences are completely different. The catalytic domain of human PDE2 belongs to the large family of PDE class I enzymes, and the cGMP-binding regulatory domain is unrelated to the cNB domain of GbpA but belongs to the group of GAF domains (Francis et al., 2000). The biochemical phenotype of the gbpA– cells is similar to that of the chemically mutated Dictyostelium stmF, which lacks the cGMP-stimulated PDE activity (Ross and Newell, 1981; Van Haastert et al., 1982b). We have analysed the gbpA gene from strain NP368 and observed a transcript and no mutation that could explain the absence of GbpA PDE activity, such as the introduction of stop codons or mutations in the proposed catalytic domain (unpublished observations).
cGMP-binding target proteins
Wild-type cells contain ∼200 fmol/mg protein cGMP-binding sites with high affinity (Kd of 4 nM) and ∼1000 fmol/mg protein low affinity sites with a Kd of 200–500 nM. The intracellular cGMP concentration rises during stimulation to 5–10 pmol/107 cells, which is equivalent to 1–2 µM, suggesting that both high and low affinity cGMP-binding sites are potentially functional in vivo. High affinity cGMP binding is lost in gbpC– cells, indicating that at least one of the cNB domains of GbpC encodes these high affinity sites. Low affinity cGMP-binding activity of other gbp-null cells does not disappear in a specific disruptant, which may indicate that multiple Gbps have a low affinity cGMP-binding site. In agreement with this hypothesis, the experimentally determined cGMP activation constant of GbpA PDE (Ka = 0.2 µM) and GbpB PDE (Ka = 2 µM) implies that at least one of the cNB domains of GbpA and GbpB bind cGMP with this low affinity.
cGMP regulation of myosin II
Myosin II has been implicated as the main target of cGMP signalling in Dictyostelium cells (de la Roche and Cote, 2001). The identification of the genes encoding the guanylyl cyclases GCA and sGC (Roelofs and Van Haastert, 2002), and the present identification of the gbpA–gbpD genes (Goldberg et al., 2002) as cGMP PDEs and cGMP targets has allowed us to investigate the importance of cGMP in regulating myosin II in vivo using engineered mutants. The results show that cAMP-mediated phosphorylation of RLC and MHC, and the association of MHC with the cytoskeleton, are all altered in the mutants compared with wild-type cells, suggesting that these myosin responses are regulated by a common cGMP signalling pathway.
Basal RLC phosphorylation levels are nearly identical in wild-type and gbpA–B– cells, even though basal cGMP levels in the mutant exceed the maximal level reached during stimulation in wild-type cells. These data imply that cGMP alone does not induce RLC phosphorylation, but that receptor stimulation is needed. On the other hand, cGMP probably promotes RLC phosphorylation, because receptor-stimulated RLC phosphorylation is strongly enhanced in gbpA–B– cells at longer times after cAMP stimulation. During the first 30 s after stimulation, the increase in RLC phosphorylation in gbpA–B– cells is very similar to that in wild-type cells. In wild-type cells, however, RLC phosphorylation begins to decrease at ∼30 s, whereas it continues to increase until 90 s in gbpA–B– cells. Liu and Newell (1994) observed a similar delay in the time at which maximum RLC phosphorylation levels were reached in stmF mutant cells, which also have enhanced cGMP levels.
A possible requirement for cGMP in RLC phosphorylation was investigated further using gca–/sgc– cells. Previously, Liu and Newell (1994) found no increase in RLC phosphorylation in genetically isolated mutants which make no cGMP in response to chemoattractant. In contrast, we found a small but significant 1.3-fold increase in RLC phosphorylation, compared with a 2.4-fold increase in wild-type cells, suggesting only a partial requirement for cGMP in the chemoattractant-elicited increase in RLC phosphorylation. Our data are consistent with a model where cGMP facilitates chemoattractant-elicited RLC phosphorylation, but that other, cGMP-independent, pathways are also involved. The difference in our findings compared with those of Liu and Newell (1994) may be due to additional genetic lesions present in the strains used in their studies.
GbpC–D– cells have low levels of basal RLC phosphorylation, and a reduced increase in RLC phosphorylation in response to chemoattractants. Since similar results were obtained in gbpC– cells, we attribute these effects to GbpC. The cNB domains are likely candidates for receiving the cGMP signal. The Ras, MAPKKK and/or Ras-GEF domains may transduce the cGMP signal, but may also function to receive other input signals. In Dictyostelium, RLC is phosphorylated by MLCK-A and by one or more additional MLCKs which have not been identified. MLCK-A is a good candidate for mediating the cGMP-dependent component of RLC phosphorylation, since in crude lysates it is activated by cGMP (Silveira, 1998). Since MLCK-A is activated by phosphorylation by an upstream kinase (Smith et al., 1996), GbpC might directly phosphorylate MLCK-A, or GbpC might activate a protein kinase cascade which results in MLCK-A phosphorylation.
MHC association with the cytoskeleton
cAMP stimulation normally induces a minor transient dissociation of myosin from the cytoskeleton at ∼10 s, followed by a more pronounced association of MHC with the cytoskeleton, with a maximum at ∼90 s after stimulation (Liu and Newell, 1991). In gca–/sgc–, gbpC–D– and gbpC– cells, myosin flux in response to chemoattractant is impaired, consisting of a major dissociation from the cytoskeleton that is not followed by the association with the cytoskeleton as in wild-type cells. These results suggest that cGMP binding to GbpC has a major effect on MHC phosphorylation and myosin assembly.
Threonine phosphorylation of MHC is known to induce bending of MHC and hence dissociation of myosin II from the cytoskeleton. This hypothesis seems paradoxical in relation to the observation of receptor-stimulated MHC phosphorylation and association of MHC with the cytoskeleton in wild-type, and also to the reduced MHC phosphorylation and dissociation of MHC from the cytoskeleton in gca–/sgc–, gbpC–D– and gbpC– cells. However, a simple correlation between MHC phosphorylation and recruitment to the cytoskeleton cannot be made, because a substantial fraction of MHC phosphorylation in vivo is on serine, not threonine, the function of which is unknown (Berlot et al., 1987). Future studies measuring threonine phosphorylation of MHC derived from the cytoskeleton and the soluble fraction may elucidate the mechanism by which GbpC regulates myosin II filament formation.
Role of cGMP in chemotaxis
The gca–/sgc– double-null cells aggregate slowly and show strongly reduced chemotactic activity, indicating that a cGMP-based signal transduction pathway is critical for chemotaxis. Deletion of the two PDEs, GbpA and GbpB, results in enhanced cGMP levels and improved chemotaxis. Apparently, elevated cGMP levels do not disturb the processing of chemotactic signals in a spatial gradient. A similar conclusion was reached previously using the mutant stmF with a defect of cGMP PDE activity similar to that in gbpA– (Chandrasekhar et al., 1995). Cells with a deletion of the two cGMP-binding targets, GbpC and GbpD, show a strongly reduced chemotactic activity and delayed cell aggregation. The magnitude of the defect is similar to that in guanylyl cyclase null mutant cells, suggesting that these cGMP targets mediate the critical role of cGMP in chemotaxis.
Chemotaxis in a spatial gradient of cAMP is a complex behaviour, including components such as speed of locomotion, orientation of new pseudopodia, suppression of lateral pseudopodia and cell polarity. Detailed analysis of the behaviour of the PDE mutant gbpA–B– in a spatial gradient of cAMP suggests that enhanced chemotaxis is not caused by an increase in the speed of movement, but rather is due to the stronger suppression of lateral pseudopodia leading to a more elongated morphology and more persistent movement in the direction of the increasing cAMP gradient. This behavioural phenotype correlates with prolonged association of MHC with the cytoskeleton and delayed phosphorylation of MHC and RLC, and is consistent with the phenotype of stmF, which also has increased levels of cortical myosin (Liu and Newell, 1991). The behaviour of gca–/sgc– and gbpC–D– null cells in chemotactic gradients suggests that the chemotactic defect is caused in both strains by a combination of three main effects, a 50% reduction in the speed of movement, less persistent movement and a strong reduction in the capacity to orient in the direction of a positive gradient. Reduced persistence and reduced orientation are associated with reduced polarity of the cells and depletion of myosin II from the cytoskeleton. These results are consistent with observations on phosphorylation-defective MHC mutant cells, demonstrating that cGMP-regulated phosphorylation of MHC is important for chemotactic movement.
The phenotypes of the present mutants may be compared with that of the previously characterized mutant KI8, which exhibits very low activity of both guanylyl cyclases GCA and sGC (Kuwayama et al., 1993). This chemically mutagenized cell line was obtained in a screen that started by first isolating aggregation-minus clones and then assaying the cells for the absence of chemotaxis towards cAMP and folic acid. Since the guanylyl cyclase double-null cells do finally aggregate, such a mutant would not have been isolated in the screen for KI mutants. This suggest that KI8 either has multiple independent mutations, or has a mutation that affects both the cGMP pathway and another pathway that together are essential for chemotaxis. The latter hypothesis is consistent with the view discussed above that cGMP plays a critical role during chemotaxis in a network of other signalling molecules.
On agar, gca–/sgc– and gbpC–D– null cells can eventually aggregate, as was also observed for myosin II mutants with a deletion of MHC of RLC (see de la Roche and Cote, 2001). We observed that gca–/sgc– and sgc– null cells aggregate poorly on a support under buffer. Furthermore, the mutants require ∼10-fold steeper gradients of cAMP to induce a chemotactic response than are required for wild-type cells (Roelofs et al., 2001a). Such steep gradients are present at the mid phase of oscillatory signalling during cell aggregation on agar, but gradients are less steep at the beginning and the end of the cAMP wave, in the chemotaxis chamber, or during cell aggregation under buffer. The significant reduction of chemotactic sensitivity explains the delay in cell aggregation of gca–/sgc– and gbpC–D–, as well as the poor aggregation under buffer, and is probably a severe disadvantage in the wild where cells aggregate at the soil–water interface.
A model for cGMP signalling to myosin II regulation and chemotaxis
We have found that cGMP activation of GbpC plays a major role in regulating myosin II in response to chemotactic stimulation. A model is emerging where cAMP stimulation of cells results in transient activation of the guanlyl cyclases GCA and sGC (Roelofs and Van Haastert, 2002), leading to the accumulation of cGMP. This cGMP is degraded rapidly by the PDEs GbpA and GbpB; as a result, the increase in cGMP concentration is transient, with a maximum at 10 s (Figure 8). cGMP binds to a high affinity cGMP-binding protein in vivo (Van Haastert et al., 1982a), that is now identified as GbpC. cGMP binding to GbpC in vivo reaches a maximum at ∼15 s after stimulation followed by dissociation of the complex with a half-time of ∼90 s. Activated GbpC makes a major contribution to RLC phosphorylation, which reaches a maximum at ∼30 s, and decays slowly to basal levels at ∼2–3 min after stimulation. Binding of cGMP to GbpC is also needed for MHC phosphorylation and the recruitment of myosin to the cytoskeleton. Myosin II filament formation plays a critical role in maintaining cell shape and persistent translocation in a spatial gradient of chemoattractant. By testing the role of cGMP in myosin regulation using genetically engineered mutants, and identifying GbpC as a key player, this study is an important step towards elucidating the exact pathways involved in regulating myosin II during chemotaxis.

Fig. 8. Time course of the cGMP and myosin responses in wild-type cells. The responses were calculated by first subtracting basal levels of unstimulated cells and are then expressed as a percentage of the maximal response. Data are from Figures 2, 5 and 6; the cGMP occupancy of GbpC is taken from Van Haastert et al. (1982a). Symbols refer to cGMP (open circles); phosphorylation of RLC (filled triangles); phosphorylation of MHC (filled inverted triangles); MHC in the cytoskeleton of wild-type cells (filled squares); and MHC in the cytoskeleton of gca–/sgc– and gbpC–D– cells (open squares). The cGMP occupancy of GbpC is presented as a dotted line.
Materials and methods
Strain and culture conditions
AX3 (wild-type), DH1 (a uracil auxotroph wild-type), gca–/sgc– (a guanylyl cyclase-null cell line; Roelofs and Van Haastert, 2002) and the mutant cell lines described below were grown in HG5 medium to a density of ∼2 × 10⁶ cells/ml. When grown with selection, HG5 medium was supplemented with 10 µg/ml blasticidin S. Cells were starved for up to 6 h by shaking in 10 mM phosphate buffer pH 6.5 (PB) at a density of 107 cells/ml, or for longer periods on non-nutrient agar.
Gene disruption
To make disruptants of the gbp genes, the following strategy was used. PCR primers (see below) were designed that would amplify a fragment of 0.5–1 kb with a unique restriction site approximately in the middle. Genomic DNA was used as template for the PCR, and the amplified DNA was subcloned. The unique restriction site was used subsequently to introduce either the Bsr (Sutoh, 1993) or the pyr5/6 selection cassette. [The pyr5/6 cassette contains the coding region of the pyr5/6 protein (Boy-Marcotte and Jacquet, 1982) that was amplified by PCR and cloned into a vector between the actin15 promoter and the actin 8 terminator.] The resulting disruption plasmid was digested with restriction enzymes to obtain the selection cassette with gbp flanking sequences, which was purified and amplified by PCR with the primers that were used to obtain the original gbp genomic fragment. Approximately 5 µg of the PCR product was used to transform Dictyostelium DH1 cells by electroporation. To select for transformants with the bsr cassette, HG5 was supplemented with 10 µg/ml blasticidin, while transformants with the pyr5/6 cassette were selected using uracil-deficient FM medium. Potential knock-outs were screened by PCR and confirmed by Southern and northern blot analysis. The positions of interruption of the ORFs are indicated in Figure 1.
For disruption of gbpA, the PCR primers TCATAGATCTAGAA GGTGATTATACAG and AGTTGGATCCATTGTTGCTAATTC were used. The selection cassette was cloned into the MslI site of the 468 bp PCR product. For gbpB, the PCR product was 900 bp using the primers CCATTCTATGTGAAGTCAATC and AATTACTACTTACCAGCA CC. The pyr5/6 cassette was cloned in the BclI restriction site. The PCR primers for gbpD were TCAAAGATTAGAGAAGAGAC and TAGTTGAGCTTGAATTACAC. The 858 bp PCR product contained a BglII restriction site used to incorporate the pyr5/6 cassette. Disruption of gbpC was done slightly differently: the PCR primers ATCATTGATTTCGGTACAAG and TCTTCCTCTGTGAAAATATC were used to obtain a 874 bp product; the Bsr cassette was introduced in the unique BglII site. Subsequently, the primers TTGATCAATTTACCTCAATC and TTCTAGACGATCACCTAAAATAC were used to obtain another 333 bp product, which was exchanged with the first 426 bp of the 874 bp product, in front of the Bsr resistance cassette. Homologous recombination introduces a 2.5 kb deletion of the gene.
Phosphodiesterase assay
Cells were starved until the tight aggregate stage, washed twice with PDE lysis buffer (40 mM HEPES/NaOH, 0.5 mM EDTA pH 7.0) and resuspended at a density of 108 cells/ml in PDE lysis buffer supplemented with 0.25 M sucrose. Cells were lysed by passage through a 0.45 µm Nuclepore filter. The lysate was centrifuged for 2 min at 14 000 g and the supernatant was used.
The PDE assay mixture (final concentrations) contained assay buffer (40 mM HEPES/NaOH pH 7.0, 0.5 mM EDTA, 0.25 M sucrose, 5 mM MgCl2), 10 nM [3H]cGMP as substrate, 50 µM cAMP, 5 mM dithiothreitol (DTT) and 30 µl of enzyme in a total volume of 100 µl; the lysates were diluted to achieve between 10 and 30% hydrolysis of cGMP. After incubation for 15 min at 22°C, reactions were terminated by boiling for 1 min. The 5′ GMP produced was dephosphorylated by calf intestine phosphatase (CIP; 1 U of enzyme in 100 µl of CIP buffer incubated for 1 h at 37°C). Finally, 300 µl of a 50% slurry of DOWEX AG1X2 was added to remove remaining cGMP. After 15 min incubation at 22°C, samples were centrifuged for 2 min at 14 000 g, and the radioactivity in 200 µl of the supernatant was determined.
cGMP-binding assay
Cells were starved for 4 h and, after lysis as described above, the 14 000 g supernatant was centrifuged for 1 h at 48 000 g. The newly obtained supernatant was used in an assay containing assay buffer (20 mM HEPES/NaOH, 0.25 mM EDTA, 50 mM phosphate buffer, 0.125 M sucrose, 3 mM MgCl2 pH 6.1), 5 mM DTT, 2–100 nM [3H]cGMP, 0–1 µM unlabelled cGMP and 100 µl lysate in a total volume of 200 µl. After 15 min at 0°C, the mixture was filtered over nitrocellulose filters (pore size 0.45 µm) and the filters were washed twice with 4 ml of ice-cold 50 mM phosphate buffer pH 6.1. The radioactivity associated with the filters was determined using a liquid scintillation counter. To determine non-specific binding, 30 µM cGMP was included in the assay mixture.
cGMP response to cAMP
Cells were starved for 5 h, washed and resuspended in PB at a density of 108 cells/ml, and stimulated with 0.1 µM cAMP. The reactions were terminated with an equal volume of 3.5% (v/v) perchloric acid at the indicated time points. After neutralization with KHCO3 and centrifugation, the cGMP content was determined by radioimmunoassay.
Phosphorylation of RLC and MHC
Cells were starved for 2 h in 20 mM MES, 0.2 mM CaCl2, 2 mM MgSO4 pH 6.8 at a density of 2 × 10⁷ cells/ml, pulsed with cAMP (4 h with 100 nM cAMP at 10 pulses/h) and incubated for 30 min with 5 mM caffeine to inhibit endogenous cAMP oscillations. Subsequently, cells were incubated with [32P]orthophosphate (500 µCi per ml). Cells were stimulated at t = 0 s with 1 µM cAMP and 10 mM DTT, and, at the indicated time points, 200 µl samples were added to 10 µl of 20% SDS. RLC and MHC were immunoprecipitated and subjected to SDS–PAGE as described (Smith et al., 1996). The radioactivity on the gels was quantified using a phosphoimager.
Determination of myosin content in the Triton-insoluble fraction
Cells were starved, treated with caffeine and stimulated with cAMP as described above. At the indicated time points, 150 µl of the cell suspension was added to 150 µl of ice-cold lysis buffer [180 mM MES pH 6.8, 5 mM MgCl2, 1% Triton X-100, 100 µg/ml phenylmethylsulfonyl fluoride (PMSF), 1.5 mM TLCK, 100 µg/ml TAME, 80 µg/ml TPCK, 2 µg/ml pepstatin, 5 µg/ml leupeptin, 1 mM ATP], and incubated on ice for 5 min. The samples were divided into a supernatant and a pellet fraction by centrifugation at 14 000 g for 1 min. The pellet fractions were dissolved in 40 µl of 2× sample buffer. The proteins in the supernatant fractions were precipitated with 700 µl of acetone, collected after 10 min on ice by centrifugation for 1 min at 14 000 g and dissolved with 40 µl of 2× sample buffer. Finally, the samples were boiled for 5 min and analysed by PAGE and subsequent western blotting using anti-MHC antibody and goat anti-rabbit IgG linked with horseradish peroxidase as a secondary antibody. The chemiluminescence was quantified using a phosphoimager.
Computer-assisted analysis of single cell chemotaxis in a spatial gradient of cAMP
To initiate development, growth phase cells were washed in buffered salts solution (BSS) containing 20 mM KCl, 2.5 mM MgCl2 and 20 mM KH2PO4 pH 6.4, and dispersed on a black filter pad saturated with BSS at a density of 5 × 10⁶ cells per cm2. Amoebae were washed off the filter pads at the ripple stage, which in dense cultures represents the onset of aggregation, the time at which Dictyostelium amoebae attain their highest average velocity (Varnum and Soll, 1984). In this case, the onset of aggregation was observed between 8 and 11 h, depending on the particular strain.
The motile behaviour of cells in buffer and in spatial gradients of cAMP was analysed using computer-assisted methods previously described (Soll, 1995; Soll et al., 2001). Briefly, cells were dispersed on the bridge of a Plexiglas gradient chamber, in which one of the two troughs bordering the bridge contained BSS and the other trough contained BSS plus 10–6 M cAMP. Cells were videorecorded through a 25× objective with bright field optics for a 10 min period following an initial 5 min incubation period necessary to establish a steep gradient. Images were digitized at a rate of 15 frames per min. 2D-DIAS software then automatically outlined the cell perimeters and converted them to β-spline replacement images from which the position of the cell centroid was determined. The chemotactic index, speed and change of direction were computed from the centroid position. The chemotactic index is the net distance moved towards the source of chemoattractant divided by the total distance moved in the same time period.
Acknowledgments
Acknowledgements
This research was supported by the National Science Foundation and by The Netherlands Organization of Scientific Research. Motility research was supported by National Institutes of Health grant HD-18577 and the W.M.Keck Dynamic Image Analysis Facility at the University of Iowa.
References
- Berlot C.H., Devreotes,P.N. and Spudich,J.A. (1987) Chemoattractant-elicited increases in Dictyostelium myosin phosphorylation are due to changes in myosin localization and increases in kinase activity. J. Biol. Chem., 262, 3918–3926. [PubMed] [Google Scholar]
- Boy-Marcotte E. and Jacquet,M. (1982) A Dictyostelium discoideum DNA fragment complements a Saccharomyces cerevisiae ura3 mutant. Gene, 20, 433–439. [DOI] [PubMed] [Google Scholar]
- Carfi A., Pares,S., Duee,E., Galleni,M., Duez,C., Frere,J.M. and Dideberg,O. (1995) The 3-D structure of a zinc metallo-β-lactamase from Bacillus cereus reveals a new type of protein fold. EMBO J., 14, 4914–4921. [DOI] [PMC free article] [PubMed] [Google Scholar]
- Chandrasekhar A., Wessels,D. and Soll,D.R. (1995) A mutation that depresses cGMP phosphodiesterase activity in Dictyostelium affects cell motility through an altered chemotactic signal. Dev. Biol., 169, 109–122. [DOI] [PubMed] [Google Scholar]
- de la Roche M.A. and Cote,G.P. (2001) Regulation of Dictyostelium myosin I and II. Biochim. Biophys. Acta, 1525, 245–261. [DOI] [PubMed] [Google Scholar]
- de Rooij J., Zwartkruis,F.J., Verheijen,M.H., Cool,R.H., Nijman,S.M., Wittinghofer,A. and Bos,J.L. (1998) Epac is a Rap1 guanine-nucleotide-exchange factor directly activated by cyclic AMP. Nature, 396, 474–477. [DOI] [PubMed] [Google Scholar]
- Dembinsky A., Rubin,H. and Ravid,S. (1996) Chemoattractant-mediated increases in cGMP induce changes in Dictyostelium myosin II heavy chain-specific protein kinase C activities. J. Cell Biol., 134, 911–921. [DOI] [PMC free article] [PubMed] [Google Scholar]
- Egelhoff T.T., Lee,R.J. and Spudich,J.A. (1993) Dictyostelium myosin heavy chain phosphorylation sites regulate myosin filament assembly and localization in vivo. Cell, 75, 363–371. [DOI] [PubMed] [Google Scholar]
- Francis S.H., Turko,I.V. and Corbin,J.D. (2000) Cyclic nucleotide phosphodiesterases: relating structure and function. Prog. Nucleic Acid Res. Mol. Biol., 65, 1–52. [DOI] [PubMed] [Google Scholar]
- Goldberg J.M., Bosgraaf,L., Van Haastert,P.J.M. and Smith,L. (2002) Identification of four candidate cGMP targets in Dictyostelium. Proc. Natl Acad. Sci. USA, 99, 6749–6754. [DOI] [PMC free article] [PubMed] [Google Scholar]
- Houslay M.D. and Milligan,G. (1997) Tailoring cAMP-signalling responses through isoform multiplicity. Trends Biochem. Sci., 22, 217–224. [DOI] [PubMed] [Google Scholar]
- Kuwayama H., Ishida,S. and Van Haastert,P.J.M. (1993) Non-chemotactic Dictyostelium discoideum mutants with altered cGMP signal transduction. J. Cell Biol., 123, 1453–1462. [DOI] [PMC free article] [PubMed] [Google Scholar]
- Kuwayama H., Snippe,H., Derks,M., Roelofs,J. and Van Haastert,P.J.M. (2001) Identification and characterization of DdPDE3, a cGMP-selective phosphodiesterase from Dictyostelium. Biochem. J., 353, 635–644. [DOI] [PMC free article] [PubMed] [Google Scholar]
- Lacombe M.L., Podgorski,G.J., Franke,J. and Kessin,R.H. (1986) Molecular cloning and developmental expression of the cyclic nucleotide phosphodiesterase gene of Dictyostelium discoideum. J. Biol. Chem., 261, 16811–16817. [PubMed] [Google Scholar]
- Linder J.U., Engel,P., Reimer,A., Kruger,T., Plattner,H., Schultz,A. and Schultz,J.E. (1999) Guanylyl cyclases with the topology of mammalian adenylyl cyclases and an N-terminal P-type ATPase-like domain in Paramecium, Tetrahymena and Plasmodium. EMBO J., 18, 4222–4232. [DOI] [PMC free article] [PubMed] [Google Scholar]
- Liu G. and Newell,P.C. (1991) Evidence that cyclic GMP may regulate the association of myosin II heavy chain with the cytoskeleton by inhibiting its phosphorylation. J. Cell Sci., 98, 483–490. [DOI] [PubMed] [Google Scholar]
- Liu G. and Newell,P.C. (1994) Regulation of myosin regulatory light chain phosphorylation via cyclic GMP during chemotaxis of Dictyostelium. J. Cell Sci., 107, 1737–1743. [DOI] [PubMed] [Google Scholar]
- Liu G., Kuwayama,H., Ishida,S. and Newell,P.C. (1993) The role of cyclic GMP in regulating myosin during chemotaxis of Dictyostelium: evidence from a mutant lacking the normal cyclic GMP response to cyclic AMP. J. Cell Sci., 106, 591–595. [DOI] [PubMed] [Google Scholar]
- Nikawa J., Sass,P. and Wigler,M. (1987) Cloning and characterization of the low-affinity cyclic AMP phosphodiesterase gene of Saccharomyces cerevisiae. Mol. Cell. Biol., 7, 3629–3636. [DOI] [PMC free article] [PubMed] [Google Scholar]
- Passner J.M., Schultz,S.C. and Steitz,T.A. (2000) Modeling the cAMP-induced allosteric transition using the crystal structure of CAP-cAMP at 2.1 Å resolution. J. Mol. Biol., 304, 847–59. [DOI] [PubMed] [Google Scholar]
- Roelofs J. and Van Haastert,P.J. (2002) Characterization of two unusual guanylyl cyclases from Dictyostelium. J. Biol. Chem., 277, 9167–9174. [DOI] [PubMed] [Google Scholar]
- Roelofs J., Meima,M., Schaap,P. and Van Haastert,P.J.M. (2001a) The Dictyostelium homologue of mammalian soluble adenylyl cyclase encodes a guanylyl cyclase. EMBO J., 20, 4341–4348. [DOI] [PMC free article] [PubMed] [Google Scholar]
- Roelofs J., Snippe,H., Kleineidam,R.G. and Van Haastert,P.J.M. (2001b) Guanylate cyclase in Dictyostelium discoideum with the topology of mammalian adenylate cyclase. Biochem. J., 354, 697–706. [DOI] [PMC free article] [PubMed] [Google Scholar]
- Ross F.M. and Newell,P.C. (1981) Streamers: chemotactic mutants of Dictyostelium discoideum with altered cyclic GMP metabolism. J. Gen. Microbiol., 127, 339–350. [DOI] [PubMed] [Google Scholar]
- Silveira L.A., Smith,J.L., Tan,J.L. and Spudich,J.A. (1998) MLCK-A, an unconventional myosin light chain kinase from Dictyostelium, is activated by a cGMP-dependent pathway. Proc. Natl Acad. Sci. USA, 95, 13000–13005. [DOI] [PMC free article] [PubMed] [Google Scholar]
- Smith J.L., Silveira,L.A. and Spudich,J.A. (1996) Activation of Dictyostelium myosin light chain kinase A by phosphorylation of Thr166. EMBO J., 15, 6075–6083. [PMC free article] [PubMed] [Google Scholar]
- Soll D.R. (1995) The use of computers in understanding how animal cells crawl. Int. Rev. Cytol., 163, 43–104. [PubMed] [Google Scholar]
- Soll D.R., Wessels,D., Voss,E. and Johnson,O. (2001) Computer-assisted systems for the analysis of amoeboid cell motility. Methods Mol. Biol., 161, 45–58. [DOI] [PubMed] [Google Scholar]
- Stites J., Wessels,D., Uhl,A., Egelhoff,T., Shutt,D. and Soll,D.R. (1998) Phosphorylation of the Dictyostelium myosin II heavy chain is necessary for maintaining cellular polarity and suppressing turning during chemotaxis. Cell Motil. Cytoskel., 39, 31–51. [DOI] [PubMed] [Google Scholar]
- Sutoh K. (1993) A transformation vector for Dictyostelium discoideum with a new selectable marker bsr. Plasmid, 30, 150–154. [DOI] [PubMed] [Google Scholar]
- Vaillancourt J.P., Lyons,C., Cote,G.P., Egelhoff,T.T., Lee,R.J. and Spudich,J.A. (1988) Identification of two phosphorylated threonines in the tail region of Dictyostelium myosin II. Dictyostelium myosin heavy chain phosphorylation sites regulate myosin filament assembly and localization in vivo. J. Biol. Chem., 263, 10082–10087. [PubMed] [Google Scholar]
- Van Haastert P.J.M. and Van Lookeren Campagne,M.M. (1984) Transient kinetics of a cGMP-dependent cGMP-specific phosphodiesterase from Dictyostelium discoideum. J. Cell Biol., 98, 709–716. [DOI] [PMC free article] [PubMed] [Google Scholar]
- Van Haastert P.J.M. and Kuwayama,H. (1997) cGMP as second messenger during Dictyostelium chemotaxis. FEBS Lett., 410, 25–8. [DOI] [PubMed] [Google Scholar]
- Van Haastert P.J.M., Van Walsum,H. and Pasveer,F.J. (1982a) Nonequilibrium kinetics of a cyclic GMP-binding protein in Dictyostelium discoideum. J. Cell Biol., 94, 271–278. [DOI] [PMC free article] [PubMed] [Google Scholar]
- Van Haastert P.J.M., Van Walsum,H., Van der Meer,R.C., Bulgakov,R. and Konijn,T.M. (1982b) Specificity of the cyclic GMP-binding activity and of a cyclic GMP-dependent cyclic GMP phospho diesterase in Dictyostelium discoideum. Mol. Cell. Endocrinol., 25, 171–182. [DOI] [PubMed] [Google Scholar]
- Varnum B. and Soll,D.R. (1984) Effects of cAMP on single cell motility in Dictyostelium. J. Cell Biol., 99, 1151–1155. [DOI] [PMC free article] [PubMed] [Google Scholar]
- Wessels D., Soll,D.R., Knecht,D., Loomis,W.F., De Lozanne,A. and Spudich,J. (1988) Cell motility and chemotaxis in Dictyostelium amebae lacking myosin heavy chain. Dev. Biol., 128, 164–177. [DOI] [PubMed] [Google Scholar]
- Zhang H., Wessels,D., Fey,P., Daniels,K., Chisholm,R.L. and Soll,D.R. (2002) Phosphorylation of the myosin regulatory light chain plays a role in motility and polarity during Dictyostelium chemotaxis. J. Cell Sci., 115, 1733–1747. [DOI] [PubMed] [Google Scholar]