

Abstract
During replication of the Escherichia coli chromosome, the replicated Ori domains migrate towards opposite cell poles, suggesting that a cis-acting site for bipolar migration is located in this region. To identify this cis-acting site, a series of mutants was constructed by splitting subchromosomes from the original chromosome. One mutant, containing a 720 kb subchromosome, was found to be defective in the bipolar positioning of oriC. The creation of deletion mutants allowed the identification of migS, a 25 bp sequence, as the cis-acting site for the bipolar positioning of oriC. When migS was located at the replication terminus, the chromosomal segment showed bipolar positioning. migS was able to rescue bipolar migration of plasmid DNA containing a mutation in the SopABC partitioning system. Interestingly, multiple copies of the migS sequence on a plasmid in trans inhibited the bipolar positioning of oriC. Taken together, these findings indicate that migS plays a crucial role in the bipolar positioning of oriC. In addition, real-time analysis of the dynamic morphological changes of nucleoids in wild-type and migS mutants suggests that bipolar positioning of the replicated oriC contributes to nucleoid organization.
Keywords: bacteria, migration, mukB, nucleoids, partitioning, segregation
Introduction
The replicon theory of bacterial chromosome segregation suggested that newly replicated chromosomes were segregated into their daughter cells through a passive, membrane-bound process (Jacob et al, 1963). In recent years, it has become clear that bacterial chromosome segregation is, in fact, an active process involving specific mechanisms (reviewed in Gordon and Wright, 2000; Hiraga, 2000; Draper and Gober, 2002); however, some basic questions still remain to be resolved. One of these questions is whether a cis-acting centromere-like site exists in the bacterial genome. In prokaryotes, a centromere-like structure is considered to be a cis-acting DNA sequence involved in chromosome migration, as opposed to a site for attachment to microtubules in eukaryotes. Cytological experiments using fluorescence probes have revealed that replicated oriC segments abruptly migrate towards opposite poles in several bacteria (Glaser et al, 1997; Gordon et al, 1997; Lewis and Errington, 1997; Webb et al, 1997; Niki and Hiraga, 1998; Jensen and Shapiro, 1999). In replicating Escherichia coli cells, bipolar migration involves not only the oriC segment but also the large flanking region, the Ori domain, which is about 900 kb of the chromosomal segment including oriC (Niki et al, 2000). If a cis-acting site is involved in bipolar migration, it is expected to be located within this large chromosomal region. Clearly, the oriC sequence itself is not sufficient for bipolar migration of oriC on the chromosome because an oriC plasmid is localized randomly in the cytosolic region (Niki and Hiraga, 1999) and bipolar migration is not affected in a mutant lacking oriC (Gordon et al, 2002). Previous studies have suggested the presence of a cis-acting centromere-like site in prokaryotes. In Bacillus subtilis, a 150 kb chromosomal segment to the left of oriC was found to be necessary for attachment to the end-pole during ongoing sporulation (Wu and Errington, 2002). Chromosomal attachment to the end pole position in B. subtilis is mediated by the Rac protein, which forms a bridge between chromosomal sites and division protein DivIVA that is located at the end pole (Edwards and Errington, 1997; Ben-Yehuda et al, 2003).
Extrachromosomal elements in bacteria have their own partitioning mechanisms, including a cis-acting site or a centromere-like element (Gordon and Wright, 2000; Hiraga, 2000; Draper and Gober, 2002). The partitioning mechanisms of sex factor F and prophage P1 have been actively investigated. In both extrachromosomal elements, three components which consist of two proteins and a cis-acting DNA site are involved in accurate segregation: sopA, sopB, and sopC in F plasmid, and parA, parB, and parS in P1 prophage. Homologies in amino acid sequences between SopA and ParA, and SopB and ParB have been identified, and these proteins function in a similar manner in plasmid partitioning (Davis and Austin, 1988; Funnell, 1988; Mori et al, 1989; Watanabe et al, 1992). In the case of the sopABC partitioning system, the SopB protein binds to the sopC DNA site, and SopA interacts with the SopB–sopC complex so that plasmid DNAs with sopC can faithfully segregate towards daughter cells. The plasmid DNAs are localized at the midcell, and the daughter plasmids migrate to the 1/4 and 3/4 positions of the cell length during the cell division cycle (Gordon et al, 1997; Niki and Hiraga, 1997). In addition to extrachromosomal elements, homologs of the sopA and sopB genes (the ParA and ParB families) have been found in at least 77 various bacterial chromosomes, including B. subtilis and Caulobacter crescentus (Yamaichi and Niki, 2000). While the plasmid ParA and ParB homologs clearly have a biological function in the active partitioning of each daughter plasmid towards the daughter cells, the role of the chromosomal Par homologs in chromosome partitioning is still unclear. Curiously, members of neither family, ParA or ParB, are found in the chromosomes of E. coli and related bacteria.
In this paper, we analyzed the bipolar positioning of oriC in a systematic series of chromosomal split and deletion mutants by using fluorescent in situ hybridization (FISH). In addition, visualization of the nucleoids in living cells produced real-time imaging of simultaneous chromosome replication and segregation, making it possible to assay for a cis-acting site involved in bipolar migration of oriC during nucleoid division. We propose that migS functions as a centromere-like element for bipolar positioning of the replicated oriC segment.
Results
Construction of chromosomal split mutants
To identify a cis-acting element involved in bipolar chromosome migration, a series of mutants was created by splitting subchromosomes from the original chromosome. When moved to a separate subchromosome, the cis-acting function of this element will be disrupted, which may be observed as defects in chromosome migration, or positioning.
We used a variation of Itaya's method (Itaya and Tanaka, 1997), in which a plasmid is integrated into a point of interest on a chromosome by homologous recombination between two truncated antibiotic-resistant alleles (Figure 1A). The oriC plasmid or F plasmid can systematically be integrated into a chromosome and be used as the replication origin of a secondary chromosome. The replication origin of F plasmid was mainly used to construct a chromosomal split mutant. In addition to the replication origin, a partitioning system is essential for stably maintaining the secondary chromosome in cells. The sopABC genes were introduced into all the secondary chromosomes together with a replication origin.
Figure 1.
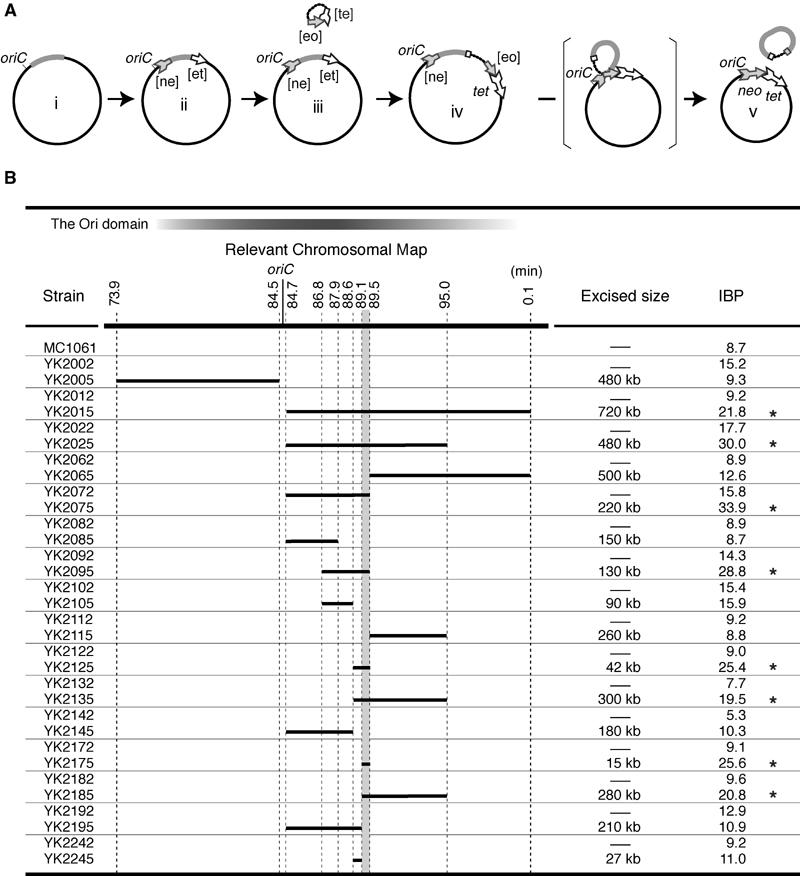
Construction and characterization of the chromosomal split mutants. (A) Schematic diagram of the construction of chromosomal split mutants. All chromosomal split mutants are derived from MC1061. The chromosomal segment to be excised is drawn in gray (i). The [ne] cassette (gray arrow tail) and the [et] cassette (white arrowhead) were inserted into the desired endpoints of the chromosomal segment to be excised. The [ne] cassette includes a neomycin- resistant gene (neo) that is deleted at the 3′-end. The [et] cassette includes a tetracyclin-resistant gene (tet) that is deleted at the 5′-end (ii). A low copy-number plasmid carrying both the [eo] cassette (gray arrowhead) and the [te] cassette (white arrow tail) was introduced. The [eo] cassette includes the neo gene that is deleted at the 5′-end. The [te] cassette is the tet gene that is deleted at the 3′-end (iii). Homologous recombination between the [te] and the [et] cassette generated a complete tetracyclin-resistant gene and simultaneously the plasmid was integrated into the chromosome (iv). Homologous recombination between the [ne] and the [eo] cassette generated a complete neomycin-resistant gene and simultaneously a subchromosome (v). (B) Chromosomal split mutants and their activity for bipolar migration of oriC. A series of chromosomal segments that were split from the original chromosome are shown as bold bars, with the E. coli chromosome map between 73.9 and 0.1 min (thick bold line). The chromosomal region including oriC nearly corresponds to the Ori domain (Niki et al. 2000), which is indicated in a bar above the chromosomal map. The IBP is the frequency of cells with two fluorescence foci located within the middle of cells, which was defined as the area between 35 and 65% of the cell length in arbitrary units. Asterisks indicate the chromosomal split mutants with significantly increased values in IBP, which are more than 18.7 (mean+2 × s.d., see the text). The chromosomal segment common to the chromosomal split mutants with higher IBP is indicated in gray.
The selected integration points for the cassettes were either in a nonessential gene or noncoding chromosome regions. None of the strains carrying integrated cassettes showed any defects in cell growth or subcellular distribution of nucleoids, even when the secondary replication origin was integrated into the chromosome (data not shown). We isolated two chromosomal split mutants: one split off the 480 kb chromosomal segment between 73.9 and 84.5 min (YK2005), and the other split off the 720 kb chromosomal segment between 84.7 and 0.1 min (YK2015, Figure 1B). Physical dissection of the chromosomes was confirmed by pulsed-field gel electrophoresis analysis (Supplementary Figure 1).
Bipolar positioning of oriC is stalled in a mutant in which a 720 kb segment is split from the chromosome
The chromosomal oriC segment is localized mainly at the middle of cells in cultures growing slowly, and oriC copies are abruptly separated after replication (Niki et al, 2000). The separated oriC segments are localized near cell poles even in cells of unit cell length. To test for bipolar positioning defects in chromosomal split mutants, we statistically analyzed the subcellular localization of oriC by FISH. Normal bipolar positioning is expected to show a distinct separation of fluorescent foci to the opposite cell poles, while defects may result in a less obvious separation of the two foci.
We tested the localization of oriC at the midcell in the chromosomal split mutants. The subcellular localization of oriC indicates that, in cells with a single oriC focus, the focus was localized mainly at the midcell in both wild type and the chromosomal split mutants (Figure 2A-c, B-c, C-c, and D-c).
Figure 2.
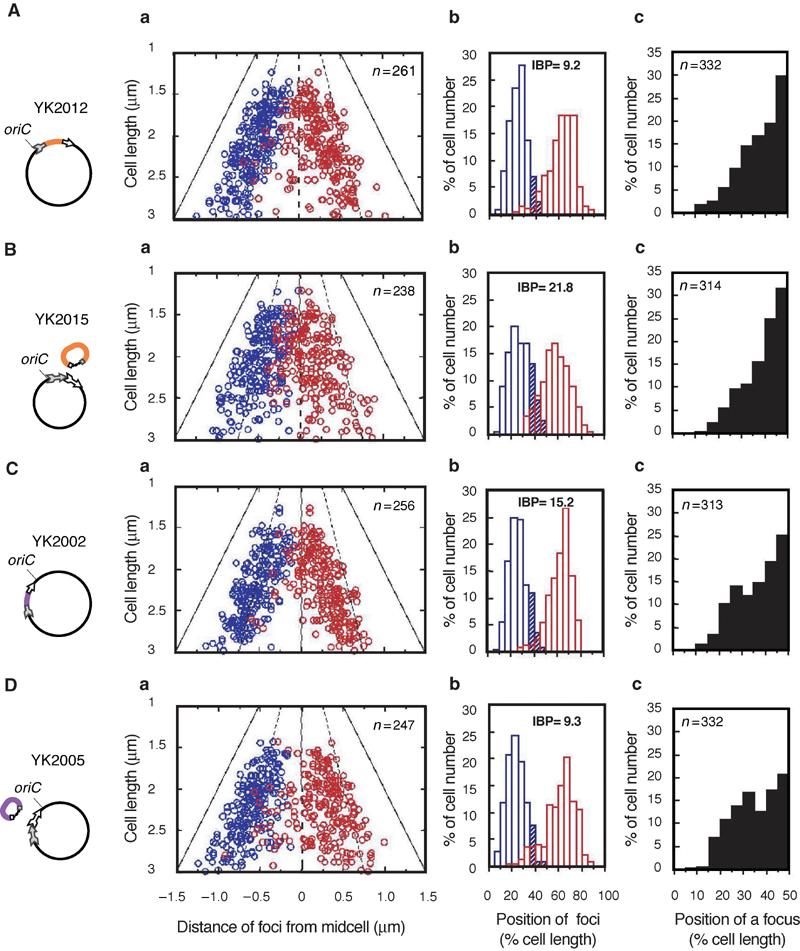
Subcellular localization of the oriC segment before or after chromosomal splitting. The oriC segments on the chromosome were detected by the FISH method, and the positions of oriC foci were measured in cells with two foci or one focus. (A) YK2012, (B) YK2015, (C) YK2002, (D) YK2005. Schematic diagrams indicate the physical state of the chromosome and the split subchromosome: split chromosomal segments (colored lines), and the cassettes (arrows). (a) Cells with two fluorescent foci were statistically analyzed. The positions of oriC foci from the midcell are plotted versus cell length. The focus closest to a pole is shown in blue. The distance of the other focus from the same pole was measured (red). The broken lines indicate the 1/4 and 3/4 positions of cell length, and the solid lines indicate the position of a cell pole. The thin lines indicate midcell points. (b) The histogram shows the distribution frequency of the foci. The hatched areas correspond to values of the IBP. (c) Cells with a single fluorescent focus were statistically analyzed and the distribution frequency of the foci is shown in the histogram.
We then analyzed the subcellular localization of oriC in cells with two fluorescence foci. A bipolar distribution of oriC was observed in both parental strains YK2012 and YK2002 (Figure 2A-a and b, and C-a and b). The bipolar distribution of oriC was not affected in the YK2005 mutant with a 480 kb chromosomal segment between 73.9 and 84.5 min on the genetic map (Figure 1B). The two oriC foci were rarely located close to each other in the middle of the cells (Figure 2D-a and b). In contrast, the bipolar distribution of oriC was disrupted in the YK2015 mutant with a 720 kb of chromosomal segment between 84.7 and 0.1 min (Figure 1B), as indicated by the high frequency of cells in which the two oriC foci colocalized in the middle of cells (Figure 2B-a and b). This disruption of bipolar positioning of oriC was most pronounced in smaller cells (1.5–2.0 μm of cell length in Figure 2B-a). In longer cells (more than 2.0 μm long, Figure 2B-a), the two oriC foci tended to be localized at/near cell quarters, suggesting that the two copies of oriC were separated from each other according to the cell division cycle.
To quantify the extent of the disruption of bipolar positioning of oriC, we utilized an index of bipolar positioning (IBP): the frequency of cells with two fluorescence foci located within the middle of cells, which was defined as the area between 35 and 65% of the cell length. The index was 8.7 in the wild-type strain (Figure 1B). In the case of the split chromosomal segment between 73.9 and 84.5 min (YK2005), the index was somewhat higher than that of the wild-type strain (Figures 1B and 2D-b). In contrast, the IBP of the mutant with the split chromosomal segment between 84.7 and 0.1 min (YK2015) was 21.8, more than double the IBP of the parental strain (Figures 1B, 2A-b and 2B-b). These results indicate that the 720 kb of the segment between 84.7 and 0.1 min contains the cis-acting element responsible for the bipolar positioning of oriC on the chromosome.
A 15 kb of chromosomal segment is common to the chromosomal split mutants with disrupted oriC positioning
We constructed a series of mutants with split chromosomal segments within the 720 kb between 84.7 and 0.1 min on the genetic map, and further analyzed the bipolar positioning of oriC in these mutant cells (Figure 1B). Eight chromosomal split mutants had a significant increase in IBP compared to the mean of IBP of the parental strains, 11.1±3.6 (standard deviation, s.d.). The bipolar positioning of oriC was disrupted in YK2075 and YK2185 (Figure 1B); however, it was not affected in YK2065 and YK2195 (Figure 1B). These results suggest that the 15 kb of the chromosome between 89.1 and 89.5 min had an influence on the bipolar positioning of oriC. When only the 15 kb was split from the original chromosome, the IBP was increased from 9.1 before the splitting to 25.6 after the splitting (Figure 1B, YK2175). These data strongly indicate that the 15 kb chromosomal segment between 89.1 and 89.5 min was responsible for stalling the bipolar positioning of oriC. This finding was consistent with the results in the other mutants (Figure 1B).
A 46 bp sequence is common to deletion mutants with disrupted oriC positioning
There are 14 genes, including those deduced from the E. coli genomic sequence, on the chromosome between 89.1 and 89.5 min (Figure 3C). No essential gene for cell proliferation has been mapped to this segment. We constructed a mutant with a deletion of the chromosomal segment between 89.1 and 89.5 min. The deletion mutant was isolated and able to grow on both rich and minimal medium. Surprisingly, the deletion did not cause any noticeable perturbation of cell proliferation. However, the IBP was strikingly increased from 8.7 to 30.8 (Figure 3A; MC1061 and YK1110), indicating that bipolar positioning of oriC was inhibited in the deletion mutant. Next, we constructed a series of systematic deletion mutants within the chromosomal segment between 89.1 and 89.5 min (Figure 3A). To evaluate defects in bipolar positioning of oriC in these deletion mutants, we referred to the mean of IBP of the chromosomal split mutants with defects in oriC positioning in Figure 1B (25.7, s.d.=5.0). An IBP higher than 20.7 (mean−s.d.) was considered to be a significant defect in the bipolar positioning of oriC. This estimation is consistent with the distribution of IBP in the deletion mutants (Figure 3B).
Figure 3.
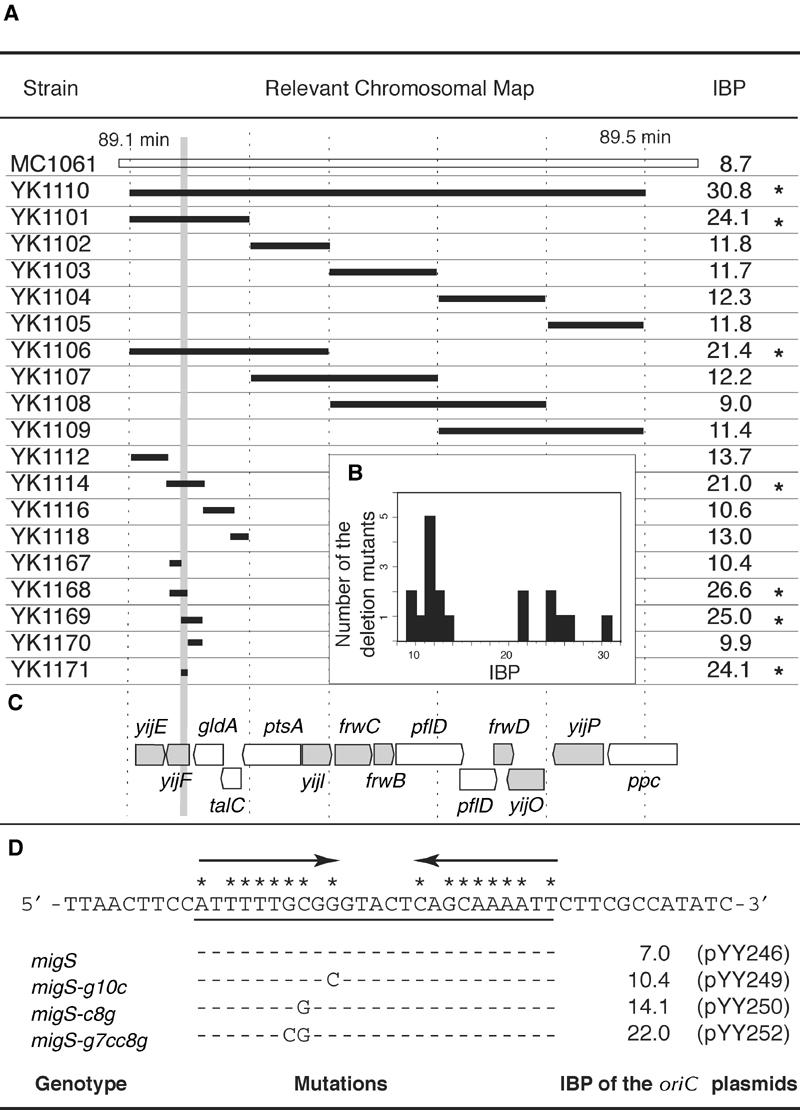
Bipolar positioning of oriC in various chromosomal deletion mutants. (A) Systematic chromosomal deletion mutants were constructed within the 15 kb segment between 89.1 and 89.5 min. Deleted segments are shown as bold bars on the chromosome map (white bar). The exact endpoints of deleted segments are described in Supplementary Table I. The chromosomal segment common to the deletion mutants with higher IBP is indicated in gray. Asterisks indicate the chromosomal split mutants with significantly increased values in IBP (see the text). (B) Histogram of the distribution frequency of the IBP among the deletion mutants. (C)Coding regions on the chromosomal segment between 89.1 and 89.5 min. Genes estimated from the nucleotide sequence are indicated in gray. (D) The deleted chromosomal segment in YK1171 is a 46 bp nucleotide sequence. Arrows indicate an imperfect inverted repeat. Matched nucleotides are shown by an asterisk. Point mutations are showed with the IBP of the oriC plasmids that have the corresponding migS sequence with or without the mutations.
We found that bipolar positioning of oriC was disrupted in two deletion mutants, YK1101 and YK1106, but not in the other mutants (Figure 3A). Therefore, we further constructed nine deletion mutants within the chromosomal segment common to YK1101 and YK1106. In four of these deletion mutants (YK1114, YK1168, YK1169, and YK1171), the IBP was over 20.7, and the IBP in the remaining mutants was less than 15.7 (25.7−2 × s.d.). The common segment in the four deletion mutants that showed disruption in bipolar positioning is only 46 bp and is located within a coding region, yijF, deduced from the genomic sequence (Figure 3C). The YK1167 deletion mutant had a 247 bp of deletion within the yijF gene, but no increase in the IBP (Figure 3A), suggesting that the encoded product was not involved in the bipolar positioning of oriC. The analyses with systematic deletion mutants defined a 46 bp sequence including an imperfect 10 bp inverted repeat with a 5 bp spacer as a cis-acting site on the bipolar positioning of oriC on the chromosome (Figure 3D).
A mutation in the plasmid partitioning system stalls bipolar migration of plasmid DNA
An oriC plasmid including the sopABC partitioning system is stably maintained in host cells (Ogura and Hiraga, 1983) and localized in cell quarters throughout the cell division cycle (Niki and Hiraga, 1999). The IBP of plasmid DNA with the sopABC partitioning system was 7.5 (Figure 4A-a and b), being consistent with regular localization at 25 and 75% of cell length (Figure 4F, Type I). However, the IBP of an oriC plasmid without the sopABC partitioning system was similarly low (8.5). In this case, each plasmid DNA was randomly localized within the cytosolic region at cell poles and/or the midcell (Figure 4D; Niki and Hiraga, 1999), and much less colocalized at the middle of cells (Figure 4F, Type II). In contrast, an oriC plasmid with a mutant sopA (ΔsopAsopB+C+, pXX206) had an increased IBP (about three fold) compared to the oriC plasmids with and without the sopABC partitioning system (Figure 4B-a and b). The two oriC foci of pXX206 were broadly distributed on the periphery of 25 and 50% of cell length compared to 25 and 75% in an actively partitioning oriC plasmid (Figure 4B-b). In addition, a single focus was localized at the midcell, similar to an actively partitioning oriC plasmid (Figure 4B-c). Plasmids with a mutant sopB (sopA+B−C+) were not localized at cell quarters at all (data not shown), nor were plasmids lacking the sopABC genes. These results suggest that defects of the sopA gene inhibited bipolar migration of the plasmid from the midcell to the 1/4 and 3/4 positions, but the plasmid can still localize at cell quarters via the sopBC genes (Figure 4F, Type III).
Figure 4.
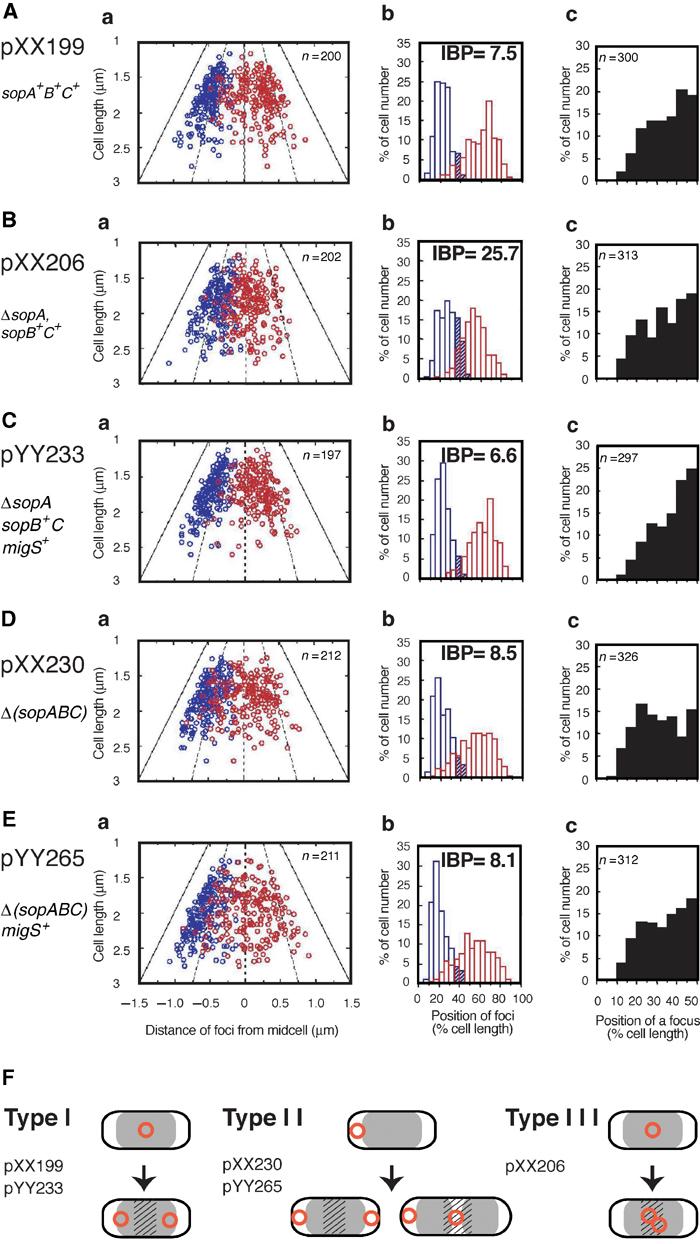
Subcellular localization of the oriC plasmids. The positions of fluorescent foci were measured in cells with one focus or two foci of various oriC plasmids: (A) pXX199, (B) pXX206, (C) pYY233, (D) pXX230, (E) pYY265. Cells with two fluorescent foci were statistically analyzed. The positions of fluorescent foci are shown by scatter diagram (a) or histogram (b) as described in Figure 2. (c) Cells with one fluorescent focus were statistically analyzed and the distribution frequency of the foci is shown in the histogram. (F) Schematic diagrams indicate the subcellular localization patterns of plasmid DNA molecules (circles) in a cell: nucleoids (gray) and subcellular areas that are 35–65% of the cell length (hatch).
The 46 bp segment rescues bipolar migration of plasmid DNA with a mutation in the plasmid partitioning
If the 46 bp segment is involved in bipolar migration of DNA in a cell, it would be interesting to test whether the cis-acting site for bipolar migration of oriC can compensate for the defect in bipolar migration of the oriC plasmid with ΔsopAsopB+C+. The 46 bp sequence was inserted into the oriC plasmid, pXX206, and the subcellular localization of the resulting plasmid DNA pYY233 was analyzed. In cells with two fluorescence foci, each focus of pYY233 was mainly localized at 25 and 75% of cell length, similar to an actively partitioning oriC plasmid (Figure 4C-a and b). Moreover, the IBP of pYY233 was significantly decreased from 25.7 to 6.6 by the addition of the 46 bp sequence. These results confirm the active role of the 46 bp sequence in the bipolar migration of DNA (Figure 4F, Type I).
A 25 bp sequence is sufficient for bipolar migration of plasmid DNA
In the plasmid partitioning systems sopABC and parABS, an inverted repeat is included in the cis-acting sequence, which plays a central role in the recognition of a binding protein (Davis and Austin, 1988; Mori et al, 1989). We hypothesized that the imperfect 10 bp inverted repeat and 5 bp spacer would be important in the 46 bp sequence (Figure 3D). To test this possibility, the 25 bp sequence including the imperfect 10 bp inverted repeat and 5 bp space was inserted into the oriC plasmid with ΔsopAsopB+C+(pXX206). In the resulting construct, pYY246, the IBP was similar to the oriC plasmid containing the 46 bp sequence (Figure 3D).
To confirm that the 10 bp inverted repeat and 5 bp spacer are essential for bipolar migration, we analyzed 25 bp synthesized sequences with mutations in the inverted repeat. In mutations in which a single base in the inverted repeat was substituted (Figure3D, migS-g10c and migS-c8g), small increases of the IBP were detected in pYY249 and pYY250 when compared to pYY246 (Figure 3D). We introduced double base substitutions into the inverted repeat, resulting in the loss of two G:C base pairs (migS-g7cc8g). The oriC plasmid pYY252 had a higher value in IBP when compared to pYY246 (Figure 3D), suggesting that migS-g7cc8g lost its ability to compensate inadequate migration by ΔsopAsopB+C+ genes. Taken together, these data suggest that the 25 bp sequence represents the cis-acting element for bipolar migration of plasmid DNA. Therefore, we named the 25 bp sequence migS (for migration site).
migS is not sufficient for specific subcellular localization of plasmid DNA
When migS is carried on pXX230, that is, the oriC plasmid lacking the sopABC genes, the stability of the plasmid pYY265 does not improve at all (data not shown) and the plasmid DNA is distributed randomly in the cytosol (Figure 4E and F, Type II), as is the oriC plasmid lacking the sopABC genes (Figure 4D and F, Type II). Hence, migS is unlikely to be involved in the positioning of plasmid DNA at specific subcellular regions.
migS functioning is independent of its location relative to oriC
migS is located at 89.1 min of the genetic map, which is 211 kb from oriC in the clockwise direction (Figure 5A). To test the effects of the chromosomal position of migS relative to oriC, we reintroduced the 46 bp of the migS segment into the migS deletion mutant YK1143. The migS segment was inserted at the 80.0 min position of the chromosome, which is 211 kb from oriC in the counterclockwise direction (Figure 5A), and contains the bisC gene which is dispensable for cell growth. The IBP was 23.5 in the migS deletion mutant, YK1143, and 10.3 in the transferred mutant, YK1165 (Figure 5B), suggesting that this transfer of migS improved the bipolar positioning of oriC on the chromosome.
Figure 5.

Characterization of migS. (A) A map indicates various chromosomal locations where migS is placed on. (B) Effect of placed migS on bipolar positioning of the chromosomal segment. The IBP of oriC on the chromosome and the chromosomal segment including the cat gene are indicated. The standard errors were calculated on three independent experiments. (C) Effect of high copy-number migS plasmid on bipolar positioning of oriC on the chromosome. The positions of oriC foci were measured in cells with two fluorescent foci and shown by scatter diagram: (a) cells harboring pYY237 (migS); (b) cells harboring pYY244 (migS-g7cc8g); (c) cells harboring pUC118 (a vector). (D) Colony-forming ability of a cell with the double null mutations of mukB and migS, depending on growth temperature and culture medium.
Bipolar positioning of the replication terminus under the control of migS
The replication terminus of E. coli and the large flanking region, the Ter domain, are localized in the middle of the cell until completion of chromosome replication (Niki and Hiraga, 1998; Niki et al, 2000). This explains the rather high IBP for the replication terminus when assayed by FISH (Figure 5B, YK1221). The chromosomal segment that lies between the Ori and the Ter domain is not localized at a specific subcellular position during the cell cycle (Niki et al, 2000), and the IBP of this chromosomal segment was between those at the Ori and the Ter domain (Figure 5B, YK1219).
To further investigate the observed position effect of migS, it was placed at various chromosomal locations in combination with a reporter gene, cat. We used the cat gene as the FISH probe to detect the chromosomal location. We transferred 25 bp of migS with the cat gene to 9.6 or 33.1 min on the chromosome (Figure 5A). When migS was located at an intermediate chromosomal position (9.6 min), the IBP for cat decreased slightly, but significantly, from 22.0±0.4 (YK1206) to 14.7±2.3 (YK1205). Bipolar positioning of oriC was also improved by placement at this position (Figure 5B). On the other hand, placement of migS at the replication terminus (33.1 min) strikingly decreased the IBP for cat from 38.3 to 10.1 (Figure 5B, YK1209 and YK1221), but the IBP of oriC was not improved at all (Figure 5B, YK1209 and YK1210). These results indicate that migS functions as a mediator for the bipolar positioning of replicated chromosome segments, independent of chromosomal location. This positional effect of migS on bipolar positioning was especially remarkable at the chromosomal location within the Ter domain (33.1 min), which normally does not segregate until the very end of chromosome replication.
Multiple copies of migS stall bipolar positioning of oriC
We cloned 46 bp of the migS segment in a high copy-number plasmid and tested the effect of multicopy migS on the bipolar positioning of oriC. The IBP was markedly increased (Figure 5C-a), similar to the migS deleted mutant (Figure 5B; YK1143). Thus, multicopy migS cancelled the bipolar positioning of the oriC segment on the chromosome. However, multiple copies of a mutated migS sequence did not affect the bipolar positioning of oriC, and the index was as low as that of the vector plasmid (Figure 5C-b and c).
The migS null mutation enhances temperature-sensitive lethality of the mukB null mutation
The E. coli mukB gene is involved in faithful chromosome segregation. The null mutant can grow at low temperature, producing anucleated cells in high frequency, but does not grow at high temperature on L medium (Niki et al, 1991). As cell division is strongly inhibited in mukB null mutants at a high temperature, filamentous cells are produced. We constructed a mukB null mutant (YK1228) that was derived from the wild-type strain MC1061. This strain produced anucleated cells (Supplementary Figure 2), could not grow at high temperature depending on culture medium (Figure 5D), and produced filamentous cells at a restricted condition (Supplementary Figure 2).
To analyze the effects of the migS null mutations on the medium-dependent, temperature-sensitive, lethal phenotype of the mukB null mutation, we introduced the migS null mutation into the mukB null mutant. migS and mukB double mutants could grow on both the M9 and L medium at 24°C and produced a high frequency of anucleate cells similar to the mukB null mutant (Supplementary Figure 2). The colony-forming ability of the double null mutant decreased remarkably at high temperature on L medium (Figure 5D). No filamentous cells were detected in the double null mutants at high temperature on L-medium, suggesting quick inhibition of cell elongation at restricted temperature (Supplementary Figure 2). These results suggest that the bipolar positioning of oriC by migS can interact with the biological function of the mukB gene.
Dynamics of morphological changes disappear in the migS deletion mutant
Anucleated cells were not observed at a significant frequency in the migS deleted mutant. Also, there was no remarkable difference of the doubling time between the wild type (MC1061: 70 min) and the migS deleted mutant (YK1143: 73 min) in minimal medium at 37°C. To confirm the effect of migS on chromosome distribution, we analyzed the morphological changes of nucleoids in a living cell with or without migS during the process of chromosome replication and segregation. We used a gelatin mounting method to observe the nucleoids in living mutant cells (Manson and Powelson, 1956).
Nucleoids in living cells mounted in 23% gelatin-containing culture medium show a remarkable contrast with the cytosol under a phase-contrast microscope. When cells in gelatin-containing M9 medium were grown at 30°C, nucleoids in both wild type and the migS null mutant were ellipse or oval throughout the cell division cycle (Figure 6A-a and b). In wild type, elongated cells (>2 μm) without constriction for cytokinesis have two discrete nucleoids, which look like beans in a pod (Figure 6A-a). In the migS null mutant, such elongated cells have elongated ellipse nucleoids that are divided according to cytokinesis (Figure 6A-b).
Figure 6.
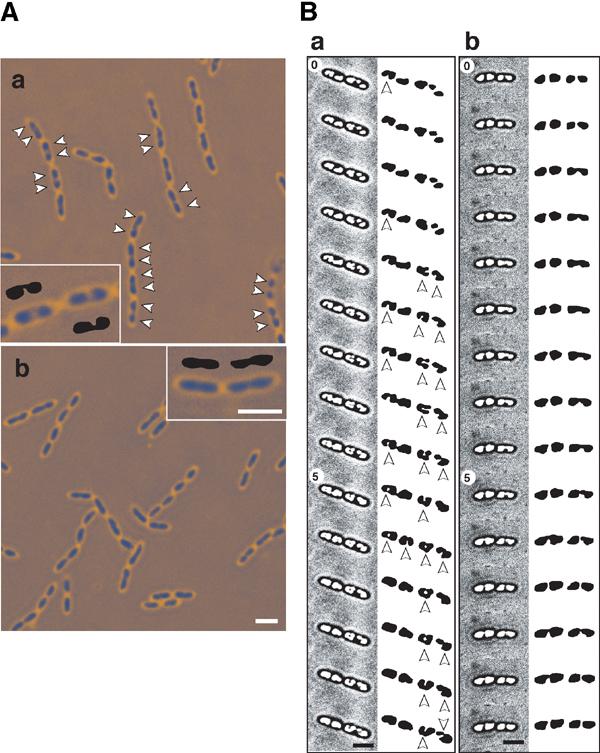
Microscope images of a living cell in gelatin-containing medium. (A) Nucleoids in cells were grown to mid-log phase at 30°C in M9 medium. Living cells were mounted in 23% gelatin-containing medium to detect chromosomal DNA. Cells were shown in phase-contrast images with pseudo-coloring. (a) MC1061 (wild type), (b) YK1143 (ΔmigS). Arrowheads indicate two discrete nucleoids in an elongated cell (>2 μm) without constriction. Typical nucleoids in an elongated cell (>2 μm) without constriction were indicated in inside panels with diagrams of extracted nucleoids. Scale bar represents 2 μm. (B) Time-lapse microscopy of a living cell mounted in gelatin. Cells pre-incubated in L medium with 0.2% glucose at 30°C were transferred to a dish with a coverslip and mounted in 23% gelatin-containing L medium with 0.2% glucose. The phase-contrast pictures were taken at 30 s intervals: (a) MC1061 (wild type), (b) YK1143 (ΔmigS). The numbers correspond to minutes in the frames of time-lapse imaging. The images were improved in the nucleoid outline using the “equalization” treatment of Adobe Photoshop ver. 7. Extracted nucleoids are shown as diagrams on the right side with magnification (1.5 ×). Arrowheads indicate lobed nucleoids. The original images were shown in Supplementary Figure 3. Scale bar represents 2 μm.
These differences in nucleoid shape between wild type and the migS null mutant are more apparent in the fast growing conditions. A variety of nucleoid shapes appeared in an actively dividing wild-type cell when cells in gelatin-containing L medium were grown at 30°C (Figure 6B-a). The division time was about 30 min, suggesting that multi-fork replication should be occurring. There were four nucleoids in almost all cells with constrictions at the midcell. After the separation of sister nucleoids, the shape of the nucleoids quickly changed to lobed or dumbbell form for a few minutes. Depending on the stage in the cell division cycle, nucleoids were elongated and more distinctly lobed. In contrast, the change in nucleoid shape was poor in the migS deleted cells, despite the almost same dividing time (Figure 6B-b). After separation of the sister nucleoids, four nucleoids in a single cell gradually increased in size. The shape was round or ovoid throughout the cell division cycle. The observation suggests that bipolar positioning of the oriC segment inside a nucleoid may contribute to reorganization of the replicated daughter strands that are positioned in a bipolar manner.
Discussion
In this paper, we have identified a 25 bp sequence, migS, which plays a crucial role in the bipolar positioning of the oriC segments during chromosome partitioning in E. coli. The plasmid without the SopABC partitioning system was not found to localize at specific subcellular sites, even when harboring active migS. Therefore, we proposed that migS is responsible for the bipolar migration of oriC and the flanking region rather than subcellular positioning (Figure 7), and suggest that migS functions as a centromere-like element in bacteria.
Figure 7.
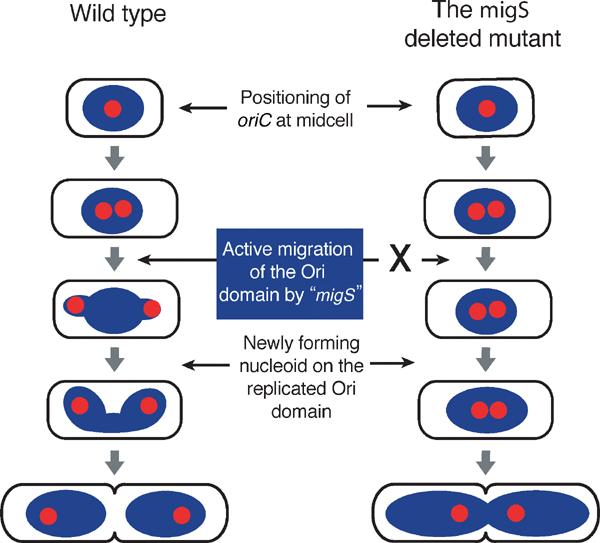
Model of the oriC bipolar migration/positioning and nucleoids formation. In a wild-type cell growing slowly, the oriC segment is replicated at midcell. The replicated oriC segments migrate towards the cell quarters, dependent on the function of migS located near oriC. After migration by migS, the Ori domains of the chromosome including the replicated oriC segment and the adjacent chromosomal segments localize at or near the cell quarters. The Ori domains are newly folded to make discrete sub-nucleoids, and a whole nucleoid looks like a dumbbell. The highly organized chromosome structure is presumably involved in tethering the Ori domain at or near the cell quarters. On the other hand, in the migS deleted mutant, bipolar positioning of the replicated oriC segments is defective because of the loss of putative active migration by migS. As the replicated oriC segments and the adjacent chromosomal segments still localize at the midcell, newly forming nucleoids are not discrete. However, the chromosome condensation by the MukB protein at the cell quarters (Ohsumi et al, 2001) may compensate for the defect in the formation of discrete nucleoids, and nucleoids are clearly separated before septum closing. The shared masses represent the E. coli nucleoids, or organized chromosomes in a cell; red circles indicate replication origin, oriC. migS is located near oriC.
migS may play a role in the organization of replicated daughter chromosomes in duplicating cells (Figure 7). Active migration of oriC and the flanking region establishes the bipolar positioning of replicated daughter chromosomes at an early stage in chromosome replication, and the bipolar positioning may promote compaction of replicated daughter chromosomes to make discrete nucleoids as shown in Figure 6. During the process of nucleoid formation, MukB protein, a bacterial member of SMC family, plays a central role in chromosome folding. Deterioration in the temperature-sensitive growth of the migS and mukB double null mutant suggests direct interaction between MukB and bipolar positioning by migS during chromosome partitioning. As bipolar positioning, or separation, of the replicated chromosomal segments helps to make discrete nucleoids at an early stage of the cell division cycle, the double null mutant may have severe damage on nucleoids formation of newly replicated chromosomes.
Such a scenario would allow migS to play a role in chromosome organization. However, insertion of migS near the replication terminus drastically changes the positioning of this region, supporting a model in which migS is directly involved in chromosome orientation including positioning and migration.
The location of migS is 211 kb from oriC in the clockwise direction, in the middle of the Ori domain. The timing of initiation of bipolar migration of the oriC segment may be related to the distance between oriC and migS on the chromosome. Placement of the 46 bp sequence including migS restores normal bipolar positioning of oriC. Moreover, placement of 25 bp migS at other locations causes bipolar positioning of the chromosomal segment at the placed location including the replication terminus. Therefore, the 25 bp sequence of migS is sufficient to induce its cis-acting effect on bipolar positioning of the chromosome. The oriC sequence is not essential for bipolar positioning of the chromosome, and the distance of migS and oriC is not involved in bipolar positioning of the chromosome.
In the absence of migS, the Ori domain can still be found localized to the midcell before replication (Figure 2B). pYY265, an oriC plasmid with only migS, is still distributed randomly in the cytosol and cannot localize at specific cellular sites (Figure 4E). Clearly, the migS site does not tether DNA to any specific site in a cell, other than carrying out bipolar migration of DNA. This is consistent with our results that the oriC segment on the chromosome in the migS deleted cells can still localize at midcell before replication (data not shown). In addition, the chromosomal split mutants within the Ori domain can also localize at midcell before replication (Figure 2), suggesting that there is no specific sequence for tethering the Ori domain including oriC at/near the cell quarters. When migS is simply involved in the migration of chromosomal segments, static localization of the oriC segment at the cell quarters is probably dependent on chromosome organization with high-order structure, rather than a specific sequence.
Analogous to the ParAB partitioning system, some proteins may bind to the inverted repeat sequence of migS. The migS sites on the high copy-number plasmid abolish bipolar migration of oriC on the chromosome, presumably because the migS sites compete with one another to bind a trans-acting factor involved in oriC migration. Significantly, the base mutations in the inverted repeat of migS cancel the multicopy effect completely. Thus, the multicopy effect of migS on the bipolar migration of oriC on the chromosome strongly supports the above hypothesis.
The migS sequence is unique in the E. coli genome. We could not find the migS sequence or homologs on other bacterial genomes in DNA databases. The migS sequence is located within a coding region, the yijF gene that codes for a 23 kDa hypothetical protein. Homologs of the yijF gene are conserved in the genomes of Salmonella typhimurium, Pseudomonas aeruginosa, Pasteurella multocida, and C. crescentus. However, homologous sequences of migS and a similar inverted repeat have not been found in these coding regions of the yijF gene homologs.
There are marked differences in subcellular localization between plasmids defective in different sop genes (Figure 4F). Plasmids defective in either sopA or sopB are easily segregated from host cells, and both frequencies of plasmid loss are as high as that of plasmids without the sopABC genes (Ogura and Hiraga, 1983). In the case of the plasmid with ΔsopAsopB+C+, the plasmid could be localized at midcell. Possibly, SopB could bind to the sopC site to form the SopB–sopC complex. We consider that the SopB protein in the complex is a mediator in order to attach plasmid DNA to a specific cellular site at the midcell, and SopA would be responsible for the release of plasmid DNA from SopB–sopC complexes (Libante et al, 2001).
The plasmid with ΔsopAsopB+C+ can be localized at the midcell, but not at the 1/4 and 3/4 positions of cell length regularly. We speculated that the plasmid with ΔsopAsopB+C+ is defective in the migration of plasmid DNA from the midcell to the 1/4 and 3/4 positions during plasmid partitioning. We then demonstrated that the defect is rescued by the migS sequence on the plasmid with the ΔsopAsopB+C+ genes. However, the stability of the mutated plasmid with migS was not recovered to the wild-type level. The pYY233 plasmid was as readily segregated from a host cell in nonselective medium as the plasmid lacking the sopABC partitioning genes (data not shown). When the pYY233 plasmid was transformed into the strain in which the 46 bp sequence was deleted on the chromosome, the stability of the pYY233 plasmid had no increase compared to that in wild-type cells (data not shown). Our FISH analyses indicate that the localization pattern of plasmid DNA molecules in cells with one or two fluorescence foci does not reflect the frequency of cells harboring plasmid DNA molecules. Therefore, it is likely that most plasmid DNA molecules still remained at the midcell despite migS addition, and the bipolar migration by migS is not coupled to the release of plasmid DNAs from the SopB–DNA complexes at midcell, or an enough motive force for it.
A bacterial chromosome in a living cell is highly compacted with organized structure. The compacted chromosome, or nucleoid, has been observed in fixed cells under the fluorescence microscope by using a DNA specific fluorescence dye, DAPI. An alternative method of observing a nucleoid in the cell is the gelatin mounting method under phase-contrast microscopy. This age-old method makes it possible for us to capture dynamic changes in replicating and segregating chromosomes in real time. Clear, sharp images of a nucleoid have revealed that active bipolar migration by migS contributes to nucleoid morphology in a dividing cell. This method also reveals that the dynamics of nucleoids are dependent on growth condition. In addition to E. coli, the nucleoids of B. subtilis are clearly visible in living cells (H Niki, unpublished data). Hence, this method will further be applied to demonstrate nucleoid dynamics in various mutants and bacteria.
Although the migS sequence may play a crucial role in the bipolar migration and positioning of oriC, the deletion does not cause any severe defects in chromosome partitioning. It is a seemingly unnecessary process for bacterial segregation. Nevertheless, bipolar migration and positioning by migS presumably helps accurate chromosome partitioning. The current view indicates that bacterial chromosome partitioning consists of a series of processes, including oriC migration, chromosome condensation, localization of the replication machinery, and chromosomal resolution (Lemon and Grossman, 2001; Sawitzke and Austin, 2001). Genes involved in the process of chromosome condensation or compaction have been identified: mukB (Niki et al, 1991) and seqA (Hiraga et al, 1998). These genes are not essential for cell growth, and the mukB and seqA genes are dispensable for chromosome partitioning when suppressed by mutations in other genes (Weitao et al, 1999; Sawitzke and Austin, 2000). Moreover, the replication machinery and condensation proteins presumably migrate from the midcell to the 1/4 and 3/4 positions, independently of oriC migration (Hiraga et al, 1998; Lemon and Grossman, 1998; Ohsumi et al, 2001). Taken together, we speculate that the function of the various processes in chromosome partitioning overlap one another to some extent. In fact, deterioration in the temperature-sensitive growth of the migS and mukB double null mutant supports interaction between the MukB protein and bipolar migration of migS during the process of chromosome condensation, or nucleoid formation (Figure 7). The redundancy in the partitioning mechanism allows chromosome segregation with high fidelity during the bacterial cell division cycle without apparent checkpoints as in the eukaryotic cell cycle. Further work will be required to learn how migS contributes to chromosome partitioning. However, the migS sequence governing bipolar positioning of oriC would seem to be a new clue for identifying the whole process of bacterial chromosome partitioning.
Materials and methods
Strains, Plasmids, and Media
The principal bacterial strains and plasmids used in this study are listed in Table I. All E. coli strains and plasmids are listed in Supplementary Table I and Table II. Cells were grown in L broth or M9 medium supplemented with sodium succinate (0.25%), thiamine (1 μg/ml), leucine (50 μg/ml), and Casamino acids (0.4%). The following antibiotics were added to the medium when necessary: ampicillin (20 or 100 μg/ml), chloramphenicol (15 μg/ml), kanamycin (15 μg/ml), neomycin (7.5 μg/ml), spectinomycin (100 μg/ml), streptomycin (100 μg/ml), and tetracycline (1, 5, or 15 μg/ml). The generation time (doubling time) was determined by the turbidity of cultures. Genetic coordinates in minutes and bases were from the Profiling of E. coli Chromosome database (PEC: http://www.shigen.nig.ac.jp/ecoli/pec/).
Table 1.
Bacterial strains and plasmids used in this study
| E. coli straina | Relevant genotype |
|---|---|
| MC1061 | Wild-type (F− ΔlacX74 rpsL araD139 Δ(ara leu)7697 galU galK hsdR mcrB thi) |
| YK1031 | yrdD∷[ne] gidA∷[et] |
| YK1039 | kup∷[ne] b0005∷[et] |
| YK1142 | ΔmigS∷cat |
| YK1143 | ΔmigS |
| YK1165 | ΔmigS bisC∷migS |
| YK1205 | ΔmigS yajR∷(migS cat) |
| YK1206 | ΔmigS yajR∷(migS-g7cc8g cat) |
| YK1209 | ΔmigS narW∷(migS cat) |
| YK1210 | ΔmigS narW∷(migS-g7cc8g cat) |
| YK1219 | yajR∷cat |
| YK1221 | narW∷cat |
| YK1228 | ΔmukB∷cat |
| YK1230 | ΔmukB∷cat ΔmigS∷kan |
| YK2002 | yrdD∷[ne] gidA∷[et]/pYY159 |
| YK2005 | Δ(yrdD-gidA)∷(neo tet)/pYY159[yrdD-gidA]b (derived from YK2002) |
| YK2012 | kup∷[ne] b0005∷[et]/pYY159 |
| YK2015 | Δ(kup-b0005)∷(neo tet)/pYY159[kup-b0005]b (derived from YK2012) |
| Plasmid | Relevant characteristics |
| pBEST518 | bla [ne] (Itaya and Tanaka, 1997) |
| pBEST524B | bla [eo] (Itaya and Tanaka, 1997) |
| pKD3 | bla cat (Datsenko and Wanner, 2000) |
| pXX199 | bla sopA+B+C+ (oriC plasmid, Ogura and Hiraga, 1983) |
| pXX206 | bla ΔsopAsopB+C+ (oriC plasmid, Ogura and Hiraga, 1983) |
| pXX230 | bla Δ(sopABC) (oriC plasmid, Ogura and Hiraga, 1983) |
| pXX704 | bla sopA+B+C+ (mini-F plasmid, Niki and Hiraga,1997) |
| pXX705 | bla Δ(sopABC) (mini-F plasmid, Niki and Hiraga,1997) |
| pYY145 | bla [et] (see Supplementary data) |
| pYY154 | cat [eo] [te] (see Supplementary data) |
| pYY159 | pXX704 [eo] [te] |
| pYY233 | pXX206 migS (46 bp DNA fragment including migS) |
| pYY237 | pUC118 migS (46 bp DNA fragment including migS) |
| pYY244 | pUC118 migS–g7cc8g (46 bp DNA fragment including migS-g7cc8g) |
| pYY246 | pXX206 migS |
| pYY249 | pXX206 migS-g10c |
| pYY250 | pXX206 migS-c8g |
| pYY252 | pXX206 migS-g7cc8g |
| pYY260 | pKD3 migS (46 bp DNA fragment including migS) |
| pYY265 | pXX230 migS |
| pYY272 |
pKD3 migS |
| aAll strains listed are derivatives of MC1061. | |
| bPlasmid harboring the split chromosomal segment. | |
The construction of chromosome deletion strains was carried out according to Datsenko and Wanner (2000). Nucleotide sequences of endpoints of the deletions are shown in Supplementary Table I. Each deletion was confirmed by PCR analysis. The DNA fragment including migS and cat was integrated into other chromosomal locations by the above method. The integrated fragment was amplified from pYY260 or pYY272 using primers with 40-nt extensions that are homologous to target regions. Then the cat gene was deleted by FLP recombinase, if necessary.
Construction of chromosomal split strains
We constructed chromosomal split mutations by interchromosomal recombination between truncated neomycine-resistant genes according to Itaya and Tanaka (1997). The [ne] and [et] cassettes were integrated into points of interest on the chromosome according to Datsenko and Wanner (2000). The insertions were confirmed by PCR. Sequences of all oligonucleotides used in the PCR are available upon request. The [ne] and [et] cassettes were integrated in the E. coli chromosome in the same direction. Low copy-number plasmids containing the [eo] cassette and the [te] cassette were constructed, like the mini-F plasmid pYY159 and oriC plasmid pYY166.
Time-lapse imaging
The structure of bacterial nucleoids was clearly visualized by Manson and Powelson (1956) under a phase construct microscope. In general, a concentration of gelatin from Bovine Bone (Wako, Osaka, Japan) from 20 to 40% by weight in culture broth is used for mounting bacterial cells. Here we used 23% gelatin dissolved in M9 or L medium for E. coli and 26% for B. subtilis. Note that the concentration for the best results could only be determined experimentally. Living cells were mounted in 200 μl of melted gelatin medium. Living cells incubated at 25 or 30°C were observed in an inverted microscope Axiovert 200M (Zeiss, Germany) fully controlled under a PC by Axiovision software (Zeiss, Germany), and images were captured by an Axiocam CCD camera system. The images were improved in the nucleoid outline using the “equalization” treatment of Adobe Photoshop ver. 7 (Supplementary Figure 3).
FISH
FISH was carried out according to the procedures described previously (Niki and Hiraga, 1997). The FISH probe to detect the oriC segment of the E. coli chromosome was prepared as described previously (Niki et al, 2000). The EcoRI–BamHI segment containing the rep and bla genes from mini-F plasmid pXX705 was used to detect oriC plasmids. The probe for the cat gene was amplified by PCR using pKD3 as a template. When cells were grown in M9 medium, almost all cells had one or two oriC foci (Supplementary Table III).
Supplementary Material
Pulsed-field gel electrophoresis of genomic DNA from each strain in the construction of a chromosomal split mutant. The conditions of pulsed-field gel electrophoresis (PFGE) were as follows: pulse time 1 to 80 s for 21 h. In general, high molecular weight circular DNA does not migrate into agarose gels under PFGE. The DNA bands may have been linearized by physical shearing during preparation (lane 3-7, 9). Lane 7 shows that whole genomic DNA of YK2015 includes an extra DNA with the expected size of the split sub-chromosome. A single I-SceI recognition site is located on the main chromosome and the sub-chromosome in the chromosomal split mutants. When whole genomic DNA was digested by I-SceI, a similar extra band was clearly detected in less than 20 fold the amount of the digested genomic DNA (lane 8). Similar results were obtained in YK2005, and the 480 kb extra band is indicated in lane 9. Lane 1, pYY159 plasmid DNA; lane 2, S. cerevisiae chromosomal DNA as size standards; lane 3, MC1061 genomic DNA; lane 4, YK1039 genomic DNA; lane 5, YK2012 genomic DNA; lane 6, YK2014 genomic DNA; lane 7, YK2015 genomic DNA; lane 8, YK2015 genomic DNA digested by I-SceI; lane 9, YK2005 genomic DNA.
Microscope images of the mukB null mutant, the migS null mutant, and the double mutant. Cells were grown to mid-log phase at 24°C in M9 medium (A) or L medium (B). Cells in mid-log phase at 24°C (a) were transferred to 42°C (b) and incubated for 4 hours in M9 medium or 3 h in L medium. Cells were fixed by methanol, and DAPI stained to visualize chromosomal DNA. Cells are shown as merged images (phase contrast and fluorescent DAPI). (a, b) MC1061, (c, d) YK1143, (e, f) YK1228, (g, h) YK1230. Scale bar represents 1 μm.
Microscope Images of the living cells with the migS null mutation in L medium Cells pre-incubated in L medium with 0.2% glucose at 30°C were mounted in 23% gelatin containing L medium with 0.2% glucose. The phase contrast images (A, B) were enhanced using the equalization treatment of Adobe Photoshop ver 7.0 (C, D). (A, C) MC1061, (B, D) YK1143. Scale bar represents 2 μm.
Supplemental Tables I and II
Supplemental Table III
Acknowledgments
We thank Richard D'Ari for a critical reading of the manuscript. We are grateful to H Aiba, B Wanner, and M Itaya for providing plasmids and strains. This work was supported by Grant-in-Aid for Scientific Research (B), Grant-in-Aid for Scientific Research on Priority Areas (B) and (C) “Genome Biology”, the Advanced and Innovational Research Program in Life Sciences from the Ministry of Education, Culture, Sports, Science and Technology of Japan, and a grant of PREST, Japan Science and Technology Corporation to HN.
References
- Ben-Yehuda S, Rudner DZ, Losick R (2003) RacA, a bacterial protein that anchors chromosomes to the cell poles. Science 299: 532–536 [DOI] [PubMed] [Google Scholar]
- Datsenko KA, Wanner BL (2000) One-step inactivation of chromosomal genes in Escherichia coli K-12 using PCR products. Proc Natl Acad Sci USA 97: 6640–6645 [DOI] [PMC free article] [PubMed] [Google Scholar]
- Davis MA, Austin SJ (1988) Recognition of the P1 plasmid centromere analog involves binding of the ParB protein and is modified by a specific host factor. EMBO J 7: 1881–1888 [DOI] [PMC free article] [PubMed] [Google Scholar]
- Draper GC, Gober JW (2002) Bacterial chromosome segregation. Annu Rev Microbiol 56: 567–597 [DOI] [PubMed] [Google Scholar]
- Edwards DH, Errington J (1997) The Bacillus subtilis DivIVA protein targets to the division septum and controls the site specificity of cell division. Mol Microbiol 24: 905–915 [DOI] [PubMed] [Google Scholar]
- Funnell BE (1988) Participation of Escherichia coli integration host factor in the P1 plasmid partition system. Proc Natl Acad Sci USA 85: 6657–6661 [DOI] [PMC free article] [PubMed] [Google Scholar]
- Glaser P, Sharpe ME, Raether B, Perego M, Ohlsen K, Errington J (1997) Dynamic, mitotic-like behavior of a bacterial protein required for accurate chromosome partitioning. Genes Dev 11: 1160–1168 [DOI] [PubMed] [Google Scholar]
- Gordon GS, Shivers RP, Wright A (2002) Polar localization of the Escherichia coli oriC region is independent of the site of replication initiation. Mol Microbiol 44: 501–507 [DOI] [PubMed] [Google Scholar]
- Gordon GS, Sitnikov D, Webb CD, Teleman A, Straight A, Losick R, Murray AW, Wright A (1997) Chromosome and low copy plasmid segregation in E. coli: visual evidence for distinct mechanisms. Cell 90: 1113–1121 [DOI] [PubMed] [Google Scholar]
- Gordon GS, Wright A (2000) DNA segregation in bacteria. Annu Rev Microbiol 54: 681–708 [DOI] [PubMed] [Google Scholar]
- Hiraga S (2000) Dynamic localization of bacterial and plasmid chromosomes. Annu Rev Genet 34: 21–59 [DOI] [PubMed] [Google Scholar]
- Hiraga S, Ichinose C, Niki H, Yamazoe M (1998) Cell cycle-dependent duplication and bidirectional migration of SeqA-associated DNA–protein complexes in E. coli. Mol Cell 1: 381–387 [DOI] [PubMed] [Google Scholar]
- Itaya M, Tanaka T (1997) Experimental surgery to create subgenomes of Bacillus subtilis 168. Proc Natl Acad Sci USA 94: 5378–5382 [DOI] [PMC free article] [PubMed] [Google Scholar]
- Jacob F, Brenner S, Cuzin F (1963) On the regulation of DNA replication in bacteria. Cold Spring Harbor Symp Quant Biol 28: 329–348 [Google Scholar]
- Jensen RB, Shapiro L (1999) The Caulobacter crescentus smc gene is required for cell cycle progression and chromosome segregation. Proc Natl Acad Sci USA 96: 10661–10666 [DOI] [PMC free article] [PubMed] [Google Scholar]
- Lemon KP, Grossman AD (1998) Localization of bacterial DNA polymerase: evidence for a factory model of replication. Science 282: 1516–1519 [DOI] [PubMed] [Google Scholar]
- Lemon KP, Grossman AD (2001) The extrusion-capture model for chromosome partitioning in bacteria. Genes Dev 15: 2031–2041 [DOI] [PubMed] [Google Scholar]
- Lewis PJ, Errington J (1997) Direct evidence for active segregation of oriC regions of the Bacillus subtilis chromosome and co-localization with the Spo0J partitioning protein. Mol Microbiol 25: 945–954 [DOI] [PubMed] [Google Scholar]
- Libante V, Thion L, Lane D (2001) Role of the ATP-binding site of SopA protein in partition of the F plasmid. J Mol Biol 314: 387–399 [DOI] [PubMed] [Google Scholar]
- Manson DJ, Powelson DM (1956) Nuclear division as observed in living bacteria by a new technique. J Bacteriol 71: 474–479 [DOI] [PMC free article] [PubMed] [Google Scholar]
- Mori H, Mori Y, Ichinose C, Niki H, Ogura T, Kato A, Hiraga S (1989) Purification and characterization of SopA and SopB proteins essential for F plasmid partitioning. J Biol Chem 264: 15535–15541 [PubMed] [Google Scholar]
- Niki H, Hiraga S (1997) Subcellular distribution of actively partitioning F plasmid during the cell division cycle in E. coli. Cell 90: 951–957 [DOI] [PubMed] [Google Scholar]
- Niki H, Hiraga S (1998) Polar localization of the replication origin and terminus in Escherichia coli nucleoids during chromosome partitioning. Genes Dev 12: 1036–1045 [DOI] [PMC free article] [PubMed] [Google Scholar]
- Niki H, Hiraga S (1999) Subcellular localization of plasmids containing the oriC region of the Escherichia coli chromosome, with or without the sopABC partitioning system. Mol Microbiol 34: 498–503 [DOI] [PubMed] [Google Scholar]
- Niki H, Jaffe A, Imamura R, Ogura T, Hiraga S (1991) The new gene mukB codes for a 177 kd protein with coiled-coil domains involved in chromosome partitioning of E. coli. EMBO J 10: 183–193 [DOI] [PMC free article] [PubMed] [Google Scholar]
- Niki H, Yamaichi Y, Hiraga S (2000) Dynamic organization of chromosomal DNA in Escherichia coli. Genes Dev 14: 212–223 [PMC free article] [PubMed] [Google Scholar]
- Ogura T, Hiraga S (1983) Partition mechanism of F plasmid: two plasmid gene-encoded products and a cis-acting region are involved in partition. Cell 32: 351–360 [DOI] [PubMed] [Google Scholar]
- Ohsumi K, Yamazoe M, Hiraga S (2001) Different localization of SeqA-bound nascent DNA clusters and MukF–MukE–MukB complex in Escherichia coli cells. Mol Microbiol 40: 835–845 [DOI] [PubMed] [Google Scholar]
- Sawitzke J, Austin S (2001) An analysis of the factory model for chromosome replication and segregation in bacteria. Mol Microbiol 40: 786–794 [DOI] [PubMed] [Google Scholar]
- Sawitzke JA, Austin S (2000) Suppression of chromosome segregation defects of Escherichia coli muk mutants by mutations in topoisomerase I. Proc Natl Acad Sci USA 97: 1671–1676 [DOI] [PMC free article] [PubMed] [Google Scholar]
- Watanabe E, Wachi M, Yamasaki M, Nagai K (1992) ATPase activity of SopA, a protein essential for active partitioning of F plasmid. Mol Gen Genet 234: 346–352 [DOI] [PubMed] [Google Scholar]
- Webb CD, Teleman A, Gordon S, Straight A, Belmont A, Lin DC-H, Grossman AD, Wright A, Losick R (1997) Bipolar localization of the replication origin regions of chromosomes in vegetative and sporulating cells of B. subtilis. Cell 88: 667–674 [DOI] [PubMed] [Google Scholar]
- Weitao T, Nordstrom K, Dasgupta S (1999) Mutual suppression of mukB and seqA phenotypes might arise from their opposing influences on the Escherichia coli nucleoid structure. Mol Microbiol 34: 157–168 [DOI] [PubMed] [Google Scholar]
- Wu LJ, Errington J (2002) A large dispersed chromosomal region required for chromosome segregation in sporulating cells of Bacillus subtilis. EMBO J 21: 4001–4011 [DOI] [PMC free article] [PubMed] [Google Scholar]
- Yamaichi Y, Niki H (2000) Active segregation by the Bacillus subtilis partitioning system in Escherichia coli. Proc Natl Acad Sci USA 97: 14656–14661 [DOI] [PMC free article] [PubMed] [Google Scholar]
Associated Data
This section collects any data citations, data availability statements, or supplementary materials included in this article.
Supplementary Materials
Pulsed-field gel electrophoresis of genomic DNA from each strain in the construction of a chromosomal split mutant. The conditions of pulsed-field gel electrophoresis (PFGE) were as follows: pulse time 1 to 80 s for 21 h. In general, high molecular weight circular DNA does not migrate into agarose gels under PFGE. The DNA bands may have been linearized by physical shearing during preparation (lane 3-7, 9). Lane 7 shows that whole genomic DNA of YK2015 includes an extra DNA with the expected size of the split sub-chromosome. A single I-SceI recognition site is located on the main chromosome and the sub-chromosome in the chromosomal split mutants. When whole genomic DNA was digested by I-SceI, a similar extra band was clearly detected in less than 20 fold the amount of the digested genomic DNA (lane 8). Similar results were obtained in YK2005, and the 480 kb extra band is indicated in lane 9. Lane 1, pYY159 plasmid DNA; lane 2, S. cerevisiae chromosomal DNA as size standards; lane 3, MC1061 genomic DNA; lane 4, YK1039 genomic DNA; lane 5, YK2012 genomic DNA; lane 6, YK2014 genomic DNA; lane 7, YK2015 genomic DNA; lane 8, YK2015 genomic DNA digested by I-SceI; lane 9, YK2005 genomic DNA.
Microscope images of the mukB null mutant, the migS null mutant, and the double mutant. Cells were grown to mid-log phase at 24°C in M9 medium (A) or L medium (B). Cells in mid-log phase at 24°C (a) were transferred to 42°C (b) and incubated for 4 hours in M9 medium or 3 h in L medium. Cells were fixed by methanol, and DAPI stained to visualize chromosomal DNA. Cells are shown as merged images (phase contrast and fluorescent DAPI). (a, b) MC1061, (c, d) YK1143, (e, f) YK1228, (g, h) YK1230. Scale bar represents 1 μm.
Microscope Images of the living cells with the migS null mutation in L medium Cells pre-incubated in L medium with 0.2% glucose at 30°C were mounted in 23% gelatin containing L medium with 0.2% glucose. The phase contrast images (A, B) were enhanced using the equalization treatment of Adobe Photoshop ver 7.0 (C, D). (A, C) MC1061, (B, D) YK1143. Scale bar represents 2 μm.
Supplemental Tables I and II
Supplemental Table III