Abstract
The fluorescent indicator PBFI is widely used for the determination of intracellular concentrations of K+. To investigate the binding reaction of K+ to PBFI in the ground and excited states, steady-state and time-resolved measurements were performed. The fluorescence decay surface was analyzed with global compartmental analysis yielding the following values for the rate constants at room temperature in aqueous solution at pH 7.2: k01 = 1.1 x 10(9) s-1, k21 = 2.7 x 10(8) M-1s-1, k02 = 1.8 x 10(9) s-1, and k12 = 1.4 x 10(9) s-1. k01 and k02 denote the respective deactivation rate constants of the K+ free and bound forms of PBFI in the excited state. k21 represents the second-order rate constant of binding of K+ to the indicator in the excited state whereas k12 is the first-order rate constant of dissociation of the excited K(+)-PBFI complex. From the estimated values of k12 and k21, the dissociation constant Kd* in the excited state was calculated. It was found that pKd* (-0.7) is smaller than pKd (2.2). The effect of the excited-state reaction can be neglected in the determination of Kd and/or the K+ concentration. Therefore, intracellular K+ concentrations can be accurately determined from fluorimetric measurements by using PBFI as K+ indicator.
Full text
PDF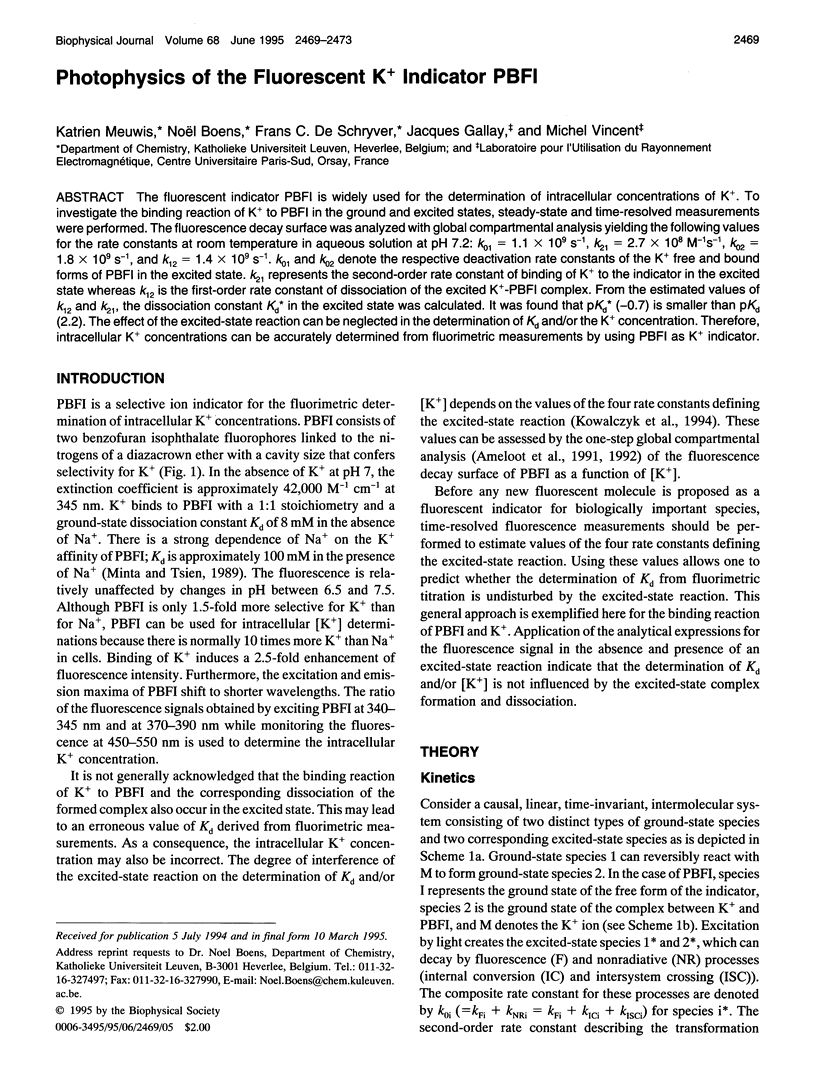
Selected References
These references are in PubMed. This may not be the complete list of references from this article.
- Boens N., Janssens L. D., De Schryver F. C. Simultaneous analysis of single-photon timing data for the one-step determination of activation energies, frequency factors and quenching rate constants. Application to tryptophan photophysics. Biophys Chem. 1989 Mar;33(1):77–90. doi: 10.1016/0301-4622(89)80010-9. [DOI] [PubMed] [Google Scholar]
- Kuipers O. P., Vincent M., Brochon J. C., Verheij H. M., de Haas G. H., Gallay J. Insight into the conformational dynamics of specific regions of porcine pancreatic phospholipase A2 from a time-resolved fluorescence study of a genetically inserted single tryptophan residue. Biochemistry. 1991 Sep 10;30(36):8771–8785. doi: 10.1021/bi00100a008. [DOI] [PubMed] [Google Scholar]
- Minta A., Tsien R. Y. Fluorescent indicators for cytosolic sodium. J Biol Chem. 1989 Nov 15;264(32):19449–19457. [PubMed] [Google Scholar]


