Abstract
We performed the biochemical and biophysical characterization of a red fluorescent protein, eqFP611, from the sea anemone Entacmaea quadricolor cloned in Escherichia coli. With an excitation maximum at 559 nm and an emission maximum at 611 nm, the recombinant protein shows the most red-shifted emission and the largest Stokes shift of all nonmodified proteins in the green fluorescent protein family. The protein fluoresces with a high quantum yield of 0.45, although it resembles the nonfluorescent members of this protein class, as inferred from the absence of the key amino acid serine at position 143. Fluorescence is constant within the range pH 4–10. Red fluorophore maturation reaches a level of 90% after ≈12 h by passing through a green intermediate. After complete maturation, only a small fraction of the green species (less than 1%) persists. The protein has a reduced tendency to oligomerize, as shown by its monomeric appearance in SDS/PAGE analysis and single-molecule experiments. However, it forms tetramers at higher concentrations in the absence of detergent. Fluorescence correlation spectroscopy reveals light-driven transitions between bright and dark states on submillisecond and millisecond time scales. Applicability of eqFP611 for in vivo labeling in eukaryotic systems was shown by expression in a mammalian cell culture.
Green fluorescent protein from Aequorea victoria (avGFP) and its derivatives have become extremely popular in life science research as protein labels, markers of gene expression, and reporters of environmental conditions in living cells (1–3). Molecular properties of avGFP have been modified by site-directed mutagenesis to optimize their applicability. Still, some properties, most importantly the restricted range of emission wavelengths, pose severe limitations in certain applications. In particular, red fluorescent proteins (FP) would be highly desirable because of the reduced cellular autofluorescence in the red spectral range and for use in multicolor labeling or fluorescence resonance energy transfer experiments. Efforts to produce stable red-fluorescent avGFP variants have not yet met with success. Recently, however, avGFP homologs were discovered in nonbioluminescent Anthozoa species (4–8). Some of the Anthozoa FPs show spectral properties that deviate greatly from avGFP, including red-emitting variants.
One of them, a red FP from the corallimorpharian Discosoma sp. named drFP583 (6), commercially known as DsRed, became the subject of various biochemical and biophysical studies (9–12). These studies revealed detrimental properties for certain applications of the wild-type protein, especially the slow and incomplete maturation of the fluorophore, the obligate formation of tetramers, and the tendency to aggregate. Meanwhile, maturation properties have been greatly improved by engineering the protein, and the tendency to form aggregates was also reduced by mutagenesis (13–15). Recently, the oligomerization problem of DsRed has been solved by mutagenetic means (16).
We have continued the strategy of our previous work (4, 8) and screened naturally occurring FPs to identify candidates with outstanding properties in potential applications as marker proteins. This work yielded several recombinant FPs. Here we describe one of these proteins, which we denote eqFP611, in accordance with the nomenclature suggested (6). With its far-red fluorescence, large Stokes shift, fast and essentially complete maturation, and reduced oligomerization tendency, eqFP611 promises to be a viable alternative to DsRed in a variety of applications.
Materials and Methods
Cloning of eqFP611.
A cDNA library of Entacmaea quadricolor was constructed as described (8) and expressed in Escherichia coli according to the manufacturer's protocol (Stratagene). Bacteria were plated on inducing agar plates and grown overnight at 37°C. Subsequently, plates were stored at 4°C for 1 week and visually screened for positive clones under UV radiation (366 nm). Plasmids were isolated from fluorescent colonies, and the sequence of the 5′ terminus was determined by using the Autoread sequencing kit (Amersham Pharmacia). The coding region of the cDNA was amplified by using a specific primer for the 5′ terminus of the ORF and the T7 primer and subcloned into pQE32 (Qiagen, Hilden, Germany). This plasmid introduces the coding sequence for a 6× His tag to the 5′ terminus of the insert. Double-strand sequencing of the insert was performed by a commercial provider (Microsynth, Balgach, Switzerland).
Protein Expression and Purification.
Bacteria (E. coli BL21 DE3) were transformed with the recombinant plasmid and grown on noninducing agar plates as described. As soon as the colonies developed fluorescence because of background expression, five weakly fluorescent colonies were used to set up a starter culture (50 ml of LB medium). After overnight growth at room temperature, 500 ml of 2YT medium were inoculated with 10 ml of the starter culture. The cultures were grown at 4°C under moderate shaking (120 rpm) until the cells developed a visible pinkish color. Bacteria were harvested and disrupted by sonication. The protein was purified from the 50,000 × g supernatant by using Talon metal affinity resin (BD Biosciences CLONTECH) with the buffers recommended by the provider for native protein purification. The eluate was further purified by gel filtration in 50 mM sodium phosphate buffer (pH 7.0) supplemented with 300 mM NaCl (Superdex 200, Äkta-System, Amersham Pharmacia). Protein concentration was determined by using the NanoOrange protein quantitation assay (Molecular Probes) and from the absorption at 280 nm (17).
Fluorophore Maturation.
We compared the maturation kinetics of eqFP611 and DsRed by growing two 100-ml cultures of BL21 DE3 cells bearing the plasmids in parallel. Both were induced with 1 mM isopropyl β-D-thiogalactoside at OD 0.2 and grown further for 8 h at room temperature. The time of disruption of the cells was taken as time 0. Protein was isolated immediately by using Talon resin (CLONTECH) as described and diluted to achieve a final buffer composition of 50 mM sodium phosphate (pH 7.0), 300 mM NaCl, and 15 mM imidazole. This solution was incubated at 24.5°C. Aliquots were removed for fluorometric assessment of the maturation as a function of time.
Pseudonative SDS/PAGE Analysis.
Purified protein was separated on 14% polyacrylamide gels (0.5 M Tris⋅HCl, pH 8.4/1% SDS). Samples were loaded on the gel in a buffer containing 0.05 M Tris⋅HCl, pH 6.8, 1% SDS, and 10% glycerol. The gel was imaged with a digital camera (Kaiser Fototechnik, Buchen, Germany) equipped with a standard ethidium bromide filter under UV radiation (366 nm).
Ensemble Spectroscopy.
Absorbance spectra were recorded on a Cary 1 spectrophotometer (Varian). Fluorescence spectra were measured on a Spex Fluorolog II (Spex Industries, Edison, NJ) at 2.2-nm bandwidth for excitation and emission. Fluorescence quantum yield measurements were performed by using crystal violet (Sigma–Aldrich) in methanol at equal optical density at 546 nm as a standard (18). All measurements were performed at 22°C.
Single-Molecule Spectroscopy and FCS.
For the experiments on individual immobilized eqFP611 molecules, the protein was diluted to a concentration of 100 pM in buffer (50 mM Tris/300 mM NaCl, pH 8.5) containing 2% poly(vinyl alcohol) (weight). This solution (50 μl) was spin-coated on a quartz coverslip. In the experiments, 514-nm light from an Ar+/Kr+-ion laser (Spectra-Physics 164) was focused on the sample by using a dichroic mirror (Q525LP, AHF, Tübingen, Germany) and a water immersion objective (Olympus 60×/1.2w, Hamburg, Germany) in an inverted microscope (Axiovert 35, Zeiss). The emitted photons were collected by the same objective, focused on a confocal pinhole (80 μm), and detected by an avalanche photodiode (SPCM-AQR-14, Perkin–Elmer). The observed spectral band was limited to wavelengths between 550 and 640 nm by using a dichroic mirror (640 DCXXR, AHF) and a long-pass filter (HQ 700/300, AHF). Single-molecule images were acquired with a piezoelectric scanning stage (Tritor 102 Cap, Piezosysteme Jena, Germany) by scanning 14 × 14-μm2 regions with 128 × 128 pixels resolution and an integration time of 5 ms/pixel. Fluorescence time trajectories of individual molecules were obtained by continuously recording the emission with 1-ms integration time near the center of the excitation profile.
FCS experiments were performed with 2 nM protein dissolved in Tris buffer (50 mM, 300 mM NaCl, pH 8.5). The confocal volume was enlarged by increasing its radius to 0.75 μm to better separate light-driven internal dynamics and diffusion. For the detection, we split the beam into two separate detection channels the outputs of which were cross-correlated in a digital correlator (ALV-5000/E, ALV, Langen, Germany).
Time-Correlated Single-Photon Counting.
Fluorescence lifetime measurements on eqFP611 were performed with a Zeiss Axiovert 135 inverted microscope by using a computer card for time-correlated single-photon counting (TIMEHARP 100, PicoQuant, Berlin). The excitation light pulses (460 nm) from a frequency-doubled (TP1B, Uniwave Technologies, Chatsworth, CA), argon-ion laser pumped Ti:sapphire laser (Mira 900, Coherent Radiation, Palo Alto, CA) were fed into the microscope through a single-mode optical fiber (QSMJ 320, OZ Optics, Carp, Canada).
Eukaryotic Expression.
The ORF of eqFP611 was amplified by PCR with primers generating a 5′ EcoRV and a 3′ KpnI site and subcloned into pcDNA3.1(−) (Invitrogen). HeLa cells were grown, plated on glass-bottom dishes (diameter, 3.5 cm), and transfected as described for Vero cells by Simpson et al. (19). Alternatively, cells were microinjected with the vector solution. Subsequently, cells were cultured for 20 h at 28°C in a humidified atmosphere containing 5% CO2. Cells were imaged at the Advanced Light Microscopy Facility at the European Molecular Biology Laboratory by using a Zeiss Axiovert 135 with a Plan-Apochromat 63×/1.4 objective and a standard TRITC filter set. Images were captured with a Photometrics CoolSNAP fx camera by using the METAMORPH software (Ver. 4.6; Universal Imaging, Downingtown, PA).
Results
Spectroscopic Properties.
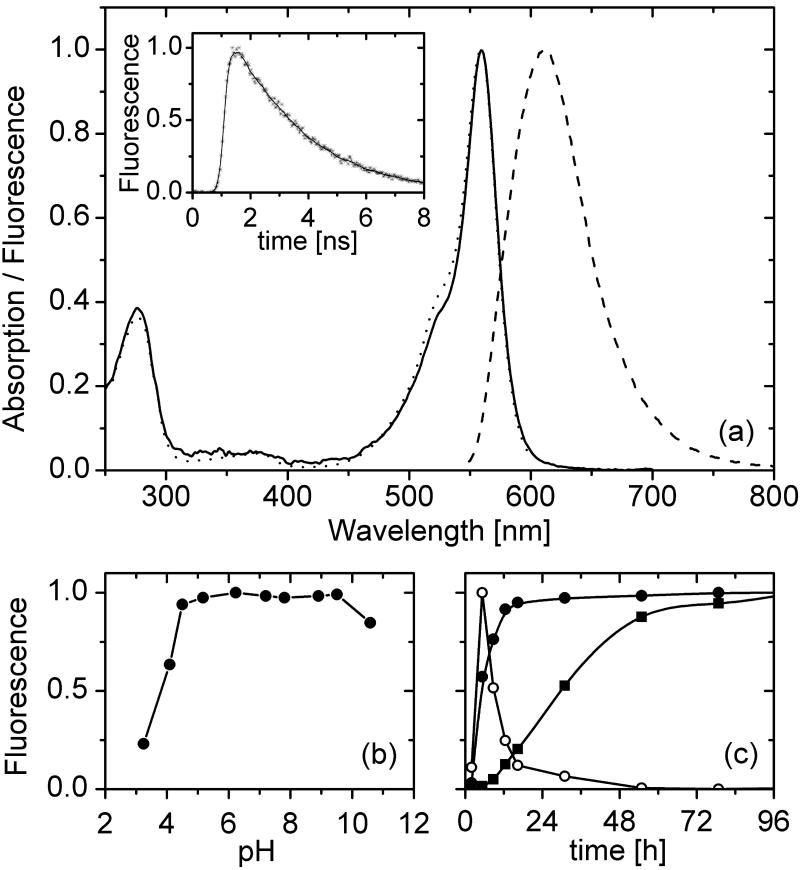
The absorption and fluorescence excitation spectra of eqFP611 in Fig. 1a display a strong band at 559 nm with an extinction coefficient of 78,000 M−1⋅cm−1 at the peak and a shoulder at 525 nm. The nearly perfect agreement between the two spectra implies essentially complete radiationless energy transfer from UV-absorbing aromatic amino acids to the red fluorophore. This conclusion is corroborated by the observation that an identical fluorescence emission band appears at 611 nm on excitation in the 559- or 280-nm band, but in the latter case essentially no fluorescence from aromatic amino acids. The large Stokes shift of 52 nm produces the most red-shifted emission of any unmodified recombinant FP studied so far. The emission does not change with pH in the range between 4 and 10 (Fig. 1b). We determined a fluorescence quantum yield of 0.45; the fluorescence lifetime of eqFP611 is 2.5 ns (Fig. 1a Inset).
Figure 1.
(a) Absorption (solid line), fluorescence excitation (dotted line), and emission (dashed line) spectra of eqFP611. For the excitation spectrum, the emission was measured at 611 nm; for the emission spectrum, fluorophores were excited at 546 nm. (Inset) Exponential fluorescence decay with a lifetime of 2.5 ns. (b) pH dependence of eqFP611 fluorescence emission at 611 nm upon excitation at 559 nm. (c) Maturation of eqFP611 and drFP583 (DsRed) at 24.5°C. eqFP611 red fluorescence maturation (closed spheres) proceeds by means of a green fluorescent intermediate (open spheres) and is essentially complete after 12 h and thus significantly faster than DsRed maturation (squares).
Fluorophore Maturation.
The time dependence of the emission, measured at 514 nm (eqFP611, green precursor), 611 nm (mature eqFP611), and 583 nm (DsRed) is depicted in Fig. 1c. Maturation of eqFP611 is essentially complete within 12 h, whereas DsRed is much slower (9).
Single-Molecule Studies of Photobleaching.
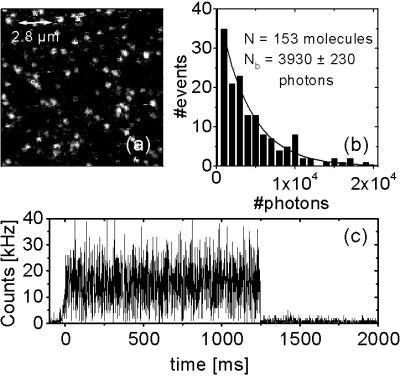
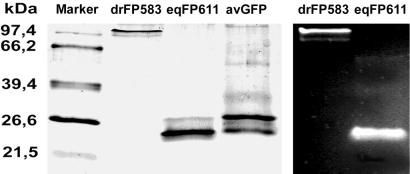
Fig. 2 shows a confocal scanning microscopy image together with a typical time trace of the emission of individual eqFP611 molecules immobilized in poly(vinyl alcohol) spin-coated on quartz coverslips. Unlike DsRed, which forms tetramers even at high dilution (9), eqFP611 exhibits one-step photobleaching, indicating that the sample consists of monomeric proteins, which was further confirmed by SDS/PAGE studies (Fig. 3). We have analyzed the total number of photons emitted before photobleaching for 153 protein molecules. The data are plotted in the histogram in Fig. 2. The decay toward large photon numbers is well described by an exponential, suggesting a poissonian photobleaching process. The characteristic decay coefficient of the exponential is NB = 3,930 ± 230 photons. Estimating the collection efficiency of our apparatus as 0.03, we find that the fluorophore can emit 1.3 × 10⁵ photons before photodestruction. With the fluorescence quantum yield of 0.45, we obtain a photobleaching yield ΦB = 3.5 × 10⁻⁶.
Figure 2.
(a) Confocal scanning microscopy image (128 × 128 pixels, 5-ms integration time per pixel, excitation intensity 1.4 kW/cm2 at 514 nm) of individual eqFP611 molecules embedded in a poly(vinyl alcohol) gel. The field of view covers an area of 14 × 14 μm2. (b) Histogram of the total number of photons collected from 153 individual eqFP611 molecules before photodestruction. An exponential fit is included as the solid line. (c) Typical examples of eqFP611 emission as a function of time (1-ms integration time).
Figure 3.
Pseudonative SDS/PAGE of a molecular weight marker (M), purified DsRed, eqFP611, and avGFP (silver-stained, lanes 1–4). In lane 3, 2 μg of eqFP611 were loaded at a concentration of 70 μM. The protein runs near monomeric avGFP. In lanes 5 and 6, DsRed and eqFP611 were imaged by their own fluorescence under UV excitation (366 nm).
Fluorescence Correlation Spectroscopy (FCS).
Analysis of the fluorescence correlation of freely diffusing molecules in a small open volume (typically 10−15 liters, beam waist r0) yields the diffusion time, τD, from which the diffusion coefficient D can be calculated by using τD = r /4D. Moreover, the FCS method is sensitive to intra- and intermolecular dynamic processes on time scales faster than τD that affect the fluorescence emission. The phenomenon of light-driven flickering of the fluorescence emission in avGFP variants has been studied in great detail (20, 21), and more recently, also for DsRed (22, 23).
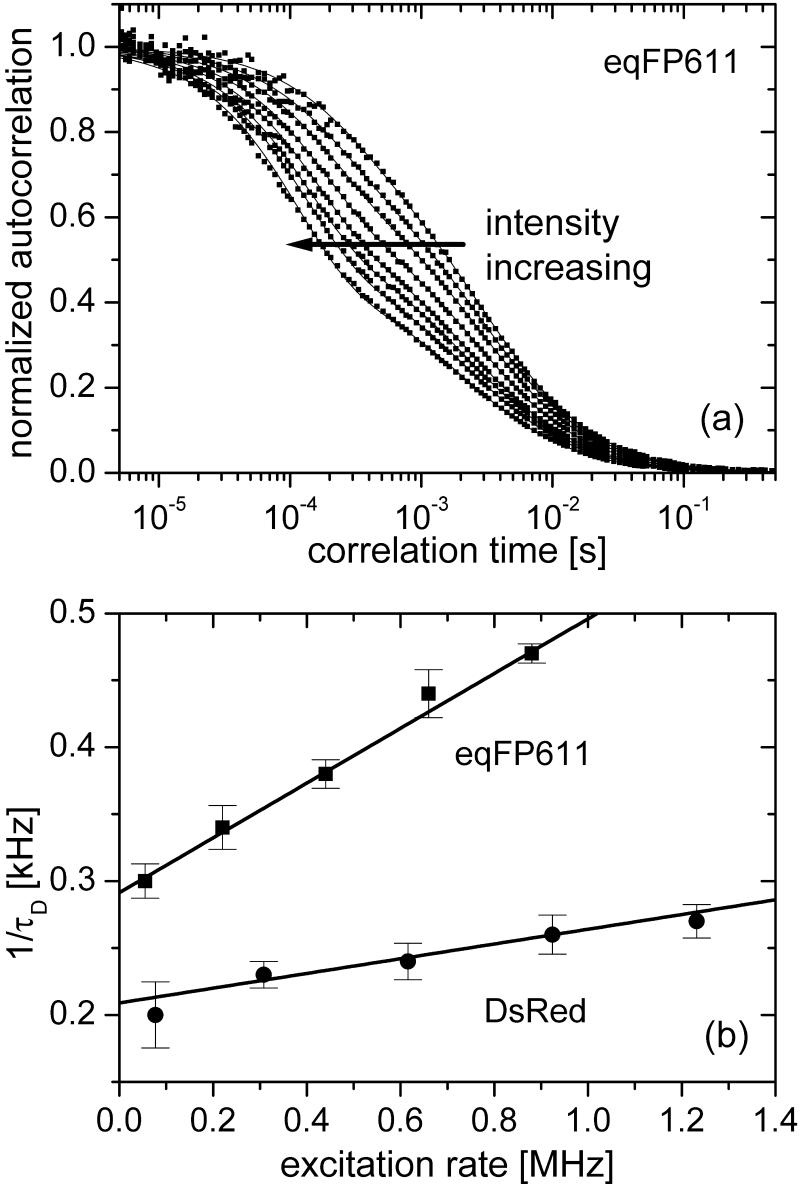
To gain information about the molecular size of the diffusing particles and the light-induced dynamics, we performed FCS measurements at different excitation powers. In the correlation functions in Fig. 4a, two dynamic processes are evident that both depend on the excitation intensity. On the submillisecond time scale, a flickering process with an intensity-dependent rate is well separated from the decay of the diffusional correlation. Furthermore, the apparent diffusion correlation time also changes with the excitation rate (Fig. 4b). The correlation functions can be described by a model that includes three-dimensional diffusion and fast reversible transitions between a fluorescent and a dark state (22).
 |
1 |
 |
where r0 and z0 represent the lateral and axial dimensions of the confocal volume, and τR denotes the inverse apparent rate coefficient for the flickering reaction. From the total number of molecules in the confocal volume, N, a fraction F exists in the dark state. A detailed analysis of the flickering dynamics is beyond the scope of this paper and will be presented elsewhere. Here we shall focus on the power dependence of the diffusion correlation time. The apparent acceleration of the diffusion rate with increasing excitation power is caused by the photoconversion into nonemitting states. Note that this dynamic phenomenon occurs on the diffusional time scale and thus is distinctly different from the submillisecond flicker represented by the exponential term of the correlation function, Eq. 1.
Figure 4.
(a) Normalized fluorescence correlation curves of eqFP611 at excitation intensities between 0.25–5 kW/cm2. The solid lines through the data are fits with a diffusion model that includes a light-induced reaction. Details are described in the text. (b) Apparent diffusion rate coefficients, τ , of eqFP611 and DsRed as a function of the excitation rate.
We have measured the power dependence of the FCS correlation functions for both DsRed and eqFP611. In Fig. 4b, the apparent diffusion rates are plotted versus the excitation rate. Compared with DsRed, the data for eqFP611 are shifted markedly toward larger frequencies, indicating that eqFP611 has a smaller hydrodynamic radius and hence diffuses faster. The pure diffusion rate coefficient can be extracted from these curves as the intercept with the ordinate; 291 ± 5 Hz for eqFP611 and 209 ± 5 Hz for DsRed. Using Rhodamine 6G as a calibration standard (24), we have converted these data into diffusion coefficients, (3.0 ± 0.3) × 10−11 m2⋅s−1 for DsRed and (4.1 ± 0.2) × 10−11 m2⋅s−1 for eqFP611. These values are within error identical to those determined earlier for DsRed and citrine, an improved yellow FP of essentially identical molecular mass as eqFP611 (22). The apparent quantum yield, Φd, of the process that causes the power-dependent shift of the correlation times is given by the slope of the lines in Fig. 4b. It is 2 × 10⁻⁴ for eqFP611 and 0.5 × 10⁻⁴ for DsRed. For eqFP611, this yield is more than 50 times larger than the photobleaching yield from the measurements on immobilized single molecules, implying that this process is distinct from permanent photobleaching.
Eukaryotic Expression.
HeLa cells expressing eqFP611 at 28°C showed an excellent fluorescence image 20 h after transfection (Fig. 5). Microinjected cells show red fluorescence typically after ≈6 h. Cell contours and those of the nucleus and nucleolus are clearly visible in the images. This observation also suggests a low aggregation tendency in the cellular environment. Trials to express the protein at 37°C, however, have not yet met with success.
Figure 5.
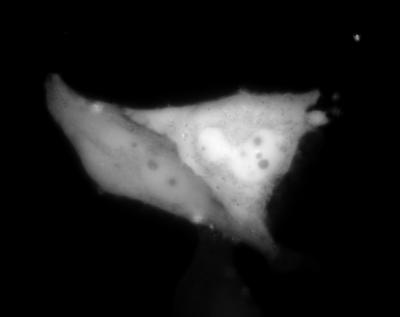
Fluorescence image of a HeLa cell expressing eqFP611. After transfection, cells were cultured for 20 h at 28°C.
Discussion
Spectroscopic Properties.
In Table 1, we have compiled parameters of eqFP611 and DsRed for comparison. Both the wavelength of maximal absorption and the extinction coefficient of eqFP611 are nearly identical with those reported for DsRed (6, 9). In contrast to DsRed, which emits mainly at 583 nm, eqFP611 has an emission maximum at 611 nm, which is the most red-shifted emission of any unmodified recombinant FP studied so far. Naturally occurring FPs with emission maxima above 600 nm have recently been described for scleractinians (25), although none of these far-red FPs are currently available in recombinant form. The emission is constant between pH 4 and 10 (Fig. 1b), similar to DsRed, but in contrast to most avGFP variants (22). The fluorescence quantum yield of eqFP611 of 0.45 is somewhat lower than the value of 0.7 reported for DsRed (9, 26). The fluorescence lifetime of eqFP611 is 2.5 ns and hence smaller than the value of 3.6 ns from ensemble measurements on DsRed (22, 26), but similar to fluorescence decays measured on “super red” individual DsRed tetramers (27). The photobleaching quantum yield of eqFP611 determined here by single-molecule experiments, ΦB = 3.5 × 10⁻⁶, fits well into the range reported for DsRed by different methods, 0.8–9.5 × 10⁻⁶ (9, 22, 26).
Table 1.
Properties of eqFP611 and drFP583 (DsRed)
| Fluorescent protein | eqFP611 | drFP583 |
|---|---|---|
| Number of amino acids | 231 | 225 |
| Molecular mass, kDa | 25.93 | 26.05 |
| Isoelectric point, pI | 6.6 | 8.0 |
| Excitation/emission maximum, nm | 559/611 | 558/583 |
| Stokes shift, nm | 52 | 25 |
| Extinction coefficient, M−1·cm−1 | 78,000 | 75,000 |
| Fluorescence quantum yield | 0.45 | 0.7 |
| Photobleaching quantum yield | 3.5 × 10⁻⁶ | 0.8–9.5 × 10⁻⁶* |
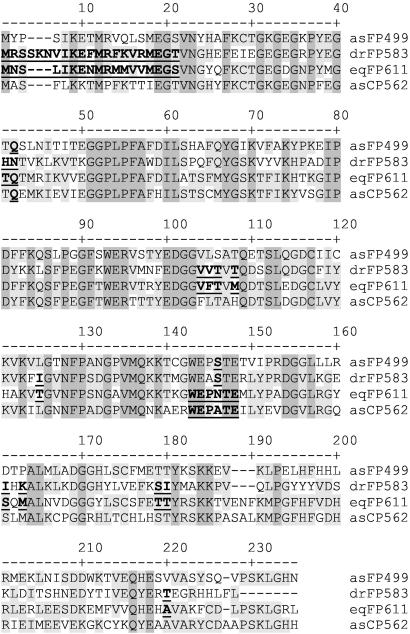
The family of GFP-like proteins can be divided into two major groups; the members of one group exhibit visible fluorescence, whereas the members of the other, although brightly colored, appear nonfluorescent to the unequipped eye. However, at least the “nonfluorescent” chromoproteins asCP (28), formerly called asFP595 (29), and asCP562 from Anemonia sulcata (8), show residual fluorescence detectable by spectrofluorimetry. The group of highly fluorescent proteins is characterized by a conserved Ser in position 146 (throughout this paper, we use the numbering scheme from the alignment of sequences shown in Fig. 6), corresponding to His-148 in avGFP, whereas this position is occupied by Cys, Ala, or Asn in the “nonfluorescent” chromoproteins. Lukyanov and coworkers showed that the fluorescence can be significantly increased by replacing the latter amino acids by Ser (28, 29). With a quantum yield of 0.45, eqFP611 clearly belongs to the highly fluorescent group. Remarkably, it contains an Asn as the Ser-corresponding residue like the nonfluorescent chromoprotein from Goniopora tenuides (28), whereas the neighboring residues 143–145 and 147–148 are strictly conserved among eqFP611 and all nonfluorescent chromoproteins (underlined in Fig. 6). It is evident that a Ser in this position is not essential for strong fluorescence.
Figure 6.
Multiple alignment of eqFP611 and FPs with different spectral properties from Anthozoa: asFP499 (green emission, highly fluorescent) (8), drFP583 (red emission, highly fluorescent) (6), eqFP611 (red emission, highly fluorescent), asCP562 (nonfluorescent) (8). Numbering is based on drFP583 (DsRed). Conserved and partially conserved amino acids are shaded in dark and light gray, respectively. Underlined residues are discussed in the text.
Fluorophore Maturation.
The maturation behavior of DsRed has recently been improved by mutagenesis (13, 15). It was shown that replacement of Asn-42 by Gln and Thr-21 by Ser accelerates fluorophore maturation (see Fig. 6) (13). The corresponding residues in eqFP611 are naturally occupied by Gln and Ser, respectively. In DsRed, the substitution Ile-161 to Thr, which replaces a hydrophobic amino acid by a polar one, also results in faster maturation (15). The protein eqFP611 possesses a polar amino acid, Ser, in this location. In summary, the comparison of the amino acids introduced into DsRed to improve maturation speed with the corresponding ones in fast-maturing eqFP611 points to a general relevance of these residues on the maturation kinetics in Anthozoa FPs.
As in DsRed, a green fluorescing intermediate appears in the course of fluorophore maturation of eqFP611. After complete maturation, eqFP611 shows minimal residual green fluorescence with a flat excitation maximum at ≈500 nm and an emission with a maximum at ≈520 nm that is less than 1% of the red emission. It is less than 0.1% as compared with the red emission excited at 559 nm. By contrast, a significant fraction of molecules remains in the green fluorescent state in DsRed, which can cause problems in multicolor labeling experiments (9). This population is observed as a pronounced shoulder at 483 nm in the excitation spectrum (15). In DsRed, the exchange of Val in position 105 by the smaller Ala was suggested to relax the overall structure and to facilitate complete maturation (15). A similar effect seems less likely in eqFP611 because the corresponding position is occupied by a bulky Phe residue.
Oligomerization and Aggregation.
Oligomerization of a marker protein can be detrimental in many applications such as the tracking of fusion proteins or the study of protein interactions. Under the conditions of our single-molecule and pseudonative SDS/PAGE experiments, eqFP611 appeared as a monomer. However, in size-exclusion chromatography at micromolar concentrations, eqFP611 elutes with the size of a tetramer (data not shown). In the FCS experiments, which were done at nanomolar concentrations, a mass ratio of 2.7 between DsRed and eqFP611 results from the diffusion rates. This ratio is less than the factor of 4 that we expected for monomeric eqFP 611, assuming that DsRed forms tetramers, which is known to occur even at concentrations in the picomolar range (9). Great efforts have been undertaken to engineer DsRed and related proteins by mutagenesis so as to reduce the oligomerization tendency, prevent aggregation, and increase solubility (13, 14, 16). Aggregation of proteins can be caused by hydrophobic patches on the protein surface and electrostatic interactions between negatively and positively charged surface patches. The protein surface of the DsRed tetramer is predominantly negatively charged, except for a cluster of positive charges at the N terminus ranging from residue 1 to 20 (isoelectric point pI = 11.05, underlined in Fig. 6). Elimination of these charges by site-directed mutagenesis reduced aggregate formation, presumably by preventing basic–acidic surface interactions between monomers. In eqFP611, with pI = 6.4 for the corresponding first 17 residues, the N-terminal charge is markedly reduced at physiological pH compared with DsRed. This reduction may provide the same effect as the artificial charge reduction in other Anthozoa FPs (14). Moreover, the overall charge in eqFP611 (pI = 6.6) is smaller than in the DsRed precursor drFP583 (pI = 8.0) at pH 7, which might prevent similar interactions between other regions of the protein.
Lately, a nonfluorescent avGFP-homolog from the sea anemone Heteractis crispa has been described (28). Like DsRed, this protein forms tetramers. However, a dimeric mutant, commercially available as hcRed (CLONTECH), was generated by exchanging a nonpolar amino acid (Leu) with a polar one (His). This residue corresponds to Ile-125 in drFP583 (underlined in Fig. 6), within the tetrameric interface (11, 12, 28). The related position in eqFP611 is also occupied by a polar amino acid (Thr), which may reduce the affinity between the monomers of eqFP611 by preventing hydrophobic interactions between the molecules.
A monomeric variant of DsRed, called mRFP1, has been generated most recently by alteration of 33 aa (16). Remarkably, six of them, N42Q, K163M, S179T, T217A, H41T, and I180T, can be also observed in the corresponding positions in eqFP611. The latter two are external residues of which Thr-180 affects the AB subunit interface. The four other positions correspond to internal residues. Met-163 and Ala-217 are immediate neighbors of key residues His-162 and Arg-216 in the AC interface (12) and might affect interactions by subtle surface rearrangements. To conclude, sequence similarities exist between eqFP611 and the engineered proteins hcRed and mRFP1 that can motivate the reduced oligomerization tendency of eqFP611.
After induction by isopropyl β-D-thiogalactoside, E. coli BL21 cells bearing the plasmid coding for eqFP611 become fluorescent already after overnight growth at 37°C. However, a large portion of the protein remains insoluble. During our attempts to increase the yield of usable product, we discovered that the yield of eqFP611 can be increased significantly if the protein is expressed at low temperatures in the absence of inducer. On pseudonative SDS gels, samples from such preparations appear as sharp bands at the position corresponding to monomers (Fig. 3).
In bacterial cells under inducing conditions, DsRed also forms higher-order aggregates, and a large portion of the protein remains insoluble. Analyzing by pseudonative SDS/PAGE, we and others found that DsRed forms a high-molecular smear on the gel (9, 13). As with eqFP611, the yield of soluble DsRed can be increased if the protein is expressed at low temperature in the absence of inducer. On pseudonative SDS gels, samples from such preparations appear as sharp bands at the position corresponding to tetramers (Fig. 3), which suggests that aggregation can be prevented if the expression rate is kept low.
Conclusion
With properties such as far-red emission combined with a large Stokes shift, fast maturation and reduced oligomerization tendency, eqFP611 appears as a superb reporter protein. Aggregation was markedly reduced by expression under noninducing conditions. Still, applicability of this marker protein is presently limited by the temperature sensitivity of expression in eukaryotic cells. As demonstrated for avGFP, hcRed, and DsRed, mutagenesis can help to overcome several problems associated with wild-type FPs. Therefore, we are currently using eqFP611 as a promising template for site-directed and random mutagenesis to hone even further its properties as a fluorescent marker protein.
Acknowledgments
We thank Ms. Maja Weigmann-Lenz and Mr. Sergey Ivanchenko (University of Ulm, Ulm, Germany) for skillful technical assistance. The drFP583 clone that we used for comparison was a kind gift from Dr. Sergey A. Lukyanov (Russian Academy of Sciences, Moscow). We thank Dr. Johan Hofkens (University of Leuven, Belgium), for the poly(vinyl alcohol) used in the single-molecule experiments and Visitron Systems (Puchheim, Germany) for support of the Advanced Light Microscopy Facility at the European Molecular Biology Laboratory (Heidelberg, Germany). This work was supported by Deutsche Forschungsgemeinschaft Grants GRK 328 and SFB 569 (to G.U.N.) and by the University of Ulm (Anfangsförderung to J.W.).
Abbreviations
- DsRed
Discosoma sp. red fluorescent protein
- FCS
fluorescence correlation spectroscopy
- FP
fluorescent protein
- avGFP
Aequorea victoria green fluorescent protein
Footnotes
This paper was submitted directly (Track II) to the PNAS office.
Data deposition: The sequence reported in this paper has been deposited in the GenBank database (accession no. AY130757).
References
- 1.Prasher D C, Eckenrode V K, Ward W W, Prendergast F G, Cormier M J. Gene. 1992;111:229–233. doi: 10.1016/0378-1119(92)90691-h. [DOI] [PubMed] [Google Scholar]
- 2.Chalfie M, Tu Y, Euskirchen G, Ward W W, Prasher D C. Science. 1994;263:802–805. doi: 10.1126/science.8303295. [DOI] [PubMed] [Google Scholar]
- 3.Tsien R Y. Annu Rev Biochem. 1998;67:509–544. doi: 10.1146/annurev.biochem.67.1.509. [DOI] [PubMed] [Google Scholar]
- 4.Wiedenmann J, Röcker C, Funke W. In: Verhandlungen der Gesellschaft für Ökologie. Pfadenhauer J, editor. Vol. 29. Heidelberg: Springer; 1999. pp. 497–503. [Google Scholar]
- 5.Wiedenmann J. Offenlegungsschrift DE 197 18 640 A1. 1997. ; Deutsches Patent und Markenamt, pp. 1–18. [Google Scholar]
- 6.Matz M V, Fradkov A F, Labas Y A, Savitsky A P, Zaraisky A G, Markelov M L, Lukyanov S A. Nat Biotechnol. 1999;17:969–973. doi: 10.1038/13657. [DOI] [PubMed] [Google Scholar]
- 7.Fradkov A F, Chen Y, Ding L, Barsova E V, Matz M V, Lukyanov S A. FEBS Lett. 2000;479:127–130. doi: 10.1016/s0014-5793(00)01895-0. [DOI] [PubMed] [Google Scholar]
- 8.Wiedenmann J, Elke C, Spindler K D, Funke W. Proc Natl Acad Sci USA. 2000;97:14091–14096. doi: 10.1073/pnas.97.26.14091. [DOI] [PMC free article] [PubMed] [Google Scholar]
- 9.Baird G S, Zacharias D A, Tsien R Y. Proc Natl Acad Sci USA. 2000;97:11984–11989. doi: 10.1073/pnas.97.22.11984. [DOI] [PMC free article] [PubMed] [Google Scholar]
- 10.Mizuno H, Sawano A, Eli P, Hama H, Miyawaki A. Biochemistry. 2001;40:2502–2510. doi: 10.1021/bi002263b. [DOI] [PubMed] [Google Scholar]
- 11.Wall M A, Socolich M, Ranganathan R. Nat Struct Biol. 2000;7:1133–1138. doi: 10.1038/81992. [DOI] [PubMed] [Google Scholar]
- 12.Yarbrough D, Wachter R M, Kallio K, Matz M V, Remington S J. Proc Natl Acad Sci USA. 2001;98:462–467. doi: 10.1073/pnas.98.2.462. [DOI] [PMC free article] [PubMed] [Google Scholar]
- 13.Bevis B J, Glick B S. Nat Biotechnol. 2002;20:83–87. doi: 10.1038/nbt0102-83. [DOI] [PubMed] [Google Scholar]
- 14.Yanushevich Y G, Staroverov D B, Savitsky A P, Fradkov A F, Gurskaya N G, Bulina M E, Lukyanov K A, Lukyanov S A. FEBS Lett. 2002;511:11–14. doi: 10.1016/s0014-5793(01)03263-x. [DOI] [PubMed] [Google Scholar]
- 15.Terskikh A V, Fradkov A F, Zaraisky A G, Kajava A V, Angres B. J Biol Chem. 2002;277:7633–7636. doi: 10.1074/jbc.C100694200. [DOI] [PubMed] [Google Scholar]
- 16.Campbell R E, Tour O, Palmer A E, Steinbach P A, Baird G S, Zacharias D A, Tsien R Y. Proc Natl Acad Sci USA. 2002;99:7877–7882. doi: 10.1073/pnas.082243699. [DOI] [PMC free article] [PubMed] [Google Scholar]
- 17.Mach H, Middaugh C R, Lewis R V. Anal Biochem. 1992;200:74–80. doi: 10.1016/0003-2697(92)90279-g. [DOI] [PubMed] [Google Scholar]
- 18.Olmstedt J. J Phys Chem. 1979;83:2581–2584. [Google Scholar]
- 19.Simpson J C, Wellenreuther R, Poustka A, Pepperkok R, Wiemann S. EMBO Rep. 2000;1:287–292. doi: 10.1093/embo-reports/kvd058. [DOI] [PMC free article] [PubMed] [Google Scholar]
- 20.Haupts U, Maiti S, Schwille P, Webb W W. Proc Natl Acad Sci USA. 1998;95:13573–13578. doi: 10.1073/pnas.95.23.13573. [DOI] [PMC free article] [PubMed] [Google Scholar]
- 21.Schwille P, Kummer S, Heikal A A, Moerner W E, Webb W W. Proc Natl Acad Sci USA. 2000;97:151–156. doi: 10.1073/pnas.97.1.151. [DOI] [PMC free article] [PubMed] [Google Scholar]
- 22.Heikal A A, Hess S T, Baird G S, Tsien R Y, Webb W W. Proc Natl Acad Sci USA. 2000;97:11996–12001. doi: 10.1073/pnas.97.22.11996. [DOI] [PMC free article] [PubMed] [Google Scholar]
- 23.Malvezzi-Campeggi F, Jahnz M, Heinze K G, Dittrich P, Schwille P. Biophys J. 2001;81:1776–1785. doi: 10.1016/S0006-3495(01)75828-6. [DOI] [PMC free article] [PubMed] [Google Scholar]
- 24.Rigler R, Mets Ü, Widengren J, Kask K. Eur Biophys J. 1983;22:169–175. [Google Scholar]
- 25.Salih A, Larkum A, Cox G, Kuhl M, Hoegh-Guldberg O. Nature (London) 2000;408:850–853. doi: 10.1038/35048564. [DOI] [PubMed] [Google Scholar]
- 26.Lounis B, Deich J, Rosell F I, Boxer S G, Moerner W E. J Phys Chem B. 2001;105:5048–5054. [Google Scholar]
- 27.Cotlet M, Hofkens J, Habuchi S, Dirix G, Van Guyse M, Michiels J, Vanderleyden J, De Schryver F C. Proc Natl Acad Sci USA. 2001;98:14398–14403. doi: 10.1073/pnas.251532698. [DOI] [PMC free article] [PubMed] [Google Scholar]
- 28.Gurskaya N G, Fradkov A F, Terskikh A, Matz M V, Labas Y A, Martynov V I, Yanushevich Y G, Lukyanov K A, Lukyanov S A. FEBS Lett. 2001;507:16–20. doi: 10.1016/s0014-5793(01)02930-1. [DOI] [PubMed] [Google Scholar]
- 29.Lukyanov K A, Fradkov A F, Gurskaya N G, Matz M V, Labas Y A, Savitsky A P, Markelov M L, Zaraisky A G, Zhao X, Fang Y, et al. J Biol Chem. 2000;275:25879–25882. doi: 10.1074/jbc.C000338200. [DOI] [PubMed] [Google Scholar]


