Abstract
In human diseases related to tumor-suppressor genes, it is suggested that only the complete loss of the protein results in specific symptoms such as tumor formation, whereas simple reduction of protein quantity to 50%, called haploinsufficiency, essentially does not affect cellular behavior. Using a model of gene expression, it was presumed that haploinsufficiency is related to an increased noise in gene expression also in vivo [Cook, D. L., Gerber, A. N. & Tapscott, S. J. (1998) Proc. Natl. Acad. Sci. USA 95, 15641–15646]. Here, we demonstrate that haploinsufficiency of the tumor-suppressor gene neurofibromatosis type 1 (NF1) results in an increased variation of dendrite formation in cultured NF1 melanocytes. These morphological differences between NF1 and control melanocytes can be described by a mathematical model in which the cell is considered to be a self-organized automaton. The model describes the adjustment of the cells to a set point and includes a noise term that allows for stochastic processes. It describes the experimental data of control and NF1 melanocytes. In the cells haploinsufficient for NF1 we found an altered signal-to-noise ratio detectable as increased variation in dendrite formation in two of three investigated morphological parameters. We also suggest that in vivo NF1 haploinsufficiency results in an increased noise in cellular regulation and that this effect of haploinsufficiency may be found also in other tumor suppressors.
Noise makes an important contribution to biological systems (for a review, see ref. 1). Examples include the mutational input to evolution (2), the intracellular fluctuation of regulatory molecules (3, 4), gene networks (5, 6), the signal processing in organisms (7), and specific abilities of cells such as directed migration (8, 9). The expression of a single gene also is a stochastic process (10, 11) that can be simulated in mathematical models (1, 4, 12). In such a model the consequences of gene copy number and gene expression deactivation rates on the reliability of the levels of gene products were investigated (13). There, the gene copy (allele) number proves to be a critical variable in achieving a predictable outcome of gene products. Somatic human cells contain two alleles of autosomal genes. In the mathematical model of ref. 13 one of the consequences of the reduction of this gene dose to one allele (haploinsufficiency) is an increased noise shown as increased susceptibility to stochastic interruptions of gene expression. Assuming a biological effect to occur below a threshold of 10% of the normal amount of a gene product, this study shows an increased occurrence of this stochastic effect in the haploid system. In vivo in humans, this postulated biological effect of haploinsufficiency has not yet been demonstrated.
A dose reduction of a functional gene can occur by an inactivating mutation. A group of autosomal genes with biological effects related to a reduced gene dose are the tumor-suppressor genes. An inactivating mutation in one allele of such a gene in the germ cells predisposes to formation of tumors in somatic cells. An additional somatic mutation inactivating the other allele (second hit) induces the tumor (for a review, see ref. 14). Often the general interest in the function of tumor-suppressor genes is focused on this effect of complete loss of the tumor-suppressor protein, as seen in the discussion about a classical tumor suppressor, the neurofibromatosis type 1 gene (NF1) (for a review, see ref. 15). In patients with this inherited tumor disease, the NF1 mutation in germ cells inactivates one allele, resulting in NF1 haploinsufficiency (16, 17). The most obvious symptoms of NF1 are the numerous benign tumors of the peripheral nervous system (neurofibromas) and an increased incidence of malignant tumors. Both are suggested to be the biological consequence of the complete loss of the NF1 protein in tumor progenitor cells (18, 19). But there are also biological effects of NF1 haploinsufficiency (20, 21). In NF1 skin NF1 haploinsufficiency is related to an increased density of melanocytes (22) resulting in a generalized hyperpigmentation and the additional occurrence of stochastically distributed, sharply bordered congenital hyperpigmentations, the café-au-lait macules (23–25). The underlying mechanism for this pattern of pigmentation is unknown (26). In Nf1 knock-out mice Nf1 haploinsufficiency modulates melanocyte and mast cell fates (27). Neurofibromin shows a Ras GTPase-activating activity (28, 29) and is involved by means of Ras signal transduction in the regulation of growth (21, 30). In addition, it is found to be associated with the cytoskeleton (31). NF1-deficient cells exhibit morphological changes, as demonstrated for Nf1−/− Schwann cells (30) or cells from Drosophila homozygous for null mutations of an NF1 homologue (32). Also, neurofibromin reduction can result in morphological changes as shown in cultured human NF1 keratinocytes, in which it is colocalized with intermediate filaments (33).
Here, we examined consequences of NF1 haploinsufficiency in cultured melanocytes of NF1 patients. In vivo, these cells are directly involved in the formation of NF1 symptoms such as the café-au-lait macules. Some morphological parameters of the cells can easily and precisely be measured in a single melanocyte in vitro. Our experimental findings can be quantified by a simple mathematical model. The important point of the model is that the cellular signal chain is modified by stochastic processes. The equations representing the model describe the adjustment of the examined morphological parameters to a set point and include a noise term that allows for stochastic processes. The self-adjustment to a set point is the mechanism that prevents the cell from becoming disordered, and therefore this mechanism is also called self-regulation (34). This concept has been successfully applied to describe the directed migration of granulocytes as related to various input signals (35–37), the orientation of fibroblasts (8) or keratinocytes (38), and the self-organized alignment of interacting melanocytes in vitro (39, 40). The ratios of the parameters of the mathematical model, represented by signal-to-noise ratios, were determined from the experimental data, and we checked how well the model describes the measured data by using a fitting algorithm. A comparison of these results in control cells with those obtained in cells haploinsufficient for NF1 demonstrated that haploinsuffiency introduces increased noise rather than altering the set point of the system. This observation supports the hypothesis predicting an altered signal-to-noise ratio in haploinsufficient cells (13). Concerning dendrite formation, NF1 haploinsufficiency is associated with an increased noise in two of three investigated cell biological parameters in cultured NF1 melanocytes.
Methods
Morphological Parameter.
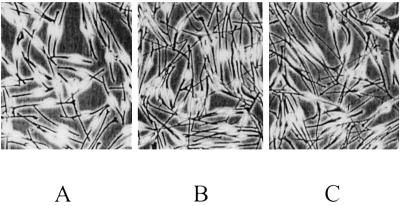
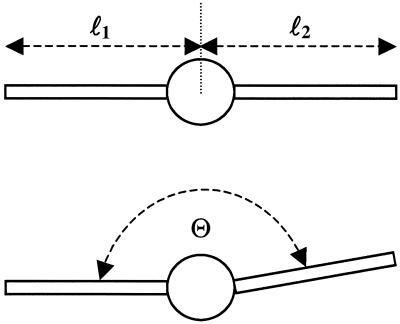
The preparation of melanocytes from biopsies from skin of healthy donors and from skin and café-au-lait macules of NF1 patients was performed as described (24). The germ-line mutations in the patients inactivate one NF1 allele (17). In both kinds of NF1 melanocytes one NF1 wild-type allele is present and the cells show a reduction of neurofibromin to approximately 50% (24, 25). The melanocytes of five controls and five NF1 patients (skin and café-au-lait macule) were cultured in parallel (Fig. 1). The patients were matched for age and gender, the cells for passage and density. At day 7, 20 pictures at different randomly chosen positions of the cultures each were digitized (450–600 cells per culture). The angle between the dendrites, their length, and their number were used as morphological parameters (Fig. 2). Based on nih image (available at http://rsb.info.nih.gov/nih-image/), an image-processing algorithm was developed to determine the values of these morphological parameters for each cell. These data were stored in a database after normalization of the observed distributions: (i) The angle, Θ, between the dendrites was measured and converted to a normalized angle density function: f*2(Θ) for two dendrites per cell (taking the smaller of the two possible angles), f*3(Θ) for three dendrites per cell (taking the smaller two of the three possible angles), etc. (ii) The length, l, of a dendrite was collected in normalized length density functions: f*2(l) for two dendrites per cell, f*3(l) for three dendrites per cell, etc. (iii) The number of dendrites per cell was collected in a normalized histogram, f*(n) = N(n)/NA, with NA being the total number of dendrites.
Fig 1.
Melanocytes derived from skin of a control (A), from normal skin of a NF1 patient (B), and from a NF1 café-au-lait macule (C). (×75.) Melanocytes of five controls and NF1 patients (skin and café-au-lait macule) were cultured in parallel. At day 7, 20 randomly taken pictures were digitized (450–600 cells per culture). The different morphology of NF1 cells compared with the normal melanocytes is obvious.
Fig 2.
Definition of morphological parameters of a melanocyte. The length of the dendrites is ln. The angle between the two dendrites is Θ. It was measured with no direction so that Θ ≤ 180° for n = 2.
Mathematical Description of Morphology of Melanocytes.
According to our hypothesis, cellular morphology of cultured melanocytes can be modeled as an automaton similar to that previously shown for other cells (8, 38). Because the morphology of melanocytes is not entirely disordered, we assume that there exists some kind of equilibrium or set point. This set point can be seen similar to an order parameter according to Haken's concept of synergistics (34). For example, the angle between two dendrites is not entirely random. The density distribution of the angle has a maximum that may correspond to the set point of the automaton and is assumed to correspond to the equilibrium of the model. If there occurs a deviation from the assumed set point in any of the cells, there has to be a mechanism (or force) that directs the cell back to the set point. In consequence, the changes in the angle between the dendrites, Θ, can be described by the following differential equation
 |
with 0° < Θ ≤ 360° and n dendrites per cell. The first term on the right side describes the automaton for the orientation of the dendrites. The characteristics by which the cell returns to the set point
 |
is determined by kΘ. Because there is always some variation in the orientation of dendrites in melanocyte cultures, a second assumption has to be made for the model. We introduced some stochastic disturbance to the model which describes the deviation of some cells from the set point. In consequence, an additional term, ΓΘ(t), was added to Eq. 1 to account in the model for the stochastic input. A similar equation holds for the length l of the dendrites:
 |
These stochastic equations are similar to equations describing an disturbed automatic controller (8). Because of the term for stochastic disturbance, Eqs. 1 and 3 cannot be solved analytically and thus cannot be used directly to predict the density function for the angle between the dendrites or their length. However, it is possible, for example, to predict the probability by which the angle between two dendrites falls between Θ and Θ + ΔΘ. This probability is given by the stochastic angular density distribution function f(Θ). Such density functions can be obtained by transforming the stochastic differential equations (Eqs. 1 and 3) into partial differential equations for the density functions of Θ and l. If one assumes that the stochastic input can be approximated by white noise with the strength q(〈Γ(t)〉 = 0 and 〈Γ(t)Γ(t′)〉 = qδ(t − t′); see also refs. 37, 38, and 41), the partial differential equation describing the density distribution for the angle is
 |
A similar partial differential equation is obtained for the length of the dendrites.
 |
It is experimentally difficult to get the density distribution for the angle between the two dendrites or the lengths of dendrites for single cells over time. This would require one to observe the cells over a long time interval (several days or weeks). Therefore, we assume that the system is (quasi) ergodic, and that the variation of single cell morphology in time corresponds to the morphological variation of many cells in the culture at one defined time point. For another cellular system, the granulocytes, it was demonstrated that intracellular variability can be approximated by intercellular variability. In the directed migration of these cells with its changes in direction and morphology the characteristic time is much shorter (seconds). The measured angle distribution density of a single granulocyte over a long period (1 hr) is almost identical with the steady-state density distribution of an ensemble of cells (35). Thus, we consider the steady-state distribution of the angle between the dendrites and their lengths of an ensemble of cells. The nonstationary solutions are not considered here. The steady-state solutions for the density functions are
 |
and
 |
where f0 is a constant, which is determined by the normalization (∫ f(Θ)dΘ = 1, ∫ f(l)dl = 1, l > 0). Each equation provides two parameters (Θ0 and σΘ, l0 and σl) which can be estimated from the observed data (see also Note in legend for Fig. 6). These parameters can be used to define signal-to-noise ratios characterizing the entire system. They can be written as
 |
and
 |
The third observed morphological parameter, the number of dendrites, is a discrete number and cannot be described by a continuous differential equation like Eq. 1 or Eq. 3. We suggest that the assumptions of a set point and noise are, however, still valid for the underlying continuous process resulting in the observed discrete number of dendrites of a single cell. Because the density distribution of the number of dendrites is always positive, the density distribution can be described by a generating function (f(n) = f0exp(V(n))) without loss of information (34). We propose the following generating function and obtain the following expression in analogy to Eq. 7:
 |
with n = 1, 2, 3,… , f0 determined by the normalization (∑ f(n) = 1), and σn describing the width of the distribution. A quadratic dependence is assumed because the distribution has a maximum at the set point n0 and an assumed value for n = 1, estimated by the measured anisotropy of the dendrite lengths (data not shown). This determination of number of dendrites may be understood on the basis of reaction–diffusion models (42–44). These models result in different spatial modes of assumed activator and inhibitor molecules. Each mode can be considered as a self-organized automaton with special properties (45) and represent some kind of equilibrium or set-point. The bipolar mode (n = 2) can create an elongated morphology typical for our cultured melanocytes, but other modes are possible. For example, the polar mode (n = 1) can superpose to the bipolar mode and result in an anisotropic dendrite length. In analogy to the two form parameters Θ and l the signal-to-noise ratio for n can be defined as
 |
The parameters of our theoretically derived density functions were estimated from the measured histograms f*2(Θ), f*2(l), and f*(n) by using a nonlinear least-square fitting algorithm (Levenberg-Marquardt iteration) with statistical weighting. The quality of this density estimation between the data from the cell cultures and the theoretically derived curves can be measured as χ2. The S/N ratio determines the specific shape of the Gaussian distribution. The ability of a Gaussian distribution to fit the actual data can be used as a measure for the appropriateness of the model because Gaussian distribution is the prediction of the model. This mathematical model can be used in general to describe stochastically influenced phenomena such as the phenotype of a cell, the resonance behavior of a laser (46), or the regulation of gene expression (3).
Fig 6.
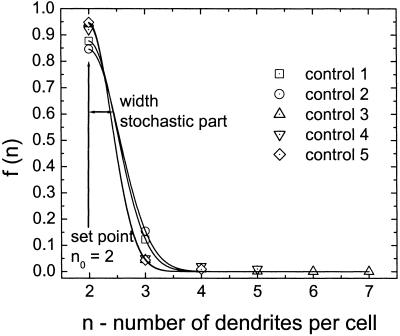
Density functions for the number of dendrites in control cultures. The data points represent the observed numbers of dendrites and the lines, the estimated density functions. All observed data could be fitted well by Eq. 5. The least-square fit gives the width of the distribution; the set point n0 = 2 is a fixed parameter determined by the observed maximum of the distribution. The set point and the width are identical in all samples, which leads to a mean signal-to-noise ratio of S/N = 4.47 for controls. Note: The model and the equations were derived from theoretical considerations and parameterized from the observed data.
Results
The Mathematical Model Can Describe the Morphology of Control Melanocytes.
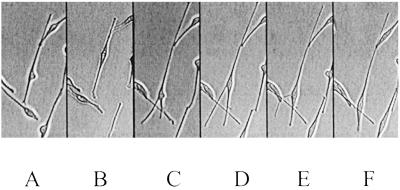
First, we investigated three morphological parameters of control melanocytes. At a given time, the individual cells vary in their angle between the dendrites, the dendrite length, and the number of dendrites. This is illustrated in Fig. 3. According to our experimental experience with these cells, we assume that this variation corresponds to the morphological variation of a single melanocyte observed over a period suggesting a (quasi) ergodic system. Therefore, we analyzed the morphology of melanocytes at one point in time by using automatic digital processing of microscopy images, and we tested whether the mathematical models can describe the morphology of control melanocytes. The morphological parameters investigated were the number of dendrites, n, the angle between two dendrites, Θ, and the length of the dendrites, l. The observed histograms, f*(n), f*2(Θ), and f*(l), were fitted by the theoretically derived density functions f(n), f2(Θ), and f(l).
Fig 3.
The morphology of cultured melanocytes varies with time. The cell in the given example was observed for a period of 258 min and changed its shape several times. Shown are 0 min (A), 30 min (B), 95 min (C), 165 min (D), 190 min (E), and 285 min (F). (×100.)
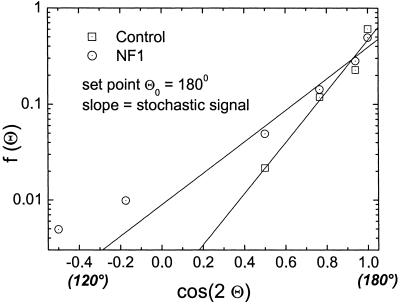
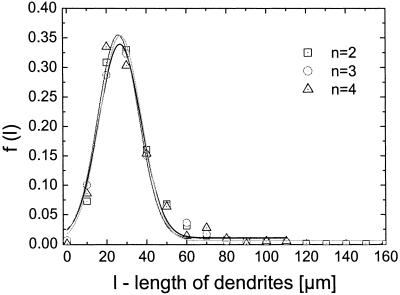
The angle between the dendrites and their length observed in melanocyte cultures of five controls are described by the density functions f2(Θ) and f(l) (Eqs. 6 and 7). The parameters of these functions were estimated from the experimentally derived density functions f*(Θ) and f*(l). The density function for Θ describes the experimental data [regression coefficient R > 0.97 (Fig. 4)]. It has its maximum at 180° representing the set point, Θ0 = 180°. The mean deviation between the set point and the actual angle as determined from the width of the density functions is 3.17 ± 0.19 when determined as S/N. The predicted Gaussian density function of the length of the dendrites per cell is estimated from f*(l) with χ2 ≤ 0.0002. However, a systematic deviation occurs representing an asymmetry with respect to the maximum. The maximum of the density function, l0, the set point of the automaton for the dendrite length, is 35.15 ± 2.72 with S/N = 2.6 ± 0.16. Interestingly, the density function f(l) does not depend on the number of dendrites (Fig. 5). The set point, l0 = 27 μm, and width of the density function, and therefore the signal-to-noise ratio, are the same for this control cell population regardless of the number of dendrites. These data demonstrate that this model of an automaton with a deterministic and a stochastic component of the signal is able to describe the observed morphological behavior in cultured control melanocytes.
Fig 4.
The density function for the angle Θ between dendrites for melanocytes with two dendrites. The data points represent the observed angle between the dendrites and the lines, the estimated density function in a logarithmic plot. All observed data could be fitted well by Eq. 6. Melanocytes of controls show a set point of 180°. In addition, NF1 melanocytes with two dendrites have the same set point, but reveal a broader density distribution indicating increased noise.
Fig 5.
Density functions of dendrite length, f(l), for one control cell population split with respect to the number of dendrites per cell. The observed data for the dendrite length were separated in three groups: cells with two dendrites (n = 2), cells with three dendrites (n = 3), and cells with four dendrites (n = 4). The density distributions of the dendrite length are identical for the three groups—i.e., that set point and stochastic part are independent from the number of dendrites per cell. This finding is a strong indication that the regulation of the dendrite length is independent of the regulation of the number of dendrites.
The number of dendrites observed in these melanocyte cultures is described by the Gaussian density function with χ2 ≤ 0.014 (Fig. 6). The maximum of the density function representing the set point is at n = 2 and the average S/N for the number of dendrites is 4.47 ± 0.27 (SEM).
Differences in Morphology Between Control and NF1 Melanocytes as Alteration of Set Point and Signal-to-Noise Ratio of the Self-Organized Automaton.
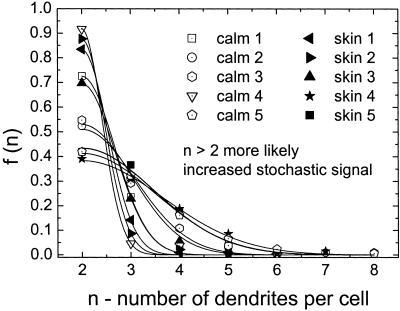
As a second step, we determined differences in morphology between control and NF1 melanocytes derived from normal skin (skin) or café-au-lait macules (calm) from five patients each. The formation of dendrite number for NF1 cells was described by the model with χ2 ≤ 0.012. The set point for the number of dendrites in NF1 melanocytes is the same as in controls (Fig. 7). In the majority of NF1 skin and NF1 calm cells, two dendrites per cell are observed, n0 = 2, maximum of the distribution. However, the distribution of the number of dendrites is broader, which represents more noise than in controls. In other words, the NF1 cells show a significantly increased variation of the number of dendrites (controls to NF1 cells Student's t test: P < 0.025). S/N of NF1 cells is 2.70 ± 0.63 (skin) and 2.59±0.6 (calm) compared with 4.47 ± 0.27 in controls. Concerning the set point and the S/N there is no significant difference between the two kinds of NF1 cells (P > 0.91). The density function for the angle Θ (Fig. 4) shows that NF1 melanocytes form two dendrites in opposing directions, set point Θ0 = 180°. Again, the NF1 cells show a broader distribution and the intrinsic noise is increased (NF1: S/N = 2.49 ± 0.13; controls: S/N = 3.17 ± 0.19, P < 0.024). In contrast, the length distribution observed in NF1 and control melanocytes does not differ significantly with respect to the signal-to-noise ratio (NF1: S/N = 2.09 ± 0.16; controls: 2.59 ± 0.16, P > 0.055) (Fig. 5). In this case, the set point is altered from 35.15 ± 6.1 μm for the control melanocytes to 24.65 ± 4.5 μm for the NF1 melanocytes (P < 0.004).
Fig 7.
The density functions for the number of dendrites of NF1 melanocytes. Data were observed from cells of five NF1 patients. The cells were taken either from normal skin (skin 1–5) or from café-au-lait macules (calm 1–5). As for the controls, the maximum of the density distribution and therefore the set point is the same for all NF1 samples (n0 = 2). However, the dendrite density distribution is broader compared with control melanocytes (Fig. 6), strongly indicating an increased noise term in our model. The resulting signal-to-noise ratio of NF1 cells (S/N ≈ 2.6) is ≈40% less compared with the controls (S/N ≈ 4.5).
Discussion
Almost all biological systems are subject to complicated external or internal influences that are not fully known and that are often termed noise or fluctuations. Our approach to the intracellular regulation of the cell shape-forming processes is a simple phenomenological one. It is based on chance and necessity, which leads to the given stochastic equations 1 and 3 (41, 46). This approach stands in contrast to a bottom-to-top model, which focuses on molecular details and intends to describe all of the molecular steps in a network to explain the cellular behavior (47). However, the details of the relevant signal transduction and intracellular regulation are mostly still unknown. This is also the case for regulations influenced by NF1 reduction. Our analysis provides some insight into the nature of the response mechanism to the neurofibromin reduction without knowing the molecular steps involved. We demonstrate that it is possible to quantify some basic features of melanocyte cell shape as an automaton. If the parameters of the corresponding equations are estimated from data measured in melanocyte cultures the equations fit very well. Concerning the length of dendrites, a systematic deviation was observed representing an asymmetry with respect to the maximum. We assume that this asymmetry is due to the use of white noise instead of colored noise. Use of a colored noise term can lead to an asymmetric distribution (48) but can be handled mathematically only with difficulty. Nevertheless, the model used describes the data. The equations derived here are composed of a deterministic part providing a set point and a stochastic part that accounts for the observed variation. If mean values of the examined shape parameters are compared between normal and NF1 melanocytes, only the deterministic part of the signal is observed and no difference is seen. The variation, however, is much higher in the haploinsufficient NF1 cells, and it manifests in the stochastic part of the equation and indicates more noise in the haploinsufficient cells. On the other hand, we found always the same dendrite length distribution independent of the number of dendrites per cell. This observation indicates that the regulation of dendrite length is independent of the regulation of the number of dendrites. This is an example how a phenomenological model can contribute to distinguishing different cellular processes.
We used a mathematical model to investigate cellular consequences of NF1 haploinsufficiency. Because one function of neurofibromin is the regulation of cytoskeleton (33), the effects of NF1 reduction may result in an altered morphology of cells that can easily be measured in single cells. On the one hand we found that NF1 haploinsufficiency is related to a deterministic alteration of the length of the dendrites—i.e., the set point is altered. On the other hand, it is related to an increase in the stochastic input concerning the angle of dendrites and their number, although the deterministic part of these two morphological parameters is not altered. Increased noise is predicted to be a consequence of haploid gene expression in a model of stochastic gene expression (13). The morphological effects observed here may directly be related to the increased noise in gene expression predicted for haploid genes. Alternatively, the observed morphological alterations may represent secondary biological effects predicted to occur when the variation of gene expression temporarily falls below a threshold of 10% of the normal amount of a gene product (13).
In the technical world the constructors intend to build machines without noise in the signal chain to get deterministic machine functions for a special purpose and situation. If the situation is altered the constructor has to build a new a machine. Interacting physical and chemical systems require a certain amount of noise to reach a state with optimal conditions (equilibrium). In biological systems the “machines,” having not only a deterministic signal but also a stochastic signal, have an advantage in survival by finding a way to react to altered situations by themselves (1). Two extreme cases can be considered: (i) Without noise (variation) a biological system cannot react to altered situations. (ii) A biological system that varies at random has lost its ability to perform any regular function. Obviously there exists an optimal signal-to-noise ratio for biological “machines.” An example for an optimal signal-to-noise ratio has been observed in migrating granulocytes (9, 37). Also, in movement of pedestrians at a crossing an optimal signal-to-noise ratio exists as simulated in a model (49). Back to melanocytes and NF1: If control melanocytes have an optimal signal-to-noise ratio in the respective system, this ratio could be altered by mutation as indicated by our data. Neural crest-derived cell precursors of melanocytes migrate during embryogenesis. This migration is mediated and directed by dendrite formation. We suggest that an optimal signal-to-noise ratio in dendrite formation is also important for correct migration during this time. NF1 haploinsufficiency alters the signal-to-noise ratio and, thus, influences dendrite formation, which may result in a disturbance of the migration of melanocyte precursors. One symptom found in NF1 patients, the formation of café-au-lait macules, can directly be related to anomalies of melanocyte precursor migration because these macules represent an unequal distribution of melanocytes. They are present at birth and become visible in the first year of life, and external noise has already been invoked to explain their origin (50). Small localized hyperpigmentations (freckles) are quite common in people with pale skin and red hair. They may be caused in a similar way as the café-au-lait macules in NF1 by the reduced activity of another gene relevant for melanocytes and, hence, by increased noise in a signal transduction chain. Variants of the melanocortin-1-receptor gene with a reduced gene activity were found in persons with this skin type (51). Increased noise may also explain the highly variable cell size of NF1 keratinocytes in vitro (33). Haploinsuffiency of many tumor-suppressor genes has various effects (52). These effects are not well understood but may be explained, at least in part, by increased noise introduced into signal transduction by haploinsuffiency of the tumor-suppressor gene.
Acknowledgments
The excellent technical assistance and practical help of Eva Winkler, Petra Kruse, and Ralf Mueller are gratefully acknowledged. Thanks are also due to Britta Bartelt and Sybille Rehmet for corrections of this manuscript.
Abbreviations
NF1, neurofibromatosis type 1
This paper was submitted directly (Track II) to the PNAS office.
References
- 1.McAdams H. H. & Arkin, A. (1999) Trends Genet. 15, 65-69. [DOI] [PubMed] [Google Scholar]
- 2.Bird A. P. (1995) Trends Genet. 11, 94-100. [DOI] [PubMed] [Google Scholar]
- 3.Paulsson J., Berg, O. G. & Ehrenberg, M. (2000) Proc. Natl. Acad. Sci. USA 97, 7148-7153. [DOI] [PMC free article] [PubMed] [Google Scholar]
- 4.Hasty J., Pradines, J., Dolnik, M. & Collins, J. J. (2000) Proc. Natl. Acad. Sci. USA 97, 2075-2080. [DOI] [PMC free article] [PubMed] [Google Scholar]
- 5.Gardner T. S. & Collins, J. J. (2000) Nature 405, 590-593.10850721 [Google Scholar]
- 6.Hasty J., McMillen, D., Isaacs, F. & Collins, J. J. (2001) Nat. Rev. Genet. 2, 268-279. [DOI] [PubMed] [Google Scholar]
- 7.Anderson J. S., Lampl, I., Deda, C., Gillespie, D. C. & Ferster, D. (2000) Science 290, 1968-1972. [DOI] [PubMed] [Google Scholar]
- 8.Kemkemer R., Neidlinger-Wilke, C., Claes, L. & Gruler, H. (1999) Cell. Biochem. Biophys. 30, 167-195. [DOI] [PubMed] [Google Scholar]
- 9.Gruler H. (1989) in The Neutrophil: Cellular Biochemistry and Physiology, ed. Hallett, M. B. (CRC, Boca Raton, FL), pp. 63–95.
- 10.Ko M. S. (1992) BioEssays 14, 341-346. [DOI] [PubMed] [Google Scholar]
- 11.Elliott J. I., Festenstein, R., Tolaini, M. & Kioussis, D. (1995) EMBO J. 14, 575-584. [DOI] [PMC free article] [PubMed] [Google Scholar]
- 12.McAdams H. H. & Arkin, A. (1997) Proc. Natl. Acad. Sci. USA 94, 814-819. [DOI] [PMC free article] [PubMed] [Google Scholar]
- 13.Cook D. L., Gerber, A. N. & Tapscott, S. J. (1998) Proc. Natl. Acad. Sci. USA 95, 15641-15646. [DOI] [PMC free article] [PubMed] [Google Scholar]
- 14.Knudson A. G. (2000) Annu. Rev. Genet. 34, 1-19. [DOI] [PubMed] [Google Scholar]
- 15.Cichowski K. & Jacks, T. (2001) Cell 104, 593-604. [DOI] [PubMed] [Google Scholar]
- 16.Hoffmeyer S., Assum, G., Kaufmann, D. & Krone, W. (1994) Nat. Genet. 6, 331. (lett.). [DOI] [PubMed] [Google Scholar]
- 17.Fahsold R., Hoffmeyer, S., Mischung, C., Gille, C., Ehlers, C., Kucukceylan, N., Abdel-Nour, M., Gewies, A., Peters, H., Kaufmann, D., et al. (2000) Am. J. Hum. Genet. 66, 790-818. [DOI] [PMC free article] [PubMed] [Google Scholar]
- 18.Sherman L. S., Atit, R., Rosenbaum, T., Cox, A. D. & Ratner, N. (2000) J. Biol. Chem. 275, 30740-30745. [DOI] [PMC free article] [PubMed] [Google Scholar]
- 19.Birnbaum R. A., O'Marcaigh, A., Wardak, Z., Zhang, Y. Y., Dranoff, G., Jacks, T., Clapp, D. W. & Shannon, K. M. (2000) Mol. Cell. 5, 189-195. [DOI] [PubMed] [Google Scholar]
- 20.Gutmann D. H. (2001) Hum. Mol. Genet. 10, 747-755. [DOI] [PubMed] [Google Scholar]
- 21.Bajenaru M. L., Donahoe, J., Corral, T., Reilly, K. M., Brophy, S., Pellicer, A. & Gutmann, D. H. (2001) Glia 33, 314-323. [DOI] [PubMed] [Google Scholar]
- 22.Frenk E. & Marazzi, A. (1984) J. Invest. Dermatol. 83, 23-25. [DOI] [PubMed] [Google Scholar]
- 23.Malhorta R. & Ratner, N. (1994) J. Invest. Dermatol. 102, 812-818. [DOI] [PubMed] [Google Scholar]
- 24.Griesser J., Kaufmann, D., Eisenbarth, I., Bauerle, C. & Krone, W. (1995) Biol. Chem. Hoppe-Seyler 376, 91-101. [DOI] [PubMed] [Google Scholar]
- 25.Eisenbarth I., Assum, G., Kaufmann, D. & Krone, W. (1997) Biochem. Biophys. Res. Commun. 237, 138-141. [DOI] [PubMed] [Google Scholar]
- 26.Kaufmann D., Bartelt, B., Hoffmeyer, S. & Mueller, R. (1999) Arch. Dermatol. Res. 291, 312-317. [DOI] [PubMed] [Google Scholar]
- 27.Ingram D. A., Yang, F. C., Travers, J. B, Wenning, M. J., Hiatt, K., New, S., Hood, A., Shannon, K., Williams, D. A. & Clapp, D. W. (2000) J. Exp. Med. 191, 181-188. [DOI] [PMC free article] [PubMed] [Google Scholar]
- 28.Gutman D. H. & Collins, F. S. (1993) Neuron 10, 335-343. [DOI] [PubMed] [Google Scholar]
- 29.Klose A., Ahmadian, M. R., Schuelke, M., Scheffzek, K., Hoffmeyer, S., Gewies, A., Schmitz, F., Kaufmann, D., Peters, H., Wittinghofer, A., et al. (1998) Hum. Mol. Genet. 7, 1261-1268. [DOI] [PubMed] [Google Scholar]
- 30.Kim H. A., Ling, B. & Ratner, N. (1997) Mol. Cell. Biol. 17, 862-872. [DOI] [PMC free article] [PubMed] [Google Scholar]
- 31.Xu H. & Gutman, D. H. (1997) Brain Res. 759, 149-152. [DOI] [PubMed] [Google Scholar]
- 32.The I., Hannigan, G. E., Cowley, G. S., Reginald, S., Zhong, Y., Gusella, J. F., Hariharan, I. K. & Bernards, A. (1997) Science 276, 791-794. [DOI] [PubMed] [Google Scholar]
- 33.Koivunen J., Yla-Outinen, H., Korkiamaki, T., Karvonen, S. L., Poyhonen, M., Laato, M., Karvonen, J., Peltonen, S. & Peltonen, J. (2000) J. Invest. Dermatol. 114, 473-479. [DOI] [PubMed] [Google Scholar]
- 34.Haken H., (1983) Synergetics: Nonequilibrium Phase Transitions and Self-Organization in Physics, Chemistry and Biology (Springer, Heidelberg), pp. 191–227.
- 35.Bultmann B. D. & Gruler, H. (1983) J. Cell Biol. 96, 1708-1716. [DOI] [PMC free article] [PubMed] [Google Scholar]
- 36.Gruler H. (1993) Blood Cells 19, 91-113. [PubMed] [Google Scholar]
- 37.Schienbein M., Franke, K. & Gruler, H. (1994) Phys. Rev. E 49, 5462-5471. [DOI] [PubMed] [Google Scholar]
- 38.Gruler H. & Nuccitelli, R. (2000) Cell. Biochem. Biophys. 33, 33-51. [DOI] [PubMed] [Google Scholar]
- 39.Kemkemer R., Kling, D., Kaufmann, D. & Gruler, H. (2000) Eur. Phys. J. E 1, 215-225. [Google Scholar]
- 40.Kemkemer R., Teichgraber, V., Schrank-Kaufmann, S., Kaufmann, D. & Gruler, H. (2000) Eur. Phys. J. E 3, 101-110. [Google Scholar]
- 41.Risken H., (1984) Fokker-Planck Equation (Springer, Heidelberg), pp. 1–110.
- 42.Turing A. (1952) Philos. Trans. R. Soc. London B 237, 37-72. [Google Scholar]
- 43.Gierer A. & Meinhardt, H. (1972) Kybernetik 12, 30-39. [DOI] [PubMed] [Google Scholar]
- 44.Meinhardt H. (1999) J. Cell Sci. 112, 2867-2874. [DOI] [PubMed] [Google Scholar]
- 45.Gruler H. (1998) Liquid Crystals 24, 49-66. [Google Scholar]
- 46.Haken H., (1983) Synergetics: Nonequilibrium Phase Transitions and Self-Organization in Physics, Chemistry and Biology (Springer, Heidelberg), pp. 147–186.
- 47.Endy D. & Brent, R. (2001) Nature 409, 391-395. [DOI] [PubMed] [Google Scholar]
- 48.Shenderov A. D. & Sheetz, M. P. (1997) Biophys. J. 72, 2382-2389. [DOI] [PMC free article] [PubMed] [Google Scholar]
- 49.Helbing D. & Vicsek, T. (1999) New J. Phys. 1, 13.1-13.17. [Google Scholar]
- 50.Kestler H. A. & Haschka, M. (1999) J. Invest. Dermatol. 113, 858-859. [DOI] [PubMed] [Google Scholar]
- 51.Bastiaens M., ter Huurne, J., Gruis, N., Bergman, W., Westendorp, R., Vermeer, B. J. & Bouwes Bavinck, J. N. (2001) Hum. Mol. Genet. 10, 1701-1708. [DOI] [PubMed] [Google Scholar]
- 52.Largaespada D. A. (2001) J. Exp. Med. 193, 521-529. [DOI] [PMC free article] [PubMed] [Google Scholar]


