Abstract
DNA cyclization is potentially the most powerful approach for systematic quantitation of sequence-dependent DNA bending and flexibility. We extend the statistical mechanics of the homogeneous DNA circle to a model that considers discrete basepairs, thus allowing for inhomogeneity, and apply the model to analysis of DNA cyclization. The theory starts from an iterative search for the minimum energy configuration of circular DNA. Thermodynamic quantities such as the J factor, which is essentially the ratio of the partition functions of circular and linear forms, are evaluated by integrating the thermal fluctuations around the configuration under harmonic approximation. Accurate analytic expressions are obtained for equilibrium configurations of homogeneous circular DNA with and without bending anisotropy. J factors for both homogeneous and inhomogeneous DNA are evaluated. Effects of curvature, helical repeat, and bending and torsional flexibility in DNA cyclization are analyzed in detail, revealing that DNA cyclization can detect as little as one degree of curvature and a few percent change in flexibility. J factors calculated by our new approach are well consistent with Monte Carlo simulations, whereas the new theory has much greater efficiency in computations. Simulation of experimental results has been demonstrated.
INTRODUCTION
Many experiments have demonstrated that DNA exhibits sequence-dependent curvature (Hagerman, 1990). The well-characterized motifs include A-tracts (Crothers et al., 1990), the GGGCCC motif (Brukner et al., 1993), and a nucleosome positioning sequence TATAAACGCC (Roychoudhury et al., 2000). In addition, DNA bending and torsional flexibility may also be sequence-dependent (Hogan et al., 1983; Hagerman, 1988). These sequence-dependent features can be well sensed by DNA binding proteins, with biological significances that have been widely noted (Vandervliet and Verrijzer, 1993; Dickerson and Chiu, 1997). One prominent example is a pre-bent TATA box, which can vary the TBP association constant up to 300-fold (Parvin et al., 1995). This characteristic of protein–DNA interplay may provide a new dimension for the identification of gene organization, because certain DNA tertiary structural and flexibility information may have been encoded into DNA sequences during evolution (Pedersen et al., 2000).
A variety of experimental approaches have been developed to investigate DNA bending and flexibility, including comparative gel electrophoresis, crystallography, electron microscopy, and DNA cyclization (Bloomfield et al., 2000). Among these methods, DNA cyclization (Shore et al., 1981; Shore and Baldwin, 1983; Crothers et al., 1992; Roychoudhury et al., 2000) distinguishes itself by its complete theoretical guidance, lack of artifacts due to the perturbations of crystal packing forces (Digabriele et al., 1989), or gel matrix (Sitlani and Crothers, 1996), and especially high sensitivity (Crothers et al., 1992). These aspects make DNA cyclization an outstanding approach to quantify DNA bending and flexibility. In this method, DNA constructs from one hundred to several hundred basepairs with cohesive ends are tested for their circularization rates catalyzed by DNA ligase. The J factors, which are defined as the ratios of equilibrium constants for ligatable unimolecular and bimolecular forms with cohesive ends hybridized, are measured from their ligation rates under certain conditions. The J factor is an important concept with significant physical meaning and broad applications initially defined by Jacobson and Stockmayer (1950). In DNA cyclization, it is the equivalent concentration of free DNA end that matches the concentration of one end at the other in a ligatable form. Once a set of J factors is obtained experimentally, intrinsic curvature and flexibility parameters are inferred by computer modeling of the cyclization process (Roychoudhury et al., 2000). The current Monte Carlo-based approach has long been the only way to treat inhomogeneity in the model (Levene and Crothers, 1986). However, it is not uncommon for data interpretation to take several months because of the lengthy simulation and multidimensional search for the best parameter set. With the advent of a high throughput approach for the cyclization experiments (Y.L. Zhang and D.M. Crothers, in preparation), the time-consuming modeling procedure will become a rate-limiting step. It is the main aim of this work to present an efficient way to deal with this problem.
Several analytical and numerical theories have emerged for calculating the mechanical equilibrium shapes of DNA circles or loops based on continuous elastic models (Benham, 1977; Hao and Olson, 1989; Bauer et al., 1993; Balaeff et al., 1999). For example, Yang et al. (1993) applied the finite-element approach widely used in mechanical engineering to investigate DNA supercoiling, and later investigated effects of large-scale intrinsic curvature on DNA shape transitions (Yang et al., 1995). All these theories are equivalent to finding DNA configurations with minimum energies. However, as a thermodynamic system, DNA molecules can occupy a variety of configurations with different energies, determined by the Boltzmann distribution. In addition, the continuous models neglect any local irregularities in basepair level properties. It has been shown that sharp DNA bending, or kinking, is a general model of DNA curvature induced by protein binding (Luger et al., 1997), which excludes applications of the continuous model in this interesting field. Recently an effort has been made to map an inhomogeneous discrete model to a continuous one, but sophisticated smoothing must be employed to filter some local irregularities (Manning et al., 1996). To treat DNA cyclization, a statistical mechanical description of the DNA molecule at a basepair level is more appropriate. Monte Carlo simulations have been widely developed as generic methods for this aim (Hagerman, 1985; Levene and Crothers, 1986). Analytic statistical mechanical investigations are also available for continuous models (Shimada and Yamakawa, 1984; Marko and Siggia, 1994, 1995). But they are generally limited to the homogenous cases where the equilibrium configurations are apparent.
We extend the current statistical mechanical description of circular DNA to a basepair-level model capable of dealing with any sequence-dependent inhomogeneity in bending and flexibility and apply it to the calculation of DNA cyclization. The new approach is mainly applicable to small DNA circles. It involves an iterative search for the minimum energy configuration of circular DNA and subsequent evaluations of the thermodynamic quantities under harmonic approximation. It is validated by comparison with the Monte Carlo simulations for small DNA molecules. An accurate formula for the DNA circular configuration containing bending anisotropy is found. Theoretical investigations into DNA cyclization show that it is capable of detecting curvature as small as approximately one degree and a flexibility change as low as several percent. Application of the new theory is demonstrated for interpreting cyclization data.
THE MODEL AND THEORY
In our DNA model, each basepair is viewed as a rigid body. Its center and orientation is described by a vector r(i) and an attached local Cartesian coordinate (d1(i), d2(i), d3(i)), respectively (Manning et al., 1996), where the unit vector d1(i) is defined to direct to the major groove and d3(i) to the center of the next basepair, with superscript i = 0, … , N − 1 the basepair numbering. The orientation of basepair i + 1 relative to i is described by three angular variables called tilt, roll, and twist, which are the successive rotations along d1(i), d2(i), and d3(i), respectively, in accordance with the Cambridge Convention (Dickerson, 1989; Bloomfield, 2000). Relative sliding or shifting between basepairs is not allowed in this model. Let xi denote any of these variables among the total of 3(N − 1); the Hamiltonian (Levene and Crothers, 1986) of free DNA molecule can be expressed as:
 |
(1) |
where {x0,i, i = 1, … ,3N − 3} specifies the static configuration of DNA and {αi, i = 1, … ,3N − 3} the rigidity parameters defined on dinucleotide steps, and β ≡ 1/(kBT) is the Boltzmann factor. In the homogeneous case, the rigidity parameter is related to the elastic force constant K by α = K/(2lkBT) where l is the helical rise of DNA basepair and persistence length P by α = P/2 if l is chosen as length unit and radian as angle unit in Eq. 1. It also correlates with average bending or twisting fluctuation σ by α = 1/(2σ2) (Bloomfield et al., 2000). The possible cross terms representing the coupling among tilt, roll, and twist are not considered. Under harmonic approximations for dinucleotide interactions, it seems unreasonable not to incorporate these terms. However, the statistical investigation for DNA crystal structures reveals that the force constants of cross terms for all 10 dinucleotide steps are generally much less than the corresponding diagonal terms (Olson et al., 1998). If the cross terms are of interest in some circumstances, the Hamiltonian incorporating all cross terms can always be converted to the diagonal form in Eq. 1 by redefining the three rotation axes for 10 nondegenerate dinucleotide steps through orthogonal transformations.
According to the definition of J factor,
 |
(2) |
where Zc is the partition function for a subset of DNA molecules with closed configurations, Z refers to molecules lacking the cyclization constraint. The coefficient comes from the fact that only a fraction 1/(4π) × 1/(2π) of free molecules align with a molecule of fixed orientation, where 1/(4π) is the probability density of aligning the helical axes and 1/(2π) the conditional probability density of registering torsional alignment given the two helical axes in parallel. The difficulty of evaluating J comes from Zc, inasmuch as Z is rigorously solvable, i.e.,
 |
(3) |
Here extensions of integration limits from ±π/2 or ±π (Gonzalez and Maddocks, 2001) to infinity have been utilized due to small fluctuations compared to the limits. It can be shown that quantum effect is negligible in our model.
Suppose the ring closure conditions can be mathematically described by a set of constraints, i.e.,
 |
(4) |
where m = 6 is the total number of constraints for a circularized molecule, including three for translations and three for orientations in aligning two rigid bodies (the first and the last basepairs); then Zc can be written as:
 |
(5) |
 |
The constraints are highly nonlinear equations, which makes exact evaluation of the integral impossible. In the following we give an approximate calculation for small DNA circles of interest in DNA cyclization by taking advantage of their small fluctuations around the minimum elastic energy configurations, inasmuch as it is energy that dominates in this case. Therefore one should first compute the minimum energy configuration of DNA circle. Once it is found, the small fluctuations around it can be integrated by a harmonic approximation. The validity of the approximation is tested independently by Monte Carlo simulations.
To find the minimum energy configuration of a circular DNA seems not to be easier than the whole problem, because it is related to the optimizations of a large number of parameters. The simulated annealing (Hao and Olson, 1989) and methods from mechanical engineering (Bauer et al., 1993; Yang et al., 1993) were used to compute the shapes of DNA circles based on continuum models. For these models, a variety of discretizations were the first steps toward numerical computations. Since our model is directly defined in terms of discrete parameters with obvious biological meanings, a new approach will be provided to calculate the circular DNA configuration with minimum energy. The problem is equivalent to finding the minimum of the energy function in Eq. 1 subject to the constraints in Eq. 4. Thus we define a Lagrange function
 |
(6) |
where λj, j = 1, … ,m are Lagrange multipliers. Equate the partial derivatives of L over both xi, i = 1, … ,3N − 3 and λj, j = 1, … ,m to zeros, leading to
 |
(7) |
where
 |
(8) |
 |
The circular configuration with minimum energy, or mechanical equilibrium configuration, must be a solution of the above system equation. To solve it, we construct an iterative process. Suppose our current DNA configuration is {xi, i = 1, … ,3N − 3} and after one step of updating it becomes {xi′, i = 1, … ,3N − 3}. To establish the rule of the updating, we first linearize the constraint functions in Eq. 7 by Taylor expansion, i.e.,
 |
(9) |
where
 |
(10) |
Then we rewrite the first equation in Eq. 7 as follows
 |
(11) |
Substituting Eqs. 9 and 11 into the second equation in Eq. 7 after replacing {xi, i = 1, … ,3N − 3} with {xi′, i = 1, … ,3N − 3} and solving for λj, j = 1, … ,m, we get
 |
(12) |
where
 |
(13) |
and
 |
(14) |
 |
We further define the following matrices and vectors before giving the formula for the configuration updating in the iterative process, i.e.,
 |
(15) |
 |
 |
 |
 |
 |
 |
Here δij = 1 if i = j and δij = 0 if i ≠ j. Eliminating λj, j =1, … ,m in Eq. 11 with Eq. 12 and using the above definitions, we finally obtain
 |
(16) |
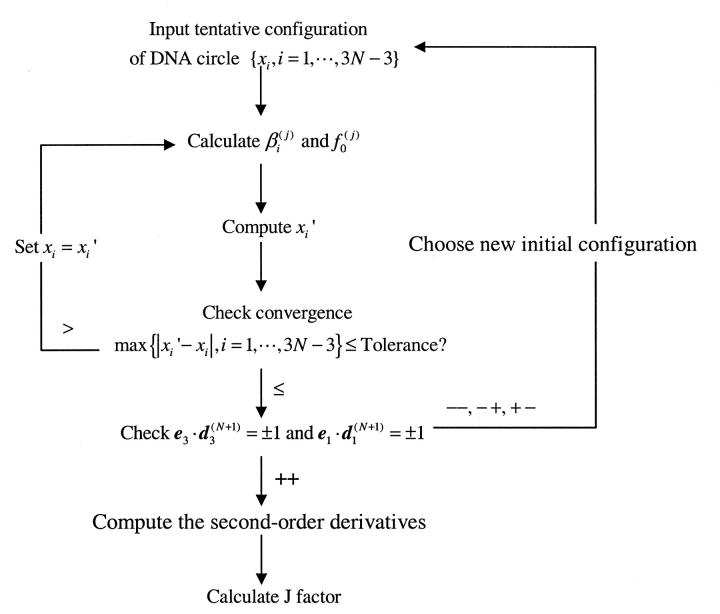
To start the iteration, an arbitrary configuration close to a circle, which is not necessarily closed, is chosen. Given a configuration, both βi(j) and f0(j) can be numerically calculated by multiplications of the transformation matrices, as shown in the Appendix. The updating according to the above equation is repeated until a convergence, or Δ′ = Δ, is reached under certain criteria if the convergence does exist. This converged configuration exactly satisfies all the constraints for circularized DNA, as seen from Eqs. 7, 9, and 10. Therefore, for mechanical equilibrium configuration, designated as {xc,i, i = 1, … ,3N − 3} with {λc,j, j = 1, … , m} for the corresponding Lagrange multipliers calculated from Eq. 12,
 |
(17) |
and
 |
(18) |
We now return to the calculation of the partition function Zc in Eq. 5. Using a Fourier transformation of the δ(x) function, i.e.,
 |
(19) |
we can rewrite Zc as
 |
(20) |
where
 |
(21) |
with I the unit imaginary number. This function is exactly the same as the Lagrange in Eq. 6 if
 |
(22) |
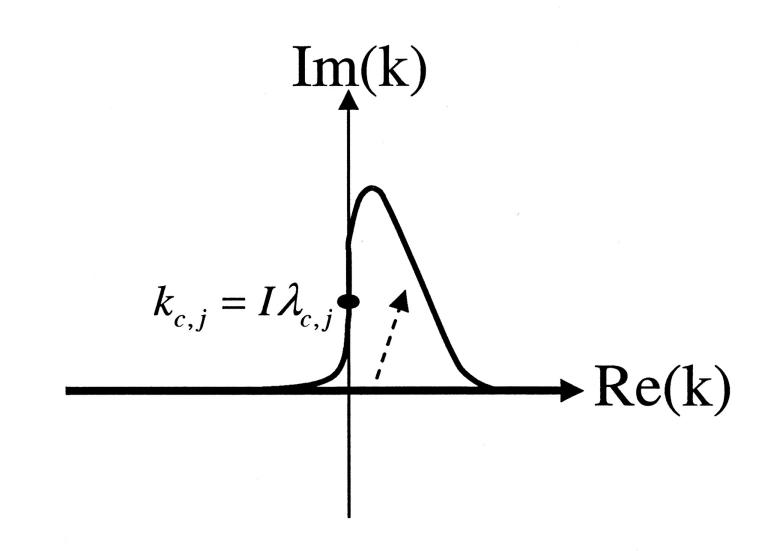
which suggests extensions of the variables kj, j = 1, … , m from real axes to the whole complex planes and changes of the integral paths from the real axes to the paths shown in Fig. 1, parts of which are in the imaginary axes. This transformation is well known as Wick rotation in quantum or statistical field theory (Wick, 1954). The relationship shown in Eq. 22 and comparison of the functions L and L′ indicate that the maximum contribution of the integral in Eq. 20 is around a point on the imaginary axis at
 |
(23) |
and for x variables at
 |
(24) |
Then saddle-point approximation (Bender and Orszag, 1978) can be used to calculate the integral through a harmonic approximation. To proceed, change variables as follows:
 |
(25) |
Then we can extend the Taylor expansions of the constraints to quadratic terms around the mechanical equilibrium configuration, i.e.,
 |
(26) |
where
 |
(27) |
 |
Here Eqs. 18 and 25 have been used. Substitute Eqs. 25 and 26 into Eq. 21 and neglect cubic terms, yielding
 |
(28) |
where
 |
(29) |
and
 |
(30) |
is the mechanical elastic energy of circular DNA. Here Eq. 23 and the first equation of Eq. 7 has been used. If we define
 |
(31) |
and
 |
(32) |
we can rewrite Eq. 28 in a quadratic form, i.e.,
 |
(33) |
FIGURE 1.
Diagram illustrating the complex extension of k and change of the integration path from real axis to the indicated curve that goes through part of the imaginary axis at the saddle point kc,j = Iλc,j.
Integration for an exponential of a quadratic form over −∞, +∞ can be exactly calculated (see Appendix). Substituting Eq. 33 into Eq. 20 and performing the integral, we obtain
 |
(34) |
To facilitate the numerical computation, the determinant of the (3N − 3 + m) × (3N − 3 + m) matrix M can be factorized, as shown in the Appendix.
The following formulas are directly used for numerical computations in the forthcoming sections
 |
(35) |
 |
(36) |
 |
(37) |
 |
(38) |
Here
 |
(39) |
 |
(40) |
and
 |
(41) |
Derivations of Eqs. 35–38 are shown in the Appendix.
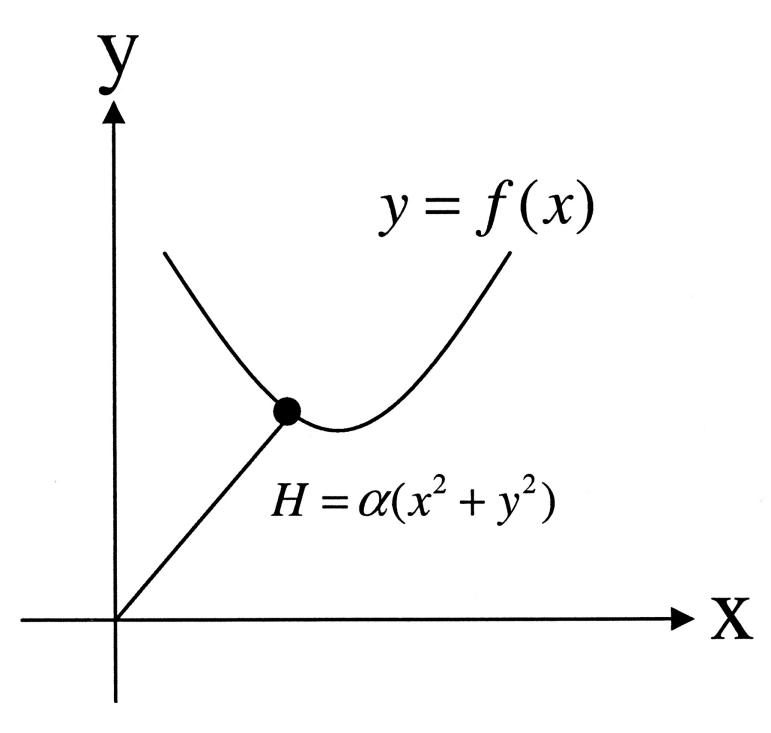
The main characteristics of our system are a free harmonic Hamiltonian and a set of nonlinear constraints. To better understand our above mathematic treatments, including the incorporation of constraints by Fourier transformations, expansion of the constraints, and saddle-point approximation, we construct a simplified model shown in Fig. 2, which contains the two characteristics of our real systems but much less degrees of freedom. In this model, the movement of a point mass connected to the origin by a spring is limited to the indicated curve in the x–y plane. Its partition function can be calculated with above procedures, as well as an alternative approach specifically for this simplified model. In this approach, the Hamiltonian is first expressed with only x variable, eliminating y with the constraints, and then expanded to quadratic terms according to the fluctuation around its minimum point. The partition function can be calculated with this approximated Hamiltonian, giving a same J factor as that from the former approach. Since the approximated Hamiltonian belongs to a harmonic oscillator in terms of its general coordinate, we call a series of approximations in our new theory for DNA circle harmonic approximation as a whole, HA.
FIGURE 2.
A simplified model containing the two main characteristics of our cyclization model: a free harmonic Hamiltonian and a nonlinear constraint. This model can be used to test our harmonic approximation. If the force constant of the spring is large, the movement of the point mass is limited to the vicinity of the minimum energy point. Thus the nonlinear function can be accurately replaced by its Taylor expansion up to first or second order at the point.
Numerical implementations and convergence
Suppose three angles (θ,φ,τ) represent the tilt, roll, and twist, respectively, between basepairs i + 1 and i, any vector in local coordinate i + 1 is related to its expression in frame i by a multiplication of the following orthogonal matrix (Manning et al., 1996):
 |
(42) |
To remove the degrees of freedom of global rotation that are not relevant to DNA shape, the first basepair is fixed and an external coordinate (e1, e2, e3) is set identical to (d1(1), d2(1), d3(1)). In this coordinate,
 |
(43) |
and
 |
(44) |
Here we have added a virtual basepair N + 1 to the end whose overlap with the first basepair represents a closed DNA configuration; and the vectors e1 = (1, 0, 0)T, e2 = (0, 1, 0)T, and e3 = (0, 0, 1)T. A length unit of helical rise per basepair has been assumed in Eq. 44.
Several different sets of independent constraints are available to generate a closed DNA configuration. Choices must be made to avoid those with all zero first derivatives. A convenient set of the constraints used in all following studies is
 |
(45) |
 |
The first vector equation is the end-to-end distance constraint, which is equivalent to three independent constraints corresponding to its x, y, and z components. The second and third generate a smooth helical axis by zeroing projections of the helical axis direction at the end point to the two perpendicular directions of the axis at start point. The fourth one is to align two torsional directions. Since this set cannot distinguish the cases where e3 · d3(N+1) = ±1 and e1 · d1(N+1) = ±1, as well as the global parameter linking number, the initial configuration must be chosen so that the iterations lead to a circle with the positive signs, instead of a loop or a circle out of torsion phase, and specified linking number, as shown in Fig. 3. The seemingly simpler orientation constraints e3 · d3(N+1) −1 = 0 and e1 · d1(N+1) − 1 = 0 partly avoid the above ambiguities. However, it can be shown that their first derivatives for angular variables all vanish for any circular DNA configurations, which leads to a singular B matrix defined in Eq. 14 and nonexistence of its inverse.
FIGURE 3.
Diagram showing the iterative procedure to calculate the equilibrium configuration and J factor. See the text in following section for the choices of constraints.
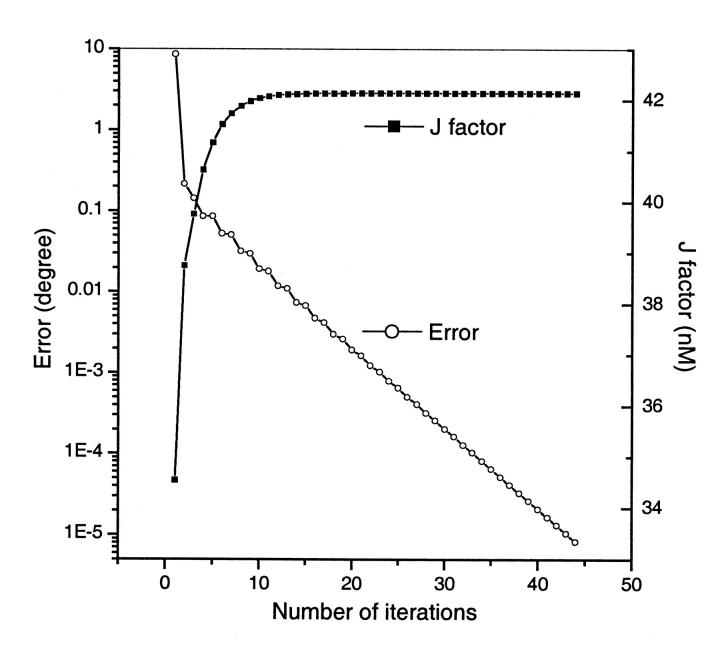
Our numerical computations with the above algorithm reveal that the solution to Eq. 7 can be readily achieved with a nearly exponential decay process in most cases. Consequently, each calculation of the equilibrium configuration usually takes less than 100 ms on a 1-GHz Pentium III processor even for highly inhomogeneous sequences. As an example, the circular equilibrium configuration for a typical DNA construct used in cyclization is calculated. The 156-bp DNA molecule contains a 60-bp phased A-tract portion that contributes a 108° curvature (Koo et al., 1990). The other part of the molecule is assumed to be straight with generic B-DNA characters. Its intrinsic shape is shown in Fig. 4 (top). Note that according to the A-tract model (Koo et al., 1986; 1990), the molecule is slightly out of plane, because the six A-tracts in our constructs are phased in 10.5 bp, instead of 10.33 bp for the maximal curvature of A-tracts (Drak and Crothers, 1991). One of the initial tentative configurations is shown in Fig. 4 (bottom) and its evolution to the mechanical equilibrium configuration during the iteration according to Eq. 16 is exhibited in Fig. 5, as monitored by successive angular differences and intermediate J factors. The obvious exponential decay of configuration to equilibrium can be explained by Eq. 17 when Eq. 18 is satisfied in the late phase of the iteration process. If DNA curvature enables two or several well-separated local energy minima for a circle (Katritch and Vologodskii, 1997), the corresponding configurations should be chosen for the evaluations of J factors with the above procedures. Their sum gives the J factor for the construct. However, this situation has not been met throughout this study, probably due to mainly planar DNA molecules considered here. A single equilibrium configuration is obtained from different initial configurations once its linking number is specified.
FIGURE 4.
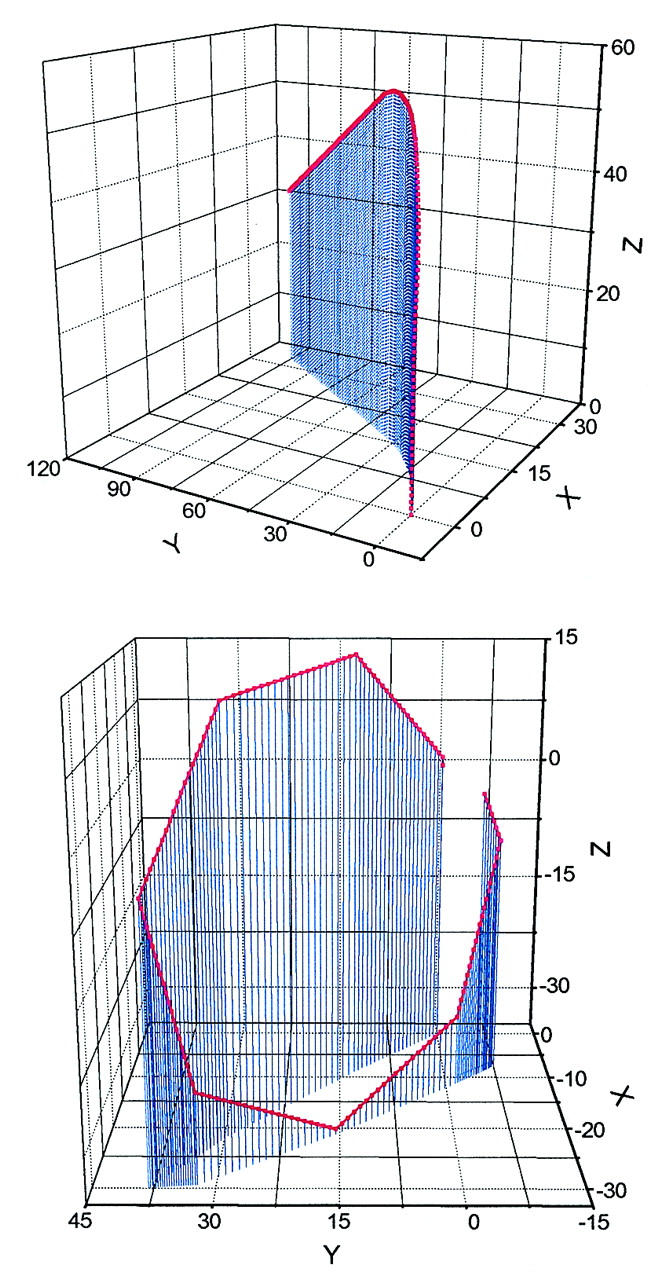
(Top) The intrinsic DNA helical path of a 156-bp construct containing straight B-DNA as test sequence used for DNA cyclization with its projection on the x–y plane (see the following section for details). In this calculation, parameters for the B-DNA part are chosen as follows: intrinsic twist angle, 34.45° and intrinsic tilt and roll angles, all zeros. Parameters for A-tract curvature are from Koo et al. (1990) and all length units in helical rise (3.4 Å) or basepair (bp). (Bottom) The starting configuration in the search for the equilibrium configuration by the iterative process. It is generated by putting 48.46° tilt kinks at every 21 basepairs based on its intrinsic shape shown in the top.
FIGURE 5.
Changes of the maximal absolute differences in bending or twisting angles between two successive iteration steps and evolution of the J factor calculated from intermediate configurations with only the first derivative of the constraints incorporated. The initial configuration for this calculation is shown in Fig. 4 (bottom). The flexibility is bending fluctuation σb = 4.842° (P = 140 bp) and twist fluctuation σtwist = 4.388° for both generic B-DNA and A-tracts.
The intermediate J factor is calculated with the following formula in which only the first-order derivatives of the constraints are involved, i.e.,
 |
(46) |
The subsequent calculation of the complete J factor involves the computations of the determinant and inverse of a matrix (A), which is much more time-consuming due to its large dimension (∼500 × 500 for cyclization constructs), extending the CPU time of each J factor computation to 6–7 s. It must be noted that, whereas we have chosen the length unit as the helical rise per basepair in Eq. 44, the unit for the J factor in Eq. 35 is 1 molecule/l3, which has to be multiplied by a factor of 4.226 × 10¹⁰ to convert to nM. Approaches to compute the first- and second-order derivatives of those constraints are presented in the Appendix. Subroutines for the matrix inversion, determinant computation, and following nonlinear optimization based on Levenberg-Marquardt algorithm, are from the scientific computation software IMSL, which is commercially available (Lahey Computer Systems, Nevada). Programs in Fortran 90 are available from our website (http://bass.chem.yale.edu/labdocs/).
RESULTS
Configurations of circular DNA with curvature
Fig. 6 shows the equilibrium configurations of the two topoisomers for a DNA construct containing three repeats of a 10-bp nucleosome positioning sequence (TATAAACG-CC) that was shown recently to have a 13° global bending (Roychoudhury et al., 2000). It is evident that curvature can have significant effects on the equilibrium configurations. It must be pointed out that the observation of two topoisomers only happens for the constructs with two ends almost completely out of torsional phase. In this case, the J factors for the two possible topoisomers are calculated and summed. Practically, for the DNA constructs with total lengths from 150 bp to 168 bp, this principle is implemented by checking q ≡ Ht − NINT(Ht) where Ht is the intrinsic helical repeat of linear DNA and NINT(Ht) the nearest integer of Ht. If 0.45 ≤ |q| ≤ 0.5, then the two topoisomers bearing linking numbers closest to Ht are considered; otherwise the single circle with a linking number NINT(Ht) is calculated.
FIGURE 6.
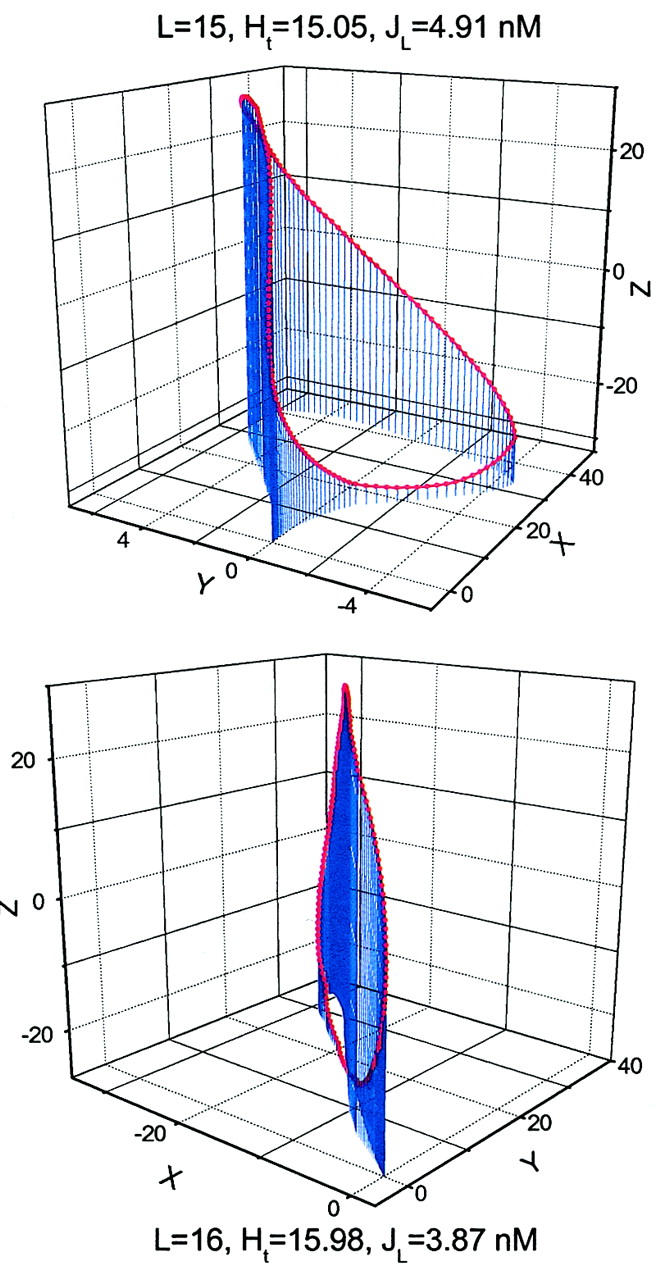
The calculated equilibrium configurations of two topoisomers for the 162-bp DNA construct containing three repeats of the 10-bp nucleosome positioning sequences. The same DNA parameters as those in Table 3 in Roychoudhury et al. (2000) are used. The linking numbers (15 and 16), total helical turns (Ht) of circular DNA, and J factors are indicated, respectively.
Sensitivities of DNA cyclization for the measurements of DNA bending and flexibility
A standard protocol has been developed to measure the DNA bending and flexibility by cyclization (Crothers et al., 1992; Kahn and Crothers, 1992; Kahn et al., 1994; Sitlani and Crothers, 1996; Roychoudhury et al., 2000). The DNA constructs contain a segment of 60-bp phased A-tracts and a small piece of DNA of interest, i.e., a test sequence. The remaining DNA is assumed to be straight, with normal B-DNA character. Two strategies have been used to acquire the global structural information of the test sequence. In the phasing assay, the phasing between the A-tract portion and the test sequence is varied by changing intermediate DNA length while keeping the total DNA length fixed. This assay is most sensitive to curvature and bending flexibility. In the total length assay, the total DNA length is varied from 150 bp to 170 bp, with the phasing unchanged. This assay is primarily affected by the bending flexibility, helical repeat, and torsional modulus. To amplify the geometric and mechanical effects, two to three repeats of the sequence motifs of interest are often put in phase as the test sequence.
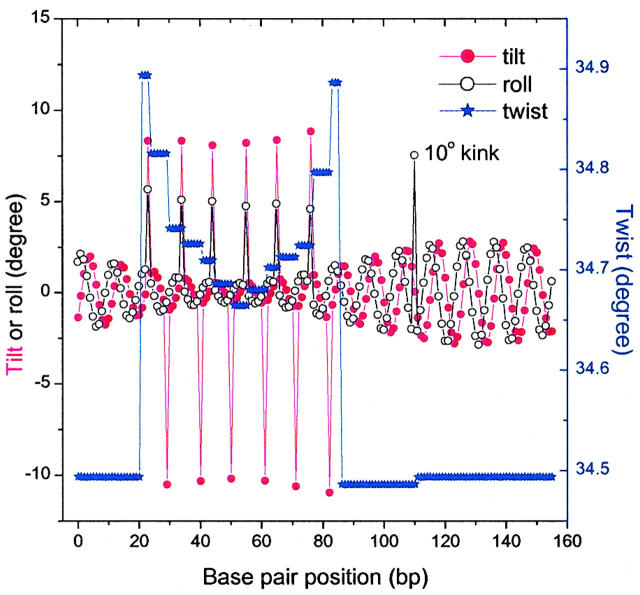
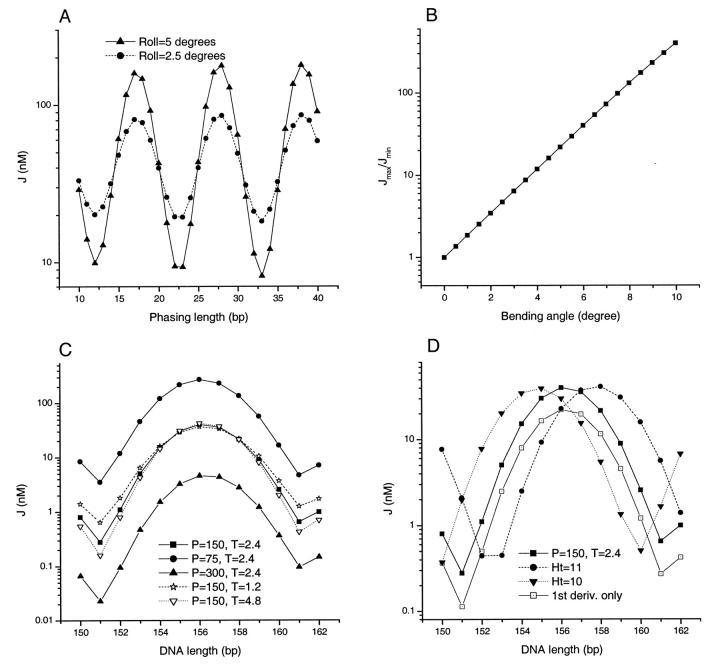
We first investigate how an intrinsic kink in the middle of a 30-bp test sequence affects the equilibrium bending. The equilibrium angles of a circularized 156-bp DNA construct with a 10° kink (roll) are shown in Fig. 7. One of the main characteristics of the bending profiles is that the bending of the basepairs decreases near in-phase kinks, which explains the smaller bending for the A-tract regions, except for the kinks used in modeling the A-tract curvature. As a consequence, the amplitude of the bending increases when the basepair becomes far away from the center of the A-tract portion. The coupling between bending and twisting renders discontinuous changes of the twist angles, which was also observed in an elastic rod model (Bauer et al., 1993). The 10° intrinsic roll is reduced inasmuch as its intrinsic bending direction is completely out of phase with the global curvature of the A-tracts, which is evident in Fig. 8 A. In this figure, the variation of the J factor vs. the phasing length is shown. For the calculations in this figure as well as in Fig. 8 B, the test sequence is supposed to contain three repeats of 10-bp sequences with the kinks indicated in the middle of each sequence motif. The periodic dependence of the J factor on the phasing length is consistent with the helical structure of DNA. The first peak is slightly smaller than other two because its position is closer to the A-tract portion and in a region with smaller bending amplitude, as shown in Fig. 7.
FIGURE 7.
The mechanical equilibrium angles for a 156-bp circularized DNA molecule with a 12-bp phasing length between the A-tract portion and a 30-bp test sequence. The test sequence has the B-DNA characters, i.e., zero roll and tilt, 4.68° bending flexibility, 34.45° twist, and 4.338° twisting flexibility, except for a 10-degree kink in the middle. The A-tracts have 4.842° bending flexibility and the same twisting flexibility.
FIGURE 8.
(A) Variation of J factor as a function of phasing length. (B) An exponential dependence of the ratio Jmax/Jmin upon curvature. The curvature given in both (A) and (B) is the bending magnitude of each of three 10-bp test sequence motifs composing the whole test sequence, as is often used in cyclization experiments. (C) Effects of DNA flexibility in the total length assay. The unit for persistence length P is bp and the unit for twisting flexibility T is 10−19 erg × cm. (D) Change of helical repeat. The reference curve labeled by P = 150, T = 2.4 is the same as that in (C) with a helical repeat of 10.45 (or 34.45° twist). Note that in (C) and (D) the flexibility and helical repeat changes are only done for the 30-bp straight test sequence. Parameters not indicated are the same as those in Fig. 7 except the 10° roll.
To check the sensitivity of cyclization for measuring curvature, the ratio of the maximal J factor to the minimal one for the phasing lengths from 10 to 42 bp is plotted in Fig. 8 B with intrinsic bending angle up to 10° for each of the three kinks. We found that an almost exponential relationship is observed in this region. This feature demonstrates the sensitivity advantage of DNA cyclization over the other methods for the same aim, such as comparative gel electrophoresis and transient electric dichroism, in which the observable quantities have essentially linear dependences on the curvature. Supposing that the relative error of the J factor can be determined within 40%, it is estimated from the theory that the smallest observable curvature by the phasing assay is ∼1.2°. Such a small angle in principle can occur in any so-called generic B-DNA sequence. Our experimental experience also shows that it seems to be more difficult to find a piece of satisfactorily straight DNA than a curved one under the scrutiny of DNA cyclization.
Fig. 8, C and D show how the J factors change with different parameters in the total length assay from theoretical simulations. In Fig. 8 C the persistence length or torsional modulus of a straight test sequence is doubled or halved from reference values of 150 bp for persistence length and 2.4 × 10⁻¹⁹ erg × cm for torsional modulus, respectively. Changes in bending flexibility cause a nearly global upward or downward shift (six- to ninefold in this case) of J factors in their logarithm scales. However, variations in twisting flexibility exhibit different profiles. Large changes (1.8- to 2.3-fold) in J factors are only prominent near minimal points of the curves, where two ends of DNA constructs are almost out-of-phase. Large twisting energy must be overcome to bring two ends in phase to form a ligatable circle. Therefore, changes in twisting energy have a dramatic effect on J factor. In contrast, the J factors around the maximal points barely change inasmuch as the corresponding constructs here already have almost in-phase torsional angles. The slight decrease (increase) upon decrease (increase) in torsional modulus results completely from entropy effect in aligning two ends for cyclizations. As a conclusion, a higher torsional modulus leads to a larger amplitude of variation in the curve of log(J) vs. total DNA length and vice versa. However, it must be pointed out that this relation is only valid for straight test sequences or curved ones with global bending direction exactly in phase with that of the A-tracts. Otherwise, the twisting flexibility has significant effects on the coupling between the two out-of-plane bends. In this case, decrease in torsional modulus promotes the alignment of the two bends, which may counteract the small entropy effect and lead to an increase of the J factors near maxima, instead of a decrease as in the previous analysis. As a result, the amplitude of the curve from the total length assay may not simply reflect the twisting flexibility. This may make the assay relatively insensitive to the torsional modulus and cause its poor measurement. For example, in a recent study for a DNA sequence with high affinity for histones, a 16-bp phasing length, instead of a 14.5-bp optimal length, was used for the total length assay. Although the sequence is shown to have reduced torsional modulus compared with a control, its amplitude is almost same as the latter. It is also noted that the best-fit torsional modulus locates within a broad bottom of fitting error (Fig. 4 C in Roychoudhury et al., 2000). To conclude, in cyclization experiments, the phasing assay should be first performed to estimate the magnitude and direction of curvature of test sequence. Then the phasing length with highest J factor is chosen for the total length assay. Comparing the magnitudes of the changes in J factor due to the same fold changes in the persistence length and torsional modulus, the bending flexibility has greater effects. This is because the total deformation for transverse bending is ∼360–108 (the intrinsic curvature from A-tracts) = 252°, and for twisting, 180°, although they have close force constants. Fig. 8 D shows the effect of change in helical repeat in the total length assay, which is characterized by the significant global shift in horizontal axis.
The above analyses of the dependence of J factor upon different parameters in the phasing assay and the total length assay help the qualitative estimation of the geometric and mechanical characters of a test sequence. For an accurate quantitation, a multiparameter optimization is needed to convolute their contributions. The coupling of the bending and flexibility in DNA cyclization complicates the data interpretation and a tedious multidimensional optimization with Monte Carlo simulation had to be utilized (Crothers et al., 1992; Roychoudhury et al., 2000; Nathan and Crothers, 2002). As will be seen later, this problem can be readily solved by our new approach with gradient searches.
Simulations of the cyclization data and comparisons with Monte Carlo simulations
The new approach is applied to the simulation of the cyclization data for three repeats of the 10 mer CGCG-AATTCG recently finished in our laboratory (Nathan and Crothers, 2002), which was analyzed with Monte Carlo simulation. For all combinations of the discrete parameters, i.e., bending position and model (tilt or roll), simultaneous optimizations of four parameters are performed by the Levenberg-Marquardt algorithm with analytical gradients and their fitting errors compared. The fitting error is defined as
 |
(47) |
where Nd is total number of data points and Jsim and Jexp are simulated and experimental J factors, respectively. The error is calculated after the minimizations of Ndσ2error vs. bending and twist flexibility, bending magnitude, and twist angle is finished. Once the best-fitted parameters are found, their standard deviations can be obtained by computing the goodness-of-fit parameter (Bevington and Robinson, 1992), i.e.,
 |
(48) |
Here we have assumed that the uncertainties of experimental data log(Jsim)i are all same and that they can be estimated from the fitting error defined in Eq. 47. The variation of χ2 with each individual parameter (denoted as a in general) is calculated in the vicinity of its best-fitted value, i.e., a′, and fitted with following formula:
 |
(49) |
where σa2 and χc2 are two constants with σa the standard deviation.
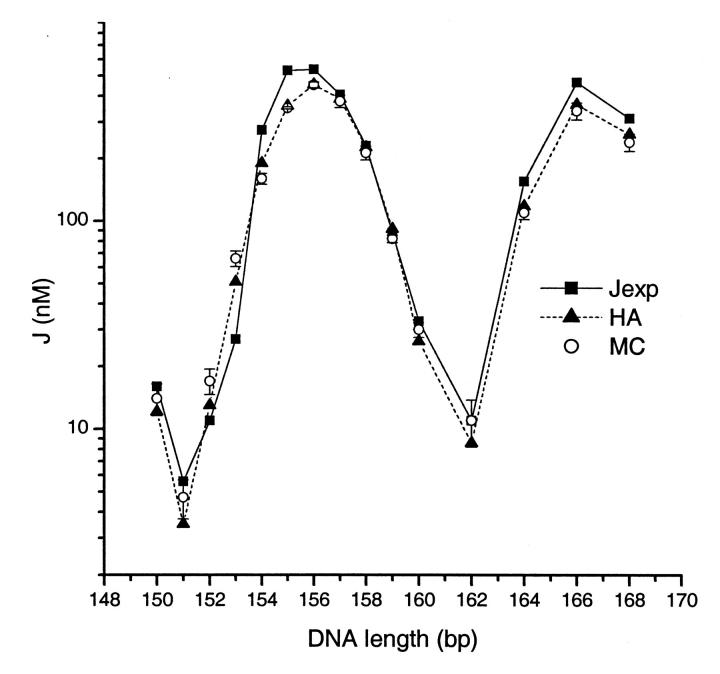
Table 1 shows the best-fit parameters and their deviations for 22 data points from both the phasing assay and the total length assay. The best-fit parameters from Monte Carlo simulations are given as well (Nathan and Crothers, 2002). The slight difference in curvature may come from incomplete optimization due to its coarse step search in the Monte Carlo simulation. The calculated J factors with these parameters are compared with experimental data in the total length assay, as shown in Fig. 9. It can be seen that our approach is able to fit the data well. The two sets of best-fit parameters deviate significantly only in the twist flexibilities. Two reasons may cause the large differences. One is the relatively low sensitivity of the experimental data to the torsional modulus, as exhibited by the large relative error for the best-fit value. This characteristic has also been magnified by Monte Carlo simulations (Roychoudhury et al., 2000). Our previous sensitivity analyses rationalize these general observations. The other one is related to the stochastic character of Monte Carlo simulations. The fluctuations, especially for the poor cyclizers that contribute much information for twisting flexibility, may vary the best-fit parameters between different batches of simulations. Independent Monte Carlo simulations, using our parameters, decrease the fitting error from 0.181 to 0.169, virtually the same as the fitting error of 0.163 from the HA method. To show the accuracies of our best-fit parameters and illustrate their computations, the goodness-of-fit parameters χ2 for the curvature and bending flexibility are shown in Fig. 10. Compared with a recent NMR structure for the same EcoR I sequence (Tjandra et al., 2000), the accuracy of DNA cyclization in determining global curvature is at least as good, if not better, than that of the most advanced NMR technique.
TABLE 1.
Comparisons between the best-fit global structural parameters for CGCGAATTCG
| Method | Fitting Error | Bending Position | Bending Amplitude (degree) | Bending Flexibility (degree) | Twist (degree) | Twist Flexibility (10−19erg × cm) |
|---|---|---|---|---|---|---|
| MC(ND) | 0.181 | 6 | −7 | 5.3 | 34.29 | 2.0 |
| HA | 0.163 | 6 | −7.63 (0.55) | 5.44 (0.09) | 34.32 (0.14) | 1.03 (0.33) |
The parameters from Monte Carlo (MC) simulation shown here are from Nathan and Crothers (2002). The values in parentheses are standard deviations calculated with our new approach based on the harmonic approximation (HA). The position and amplitudes shown in the table mean that the global curvature can be modeled with a bend ∼7–8°, depending on fitting methods, toward the minor groove at the AT dinucleotide step. The bending flexibility from HA corresponds to a persistence length of 111.0 ± 3.7 bp.
FIGURE 9.
Comparisons of the simulations from our new approach to the experimental cyclization data for the EcoR I site-containing sequence (Nathan and Crothers, 2002) and to the Monte Carlo simulation. The best-fit parameters are shown in Table 1. The Monte Carlo simulations are independently performed with our best-fit parameters.
FIGURE 10.
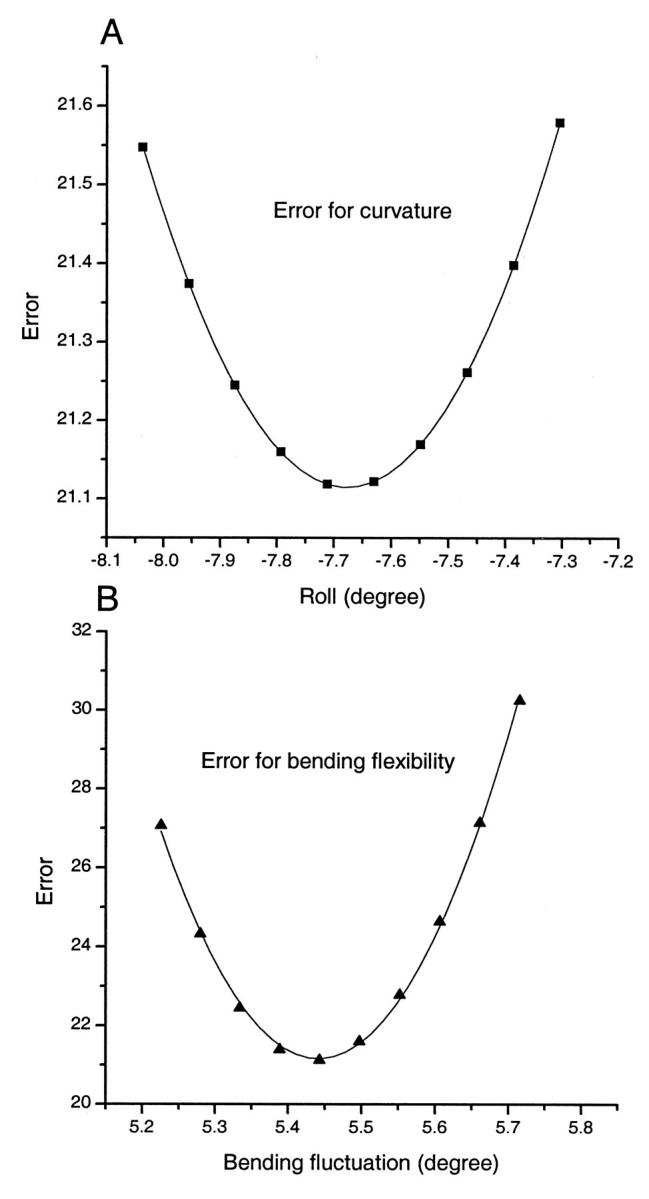
Variations of the goodness-of-fit parameter with curvature (A) and bending flexibility (B) near their optimal values used to calculate their standard deviations. The curves are fitted with Eq. 49 for which parameters a′ and χ20 are −7.68 and 21.11 for (A) and 5.44 and 21.16 for (B), respectively, with the associated standard deviations shown in Table 1.
We use the constructs in the total length assay to compare J factors computed from both the Monte Carlo simulation and our new approach based on the harmonic approximation (HA), using our best-fit parameters, as shown in Fig. 9. The Monte Carlo simulation given by Levene and Crothers (1986), Kahn and Crothers (1998), and Roychoudhury et al. (2000) are followed. To get a reliable J factor, as many as 5 × 10⁹ total DNA configurations often have to be sampled, depending on J factor. Each calculation takes from 20 to 120 min with the same 1-GHz processor. The J factors in Fig. 9 are averages of three independent simulations. Compared with results from MC, the differences from our approach are generally within 30%. The only exception is N = 151, for which the J factor from HA is 34% less. The matches for good cyclizers are usually better than for poor cyclizers. Considering the stochastic nature and possible systematic errors of the Monte Carlo simulation due to finite sampling windows, we conclude that the two approaches are well consistent for small DNA circles and that our new approach can replace MC for the interpretations of DNA cyclization data.
Configuration fluctuations and their correlations in circular DNA
The good match between Monte Carlo simulation and our new approach suggests that the Taylor expansion in Eq. 26 well approximates the exact constraint in Eq. 4 for thermodynamically accessible configurations. The circularization of DNA significantly reduces its phase space compared to free DNA, which renders the good approximations. Is this reduction realized by limiting the fluctuations of individual basepairs or global configuration fluctuations? To reply to this question, we calculated the basepair fluctuations around their mechanical equilibrium configurations. Shown in Fig. 11 A is the ratio of the fluctuation of each basepair in circular DNA to that of free DNA. To our surprise, we found that although the fluctuations for some basepairs decrease due to the strains in circular DNA, a large portion of basepairs have enhanced fluctuations. In general the modulation of the fluctuation in forming DNA circles is very low, with an average less than 1% for all three kinds of angular parameters. This observation clearly demonstrates that circle formation does not reduce the individual basepair fluctuations. It appears that each basepair fluctuates freely as if in free DNA. This case happens only in correlated global movements. The deformation of a certain basepair due to thermal agitation is responded to by concerted deformations of all other basepairs, thus alleviating its resistance. This point is verified by the fluctuation correlations shown in Fig. 11 B. Here the correlation between tilt of the first dinucleotide step and all other degrees of motion are exhibited. The correlations extend to all basepairs, consistent with global concerted motions, which is contrary to many thermodynamical systems where local correlations dominate, leading to correlation function decay over distance. Note that the fluctuations in Fig. 11 A have nearly half periods compared to that of correlations in Fig. 11 B which are about the helical repeat of circular DNA.
FIGURE 11.
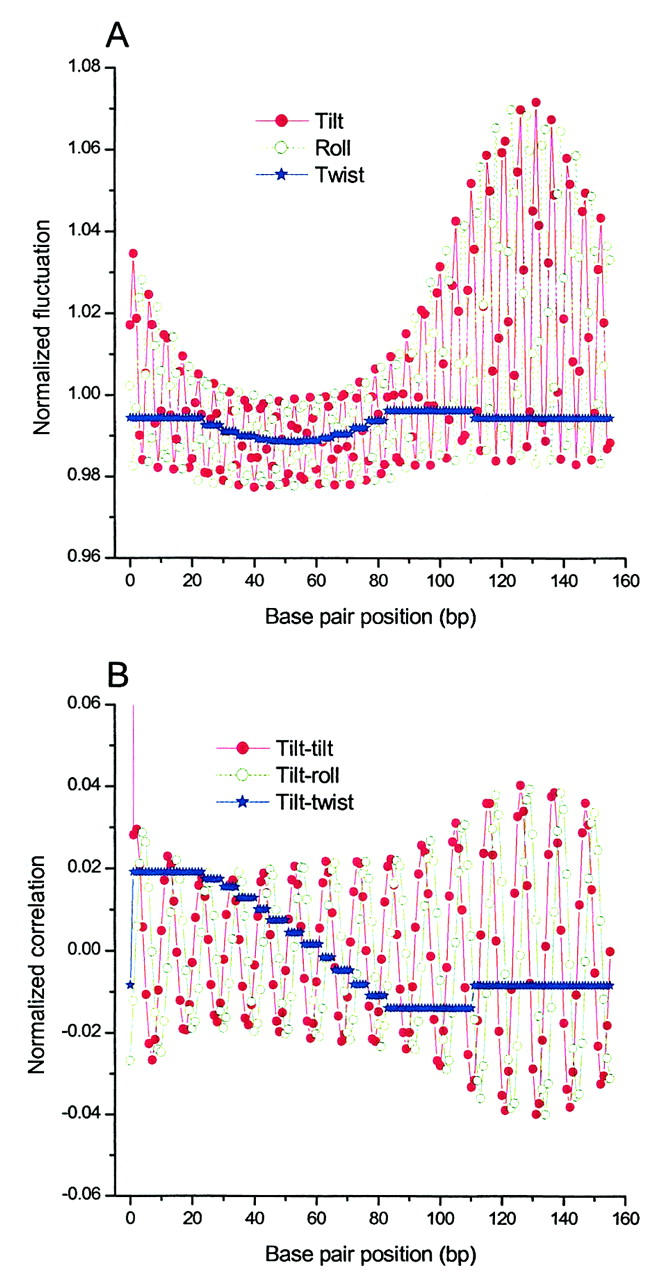
Basepair fluctuations (A) and correlations (B) calculated with Eqs. 36 and 37 for the construct with N = 156 and reference values of P = 150 and T = 2.4 in Fig. 8, C and D.
The global configuration fluctuations could be mainly in plane or out of plane. To distinguish, we calculate the average writhes and their fluctuations for DNA constructs with different lengths. For small DNA circles involved in DNA cyclization, we found that their mechanical equilibrium configurations are largely in plane. Therefore their linking numbers Lk must be integers closest to their helical repeats, Ht, i.e.,
 |
(50) |
Then the average writhe is
 |
(51) |
where Tw is twist of circular DNA, i.e.,
 |
(52) |
The writhe fluctuation can be calculated through twist fluctuation, which is
 |
(53) |
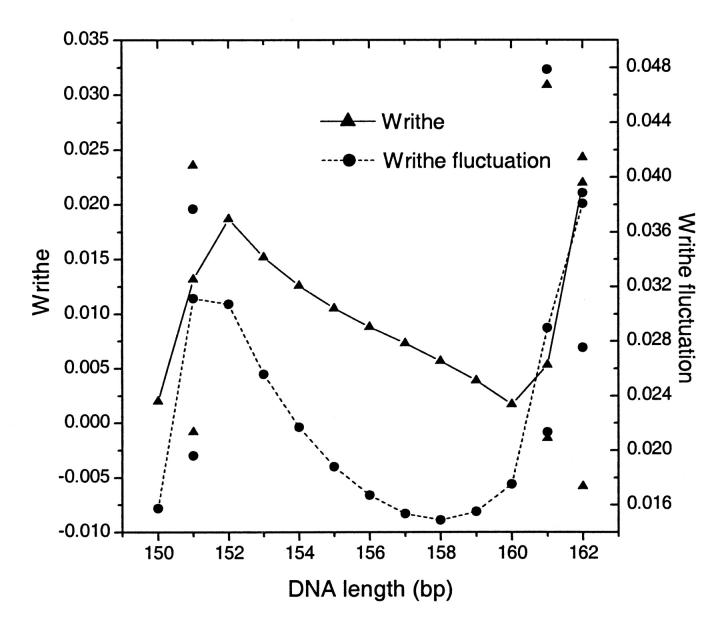
where the sum is limited to twisting angles. Thus the calculation of writhe fluctuations is reduced to the computation of twisting fluctuations and correlations. Fig. 12 shows the average writhes and writhe fluctuations for the constructs whose J factors were given in Fig. 8 C. As previously mentioned, two topoisomers are considered for 151-, 161-, and 162-bp constructs due to the out-of-torsional matches for their ends. The points on the lines are averages of the two corresponding quantities weighted by their J factors. Both writhe and writhe fluctuation roughly correlate to the twisting strain in a DNA circle. Their small values suggest that for small DNA circles the configuration fluctuations are mainly near planes where the mechanical equilibrium configurations lie. This fact partially explains why the replacement of the constraints with their Taylor expansion, up to second order, works well.
FIGURE 12.
The average writhe 〈Wr〉 and writhe fluctuation  for the constructs in the total length assay shown in Fig. 8 C with the reference values.
J factors for homogeneous DNA with isotropic or anisotropic bending flexibility
We denote σroll and σtilt as the bending fluctuations of roll and tilt (Levene and Crothers, 1986), respectively, and define their ratio σroll/σtilt as the bending anisotropy r. Thus the isotropic DNA corresponds to a special case of r = 1. It is found that the equilibrium configuration of the circular DNA in a low twist strain can be well fitted by the following formula:
 |
(54) |
Here the parameter δ is an arbitrary constant related to the rotational symmetry of the circular DNA path as well as the inward or outward phasing of basepairs relative to the bending direction (Fuurer et al., 2000). The errors for these expressions are less than 10−2 degree in general and 10−5 degree for the case of r = 1. For the isotropic chain the helical path of the DNA lies absolutely in a plane with a normal n = −cos(δ)e1 + sin(δ)e2 and all basepairs rotate along this axis with approximately equal angles of (θi2 + φi2)1/2 = 2π/N. The sinusoid changes of tilt and roll in a circular DNA have been previously noticed, but no explicit mathematical expression were given (Namoradze et al., 1977).
The degenerate minimum energy configurations of homogeneous DNA invalidate the application of Eq. 35, which leads to enormously large J factors. To employ the harmonic approximation, we need to remove this degeneracy, taking advantage of the rotational symmetry. Suppose in Eq. 20 x1 and x2 represent the tilt and roll of the first dinucleotide step, respectively, and make the following variable transformation
 |
(55) |
where ξ is the bending amplitude and η gives the bending direction. Then Eq. 20 can be rewritten as
 |
(56) |
 |
 |
 |
 |
 |
 |
Here the additional term ξ in the integral is Jacobian for the variable transformation in Eq. 55. In the second equation the rotational symmetry is used to remove the degeneracy. As a result, the configuration with a zero tilt angle for the first dinucleotide step is chosen for computation of the J factor, equivalent to choosing δ = π/2 in Eq. 54. The approximation for the third equation comes from the extension of the integration limit for ξ. The variables in this equation are renumbered for convenience. Expressing the angular variables with their fluctuations, i.e.,
 |
(57) |
where xc,i, i = 2, … ,3N − 4 are given by Eq. 54 with δ = π/2, we can replay the harmonic approximation, yielding,
 |
(58) |
Here the matrices A and F are same as those defined in Eqs. 39 and 40 except that 3N − 4, instead of 3N − 3, variables are involved in the calculations of their first- and second-order derivatives due to the fixed tilt of the first dinucleotide step. Therefore, the dimension of A matrix becomes (3N − 4) × (3N − 4).
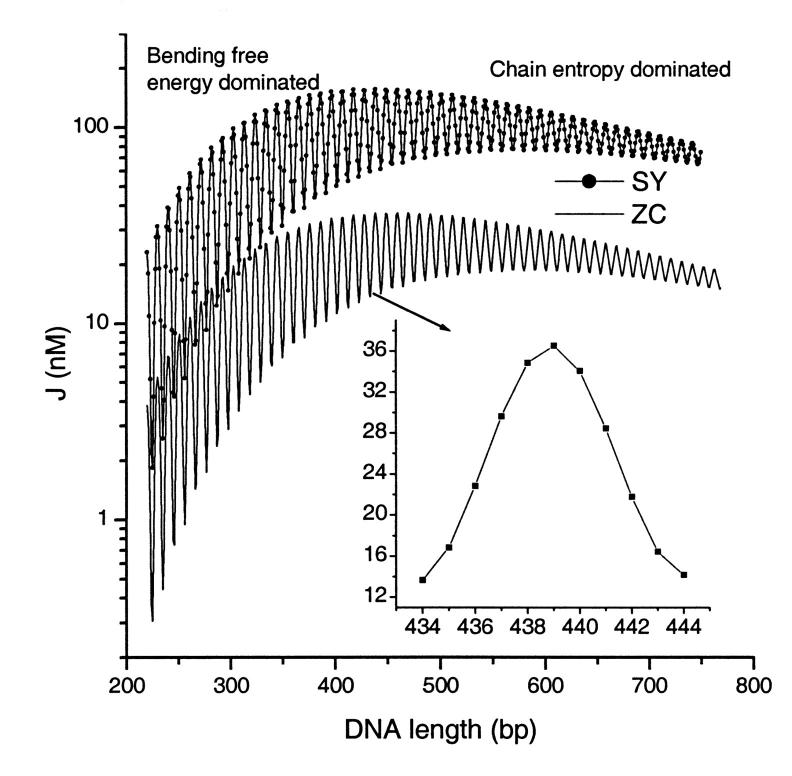
The calculated total J factor vs. DNA length for homogeneous DNA is shown in Fig. 13. It clearly demonstrates the importance of entropy effects in DNA cyclization, necessitating the statistical mechanical treatment. Consider the cases where q = 0 (corresponding to the sharp peaks). For small DNA sizes, significant bending energy needs to be overcome to form a circle, thus energy dominated; whereas for long DNA, its flexibility dilutes the effective concentration of one end at the other, resulting in a decrease in the peaks. This observation cannot be explained by any models where only elastic energy is concerned (Manning et al., 1996) because the bending energy of circular DNA, i.e.,
 |
(59) |
decreases monotonically with DNA length. The sharp variation of J factor is caused by the helical structure of DNA, with their amplitude decreasing with DNA length due to twisting flexibility. Also shown in Fig. 13 are the J factors calculated from an empirical formula obtained by Shimada and Yamakawa (1984). Each J factor contains the contributions from topoisomers with |q|Kt/Kb ≤ 1.45 in which the formula is valid. We leave a discussion of the apparent discrepancies between the J factors calculated from the two models to the forthcoming section.
FIGURE 13.
Variation of the total J factor vs. DNA length calculated from Eq. 58 (ZC) or Shimada and Yamakawa's empirical formula (SY) for homogeneous DNA (zero roll and tilt, 34.45° twist, 4.68° bending flexibility, and 4.388° twisting flexibility).
It is well known that the mechanical equilibrium of the planar DNA circle with isotropic bending flexibility becomes unstable when the difference in helical repeats between circle and linear DNA, i.e., |q|, is bigger than a critical value of  where Kb and Kt are force constants for bending and twisting, respectively (Benham, 1977; Lebret, 1979). As the twisting strain gradually passes above this value, the DNA molecule transits to a plectonemic supercoiled configuration. However, the stabilities of the configurations given by Eq. 54 are more complex. For small DNA circles, some configurations, even with |q| < qc, become unstable—which means that if input with these configurations, the iterations either converge to loops instead of circles or do not converge at all, whereas for long DNA, configurations with |q| < qc can be stable in the sense of our iteration algorithm. For example, with the parameters in Fig. 13, qc = 1.52. When N = 222, the only stable configuration is the one with a linking number of 21 (q = 0.244). Although the topoisomer whose linking number is 20 has |q| < qc, it is not stable. In contrast, for DNA with N = 500, the topoisomers with linking numbers from 45 (q = −2.85) to 50 (q = 2.15) are stable. It is found that for DNA circles with large strain, or big |q|, their corresponding matrices A and F always have negative determinants. Take N = 500, for example. The topoisomers that have the positive determinants are ones bearing linking numbers of 47 (q = −0.85) and 48 (q = 0.15), with the others having negative determinants. Opposite signs for the determinants of A and F indicate that the integral for Zc in Eq. 56 diverges under the harmonic approximation, which has never been observed for stable configurations. Large torsional strain will convert closed DNA to a variety of supercoiling states, in which self-contacts between different parts of the DNA molecule become important (Bloomfield et al., 2000). Since interaction representing self-contact is not incorporated in the Hamiltonian in Eq. 1, it is not applicable in the high supercoiling states. Our J factors shown in Fig. 13 include the contributions from all stable topoisomers with |q| < qc.
It is of interest to check the effects of bending anisotropy on cyclization (Munteanu et al., 1998). A recent survey of DNA crystallographic structures suggests that the average roll fluctuation for all dinucleotide steps is ∼1.5-fold larger than that of tilt (Olson et al., 1998). However, previous Monte Carlo simulations showed that the bending anisotropy rarely affects the J factors as long as the persistence length (P = 2/(σ2roll + σ2tilt) in this case) is fixed (Levene and Crothers, 1986; Schurr et al., 1995). Our calculations support this conclusion: less than a 10% change in J factor is observed for an ∼100-fold change in bending anisotropy. This fact can be partially interpreted by the independence of the bending energy, which can be calculated from the configuration given by Eq. 54 and is still expressed by Eq. 59, on the bending anisotropy r. The rather weak dependence of J factor on the bending anisotropy also holds for the constructs with intrinsic curvature. Therefore, for simplicity we neglect the bending anisotropy in our model for all the previous calculations. It is also noted that in the anisotropy case a break in symmetry occurs with the strain energy no longer uniformly distributed along the DNA chain.
DISCUSSION
The solution to Eq. 7 gives a stationary point of the high-dimensional energy function subject to the constraints for circularization. Although this solution is stable or metastable from the viewpoint of our iterative algorithm, it is not necessarily stable from the sense of mechanical stability. To be a stable mechanical equilibrium configuration, the stationary point has to be a minimum point, instead of a saddle point. For a multivariable function without constraints, a minimum point is often the stationary point whose corresponding Hessian matrix is positive definite, with a resultant positive determinant and eigenvalues (Riley et al., 1997). We are not sure whether or not a similar criterion exists for a constrained system and failed to derive one that can be conveniently implemented. We conjecture that the mechanical stability of our converged configuration has something to do with the second derivative of the constraints and related matrices A and F in Eqs. 35 and 58. But it must be pointed out that in several cases tested, both matrices are not positive-definite.
An early theory for the calculation of the ring-closure probabilities for homogeneous twist wormlike chains (Shimada and Yamakawa, 1984) has had some applications to DNA cyclization (Bacolla et al., 1997). After the discretization of their continuum model, the system is parameterized by Euler angles defined in external coordinates, instead of dinucleotide steps in our model. To incorporate the second-order derivatives of their different set of constraints from ours, they utilized the perturbation approach by assuming that these terms make only small corrections to J factors compared to the first-order derivative terms. In developing our harmonic approximation, we also tried the similar perturbation method and found that the corrections from the second-order derivative terms are often not small, sometimes leading even to negative total J factors. This observation can be understood from Eq. 28 where both the first- and second-order derivative terms show up after the harmonic approximation, suggesting equal importance of the two terms. Our numerical experiments also confirm this point: incorporation of the second-order derivatives enhances the J factors by around twofold compared to the cases where only the first-order derivatives are considered, as shown in Fig. 8 D. It is not clear whether the differences in the model or the differences in the methods of approximations cause the large discrepancies between J factors calculated from two approaches. For the former, it would be interesting to discretize the continuum model in dinuclotide steps to make term-by-term comparisons. It has been widely noted that discrete models can exhibit behaviors significantly different from their continuum version (Zhang et al., 1997).
In our model, kinetic terms from basepair rotation are neglected. These terms can be factorized out in the calculation of the J factor in terms of Eq. 2 by transformations of general canonical coordinates, above which a complete Hamiltonian including the kinetic terms is defined, to noncanonical coordinates parameterized by tilt, roll, and twist. However, a Jacobian due to the variable transformations, i.e.,
 |
(60) |
will appear in the integrals of the partition functions in Eqs. 3 and 5 (Gonzalez and Maddocks, 2001). It can be shown that this term is to guarantee unbiased relative orientations of basepairs if the energy penalty is removed, i.e., αi = 0, i = 1, … , 3N − 3. In our calculations, a unit approximation for the above factor is assumed, as well as in the Monte Carlo simulations (Levene and Crothers, 1986). Although this approximation breaks the uniform distribution of a free rigid body in its whole coordinate space, the uniformity is largely kept around a small region that is thermodynamically accessible for our system (in the presence of the energy penalty). As a consequence, the unit approximation for the Jacobian is well justified for the calculations of J factors. An estimation given in the Appendix reveals that the error due to the approximation is within 5%.
Finally, it is worth pointing out that, besides DNA cyclization, our new theory has the potential to be applied to a variety of systems where DNA sequence inhomogeneity is of interest; for example, the modeling of nucleosome structure, DNA looping, and DNA supercoiling.
Acknowledgments
This work was supported by grant GM21966 from the National Institutes of Health. We also acknowledge general research support from the National Foundation for Cancer Research, Yale Center for Protein and Nucleic Acid Chemistry.
Appendix A
The following formulas (Reichl, 1980) have been used for the calculations of J factors and fluctuation and correlation functions:
 |
(61) |
 |
(62) |
and
 |
(63) |
where i, j = 1, … ,n, x ≡ (x1, … ,xn)T, and g is a symmetric matrix which ensures the existence of the integral. With help of the above identities, all the calculations are related to the manipulations of the block matrix M defined in Eq. 32. Suppose X and Y are matrices with shapes n × n and n × m, respectively, and with the existence of X−1, then applying elementary transformations to a block matrix, one can prove two identities below:
 |
(64) |
and
 |
(65) |
Eq. 65 can be directly checked by matrix multiplication. One may simplify it as
 |
(66) |
by assuming that (YYT)−1 exists. Unfortunately this prerequisite is not met in our application inasmuch as det(ββT) = 0.
Using Eq. 64, one has
 |
(67) |
 |
 |
where Eqs. 15, 39, and 40 have been used. Substituting Eq. 67 into Eq. 34 and noting Eqs. 2 and 3, one has Eq. 35. Similarly, using Eqs. 62, 63, and 65, one can approve Eqs. 36–38.
To simplify the computations of the first and second order derivatives of the constrains, the following formulas are used:
 |
(68) |
 |
 |
and
 |
(69) |
 |
 |
 |
where
 |
(70) |
 |
 |
with  corresponding to basepair i and i, j = 1, … ,N. The second derivatives of d1(N+1) can be calculated similarly to d3(N+1).
To simulate the cyclization data with our new approach, we need to optimize the parameters of the test sequence by minimizing the following error between simulated and measured J factors, i.e.,
 |
(71) |
There are two types of parameters to be optimized—the geometric parameters, such as curvature and torsion angle, designated as x0, and mechanical parameters, such as bending and twisting flexibility, designated as α. Both parameters are associated with some degrees of freedom whose indices belong to sets designated as {x0} and {α}, respectively. To carry out the optimization by the Levenberg-Marquardt approach, gradients of log J vs. the parameters mentioned above are required. Although estimations of the gradient by finite difference work, the resultant optimization algorithm is not as robust as that with analytic gradients. The gradients for the two types of parameters are calculated under the assumption of the independence of the mechanical equilibrium configuration upon the parameters, with results shown below:
 |
(72) |
 |
We now consider the correction for the J factor by including the Jacobian factor. To avoid confusion, we rewrite the corresponding notations by adding a prime sign in the presence of the Jacobian. Then
 |
(73) |
 |
where the multiplication is limited to tilt angles, with Z given in Eq. 3. To calculate  , we expand the Jacobian factor around the mechanical equilibrium configuration, i.e.,
 |
(74) |
 |
Here the terms with orders higher than two are neglected. Then
 |
(75) |
Therefore,
 |
(76) |
We have previously shown that the fluctuations of basepairs upon cyclization rarely change. Neglecting the second term in the right side of Eq. 76, we can see that the correction due to the Jacobian is determined by the shifts of equilibrium configurations before and after circularization, thus depending upon J factor. Without losing generality, we choose homogenous DNA to estimate the corrections, yielding
 |
(77) |
Here, Eq. 54 has been used. For N = 220 whose J factor compares to the lowest one for the constructs in DNA cyclization, the inclusion of the Jacobian decrease the J factor by 4.5%.
References
- Bacolla, A., R. Gellibolian, M. Shimizu, S. Amirhaeri, S. Kang, K. Ohshima, J. E. Larson, S. C. Harvey, B. D. Stollar, and R. D. Wells. 1997. Flexible DNA: Genetically unstable ctg·cag and cgg·ccg from human hereditary neuromuscular disease genes. J. Biol. Chem. 272:16783–16792. [DOI] [PubMed] [Google Scholar]
- Balaeff, A., L. Mahadevan, and K. Schulten. 1999. Elastic rod model of a DNA loop in the LAC operon. Phys. Rev. Lett. 83:4900–4903. [Google Scholar]
- Bauer, W. R., R. A. Lund, and J. H. White. 1993. Twist and writhe of a DNA loop containing intrinsic bends. Proc. Natl. Acad. Sci. USA. 90:833–837. [DOI] [PMC free article] [PubMed] [Google Scholar]
- Bender, C. M., and S. A. Orszag. 1978. Advanced Mathematical Methods for Scientists and Engineers. McGraw-Hill, New York.
- Benham, C. J. 1977. Elastic model of supercoiling. Proc. Natl. Acad. Sci. USA. 74:2397–2401. [DOI] [PMC free article] [PubMed] [Google Scholar]
- Bevington, P. R., and D. K. Robinson. 1992. Data Reduction and Error Analysis for the Physical Sciences. McGraw-Hill, Inc., New York.
- Bloomfield, V. A., D. M. Crothers, and I. Tinoco. 2000. Nucleic Acids: Structures, Properties, and Functions. University Science Books, Sausalito, California.
- Brukner, I., M. Dlakic, A. Savic, S. Susic, S. Ponger, and D. Suck. 1993. Evidence for opposite groove-directed curvature of gggccc and aaaaaa sequence elements. Nucleic Acids Res. 21:1025. [DOI] [PMC free article] [PubMed] [Google Scholar]
- Crothers, D. M., J. Drak, J. D. Kahn, and S. D. Levene. 1992. DNA bending, flexibility, and helical repeat by cyclization kinetics. Method Enzymol. 212:3–29. [DOI] [PubMed] [Google Scholar]
- Crothers, D. M., T. E. Haran, and J. G. Nadeau. 1990. Intrinsically bent DNA. J. Biol. Chem. 265:7093–7096. [PubMed] [Google Scholar]
- Dickerson, R. E., and T. K. Chiu. 1997. Helix bending as a factor in protein/DNA recognition. Biopolymers. 44:361–403. [DOI] [PubMed] [Google Scholar]
- Dickerson, R. E., M. Bansal, C. R. Calladine, S. Diekmann, W. N. Hunter, O. Kennard, E. von Kitzing, R. Lavery, H. C. Nelson, W. K. Olsen, W. Saenger, Z. Shakked, H. Sklenar, D. M. Soumpasis, C. S. Tung, A. H. J. Wang, and V. B. Zhurkin. 1989. Definitions and nomenclature of nucleic acid structure parameters. EMBO J. 8:1–4.2714249 [Google Scholar]
- Digabriele, A. D., M. R. Sanderson, and T. A. Steitz. 1989. Crystal-lattice packing is important in determining the bend of a DNA dodecamer containing an adenine tract. Proc. Natl. Acad. Sci. USA. 86:1816–1820. [DOI] [PMC free article] [PubMed] [Google Scholar]
- Drak, J., and D. M. Crothers. 1991. Helical repeat and chirality effects on DNA gel electrophoretic mobility. Proc. Natl. Acad. Sci. USA. 88:3074–3078. [DOI] [PMC free article] [PubMed] [Google Scholar]
- Fuurer, P. B., R. S. Manning, and J. H. Maddocks. 2000. DNA rings with multiple energy minima. Biophys. J. 79:116–136. [DOI] [PMC free article] [PubMed] [Google Scholar]
- Gonzalez, O., and J. H. Maddocks. 2001. Extracting parameters for base-pair level models of DNA from molecular dynamics simulations. Theor. Chem. Acc. 106:76–82. [Google Scholar]
- Hagerman, P. J. 1985. Analysis of the ring-closure probabilities of isotropic wormlike chains—application to duplex DNA. Biopolymers. 24:1881–1897. [DOI] [PubMed] [Google Scholar]
- Hagerman, P. J. 1988. Flexibility of DNA. Annu. Rev. Biophys. Biophys. Chem. 17:265–286. [DOI] [PubMed] [Google Scholar]
- Hagerman, P. J. 1990. Sequence-directed curvature of DNA. Annu. Rev. Biochem. 59:755–781. [DOI] [PubMed] [Google Scholar]
- Hao, M. H., and W. K. Olson. 1989. Global equilibrium-configurations of supercoiled DNA. Macromolecules. 22:3292–3303. [Google Scholar]
- Hogan, M., J. Legrange, and B. Austin. 1983. Dependence of DNA helix flexibility on base composition. Nature. 304:752–754. [DOI] [PubMed] [Google Scholar]
- Jacobson, H., and W. H. Stockmayer. 1950. Intramolecular reaction in polycondensations.1. The theory of linear systems. J. Chem. Phys. 18:1600–1606. [Google Scholar]
- Kahn, J. D., and D. M. Crothers. 1992. Protein-induced bending and DNA cyclization. Proc. Natl. Acad. Sci. USA. 89:6343–6347. [DOI] [PMC free article] [PubMed] [Google Scholar]
- Kahn, J. D., and D. M. Crothers. 1998. Measurement of the DNA bend angle induced by the catabolite activator protein using Monte Carlo simulation of cyclization kinetics. J. Mol. Biol. 276:287–309. [DOI] [PubMed] [Google Scholar]
- Kahn, J. D., E. Yun, and D. M. Crothers. 1994. Detection of localized DNA flexibility. Nature. 368:163–166. [DOI] [PubMed] [Google Scholar]
- Katritch, V., and A. Vologodskii. 1997. The effect of intrinsic curvature on conformational properties of circular DNA. Biophys. J. 72:1070–1079. [DOI] [PMC free article] [PubMed] [Google Scholar]
- Koo, H. S., J. Drak, J. A. Rice, and D. M. Crothers. 1990. Determination of the extent of DNA bending by an adenine thymine tract. Biochemistry. 29:4227–4234. [DOI] [PubMed] [Google Scholar]
- Koo, H. S., H. M. Wu, and D. M. Crothers. 1986. DNA bending at adenine thymine tracts. Nature. 320:501–506. [DOI] [PubMed] [Google Scholar]
- Lebret, M. 1979. Catastrophic variation of twist and writhing of circular DNAs with constraint. Biopolymers. 18:1709–1725. [DOI] [PubMed] [Google Scholar]
- Levene, S. D., and D. M. Crothers. 1986. Ring-closure probabilities for DNA fragments by Monte-Carlo simulation. J. Mol. Biol. 189:61–72. [DOI] [PubMed] [Google Scholar]
- Luger, K., A. W. Mader, R. K. Richmond, D. F. Sargent, and T. J. Richmond. 1997. Crystal structure of the nucleosome core particle at 2.8 Ångstrom resolution. Nature. 389:251–260. [DOI] [PubMed] [Google Scholar]
- Manning, R. S., J. H. Maddocks, and J. D. Kahn. 1996. A continuum rod model of sequence-dependent DNA structure. J. Chem. Phys. 105:5626–5646. [Google Scholar]
- Marko, J. F., and E. D. Siggia. 1994. Fluctuations and supercoiling of DNA. Science. 265:506–508. [DOI] [PubMed] [Google Scholar]
- Marko, J. F., and E. D. Siggia. 1995. Statistical-mechanics of supercoiled DNA. Phys. Rev. E. 52:2912–2938. [DOI] [PubMed] [Google Scholar]
- Munteanu, M. G., K. Vlahovicek, S. Parthasarathy, I. Simon, and S. Pongor. 1998. Rod models of DNA: Sequence-dependent anisotropic elastic modeling of local bending phenomena. Trends Biochem. Sci. 23:341–347. [DOI] [PubMed] [Google Scholar]
- Namoradze, N. Z., A. N. Goryunov, and T. M. Birshtein. 1977. On conformations of the superhelix structure. Biophys. Chem. 7:59–70. [DOI] [PubMed] [Google Scholar]
- Nathan, D., and D. M. Crothers. 2002. Bending and flexibility of methylated and unmethylated EcoR I DNA. J. Mol. Biol. 316:7–17. [DOI] [PubMed] [Google Scholar]
- Olson, W. K., A. A. Gorin, X. J. Lu, L. M. Hock, and V. B. Zhurkin. 1998. DNA sequence-dependent deformability deduced from protein-DNA crystal complexes. Proc. Natl. Acad. Sci. USA. 95:11163–11168. [DOI] [PMC free article] [PubMed] [Google Scholar]
- Parvin, J. D., R. J. McCormick, P. A. Sharp, and D. E. Fisher. 1995. Pre-bending of a promoter sequence enhances affinity for the TATA-binding factor. Nature. 373:724–727. [DOI] [PubMed] [Google Scholar]
- Pedersen, A. G., L. J. Jensen, S. Brunak, H. H. Staerfeldt, and D. W. Ussery. 2000. A DNA structural atlas for Escherichia coli. J. Mol. Biol. 299:907–930. [DOI] [PubMed] [Google Scholar]
- Reichl, L. E. 1980. A Modern Course in Statistical Physics. University of Texas Press,Austin. 310–311.
- Riley, K. F., M. P. Hobson, and S. J. Bence. 1997. Mathematical Methods for Physics and Engineering: A Comprehensive Guide. Cambridge University Press, Cambridge.
- Roychoudhury, M., A. Sitlani, J. Lapham, and D. M. Crothers. 2000. Global structure and mechanical properties of a 10-bp nucleosome positioning motif. Proc. Natl. Acad. Sci. USA. 97:13608–13613. [DOI] [PMC free article] [PubMed] [Google Scholar]
- Schurr, J. M., H. P. Babcock, and J. A. Gebe. 1995. Effect of anisotropy of the bending rigidity on the supercoiling free-energy of small circular DNAs. Biopolymers. 36:633–641. [DOI] [PubMed] [Google Scholar]
- Shimada, J., and H. Yamakawa. 1984. Ring-closure probabilities for twisted wormlike chains—application to DNA. Macromolecules. 17:689–698. [Google Scholar]
- Shore, D., and R. L. Baldwin. 1983. Energetics of DNA twisting.1. Relation between twist and cyclization probability. J. Mol. Biol. 170:957–981. [DOI] [PubMed] [Google Scholar]
- Shore, D., J. Langowski, and R. L. Baldwin. 1981. DNA flexibility studied by covalent closure of short fragments into circles. Proc. Natl. Acad. Sci. USA. 78:4833–4837. [DOI] [PMC free article] [PubMed] [Google Scholar]
- Sitlani, A., and D. M. Crothers. 1996. Fos and Jun do not bend the AP-1 recognition site. Proc. Natl. Acad. Sci. USA. 93:3248–3252. [DOI] [PMC free article] [PubMed] [Google Scholar]
- Tjandra, N., S. Tate, A. Ono, M. Kainosho, and A. Bax. 2000. The NMR structure of a DNA dodecamer in an aqueous dilute liquid crystalline phase. J. Am. Chem. Soc. 122:6190–6200. [Google Scholar]
- Vandervliet, P. C., and C. P. Verrijzer. 1993. Bending of DNA by transcription factors. Bioessays. 15:25–32. [DOI] [PubMed] [Google Scholar]
- Wick, G. C. 1954. Properties of Bethe-Salpeter wave functions. Phys. Rev. 96:1124–1134. [Google Scholar]
- Yang, Y., I. Tobias, and W. K. Olson. 1993. Finite element analysis of DNA supercoiling. J. Chem. Phys. 98:1673–1686. [Google Scholar]
- Yang, Y., T. P. Westcott, S. C. Pedersen, I. Tobias, and W. K. Olson. 1995. Effects of localized bending on DNA supercoiling. Trends Biochem. Sci. 20:313–319. [DOI] [PubMed] [Google Scholar]
- Zhang, Y. L., W. M. Zheng, J. X. Liu, and Y. Z. Chen. 1997. Theory of DNA melting based on the Peyrard-Bishop model. Phys. Rev. E. 56:7100–7115. [Google Scholar]


