

Abstract
In this study, we investigated the absorbance and fluorescence properties of cTAR, the complementary DNA sequence of the transactivation response element of the HIV-1 genome, doubly end-labeled by different dyes, 5(and 6)-carboxyfluorescein (Fl) and 5(and 6)-carboxytetramethylrhodamine (TMR), frequently used in fluorescence resonance energy transfer (FRET) studies. This oligonucleotide forms a stable stem-loop structure. The absorption spectrum of this species clearly differed from that of a doubly labeled cTAR derivative in which the terminal part of the stem is melted and from an equimolecular mixture of singly labeled species. Moreover, no significant TMR fluorescence change accompanies the dramatic Fl intensity increase when the doubly labeled native cTAR was melted by temperature or annealed with its complementary sequence. Both elements suggest the formation of an H-type ground-state heterodimer between Fl and TMR that may be described by the molecular exciton model. Moreover, time-resolved fluorescence further suggests that the nonfluorescent heterodimer is in equilibrium with a small population of partially melted species showing FRET. Based on the spectral shifts associated with heterodimer formation, an interchromophore distance of 7.7 Å was calculated. Both the excitonic signal and the Fl fluorescence were used as sensitive tools to monitor the temperature-mediated and HIV nucleocapsid protein-mediated annealing of cTAR with its complementary sequence.
INTRODUCTION
Fluorescence resonance energy transfer (FRET) has been extensively used for distance measurement within and between macromolecules for many years (Cheung, 1991; Klostermeier and Millar, 2001; Klostermeier and Millar, 2002; Selvin, 2000). FRET results from weak nonradiative coupling of two chromophores (acting as a donor and an acceptor, respectively) bound to the macromolecules. This technique has been largely applied to nucleic acids to analyze their global structure, monitor their folding, detect conformational changes, and assess ligand affinity (Klostermeier and Millar, 2001). To extend the applications of this technique, a new class of DNA probes, named molecular beacons, has been developed recently (Tyagi and Kramer, 1996). These probes are hairpin-shaped, single-stranded oligonucleotides with a fluorophore covalently attached to one end and a quencher, covalently attached to the other end. These constructs differ from the conventional applications of FRET in nucleic acids by the replacement of the acceptor by a quencher (in general, DABCYL) and by the close contact between the donor and the quencher in the closed form of the stem. This close contact causes the fluorescence of the fluorophore to be highly quenched. In contrast, hybridization of the molecular beacons with sequences complementary to their loop sequences causes an opening of the stem that moves the fluorophore and the quencher away from each other and restores the fluorescence of the fluorophore. Molecular beacons constitute thus a highly sensitive tool to report the presence of specific complementary nucleic acid sequence in many applications (Fang et al., 1999; Giesendorf et al., 1998; Heyduk and Heyduk, 2002; Kostrikis et al., 1998; Kuhn et al., 2002; Leone et al., 1998; Li et al., 2000; Sokol et al., 1998; Vet et al., 1999).
However, the melting of the stem in the molecular beacons is accompanied by large changes in the absorption spectrum that are not compatible with FRET (Bernacchi and Mely, 2001, Tyagi et al., 1998). In fact, the observed spectroscopic properties indicate that in the closed form of the stem, the fluorophore and the quencher form a ground state intramolecular heterodimer. This allows a strong intramolecular dipole-dipole coupling that can be described by exciton theory (Kasha, 1963; Kasha, 1991; Scholes and Ghiggino, 1994). Because this coupling strongly depends on the exact geometry of and distance between the dyes, it has been shown that the associated spectral changes could be used to investigate short range modifications of the molecular beacon stem structure (Bernacchi and Mely, 2001).
In this context, our aim was to extend our previous study to oligonucleotides doubly end-labeled with a pair of xanthene dyes, 5(and 6)-carboxyfluorescein (Fl) and 5(and 6)-carboxytetramethylrhodamine (TMR), that is frequently used in FRET. This study has been performed on the biologically relevant cTAR sequence that constitutes the complementary DNA sequence of the transactivation response element (TAR) of the HIV-1 genome. This sequence is synthesized by the reverse transcriptase as a part of the minus strong stop DNA, (−)ssDNA, and plays a critical role in the first strand transfer reaction during reverse transcription (Berkhout et al., 2001; Guo et al., 1997; Kim et al., 1997; Lapadat-Tapolsky et al., 1997). Indeed, the translocation of (−)ssDNA to the 3′ end of the viral genome RNA largely relies on the basepairing of cTAR with the TAR sequence present at the 3′ end of the RNA genome. Due to their stable stem-loop structures (Baudin et al., 1993; Driscoll and Hughes, 2000), the spontaneous annealing of TAR with cTAR is inefficient and thus, requires the intervention of the nucleocapsid protein NCp7, which acts as a nucleic acid chaperone (Rein et al., 1998). Herein, we characterized the spectroscopic properties of the ground-state heterodimer formed by the TMR and Fl dyes that are covalently bound to the 5′- and 3′-ends of cTAR, respectively. In a second step, these spectroscopic properties were used to monitor the melting by temperature as well as the NCp7-induced annealing of cTAR with TAR.
MATERIALS AND METHODS
Materials
Doubly, singly and nonlabeled DNA sequences (Fig. 1 a) were synthesized at a 0.2 μmol scale by IBA GmbH Nucleic Acids Product Supply (Göttingen, Germany). Labeling of the 5′ terminus with TMR was performed via an amino linker with a ten-carbon spacer arm (Fig. 1 b). The 3′ terminus of the oligonucleotides was labeled with Fl using a special solid support with the dye already attached. Labeled sequences were purified by the manufacturer by reverse-phase high performance liquid chromatography and polyacrylamide gel electrophoresis. Experiments were performed in Tris HCl 25 mM, pH 7.5, 30 mM NaCl, and 0.2 mM MgCl2. Oligonucleotide concentrations were calculated at 260 nm using extinction coefficients of 521,900 M−1cm−1 for cTAR or dTAR and 484,740 M−1cm−1 for cTARC12. Before the experiments, the correct folding of the oligonucleotides was achieved by heating the samples at 85°C for two minutes in Millipore water and then placing them on ice.
FIGURE 1.

Oligonucleotide sequences (a); chemical structures of the dyes (b); and NCp7 derivative sequence (c) used in this study. The secondary structure of cTAR and cTARC12 were predicted from that of TAR (Baudin et al., 1993) and the mfold program (SantaLucia, 1998).
NC(12-55) (Fig. 1 c) was synthesized by solid-phase chemistry as previously described (de Rocquigny et al., 1991). Its purity analyzed by mass spectrometry was greater than 98%. To preserve the highly oxidizable Cys residues, the peptide was stored lyophilized in its zinc-bound form. Peptide concentration was calculated at 280 nm using an extinction coefficient of 5700 M−1cm−1.
Temperature- and peptide-mediated hybridization assays were performed with 150 nM of labeled cTAR and 225 nM of dTAR.
Electrospray ionization mass spectrometry
ESI-MS spectra were obtained on an electrospray—time-of-flight mass spectrometer (LCT, Micromass, Manchester, UK) in negative ionization mode. Oligonucleotides were desalted before injection as previously described (Potier et al., 1994). Samples at a final concentration of 2 μM were dissolved in aqueous 50% acetonitrile (v/v) solution containing 0.5% triethylamine and continuously injected into the mass spectrometer at a flow rate of 4 μl/min. The extraction cone voltage was set to 20 V to avoid fragmentation. Calibration was performed using the multiply charged ions produced by a separate injection of a synthetic 20-nt oligonucleotide.
The Maximum Entropy program (Masslynx software, Micromass ) was used to reconstitute a real mass scale spectrum from a multiply charged ion mass spectrum (Fig. 2 b). This data treatment allows us to separate overlapping peaks depending on the signal-to-noise ratio, the peak width, the separation between the peaks, and their intensity ratio. It was used to calculate the mass intensity ratios between singly and doubly labeled cTAR derivatives.
FIGURE 2.
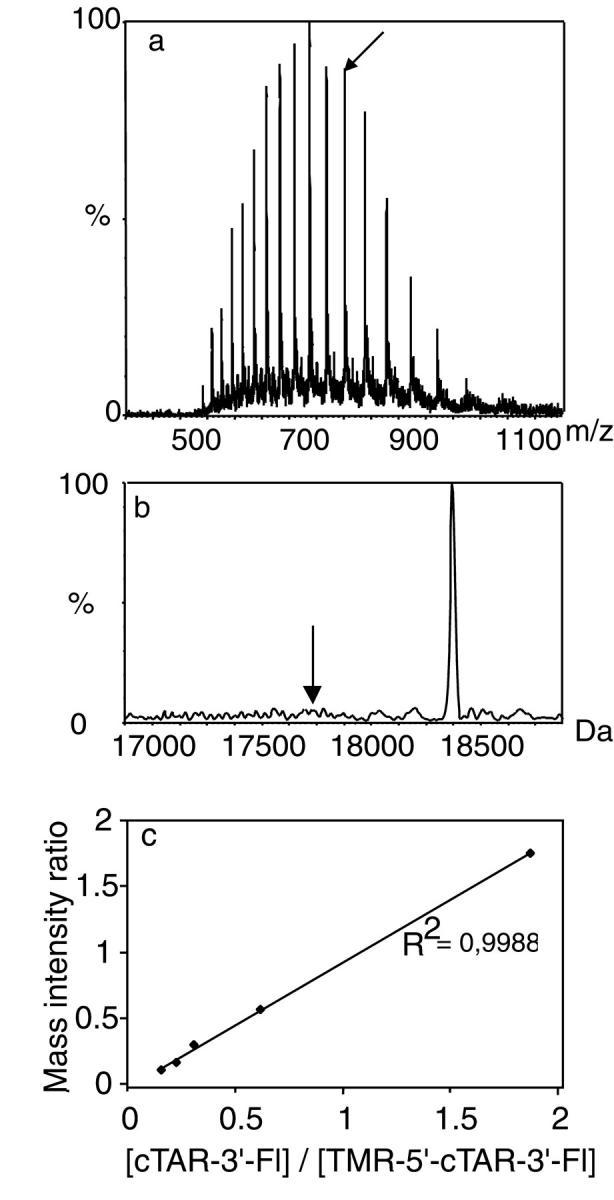
ESI MS of TMR-5′-cTAR-3′-Fl. (a) Multiply charged ion mass spectrum of TMR-5′-cTAR-3′-Fl dissolved in aqueous 50% acetonitrile solution containing 0.5% TEA The arrow designates the 23-charged state ion of TMR-5′-cTAR-3′-Fl. (b) Real mass scale spectrum. This spectrum was obtained after application of the maximum entropy program. The arrows designate the position of the singly labeled cTAR-3′-Fl derivative. (c) Relative dependence of the mass intensity ratios on the concentration ratios of singly to doubly labeled cTAR derivatives.
Spectrophotometric measurements
Absorption spectra were recorded on a Cary 400 spectrophotometer equipped with a Peltier thermostated cell holder. Fluorescence excitation and emission spectra were recorded at 20.0 ± 0.5°C on an SLM 48000 spectrofluorometer. The excitation and emission bandwidths were 4 nm and 8 nm, respectively. Melting curves were recorded by following the temperature dependence of the absorbance or fluorescence changes at the indicated wavelengths. The temperature was measured with a thermocouple inserted in the cell. The melting curves were fitted assuming a two-state model (Cantor and Schimmel, 1980) by:
 |
(1) |
where Smin and Smax are the signal (absorbance or fluorescence) of the native and the melted oligonucleotides, respectively; Tm, the melting temperature; ΔH°, the enthalpy change; and R, the gas constant.
Time-resolved fluorescence measurements were performed at 20°C with a time-correlated, single-photon counting technique using the stable excitation pulses provided by a pulse-picked frequency tripled Ti-sapphire laser (Tsunami, Spectra Physics, Mountain View, CA) pumped by a Millenia X laser (Spectra Physics) as described (Bernacchi et al., 2002). Time-resolved data analysis was performed using the maximum entropy method and the Pulse5 software (Brochon, 1994; Livesey and Brochon, 1987). For the analysis of the fluorescence decay, a distribution of 200 equally spaced lifetime values on a logarithmic scale between 0.01 ns and 20 ns, was used. In all cases, the χ2 values were close to 1.0, and the weighted residuals as well as the autocorrelation of the residuals were randomly distributed around zero indicating an optimal fit.
RESULTS
Electrospray ionization mass spectrometry of the labeled oligonucleotides
Because the labeling degree is a critical parameter in the characterization of the spectroscopic properties of labeled oligonucleotides, we carefully checked the purity of the doubly labeled oligonucleotides used in this study by electrospray ionization mass spectrometry (ESI MS). The mass spectrum of TMR-5′-cTAR-3′-Fl, a cTAR sequence labeled in 5′ by TMR and in 3′ by Fl, is given in Fig. 2 a. A single series of multiply charged ions is observed giving rise to a measured molecular mass of 18,461 ± 2 Da, in excellent agreement with the expected mass. No signal corresponding to singly labeled or unlabeled oligonucleotide was detected as shown in Fig. 2 b after application of the maximum entropy algorithm. Because synthesis of the oligonucleotides started from the 3′-end, the most likely contamination would come from the singly labeled cTAR-3′-Fl oligonucleotide. To evaluate whether ESI-MS could provide quantitative data on the possible contamination with cTAR-3′-Fl, mixtures of singly and doubly labeled cTAR were analyzed by ESI-MS (Fig. 3 c). Concentration ratios from 0.1 to 1.8 were investigated under identical mass measurement conditions. As expected from the similar physical and chemical properties of the two oligonucleotides, an excellent correlation between ion intensity and concentration ratio was observed (Fig. 2 c), indicating that a quantitative answer can be obtained. Accordingly, considering the linearity of the ESI-MS response and the good signal-to-noise ratio, we conclude that a signal corresponding to the singly labeled TAR would be detected down to 5%. Therefore, a purity greater than 95% could be inferred for TMR-5′-cTAR-3′-Fl. A similar conclusion was obtained for the doubly labeled cTARC12 sequence (Fig. 1 a).
FIGURE 3.

Spectral properties of the singly and doubly labeled cTAR derivatives. (a) Absorption spectra of TMR-5′-cTAR-3′-Fl (solid line), TMR-5′-cTARC12-3′-Fl (dotted line), and an equimolecular mixture of TMR-5′-cTAR and cTAR-3′-Fl (dashed line) at pH 7.5. The crosses describe the fit of TMR-5′-cTAR-3′-Fl spectrum with Eq. 2 and the parameters given in the text. The inset shows the absorption spectra of TMR-5′-cTARC12-3′-Fl (dotted line) and an equimolecular mixture of TMR-5′-cTAR and cTAR-3′-Fl (dashed line) at pH 8.7 (b) Emission spectra. The meaning of the different lines is the same as described in (a) above. The dash-dotted line corresponds to the TMR-5′-cTAR spectrum. Due to the low concentration of the oligonucleotides in the mixture of singly labeled oligonucleotides, no intermolecular FRET could occur. Excitation wavelength was 450 nm. The inset shows the emission spectra recorded with an excitation wavelength of 550 nm. (c) Excitation spectra. The meaning of the different lines is the same as described in (a) above. The emission wavelength was 585 nm. The oligonucleotide concentration was 150 nM in each case.
Evidence of ground-state heterodimer formation in the doubly labeled cTAR derivative
As a first step, we investigated the absorption properties of TMR-5′-cTAR-3′-Fl. The absorption spectrum of this doubly labeled species clearly differed from the spectrum of an equimolecular mixture of cTAR 5′-labeled with TMR (TMR-5′-cTAR) and cTAR 3′-labeled with Fl (cTAR-3′-Fl) (Fig. 3 a). Indeed, the Fl absorption peak of the mixture of singly labeled derivatives is shifted to the red by 4 nm and its absorbance is decreased by ∼20% as compared to the corresponding peak of TMR-5′-cTAR-3′-Fl. An opposite trend is observed with the TMR peak, because its absorption maximum in the mixture of singly labeled derivatives is shifted to the blue by 4 nm and its absorbance is increased by ∼50%. These dramatic changes in the absorption spectra are clearly incompatible with a Förster-type FRET mechanism because the weak dipolar coupling that governs this mechanism, does not induce any change in the absorption spectrum (Kasha, 1963). In contrast, these spectral changes are similar to those previously described in molecular beacons (Bernacchi and Mely, 2001; Tyagi et al., 1998) or doubly labeled protease substrates (Packard et al., 1996; Packard et al., 1998), and may thus, be described by the molecular exciton model. This model relies on the formation of an intramolecular ground state heterodimer between the two dyes. This allows a strong coupling between the transition dipoles of the two dyes, which causes the delocalization of excitation over the two dyes (Kasha, 1963; Kasha, 1991; Scholes and Ghiggino, 1994). It follows that the spectral properties can no more be ascribed to the individual dyes but correspond to a unique optical signature of the heterodimer.
Nevertheless, because the shape of the TMR-5′-cTAR-3′-Fl absorption spectrum differs not so much from that of the mixture of singly labeled derivatives, it was appealing to check if TMR-5′-cTAR-3′-Fl absorption spectrum may correspond to a combination of the spectra of the singly labeled derivatives if the latter were allowed to shift. To this end, after conversion of the spectra in wavenumbers, we used the following equation:
 |
(2) |
where A, AFl, and ATMR are the absorbances at a given wavenumber of the same concentration of doubly labeled, Fl-labeled and TMR-labeled cTAR molecules. The spectral shifts,  and
and  were varied step by step and the linear coefficients, αFl and αTMR, were calculated for each step to minimize the sum of the quadratic deviations between the experimental spectrum of TMR-5′-cTAR-3′-Fl and the linear combination of the singly labeled derivatives. An excellent fit was obtained by using αFl = 0.70, αTMR = 0.34,
  = −80 cm−1, and
  = 140 cm−1 (Fig. 3 a). Accordingly, this procedure allows us to precisely determine the spectral shifts as well as the true variations of the Fl and TMR peak intensities associated with the heterodimer formation.
In a next step, to investigate the relationship between the heterodimer formation and the structure of the terminal part of cTAR stem, we recorded the absorption spectrum of a doubly labeled cTAR mutant (cTARC12) from which the two terminal segments are absent (Fig. 1 a). While the TMR peak of TMR-5′-cTARC12-3′-Fl was similar in both position and intensity to that of the mixture of singly labeled derivatives (Fig. 3 a), the Fl peak was close to the corresponding peak of TMR-5′-cTAR-3′-Fl, suggesting that heterodimers may also form in TMR-5′-cTARC12-3′-Fl. However, due to the differences in base composition between cTAR and cTARC12, this last conclusion is not straightforward. Indeed, the absorption properties of Fl bound to oligonucleotides have been shown to depend on the base composition (Sjoback et al., 1998) because the interaction of Fl with the bases may modify its pKa value and thus, the proportions of its monoanion and dianion forms. To check the influence of this parameter, the spectra of TMR-5′-cTARC12-3′-Fl and the mixture of singly labeled derivatives were recorded at a pH value of 8.7, where in principle only the more strongly absorbing dianion may be present (Sjoback et al., 1998). At this pH value, the two spectra became almost indistinguishable (Fig. 3 a, inset) suggesting that the pKa of Fl may be lower in TMR-5′-cTARC12-3′-Fl than in TMR-5′-cTAR-3′-Fl and thus, that Fl interacts less with the C residues of cTARC12 than with the terminal residues of cTAR. Moreover, the similarity of the spectra at pH 8.7 further suggests that only a limited population of TMR-5′-cTARC12-3′-Fl molecules may form heterodimers and thus, that the terminal segments of cTAR stem are critical for the formation and the stability of the heterodimer.
Steady-state fluorescence properties of the doubly labeled cTAR derivatives
To further characterize the spectroscopic properties of TMR-5′-cTAR-3′-Fl, its fluorescence spectrum was recorded with an excitation wavelength of 450 nm to keep the direct excitation of TMR to a minimum (Fig. 3 b). A dramatic decrease of Fl fluorescence peak could be observed from comparison with the spectrum of the equimolecular mixture of singly labeled derivatives. Due to the spectral overlap between the emission of Fl and TMR, the TMR-5′-cTAR-3′-Fl spectrum was further compared to the spectrum of the isolated TMR-5′-cTAR spectrum to estimate the TMR fluorescence change. A 2.5-fold increase was observed for the doubly labeled derivative as compared to TMR-5′-cTAR. Both the Fl fluorescence decrease and the TMR fluorescence increase suggest that FRET may be observed for a fractional population of the TMR-5′-cTAR-3′-Fl molecules. Because the calculated Förster distance, R0, for the (Fl, TMR) couple is ∼60 Å (Bernacchi et al., 2002) and because the fluorescence of the donor could only be detected if the distance to the acceptor exceeds R0/2 (Lakowicz, 1999), it results that the observed FRET may be related to partially melted oligonucleotide species. Interestingly, a much larger increase (17-fold) of the TMR fluorescence was observed for TMR-5′-cTARC12-3′-Fl, despite only a limited decrease (2.3-fold) of the Fl fluorescence peak, suggesting that a larger population of this derivative may be subjected to FRET.
In a second step, the emission spectra have been recorded with an excitation wavelength of 550 nm, where only TMR absorbs. The observation with TMR-5′-cTAR-3′-Fl of a spectrum characteristic of TMR (Fig. 3 b, inset) is in further agreement with a significant population of melted species where direct excitation of TMR is possible. Surprisingly, the area of the TMR-5′-cTAR-3′-Fl fluorescence spectrum represents as much as 43% of the corresponding area of the same concentration of the singly labeled TMR-5′-cTAR species, but only 23% of the corresponding area of the same concentration of TMR-5′-cTARC12-3′-Fl. These results may be rationalized by the fact that TMR covalently bound to DNA has been shown to be in equilibrium between a highly fluorescent solvent-exposed population and a weakly fluorescent population where TMR is stacked with G bases (Edman et al., 1996). It follows that the rather low fluorescence of TMR-5′-cTAR as compared to TMR-5′-cTARC12-3′-Fl may be related to the higher probability of TMR to stack with the G-rich terminal double-stranded segments of TMR-5′-cTAR than with the C-rich single-stranded segment to which TMR is bound in TMR-5′-cTARC12-3′-Fl. Because it is likely that only the melted TMR-5′-cTAR-3′-Fl species are fluorescent, the comparison with TMR-5′-cTARC12-3′-Fl is more straightforward and we may thus infer that ∼23% of the TMR-5′-cTAR-3′-Fl species are in a partially melted form.
In contrast to the absorption spectra, the shape of the excitation spectra of TMR-5′-cTAR-3′-Fl, TMR-5′-cTARC12-3′-Fl and the mixture of the two singly labeled derivatives were similar when monitoring the emission at 585 nm (Fig. 3 c). This suggests that the heterodimers in TMR-5′-cTAR-3′-Fl and TMR-5′-cTARC12-3′-Fl may not be fluorescent, or only weakly fluorescent, and that the observed fluorescence mainly originates from melted oligonucleotides with distantly separated Fl and TMR dyes. Because the spectra are recorded at the TMR emission band, the differences in the amplitude of the three spectra (Fig. 3 c) are fully consistent with the differences observed in the emission spectra (Fig. 3 b, inset).
Time-resolved fluorescence properties of the doubly labeled cTAR derivatives
The time-resolved fluorescence properties of Fl in TMR-5′-cTAR-3′-Fl and cTAR-3′-Fl derivatives are reported in Table 1. The most important feature is that in contrast to the large ratio in their steady-state fluorescence intensities, the lifetimes of the two species differed by only a factor of three (Table 1). This suggests the presence of dark species representing ∼80% of the TMR-5′-cTAR-3′-Fl molecules in solution and likely corresponding to closed cTAR species with the two dyes packed close together in a heterodimer conformation. Moreover, because the three measurable lifetimes of TMR-5′-cTAR-3′-Fl are significantly shorter than the major lifetime of cTAR-3′-Fl, the corresponding species may be attributed to partially melted species with interchromophore distances large enough to allow the FRET mechanism to occur. Interestingly, the percentage (∼20%) of melted species is in excellent agreement with the percentage (23%) inferred from TMR emission (Fig. 3 b, inset).
TABLE 1.
Time-resolved fluorescence parameters of singly and doubly labeled cTAR derivatives
| T (°C) | α0 | τ1 (ns)* | α1* | τ2 (ns)* | α2* | τ3 (ns)* | α3* | 〈τ〉 (ns)* | |
|---|---|---|---|---|---|---|---|---|---|
| cTAR-3′-Fl | 20 | 2.00(±0.10) | 0.15(±0.01) | 4.28(±0.02) | 0.85(±0.01) | 3.94(±0.02) | |||
| 60 | 2.00(±0.20) | 0.23(±0.04) | 4.00(±0.05) | 0.77(±0.03) | 3.54(±0.01) | ||||
| TMR-5′-cTAR-3′-Fl | 20 | 0.12(±0.01) | 0.56(±0.04) | 1.24(±0.05) | 0.17(±0.03) | 3.85(±0.06) | 0.27(±0.02) | 1.30(±0.10) | |
| 0.80† | 0.12† | 0.03† | 0.05† | ||||||
| 60 | 1.80(±0.10) | 0.27(±0.04) | 3.47(±0.05) | 0.73(±0.04) | 3.02(±0.01) | ||||
| TMR-5′-cTARC12-3′-Fl | 20 | 0.21(±0.02) | 0.21(±0.03) | 1.11(±0.04) | 0.62(±0.07) | 3.50(±0.10) | 0.17(±0.02) | 1.33(±0.02) | |
| 60 | 1.90(±0.30) | 0.18(±0.09) | 3.50(±0.10) | 0.82(±0.10) | 3.21(±0.02) | ||||
| TMR-5′-cTAR-3′-Fl+dTAR‡ | 20 | 0.13(±0.04) | 0.14(±0.04) | 1.60(±0.50) | 0.13(±0.05) | 4.04(±0.08) | 0.73(±0.09) | 3.20(±0.10) | |
| cTAR-3′-Fl + dTAR‡ | 20 | 0.09(±0.01) | 0.16(±0.02) | 1.33(±0.08) | 0.09(±0.01) | 4.19(±0.02) | 0.75(±0.02) | 3.28(±0.06) |
The fluorescence lifetimes, τ1 to τ3 the relatives amplitudes, α1 to α3 and the mean lifetime 〈τ〉, are expressed as means ± standard error of the mean for three experiments. The width of the distribution associated with each lifetime was found to be narrow in each condition, being less than 20% of lifetime value. The mean lifetime was calculated by: 〈τ〉 = Σαiτi.
The relative amplitude, α0 of the dark species in TMR-5′-cTAR-3′-Fl derivative is calculated by: α0 = 1 − 〈τ〉Fl/(〈τ〉mes × R′), where 〈τFl〉 is the mean lifetime of cTAR-3′-Fl at 20°C, 〈τmes〉 is the measured mean lifetime of TMR-5′-cTAR-3′-Fl at 20°C and R′ is the ratio between the steady state fluorescence of cTAR-3′-Fl and TMR-5′-cTAR-3′-Fl. The remaining amplitudes αic were calculated according to: αic = αi(1 − α0).
The duplexes of TMR-5′-cTAR-3′-Fl and cTAR-3′-Fl derivatives with their complementary sequence, dTAR, were mediated by temperature.
In contrast to TMR-5′-cTAR-3′-Fl, the Fl dye of TMR-5′-cTARC12-3′-Fl exhibits a more “canonical” behavior because the ratio of its mean lifetime to that of cTAR-3′-Fl is fully consistent with the corresponding steady-state fluorescence intensity ratio. It follows that no dark species are inferred for this derivative. The fluorescence decay of TMR-5′-cTARC12-3′-Fl is characterized by three lifetimes. Because the heterodimers, if any, are probably only weakly fluorescent, it necessarily follows that both the intermediate and long-lived lifetimes may correspond to species where FRET occurs. This conclusion is strengthened by the fact that, as expected from FRET, both lifetimes are significantly shorter than the major lifetime of cTAR-3′-Fl.
Temperature dependence of the spectroscopic properties of the doubly labeled cTAR derivatives
To interpret the data with the doubly labeled cTAR derivatives, it was necessary to first analyze the behavior of the corresponding singly labeled derivatives. Heating of cTAR-3′-Fl induces a strong decrease of the absorbance peak of Fl (Fig. 4 a). This decrease that amounts to ∼30% at 70°C, could be readily explained by the sensitivity of the oligonucleotide-bound Fl absorbance to pH changes (Sjoback et al., 1998) induced by heating the Tris buffer. Indeed, the pH of this buffer is highly sensitive to the temperature, showing a −0.031pH change per degree (Good and Izawa, 1972). In contrast, heating of TMR-5′-cTAR induces no significant absorbance change but only a 3 nm blue shift (Fig. 4 a, inset).
FIGURE 4.

Temperature dependence of the absorbance spectra of the singly and doubly labeled cTAR derivatives. Absorption spectra of cTAR-3′-Fl (a), TMR-5′-cTAR (a, inset), TMR-5′-cTAR-3′-Fl (b), and TMR-5′-cTARC12-3′-Fl (d). The absorption spectra were recorded at 20, 30, 35, 40, 50, 60, 65, and 70°C. (c) Melting curves of TMR-5′-cTAR-3′-Fl. The melting curves are based on the absorbance changes monitored either at the Fl (•) or TMR (▪) peak or at 260 nm (▴). The melting curve of TMR-5′-cTARC12-3′-Fl (▾) is based on the absorbance changes at the Fl peak. The absorbance changes at the Fl peak in doubly labeled derivatives were corrected for the intrinsic sensitivity of Fl to the temperature (as deduced from the cTAR-3′-Fl derivative).
Heating of TMR-5′-cTAR-3′-Fl induces a dramatic 6 nm blue shift of the TMR peak accompanied by an ∼35% increase of its absorbance (Fig. 4 b). In parallel, we observe a slight 3 nm red shift of the Fl peak accompanied by an ∼50% decrease of its absorbance. Because a clear isosbestic point is observable at 511 nm, a two-state model may be used to describe the temperature dependence of the exciton interaction (Cohen and Fisher, 1962). Accordingly, the absorbance changes of Fl and TMR plotted as a function of the temperature were fitted using Eq. 1 (Fig. 4 c). The absorbance changes of Fl were corrected for the above-mentioned intrinsic pH-dependent absorbance changes of Fl. The fit of both Fl and TMR data provided very similar melting temperatures and enthalpy energies (Table 2), confirming that the two peaks monitor the same mechanism.
TABLE 2.
Thermodynamic and spectroscopic parameters associated with the melting of the doubly labeled derivatives
In clear contrast to TMR-5′-cTAR-3′-Fl, heating of TMR-5′-cTARC12-3′-Fl (Fig. 4 d) induces no absorbance changes of the TMR peak but only a 3 nm blue shift, characteristic of the intrinsic temperature sensitivity of TMR. Similarly, the temperature-induced shift and absorbance changes of the Fl peak are close to those of the singly labeled cTAR-3′-Fl derivative. This further confirms that the population of TMR-5′-cTARC12-3′-Fl ground state heterodimer may be small at 20°C.
In a further step, the temperature dependence of the fluorescence spectra of the various derivatives was monitored. For the two singly labeled TMR-5′-cTAR and cTAR-3′-Fl derivatives, a significant decrease of the fluorescence intensity but no shift of the maximum emission wavelength were evidenced when the samples were heated (Fig. 5 a and inset). Heating of TMR-5′-cTAR-3′-Fl induces a dramatic increase of the Fl intensity up to 53°C, followed by a slight decrease at higher temperatures (Fig. 5 b). In contrast, only minor changes of TMR fluorescence are observable. This is in sharp contrast with TMR-5′-cTARC12-3′-Fl where the Fl intensity increase is accompanied by a parallel decrease of TMR fluorescence (Fig. 5 c). These data confirm that in opposition to TMR-5′-cTARC12-3′-Fl, FRET does not constitute the major mechanism for the spectral properties of TMR-5′-cTAR-3′-Fl.
FIGURE 5.

Temperature dependence of the emission spectra of the singly and doubly labeled derivatives. Emission spectra of cTAR-3′-Fl (a), TMR-5′-cTAR (a, inset), TMR-5′-cTAR-3′-Fl (b), and TMR-5′-cTARC12-3′-Fl (c). The emission spectra were recorded at 20, 30, 35, 40, 45, 53, 58 and 65°C. Both the Fl fluorescence of cTAR-3′-Fl and the TMR fluorescence of TMR-5′-cTAR decrease with temperature. Due to the intrinsic temperature dependence of Fl emission, the Fl peak of the two doubly labeled derivatives was found to increase up to 53°C and then, decrease at higher temperatures. (d) Melting curves of TMR-5′-cTAR-3′-Fl (▪) and TMR-5′-cTARC12-3′-Fl (•). The melting curves were based on the fluorescence changes of the Fl peak corrected for the intrinsic temperature dependence of Fl emission.
The Fl intensity, corrected for the intrinsic temperature dependence of Fl, of the two doubly labeled derivatives was then reported as a function of the temperature (Fig. 5 d). The melting temperature, Tm, and the enthalpy energy change, ΔH°, determined by fitting the Fl intensity changes of TMR-5′-cTAR-3′-Fl to Eq. 1 were intermediate to the corresponding parameters determined from the Fl or TMR absorbance changes and those from the absorbance changes at 260 nm (Table 2). Similarly, the Tm and ΔH° values inferred from the Fl intensity changes of TMR-5′-cTARC12-3′-Fl were significantly lower than the corresponding parameters obtained from the absorbance changes at 260 nm.
Moreover, the melting of cTAR-3′-Fl by temperature induces a small decrease of the long-lived lifetime and a minor decrease of its relative amplitude to the benefit of the short-lived lifetime (Table 1). Melting of TMR-5′-cTAR-3′-Fl and TMR-5′-cTARC12-3′-Fl by temperature induces the disappearance of the dark species and the short-lived component, strongly suggesting that they characterize closed or partly melted species. Because the two remaining lifetimes were shorter than the corresponding ones in cTAR-3′-Fl, this suggests that FRET could still be observed in the melted species. Furthermore, the similarities of the time-resolved parameters of TMR-5′-cTAR-3′-Fl and TMR-5′-cTARC12-3′-Fl at 60°C indicate that the final melted species of both derivatives are similar.
Use of the doubly labeled cTAR derivative to monitor oligonucleotide annealing
The hybridization of TMR-5′-cTAR-3′-Fl with dTAR, the unlabeled DNA equivalent of TAR was first mediated by heat in the presence of 1M NaCl. The experiment was performed in a two-compartment quartz cell. TMR-5′-cTAR-3′-Fl was introduced in the first compartment and a 1.5-fold excess of dTAR was introduced in the second one. The absorption spectrum was first recorded at 20°C (Fig. 6 a). The absorbance ratio of the Fl to TMR peak (1.48) is significantly higher than the 1.13 ratio observed at low salt concentration, suggesting that as previously described for isolated chromophores in solution (Valdes-Aguilera and Neckers, 1989) the heterodimer may be favored by high salt concentration. The content of the compartments was then heated to 70°C, mixed and cooled down to 20°C. Both the positions and the intensities of the Fl and TMR peaks in the resulting spectrum were shifted to values characteristic of an equimolecular mixture of TMR-5′-cTAR and cTAR-3′-Fl. The hybridization of TMR-5′-cTAR-3′-Fl with dTAR induces also a dramatic 8.6-fold increase in the fluorescence of Fl. To determine if part of this fluorescence change may be due to Fl environmental changes associated with the stem loop to duplex transition, we monitored the fluorescence changes associated with the annealing of cTAR-3′-Fl with dTAR in the same conditions. A decrease of ∼19% of Fl intensity was found to accompany the annealing process. Time-resolved measurements revealed that this decrease was associated with the appearance of a short-lived lifetime (90 ps) that represents ∼16%. This short-lived lifetime may be due to an efficient nonradiative pathway in the conformations where Fl interacts with the additional basepairs (as compared to the stem-loop) of the duplex. Taking into account this effect on Fl, the true fluorescence increase associated with the formation of the duplex is ∼10.4 (Fig. 6 b), which is close to the fluorescence ratio between cTAR-3′-Fl and TMR-5′-cTAR-3′-Fl. Moreover, the similarity of the decay parameters of the duplexes formed with either TMR-5′-cTAR-3′-Fl or cTAR-3′-Fl (Table 1) further suggests that the environment of Fl is similar in both duplexes and that FRET is no more observed with the doubly labeled cTAR derivative. This indicates that the amount of unreacted free TMR-5′-cTAR-3′-Fl may be small and that the interchromophore distance may be larger than 2R0, i.e., 120 Å, in the duplex. This last conclusion was expected because the theoretical distance between the two extremities of a duplex of 55 basepairs is ∼190 Å (Cantor and Schimmel, 1980) .
FIGURE 6.

Temperature- and NC(12-55)-mediated annealing of TMR-5′-cTAR-3′-Fl with its complementary sequence, dTAR. (a) Absorption spectra. The dotted and dashed lines correspond to the spectra of TMR-5′-cTAR-3′-Fl and dTAR in the presence of 1M NaCl recorded before and after mixing and applying the temperature cycle, respectively. The solid and dash-dotted lines correspond to the spectra of TMR-5′-cTAR-3′-Fl, dTAR and NCp7 recorded before and after mixing, respectively. (b) Emission spectra. The meaning of the lines is as described in (a) above. Excitation wavelength was 450 nm. The emission spectra before mixing are superimposable. The spectra after mixing were corrected as described in the text.
In a second step, the annealing of TMR-5′-cTAR-3′-Fl with dTAR was mediated by NC(12-55) at a ratio of five nucleotides per peptide. This experiment was performed at 20°C, in a low salt-containing buffer. The resulting absorption spectrum was similar to that of the mixture of singly labeled sequences (Fig. 6 a). However, the 0.77 absorbance ratio of the Fl to TMR peak for the peptide-mediated duplex was slightly higher than the corresponding 0.72 ratio for the mixture of singly labeled derivatives. If we admit that the percentage of annealed species is proportional to the changes of this ratio, we can deduce that more than 80% of the TMR-5′-cTAR-3′-Fl molecules are annealed with dTAR in the presence of the peptide. Moreover, the NCp7-mediated annealing increases the Fl fluorescence by a factor of 6.9. Again, to evaluate the environmental changes of Fl associated both with the stem loop to duplex transition and the binding of NCp7, we monitored the NCp7-mediated annealing of cTAR-3′-Fl with dTAR in the same conditions. A fluorescence decrease of 18% was associated to the annealing process. This percentage is similar to the one obtained in the heat-mediated annealing, suggesting that NC(12-55) only slightly modifies the environment of Fl in these conditions. Taking into account this effect on Fl, we inferred an 8.5-fold increase associated with the formation of the duplex (Fig. 6 b). This percentage is close to the one observed in the heat-mediated annealing process and confirms the protein efficiency in promoting duplex formation (Berkhout et al., 2001; Guo et al., 1997; Lapadat-Tapolsky et al., 1995; Rein et al., 1998).
DISCUSSION
In this work, the spectroscopic properties of a stem-loop structure, cTAR, doubly labeled by the (Fl, TMR) couple frequently used in FRET applications have been investigated. The absorption spectrum of this derivative clearly differed from that of an equimolecular mixture of singly labeled species as well as from the spectrum of TMR-5′-cTARC12-3′-Fl, a cTAR derivative in which the terminal part of the stem is melted. Because an essential feature of Förster theory is spectral independence of the two dyes, it follows that our results are in contradiction with a pure FRET mechanism wherein the absorption spectrum of the doubly labeled species would be the sum of its component spectra. Moreover, if only FRET would be operative between the two fluorophores, the emission of the acceptor must decrease when the acceptor is moved away from the donor. This is clearly not the case because no strong TMR fluorescence change accompanies the dramatic Fl intensity increase when TMR-5′-cTAR-3′-Fl was melted by temperature or annealed with the complementary sequence, dTAR. In contrast, parallel fluorescence changes of Fl and TMR were clearly observed with the melting of TMR-5′-cTARC12-3′-Fl. Taken together, our data strongly suggest that as for the (Rh6G, Dabcyl) couple (Bernacchi and Mely, 2001), the Fl and TMR dyes form a ground state heterodimer that may be described by the molecular exciton model. Such a heterodimer between Fl and TMR has also been reported for a doubly labeled protease substrate (Packard et al., 1998). Moreover, changes in the absorption spectra associated with the opening of hairpin-shaped oligonucleotides doubly labeled with the same couple have been previously described (Tyagi et al., 1998) but not interpreted.
Because no (or only a limited population of) heterodimers were observed with TMR-5′-cTARC12-3′-Fl, it follows that the terminal double-stranded segments of cTAR seem to play a critical role in the formation and stability of the heterodimer. This result is in contrast with the recently reported heterodimer between Fl and BHQ1 in a doubly labeled 25-nt oligonucleotide with no stem structure (Johansson et al., 2002). Because this heterodimer was suggested to result from the increase of the effective concentration of the two labels above their aggregation concentration, our results suggest that the affinity of Fl may be lower for TMR than for BHQ1. Similarly, a correlation between the dimerization constant of dyes in solution and their ability to form dimers in doubly labeled derivatives has been proposed for protease inhibitors homo-doubly labeled by various chromophores (Packard et al., 1997). Accordingly, we infer that the terminal segments of cTAR are required to keep the dyes at a sufficiently small distance to increase the local concentration of the dyes above the threshold concentration required for their association.
Both the spectral shifts and intensity changes of the Fl and TMR absorption peaks of TMR-5′-cTAR-3′-Fl (as compared to an equimolecular mixture of TMR-5′-cTAR and cTAR-3′-Fl) are fully consistent with an H-type geometry, in which the transition dipoles of the individual chromophores are parallel to each other and normal to the radius vector connecting them (Kasha, 1963; Packard et al., 1998). Moreover, from the time-resolved fluorescence parameters of TMR-5′-cTAR-3′-Fl, it can be additionally inferred that the heterodimer is either not fluorescent or characterized by a lifetime smaller than the 20 ps resolution of our device. This conclusion is consistent with the fact that in H-type heterodimers, a rapid internal conversion occurs after excitation and populates the lower excitation state, from which radiative transitions to the ground state are forbidden (Fig. 7) (Kasha et al., 1965).
FIGURE 7.

Energy diagram for the (Fl, TMR) heterodimer in TMR-5′-cTAR-3′-Fl. The energies associated with the transitions (between the ground and excited states) in the singly labeled derivatives are designated by EFl and ETMR. Interaction between the Fl and TMR dyes in the heterodimer results in splitting of the excited state. For H-type heterodimer, only excitation to the exciton state of highest energy is allowed. Rapidly, the excited heterodimer returns to its low-level nonfluorescent state. The energy difference between the two split excited states is  where EFl and ETMR are calculated by 100
  , where
  designate the wavenumbers (in cm−1) of the two monomeric peaks at their maximum.
Because the excitation is delocalized in the heterodimer, it follows that its absorption spectrum does not correspond to the sum of the monomer spectra. However, we evidenced that the heterodimer spectrum may be described by a linear combination of the monomer spectra if the latter were allowed to shift. By determining these shifts, it was then possible to calculate the interchromophore distance in the heterodimer. The energy difference, ΔE, between the two split excited states in an H-type heterodimer is given by:
 |
(3) |
where  designate the wavenumbers (in cm−1) of the two monomeric peaks at their maximum (Packard et al., 1998). Moreover, ΔE is calculated by:
 |
(4) |
where  corresponds to the spectral shifts of the Fl and TMR peaks determined from Eq. 2. Finally, U designates the interaction energy between the dipole moments and may be approximated by:
 |
(5) |
where R is the distance between the point-dipole systems, ɛ0, the vacuum permittivity, μX, the module of the transition dipole of Fl or TMR, n, the solvent refractive index (n = 1.333 in water) and κ, the orientation factor (κ = 1 for an H-type geometry) (Packard et al., 1996). The module of the transition dipole, expressed in C.m is calculated by:
 |
(6) |
where  corresponds to the extinction coefficient of the dye at a given wavenumber. The integral for the lowest energy transition of the dye is calculated from the absorption band in the visible range. Values of 2.9 × 10⁻²⁹ and 3.1 × 10⁻²⁹ C.m were obtained for μFl and μTMR, respectively. Moreover, by combining Eq. 3 and 4, a value of 9.9 × 10⁻²¹ J was obtained for U. By substituting these values in Eq. 5, an interchromophore distance of 7.7 Å was obtained. This value is slightly larger than the distance of 5.7 Å previously measured between the two TMR dyes in TMR-5′-TARm-3′-TMR (Bernacchi and Mely, 2001). This difference may partly be attributed to the substitution in TARm of the terminal bulge loop of the stem by a basepair that may confer a higher stability to its secondary structure (as compared to cTAR) and thus hold the two chromophores closer together.
In principle, as it could be seen from Eq. 5, the interaction energy and thus, the spectral changes are proportional to R−3. However, the presence of an isosbestic point in the dependence of the absorption spectra of TMR-5′-cTAR-3′-Fl as a function of temperature, strongly suggests that the melting of the oligonucleotide follows a two-state model (Cohen and Fisher, 1962) with regard to the heterodimer formation. This clearly excludes either a continuous increase of the interchromophore distance with temperature or accumulation of discrete intermediates with a different interchromophore distance or geometry than in the folded state. This all-or-none behavior of heterodimer formation is reminiscent of the homodimer behavior in TMR-5′-TARm-3′-TMR (Bernacchi and Mely, 2001), and may be related to the exact quantum mechanical resonance which is required for the exciton interaction to operate (Kasha, 1991). Because the spectral changes associated to the exciton coupling are thought to vanish as soon as the heterodimer dissociates and because FRET is usually applicable when the interchromophore distance is within a factor of 2 of the Förster critical distance, R0, (Lakowicz, 1999), this further suggests that exciton coupling and FRET are complementary, allowing the investigation of nonoverlapping distances with the same pair of chromophores (Bernacchi and Mely, 2001). The complementary use of the two signals is exemplified by the temperature-mediated melting of TMR-5′-cTAR-3′-Fl. Indeed, due to its sensitivity to very short distances (Bernacchi and Mely, 2001), the absorbance signal associated with the heterodimer may essentially rely on the breakage or formation of the terminal basepair or short double-stranded segment. In keeping with this hypothesis, rather low Tm and ΔH° values were inferred from the temperature dependence of this signal. In contrast, due to the dependence of the FRET signal on R0, the fluorescence signal is probably sensitive to a more extended melting of the stem and thus, its temperature dependence provides higher Tm and ΔH° values. It is likely that these increased values may notably be related to the contribution of the long central segment (composed of eight basepairs) of cTAR that is expected to be more stable than the short terminal segments. Still higher Tm and ΔH° values were obtained when the absorption of the bases was followed at 260 nm. The differences with the parameters derived from Fl fluorescence may stem from differences in the contribution of the various cTAR segments to the two signals. Because the absorbance at 260 nm is sensitive to the regular side-by-side interactions between the stacked bases of the stem, it is expected that all basepairs contribute nearly to the same extent to the signal and thus, that the signal may be dominated by the contribution of the long central cTAR segment. In contrast, according to the dependence of Fl fluorescence on the interchromophore distance, the melting of two short terminal segments contributes much more strongly to Fl fluorescence than to absorbance changes and may thus explain the observed decrease in the thermodynamic parameters. Accordingly, the excitonic and the fluorescence signals appear to give complementary information on different levels of the stem.
Moreover, our data further show that both the excitonic signal and the Fl fluorescence could be used as sensitive tools to monitor the annealing of cTAR with its complementary sequence. Both signals vary largely irrespective of the agent (temperature, peptide) used to mediate the annealing process. Moreover, the percentage of annealed species deduced from both methods is very close to that previously reported by using radiolabeled sequences (Guo et al., 1997; You and McHenry, 1994). The spectroscopic methods appear superior to the radioactive method (Guo et al., 1997; Lapadat-Tapolsky et al., 1995; You and McHenry, 1994) for several reasons. Indeed, in the radioactive method, aliquots are withdrawn from the reaction solution at given times and mixed with an adequate buffer to stop the reaction. The various samples are then stored on ice and analyzed all together by electrophoresis. This method does thus not allow one to follow the reaction in real time. Moreover, the equilibrium reached at a given time could be affected either by the storage prior electrophoresis or by the electrophoresis process, itself. These drawbacks are clearly avoided by both spectroscopic methods, which could thus be used to follow the annealing process in real time and nonperturbating conditions. Due to the intrinsic sensitivity of the fluorescence techniques, the method based on Fl fluorescence is the most sensitive one but needs to be corrected for the Fl environmental changes associated with the stem loop to duplex transition and the binding of the peptide in the vicinity of the chromophore. In good keeping with previously reported conclusions (Berkhout et al., 2001; Guo et al., 1997; Lapadat-Tapolsky et al., 1995; Rein et al., 1998)), our data unambiguously confirm that the NC(12-55) peptide added at a saturating concentration (in respect to the nucleotide concentration) induces a nearly complete annealing of cTAR with its complementary sequence. Experiments are currently performed to further characterize the annealing kinetics by using these methods.
Acknowledgments
This work was supported by grants from the Agence Nationale de Recherches sur le SIDA (ANRS), Sidaction (Ensemble contre le SIDA), Centre National de la Recherche Scientifique (program PCV) and Université Louis Pasteur. S. B. was an ANRS and SIDACTION fellow.
References
- Baudin, F., R. Marquet, C. Isel, J. L. Darlix, B. Ehresmann, and C. Ehresmann. 1993. Functional sites in the 5′ region of human immunodeficiency virus type 1 RNA form defined structural domains. J. Mol. Biol. 229:382–397. [DOI] [PubMed] [Google Scholar]
- Berkhout, B., N. L. Vastenhouw, B. I. Klasens, and H. Huthoff. 2001. Structural features in the HIV-1 repeat region facilitate strand transfer during reverse transcription. RNA. 7:1097–1114. [DOI] [PMC free article] [PubMed] [Google Scholar]
- Bernacchi, S., and Y. Mely. 2001. Exciton interaction in molecular beacons: a sensitive sensor for short range modifications of the nucleic acid structure. Nucleic Acids Res. 29:e62. [DOI] [PMC free article] [PubMed] [Google Scholar]
- Bernacchi, S., S. Stoylov, E. Piemont, D. Ficheux, B. P. Roques, J. L. Darlix, and Y. Mely. 2002. HIV-1 nucleocapsid protein activates transient melting of least stable parts of the secondary structure of TAR and its complementary sequence. J. Mol. Biol. 317:385–399. [DOI] [PubMed] [Google Scholar]
- Brochon, J. C. 1994. Maximum entropy method of data analysis in time-resolved spectroscopy. Methods Enzymol. 240:262–311. [DOI] [PubMed] [Google Scholar]
- Cantor, C. R. and P. R. Schimmel. 1980. Biophysical Chemistry. W. H. Freeman & Co, San Francisco.
- Cheung, H. C. 1991. Resonance Energy Transfer. In Topics in Fluorescence Spectroscopy. J. R. Lacowicz, editor. Plenum Press, New York. 128–171.
- Cohen, M. D., and E. Fisher. 1962. Isosbestic points. J. Chem. Soc. 2:3044–3052. [Google Scholar]
- de Rocquigny, H., D. Ficheux, C. Gabus, M. C. Fournie-Zaluski, J. L. Darlix, and B. P. Roques. 1991. First large scale chemical synthesis of the 72 amino acid HIV-1 nucleocapsid protein NCp7 in an active form. Biochem. Biophys. Res. Commun. 180:1010–1018. [DOI] [PubMed] [Google Scholar]
- Driscoll, M. D., and S. H. Hughes. 2000. Human immunodeficiency virus type 1 nucleocapsid protein can prevent self-priming of minus-strand strong stop DNA by promoting the annealing of short oligonucleotides to hairpin sequences. J. Virol. 74:8785–8792. [DOI] [PMC free article] [PubMed] [Google Scholar]
- Edman, L., U. Mets, and R. Rigler. 1996. Conformational transitions monitored for single molecules in solution. Proc. Natl. Acad. Sci. USA. 93:6710–6715. [DOI] [PMC free article] [PubMed] [Google Scholar]
- Fang, X., X. Liu, S. Schuster, and W. Tan. 1999. Designing a novel molecular beacon for surface-immobilized DNA hybridation studies. J. Am. Chem. Soc. 121:2921–2922. [Google Scholar]
- Giesendorf, B. A., J. A. Vet, S. Tyagi, E. J. Mensink, F. J. Trijbels, and H. J. Blom. 1998. Molecular beacons: a new approach for semiautomated mutation analysis. Clin. Chem. 44:482–486. [PubMed] [Google Scholar]
- Good, N. E., and S. Izawa. 1972. In Methods Enzymology. S. P. Colowick, and N. O. Kaplan, editors. Academic Press, London. 53–68.
- Guo, J., L. E. Henderson, J. Bess, B. Kane, and J. G. Levin. 1997. Human immunodeficiency virus type 1 nucleocapsid protein promotes efficient strand transfer and specific viral DNA synthesis by inhibiting TAR-dependent self-priming from minus-strand strong-stop DNA. J. Virol. 71:5178–5188. [DOI] [PMC free article] [PubMed] [Google Scholar]
- Heyduk, T., and E. Heyduk. 2002. Molecular beacons for detecting DNA binding proteins. Nat. Biotechnol. 20:171–176. [DOI] [PubMed] [Google Scholar]
- Johansson, M. K., H. Fidder, D. Daren, and R. M. Cook. 2002. Intramolecular dimers: a new strategy to fluorescence quenching in dual-labeled oligonucleotide probes. J. Am. Chem. Soc. 124:6950–6956. [DOI] [PubMed] [Google Scholar]
- Kasha, M. 1963. Energy transfer mechanism and molecular exciton model for molecular aggregates. Radiat. Res. 20:55–71. [PubMed] [Google Scholar]
- Kasha, M. 1991. Energy transfer, charge transfer, and proton transfer in molecular composite systems. Basic Life Sci. 58:231–251. [DOI] [PubMed] [Google Scholar]
- Kasha, M., H. R. Rawls, and M. Ashraf El-Bayoumi. 1965. The exciton model in molecular spectroscopy. Pure Appl. Chem. 2:371–392. [Google Scholar]
- Kim, J. K., C. Palaniappan, W. Wu, P. J. Fay, and R. A. Bambara. 1997. Evidence for a unique mechanism of strand transfer from the transactivation response region of HIV-1. J. Biol. Chem. 272:16769–16777. [DOI] [PubMed] [Google Scholar]
- Klostermeier, D., and D. P. Millar. 2001. RNA conformation and folding studied with fluorescence resonance energy transfer. Methods. 23:240–254. [DOI] [PubMed] [Google Scholar]
- Klostermeier, D., and D. P. Millar. 2002. Time-resolved fluorescence resonance energy transfer: A versatile tool for the analysis of nucleic acids. Biopolymers. 61:159–179. [DOI] [PubMed] [Google Scholar]
- Kostrikis, L. G., S. Tyagi, M. M. Mhlanga, D. D. Ho, and F. R. Kramer. 1998. Spectral genotyping of human alleles. Science. 279:1228–1229. [DOI] [PubMed] [Google Scholar]
- Kuhn, H., V. V. Demidov, J. M. Coull, M. J. Fiandaca, B. D. Gildea, and M. D. Frank-Kamenetskii. 2002. Hybridization of DNA and PNA molecular beacons to single-stranded and double-stranded DNA targets. J. Am. Chem. Soc. 124:1097–1103. [DOI] [PubMed] [Google Scholar]
- Lakowicz, J. R. 1999. Principles of Fluorescence Spectroscopy. J. R. Lakowicz, editor. Plenum Press, New York.
- Lapadat-Tapolsky, M., C. Gabus, M. Rau, and J. L. Darlix. 1997. Possible roles of HIV-1 nucleocapsid protein in the specificity of proviral DNA synthesis and in its variability. J. Mol. Biol. 268:250–260. [DOI] [PubMed] [Google Scholar]
- Lapadat-Tapolsky, M., C. Pernelle, C. Borie, and J. L. Darlix. 1995. Analysis of the nucleic acid annealing activities of nucleocapsid protein from HIV-1. Nucleic Acids Res. 23:2434–2441. [DOI] [PMC free article] [PubMed] [Google Scholar]
- Leone, G., H. van Schijndel, B. van Gemen, F. R. Kramer, and C. D. Schoen. 1998. Molecular beacon probes combined with amplification by NASBA enable homogeneous, real-time detection of RNA. Nucleic Acids Res. 26:2150–2155. [DOI] [PMC free article] [PubMed] [Google Scholar]
- Li, J. J., R. Geyer, and W. Tan. 2000. Using molecular beacons as a sensitive fluorescence assay for enzymatic cleavage of single-stranded DNA. Nucleic Acids Res. 28:e52. [DOI] [PMC free article] [PubMed] [Google Scholar]
- Livesey, A. K., and J. C. Brochon. 1987. Analyzing the distribution of decay constants in pulse-fluorimetry using the maximum entropy method. Biophys. J. 52:693–706. [DOI] [PMC free article] [PubMed] [Google Scholar]
- Packard, B. Z., A. Komoriya, D. D. Toptygin, and L. Brand. 1997. Structural characteristics of fluorophores that form intramolecular H-type dimers in a protease substrate. J. Phys. Chem. B. 101:5070–5074. [Google Scholar]
- Packard, B. Z., D. D. Toptygin, A. Komoriya, and L. Brand. 1996. Profluorescent protease substrates: intramolecular dimers described by the exciton model. Proc. Natl. Acad. Sci. USA. 93:11640–11645. [DOI] [PMC free article] [PubMed] [Google Scholar]
- Packard, B. Z., D. D. Toptygin, A. Komoriya, and L. Brand. 1998. Intramolecular resonance dipole-dipole interactions in a profluorescent protease substrate. J. Phys. Chem. B. 102:752–758. [Google Scholar]
- Potier, N., A. Van Dorsselaer, Y. Cordier, O. Roch, and R. Bischoff. 1994. Negative electrospray ionization mass spectrometry of synthetic and chemically modified oligonucleotides. Nucleic Acids Res. 22:3895–3903. [DOI] [PMC free article] [PubMed] [Google Scholar]
- Rein, A., L. E. Henderson, and J. G. Levin. 1998. Nucleic-acid-chaperone activity of retroviral nucleocapsid proteins: significance for viral replication. Trends Biochem. Sci. 23:297–301. [DOI] [PubMed] [Google Scholar]
- SantaLucia, J., Jr. 1998. A unified view of polymer, dumbbell, and oligonucleotide DNA nearest-neighbor thermodynamics. Proc. Natl. Acad. Sci. USA. 95:1460–1465. [DOI] [PMC free article] [PubMed] [Google Scholar]
- Scholes, D. S., and K. P. Ghiggino. 1994. Electronic interactions and interchromophore excitation transfer. J. Phys. Chem. 98:4580–4590. [Google Scholar]
- Selvin, P. R. 2000. The renaissance of fluorescence resonance energy transfer. Nat. Struct. Biol. 7:730–734. [DOI] [PubMed] [Google Scholar]
- Sjoback, R., J. Nygren, and M. Kubista. 1998. Characterization of fluorescein-oligonucleotide conjugates and measurement of local electrostatic potential. Biopolymers. 46:445–453. [DOI] [PubMed] [Google Scholar]
- Sokol, D. L., X. Zhang, P. Lu, and A. M. Gewirtz. 1998. Real time detection of DNA. RNA hybridization in living cells. Proc. Natl. Acad. Sci. USA. 95:11538–11543. [DOI] [PMC free article] [PubMed] [Google Scholar]
- Tyagi, S., D. P. Bratu, and R. Kramer. 1998. Multicolor molecular beacons for allele discrimination. Nat. Biotechnol. 16:49–53. [DOI] [PubMed] [Google Scholar]
- Tyagi, S., and F. R. Kramer. 1996. Molecular beacons: probes that fluoresce upon hybridization. Nat. Biotechnol. 14:303–308. [DOI] [PubMed] [Google Scholar]
- Valdes-Aguilera, O., and D. C. Neckers. 1989. Aggregation phenomena in xanthene dyes. Pure Appl. Chem. 2:371–392. [Google Scholar]
- Vet, J. A., A. R. Majithia, S. A. Marras, S. Tyagi, S. Dube, B. J. Poiesz, and F. R. Kramer. 1999. Multiplex detection of four pathogenic retroviruses using molecular beacons. Proc. Natl. Acad. Sci. USA. 96:6394–6399. [DOI] [PMC free article] [PubMed] [Google Scholar]
- You, J. C., and C. S. McHenry. 1994. Human immunodeficiency virus nucleocapsid protein accelerates strand transfer of the terminally redundant sequences involved in reverse transcription. J. Biol. Chem. 269:31491–31495. [PubMed] [Google Scholar]