Abstract
The effect of temperature on the activation of native fluctuation motions during molecular dynamics unfolding simulations of horse heart cytochrome c has been studied. Essential dynamics analysis has been used to analyze the preferred directions of motion along the unfolding trajectories obtained by high temperature simulations. The results of this study have evidenced a clear correlation between the directions of the deformation motions that occur in the first stage of the unfolding process and few specific essential motions characterizing the 300 K dynamics of the protein. In particular, one of those collective motions, involved in the fluctuation of a loop region, is specifically excited in the thermal denaturation process, becoming progressively dominant during the first 500 ps of the unfolding simulations. As further evidence, the essential dynamics sampling performed along this collective motion has shown a tendency of the protein to promptly unfold. According to these results, the mechanism of thermal induced denaturation process involves the selective excitation of one or few specific equilibrium collective motions.
INTRODUCTION
Molecular dynamics (MD) simulation studies of proteins have evidenced the complex landscapes over which protein motions occur (Kitao et al., 1998; Amadei et al., 1999). This complex basin, populated by the folded conformational state of the protein, represents, in the new view of the protein folding process, the bottom surface of the so-called folding funnel (Dill et al., 1995; Dobson et al., 1998). The equilibrium fluctuations of proteins in this conformational space are restricted to collective motions, described by a small and well-defined set of directions along which atomic displacement takes place (Amadei et al., 1993; Kitao and Go, 1999). Whenever a perturbation, like an increase of temperature, is introduced in this equilibrium scenario, the energy flow is redistributed along the protein degrees of freedom and an unfolding regime is established. Under these conditions, the protein fluctuation pattern is modified and large structural modifications of the native structure MD simulations of protein unfolding (Shea and Brooks III, 2001; Daggett, 2002; Day et al., 2002), to our knowledge, no attention has been focused on the analysis of the way in which such redistribution of the native fluctuations develops during the unfolding simulation. The aim of the present MD study is to investigate the dynamics of the early stage of the unfolding process by the analysis of the collective motions, detected by essential dynamics (ED) analysis (Amadei et al., 1993). These motions have been compared with the collective motions in the native state as we have previously done for the study of mutational perturbations (Ceruso et al., 1999a,b). The main question addressed in this paper is the following: how do collective equilibrium motions evolve along the temperature-induced unfolding process? To answer this question we have performed different thermal unfolding simulations of horse heart cytochrome c (cytc). We use this protein because its folding/unfolding process has been largely investigated by plenty of experimental techniques (Bai et al., 1995; Roder and Elöve, 1994; Marmorino and Pielak, 1995; Colon et al., 1996; Marmorino et al., 1998; Xu et al., 1998; Akiyama et al., 2000, 2002). In particular, Akiyama et al. (2000, 2002), using time-resolved circular dichroism and small angle scattering techniques, have shown the presence of two well-defined en route intermediates in the folding process of cytc. The first one occurs after 160 μs and is characterized by a low native secondary structure content (20% of the native one) and a radius of gyration (RG) 1.5 times larger than in folded structure. The second intermediate occurs after 500 μs and shows a larger content of native secondary structure (70% of the native one) and a reduced RG. Finally, the native structure is completely formed after 15 ms. Earlier structural and kinetics studies on cytc folding process (Roder and Elöve, 1994; Colon et al., 1996), showed that the structuring of the interface between the two terminal helices is one of the earliest detectable structural events in cytc folding, whereas packing interactions with the 60's helix are established in a subsequent step.
METHODS
Starting coordinates
The starting structure of the simulations was taken from the 1.94 Å resolution refined crystal structure of the protein cytc (PDB entry 1hrc) (Bushnell et al., 1990).
The N-terminal group was acetylated to reproduce the experimental conditions at which the protein was studied (Bushnell et al., 1990). A covalent bond between Met80 and the heme iron is maintained in all the simulations. Time-resolved spectroscopy experiments have estimated that the rate of breaking of this bond is 104–105 (at T = 313 K, under denaturing conditions). That is, the lifetime of this bond is 40 μs (Jones et al., 1993; Hagen et al., 1997), and therefore, it can be assumed that it remains formed at all times during our simulations. HIS33 is modeled in its protonated state (Simonson and Perahia, 1995; Hartshorn and Moore, 1989); HIS18 and HIS26 are modeled as neutral with hydrogen at the δ position. The total charge was +7 e.
MD simulations
The protein was solvated with water in a periodic rectangular box large enough to contain the protein and 1.0 nm of solvent on all sides. All solvent molecules with any atom within 0.15 nm of the protein were removed. Seven counterions Cl− were added by replacing water molecules at the most positive electrical potential to provide a neutral simulation cell. The systems were subsequently energy minimized with a steepest descent method for 100 steps.
In all simulations the temperature was maintained close to the intended values (300 K for the native system and 550 K for the unfolding simulations) by weak coupling to an external temperature bath (Berendsen et al., 1984) with a coupling constant of 2 fs, equal to the time step. The use of a short time constant makes the Berendsen's thermostat almost equivalent to the iso-Gaussian thermostat that provides a distribution in the coordinate space coincident with a canonical distribution (D'Alessandro et al., 2002). The protein and the rest of the system were coupled separately to the temperature bath.
The GROMOS87 forcefield (van Gunsteren and Berendsen, 1987) was used with modification as suggested by van Buuren et al. (1993) and explicit hydrogen atoms in aromatic rings (van Gunsteren et al., 1996). The simple point charge (Berendsen et al., 1981) water model was used. The SHAKE algorithm (Ryckaert et al., 1977) was used to constrain all bond lengths. For the water molecules the SETTLE algorithm (Miyamoto and Kollman, 1992) was used. A dielectric permittivity, ɛr = 1, and a time step of 2 fs were used. A twin-range cutoff was used for the calculation of the nonbonded interactions. The short-range cutoff radius was set to 1.0 nm and the long-range cutoff radius to 1.4 nm for both Coulombic and Lennard-Jones interactions. Interactions within the short-range cutoff were updated every time step whereas interactions within the long-range cutoff were updated every 5 time steps together with the pair list. A preliminary simulation using the particle mesh Ewald method for the calculation of the long-range interactions at 300 K for 2.5 ns was performed. The results were in good agreement with the cutoff method. In particular, the essential spaces sampled were found very similar. All atoms were given an initial velocity obtained from a Maxwellian distribution at the desired initial temperature. All the simulations, starting from the crystallographic structure, were equilibrated by 100 ps of MD runs with position restraints on the protein to allow relaxation of the solvent molecules. These first equilibration runs were followed by other 50 ps runs without position restraints on the protein. The temperature was gradually increased from 50 K to the chosen temperature performing short runs of 50 ps each every 50 K. The production run at 300 K using NVT conditions, after equilibration, was 2.5 ns long. Each of the three simulations at 550 K was 2.5 ns long.
All the MD runs and the analysis of the trajectories were performed using the GROMACS software package (van der Spoel et al., 1994). To better quantify the extension of changes in the three-dimensional motif, analyses of the native contact variations have been performed using difference contact matrices (DCMs). Two residues are considered in contact if the minimum distance among their atoms is less than 0.6 nm. Using this criteria, four contact matrices were generated averaging the minimum distances over the last 2.5 ns for the 300-K simulation and over the last nanosecond for the three unfolding trajectories. The differences between the values of the three high temperature contact matrices and the corresponding values of the native contact matrix provide three DCMs. Considering just the set of native contacts, a positive difference in the DCM indicates a lost of the contact, whereas a negative or a null value indicates that the contact is still present.
The graphical representations of the protein was realized with the program MOLSCRIPT (Kraulis, 1991), MOLMOL (Koradi et al., 1996) and Raster3D (Merritt and Bacon, 1997).
ED analysis
The principles of the ED analysis are described in detail elsewhere (Amadei et al., 1993; de Groot et al., 1996b). Usually, ED analysis is performed on the fluctuations around the average conformation. In the case of unfolding dynamics, we are more interested in the motions away from a reference native structure, and therefore we used a variation of the standard procedure, whereby the fluctuations are not calculated with respect to the average structure but from the starting reference structure, which is the minimized crystallographic structure. This type of analysis is useful when we focus on the internal motions that deform the protein structure, as it would be in the case the starting conformation is a nonequilibrium one (Roccatano et al., 2001). In the paper we refer to the eigenvectors obtained with this type of ED analysis as eigenvectors of deformation, to differentiate them from those obtained from the standard ED analysis. ED analyses were performed using the Cartesian coordinates of the Cα atoms as described elsewhere (Amadei et al., 1993). The root mean square inner product (RMSIP) between the essential subspaces of different simulated systems can provide a valid method to assess their dynamical similarity (de Groot et al., 1996a). In our analysis we used the RMSIP value between the first 10 eigenvectors of two different sets, defined as:
 |
(1) |
where ηi and νj are ith and jth eigenvectors of the two different sets respectively. A good estimate of the overlap of two eigenvectors belonging to two different sets can be obtained by using the square inner product s = (ηi · νj)2, where ηi and νj are ith and jth eigenvectors of the two different sets, respectively. Comparing the obtained s values with the projections of a randomly oriented unit vector onto a given set, we can evaluate whether the overlap of the two eigenvectors is statistically significant (Amadei et al., 1999). If the dimension of the space is M, the probability density ρ(s,M) of finding a value s of the square projection of a random unit vector onto one of the eigenvectors of the given set is (Amadei et al., 1999):
 |
(2) |
Finally, to evaluate the value of s that defines a tail of a given total probability, providing 1 percent, we can use the integral of the probability density:
 |
(3) |
In the results section we will use this 1 percent criterion to decide whether the square projection of one eigenvector onto a reference set is statistically significant (s > s′) or can still be considered compatible with the random distribution (s < s′).
ED sampling
The ED sampling is a technique used to increase the amplitude of the configuration space sampled in an MD simulation. It is based on the use of the essential eigenvectors, obtained from an equilibrated MD simulation, to confine the motion of the simulated system along the essential directions (Amadei et al., 1996; de Groot et al., 1996b). The method currently used was described by de Groot et al. (1996b). Using this approach, the system increases the configuration space sampled along selected eigenvector directions with constraint forces in the subspace defined by the selected eigenvectors. This method was successfully applied to the study of peptides (de Groot et al., 1996c) and proteins (de Groot et al., 1996b) and allows the configuration space sampled by usual MD simulations to be extended up to 10 times. In this paper, the same method was used to verify the relative resistance of cytc to loose native structure when confined to move along each of the first 10 native essential eigenvectors. Two parameters are required: the one defining the maximum number of sampling cycles (ncycles) before changing the expansion origin of the sampling procedure, the other (slope) checking whenever the system has reached the border of the configuration space to set a new origin. We use the same values, ncycles = 5000 and slope = 0.005 nm, reported in the literature for the sampling of protein systems (de Groot et al., 1996b,c). We have constrained the system to move along each one of the first 10 native eigenvectors, and, starting from the minimized crystal structure, 100 ps of simulation was performed. The temperature of the system was kept to 350 K to speed up the sampling. The ED sampling was performed by using the GROMACS software package.
RESULTS AND DISCUSSION
Overview of the crystal structure
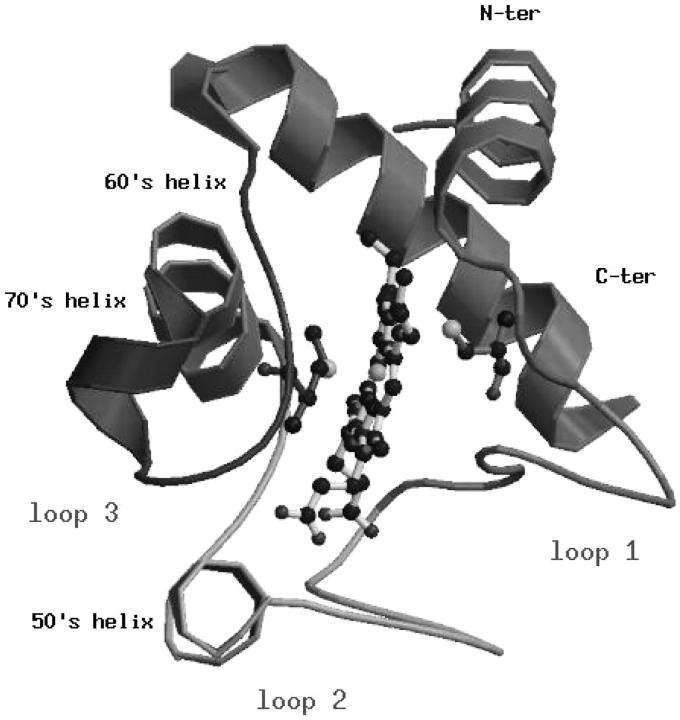
The crystallographic structure of cytc (Fig. 1) is characterized by the presence of a cluster of three long α-helices, the N-terminal (residues 2-15), the C-terminal (residues 87-102), and the 60's helix (residues 60-69) grouped around one edge of the heme, and by the loop regions, loop 1 (residues 21-35), loop 2 (residues 36-59), and loop 3 (residues 70-85). Loop 2 and loop 3 comprise two short helices, respectively 50's (residues 49-54) and 70's (residues 70-75). Close-packed hydrophobic residues at the interface between the two terminal helices are particularly well conserved and have been extensively studied by the analysis of the stability of different cytc mutants (Marmorino and Pielak, 1995; Colon et al., 1996; Marmorino et al., 1998; Hostetter et al., 1999). Finally, some structural properties of the crystallographic structure, which will be compared with those obtained from the simulations, are summarized in Table 1.
FIGURE 1.
Ribbon representation of the horse heart cytochrome c. Elements of secondary structure are named according to the classification of Bai et al. (1995).
TABLE 1.
Structural properties in the crystal and time averaged structural properties calculated over the last 2.5 ns for the native system at 300 K and over the last nanosecond for the three unfolding trajectories at 550 K (D-1, D-2, D-3)
| Properties* | Crystal | Native | D-1 | D-2 | D-3 | Avg |
|---|---|---|---|---|---|---|
| RMSD (nm) | 0.13 (0.02) | 0.31 (0.02) | 0.39 (0.02) | 0.57 (0.02) | 0.42 (0.02) | |
| RG (nm) | 1.26 | 1.27 (0.01) | 1.30 (0.01) | 1.28 (0.01) | 1.28 (0.02) | 1.29 (0.01) |
| (%) of α-helix | 41 | 43 (4) | 27 (4) | 33 (4) | 27 (4) | 29 (4) |
| Contacts | 732† | 694† | 79‡ | 80‡ | 72‡ | 77‡ |
| H-bonds | 83§ | 93§ (4) | 56¶ (5) | 57¶ (4) | 41¶ (4) | 51¶ (4) |
| SASAPho (nm2) | 25.6 | 24.3 (0.8) | 22.8 (0.9) | 22.7 (1.1) | 22.8 (1.1) | 22.8 (1.0) |
| SASAPhi (nm2) | 38.9 | 41.0 (1.2) | 42.0 (1.3) | 42.0 (1.4) | 42.0 (1.4) | 42.0 (1.4) |
In the last column (Avg), the values of the partial denatured ensemble, obtained averaging the three high temperature simulations over the last nanosecond, are reported. Standard deviations are given in parentheses.
The solvent-accessible surface area (SASA) is given for the hydrophobic residues (SASAPho) and for the hydrophilic ones (SASAPhi).
Number of contacts.
Percentage of native contacts (with respect to the 300-K simulation).
Number of H-bonds.
Percentage of native H-bonds (with respect to the 300-K simulation).
300-K simulation
Structural and dynamical properties
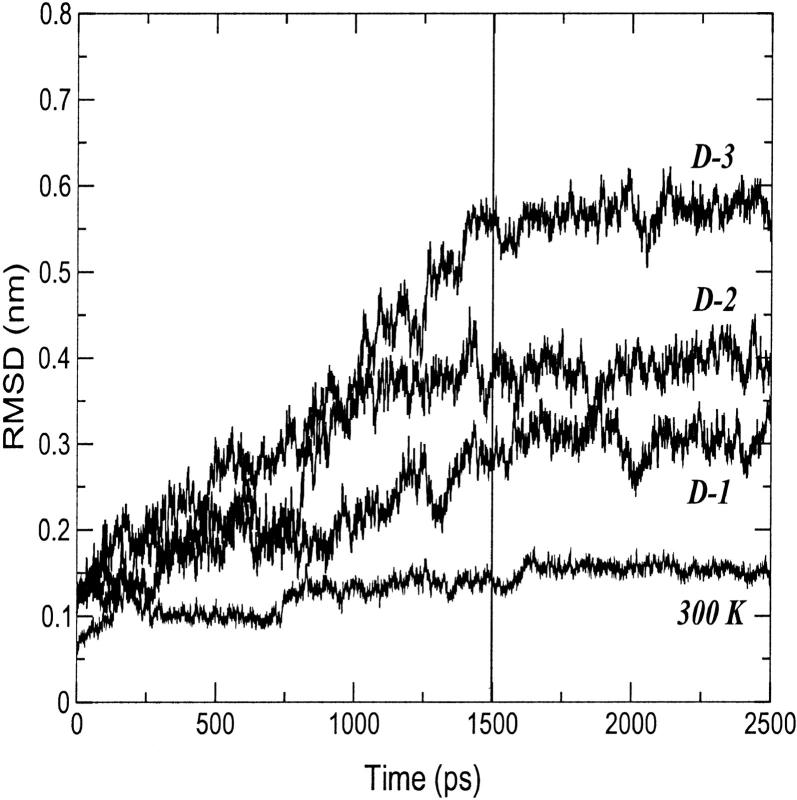
In Fig. 2, the root mean square deviation (RMSD) from the crystal structure of cytc in the 300-K simulation is reported. After 160 ps, the curve stabilizes to an average value of 0.14 nm. The increasing deviations observed along the trajectory are related to deformations of the loop regions. Few reversible changes are observed in the secondary structure that shows an overall stability. In Table 1, a summary of the average values of different structural data calculated from the simulation is reported. The deviations from the crystal structure is in the range of the values observed by other authors (Banci et al., 1997). The average RG is close to the value obtained from the crystal (see Table 1) and in good agreement with the small angle x-ray scattering value (1.39 ± 0.04 nm (Pollack et al., 1999)). It has to be pointed out that the existence of hydration shells around proteins gives small angle x-ray scattering values systematically larger than crystal values (Nakasako, 1999).
FIGURE 2.
Backbone-backbone RMSD from the starting structure as a function of time for the 300-K and the three 550-K (D-1, D-2, and D-3) simulations.
The network of native contacts and H-bonds present in the crystal structure is well preserved in the 300-K simulation (see Table 1). The dynamical properties of the 300-K simulation have been determined by performing the ED analysis on the Cα atoms (see Methods section). The fluctuation covariance matrix has been calculated over the last 2.5 ns. The first 10 eigenvectors obtained by the ED analysis on the Cα atoms contribute to the overall motion for the 68% of the total fluctuations of the system. As expected, the largest contribution to the motion along these eigenvectors is due to the loop regions.
Unfolding simulations
Three unfolding simulations have been performed at 550 K, and they will be referred to as D-1, D-2, and D-3, respectively.
Structural properties
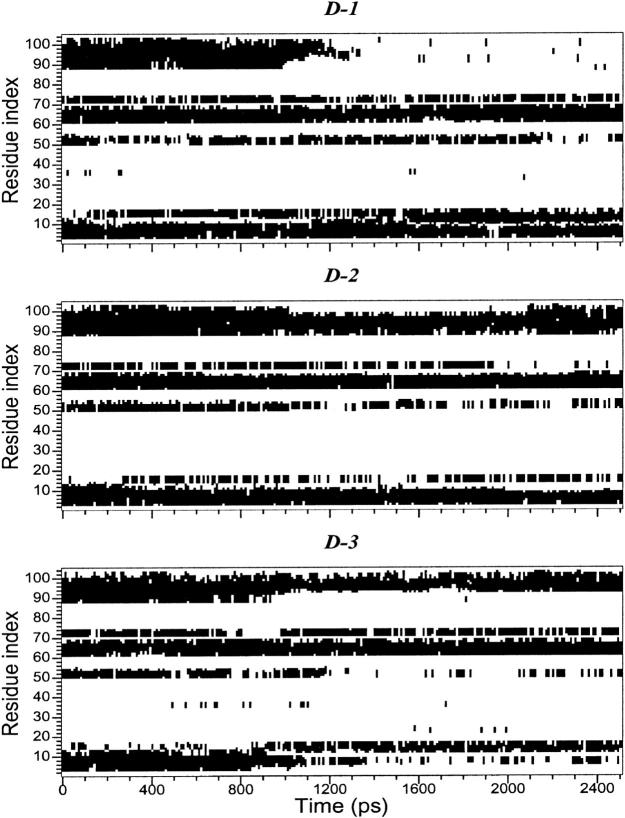
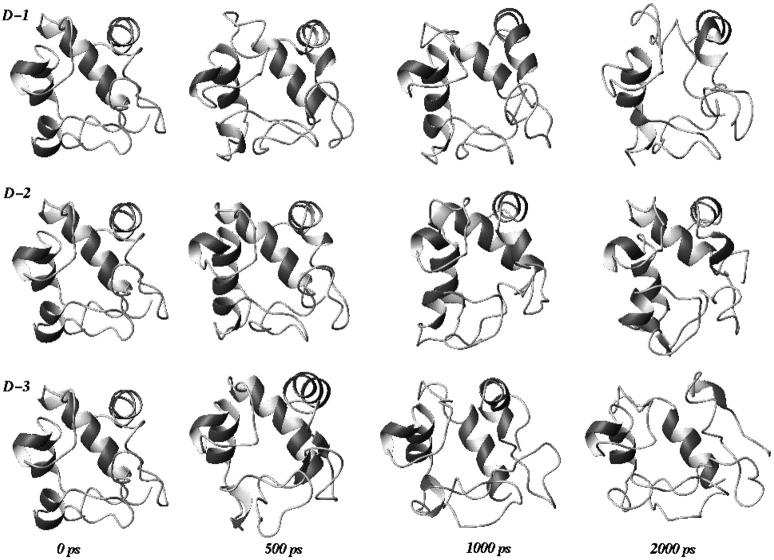
In Fig. 2, the backbone RMSDs with respect to the crystal structure for the three unfolding trajectories are reported. Each trajectory, after ∼1.5 ns, provides an ensemble of partial unfolded conformations, characterized by different average RMSD values. In Table 1, a summary of the average values of different structural properties, calculated from the last nanosecond of the unfolding trajectories, is reported. To provide a more comprehensive description of the partial denatured ensemble, the values of the three high temperature simulations have been averaged and are reported in the last column. The small differences in the RG and solvent-accessible surface area (SASA) values indicate that the partial unfolded conformations are as compact as the native structure. The helix content, calculated using the DSSP criteria (Kabsch and Sander, 1983), and the three-dimensional arrangement of the secondary structure elements along the simulations, shown in Fig. 3 and in Fig. 4, respectively, clearly indicate the presence of different denaturation pathways. In all the simulations the α-helix content decreases by ∼30% with respect to the crystal structure, although this reduction involves different helices. The overall average α-helix content of the partial denatured ensemble (Table 1) is 67.5%. This value is in good agreement with the 70% estimation obtained from the circular dichroism measurements by Akiyama et al. (2000) for the last intermediate of the refolding process.
FIGURE 3.
Helix patterns during the high-temperature simulations.
FIGURE 4.
Three-dimensional arrangement of secondary structure elements sampled along the three unfolding trajectories. The last three structures, extracted at 2000 ps, are representative conformations of the partial denatured ensemble.
The evolution of the native contacts along the unfolding simulations has been analyzed using DCMs, which are described in the Methods section. Among the possible native contacts, we have focused our attention on those reported in the literature. In particular, we have chosen those at the interface between the two terminal helices (Marmorino and Pielak, 1995; Colon et al., 1996; Marmorino et al., 1998) and those relative to the 60's helix (Hostetter et al., 1999) (see Table 2). These data evidence a good agreement with the experimental results. In fact, the percentage of native contacts lost between the two terminal helices (14%) is much lower than the contacts lost between the 60's helix and the rest of the protein (52%), in agreement with the experimental observations (Roder and Elöve, 1994; Marmorino and Pielak, 1995; Colon et al., 1996; Marmorino et al., 1998; Hostetter et al., 1999) and recent MD simulations (García and Hummer, 1999).
TABLE 2.
Native contacts present (√) and not present (np) for the three unfolding simulations D-1, D-2, and D-3 over the last nanosecond
| C-ter/N-ter helices nat. cont. | D-1 | D-2 | D-3 |
|---|---|---|---|
| Leu94-Gly6 | √ | √ | np |
| -Ile9 | √ | √ | √ |
| -Phe10 | √ | √ | np |
| -Val11 | √ | √ | √ |
| -Lys60 | √ | √ | √ |
| Phe10-Tyr97 | √ | √ | √ |
| -Leu98 | √ | √ | np |
| Tyr97-Gly6 | √ | √ | √ |
| Helix 60/protein nat. cont. | D-1 | D-2 | D-3 |
| Leu68-Arg91 | np | np | np |
| -Leu94 | np | √ | √ |
| -Ile95 | np | np | √ |
| -Leu98 | np | np | √ |
| Leu68-Met80 | √ | np | √ |
| -Phe82 | √ | √ | √ |
| -Ile85 | np | √ | np |
Dynamical properties
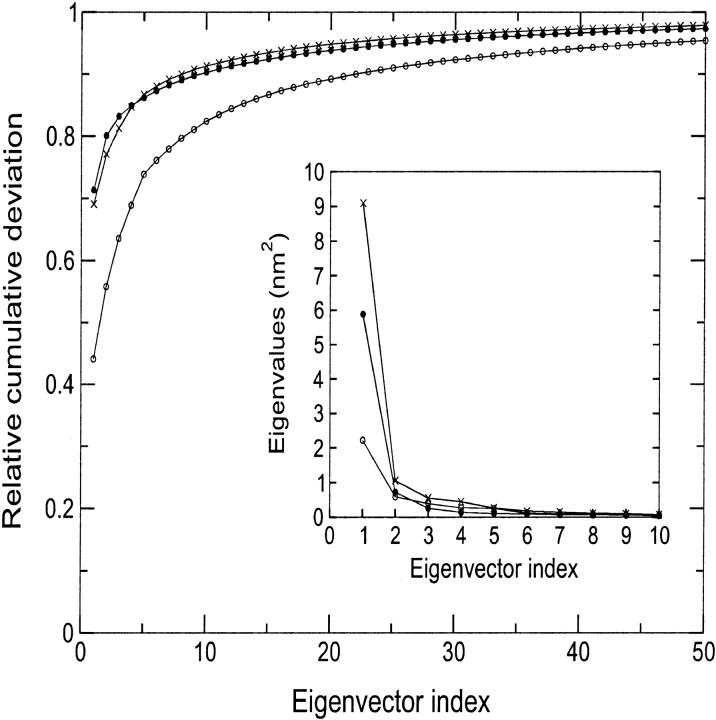
To detect the collective unfolding motions, a modification of the ED method has been used. In the present case, the fluctuations are calculated with respect to the minimized crystal structure instead of the average structure (see Methods section). The traces of the covariance matrices, calculated over the first 1.5 ns, which account for the overall average square deviation, are 5.04, 8.24, and 13.16 nm2 for D-1, D-2, and D-3 simulation, respectively. The first 10 eigenvectors contribute to the overall average square deviation for 82%, 90%, and 91% in simulations D-1, D-2, and D-3, respectively (see Fig. 5). To estimate the significance of the overlap between the native set of essential eigenvectors and the three essential subspaces obtained at high temperature, we evaluated the RMSIP between the first 10 native eigenvectors and the first 10 deformation eigenvectors (see Methods section). The results gave values of 0.60, 0.63, and 0.55 for D-1, D-2, and D-3 simulation, respectively, showing that the unfolding mostly proceeds along the same directions of the essential fluctuations in the native protein. It can be concluded that the first 10 native eigenvectors contribute not only to the equilibrium fluctuations, but also to the structural deformations at high temperature. An analog result was obtained when dealing with mutational perturbations (Ceruso et al., 1999b; Amadei et al., 1999).
FIGURE 5.
Relative cumulative deviation of the first 50 eigenvectors for D-1 (open circles), D-2 (full circles), and D-3 (crosses). The corresponding eigenvalues are given in the insert.
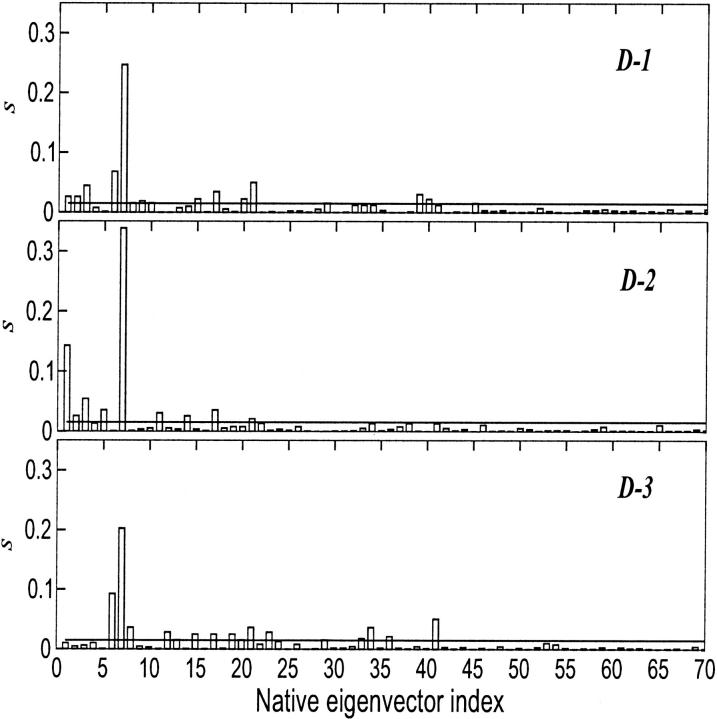
In Fig. 6, the square projections, s, of the first deformation eigenvector, which contributes to the overall average square deviation in simulation D-2 and D-3 for 70% and in simulation D-1 for 40% (see Fig. 5) onto the native essential eigenvectors, are reported. The lines in the plots show the value defining 99% of probability, s′, as obtained by a random distribution as defined by Eq. 3.
FIGURE 6.
Square inner product, s, of the first eigenvector of deformation obtained for D-1, D-2, and D-3 onto the first 70 eigenvectors of fluctuation obtained at 300 K. The value s′ (full line) is also shown.
Using these equations, with M = 312, we obtained s′ = 0.015. Such random value can be used to evaluate whether the projection of an eigenvector onto an independent basis set can be considered as statistically significant.
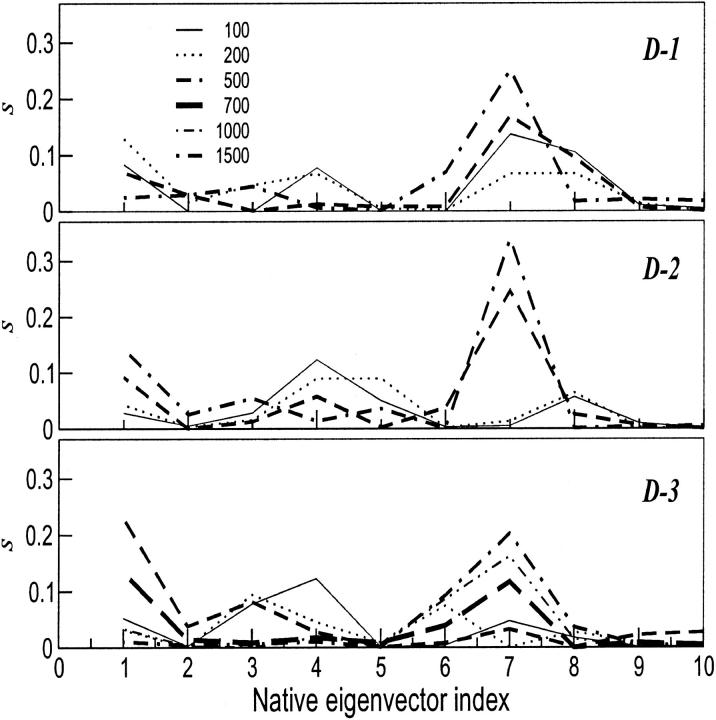
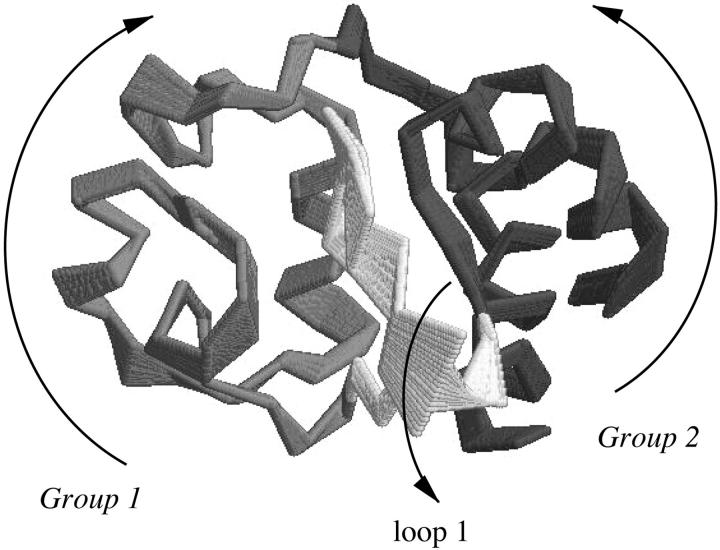
From the plots, it is evident that the native fluctuation eigenvectors giving a significant overlap with the essential deformation ones are among the first 40, and in particular the seventh eigenvector that provides the largest overlap. The time dependence of the first deformation eigenvector was analyzed by performing the ED analysis over increasing time periods for the three unfolding trajectories. In Fig. 7, the results of these analyses are shown. In two of the three unfolding trajectories, the overlap of the unfolding principal motions with the seventh fluctuation eigenvector occurs after the first 200 ps, whereas for the third one after the first 500 ps. In Fig. 8, the superimposition of 10 configurations obtained projecting the Cα motion along the seventh eigenvector of the native trajectory is reported. The dominant motion mainly involves loop 1 and two groups: one comprises loop 2, loop 3, and 60's helix, and the other the two terminal helices. The arrows in the figure show the dynamical behavior of the three-dimensional correlated motion of these three regions.
FIGURE 7.
Square inner product, s, of the first deviation eigenvector obtained from increasing time lags for D-1, D-2, and D-3 onto the first 10 eigenvectors of fluctuation obtained at 300 K.
FIGURE 8.
Superimposition of 10 configurations obtained by projecting the Cα motion onto the seventh eigenvector of fluctuation at 300 K. The arrows show the dynamical behavior of the three-dimensional correlated motion of these three regions.
ED sampling
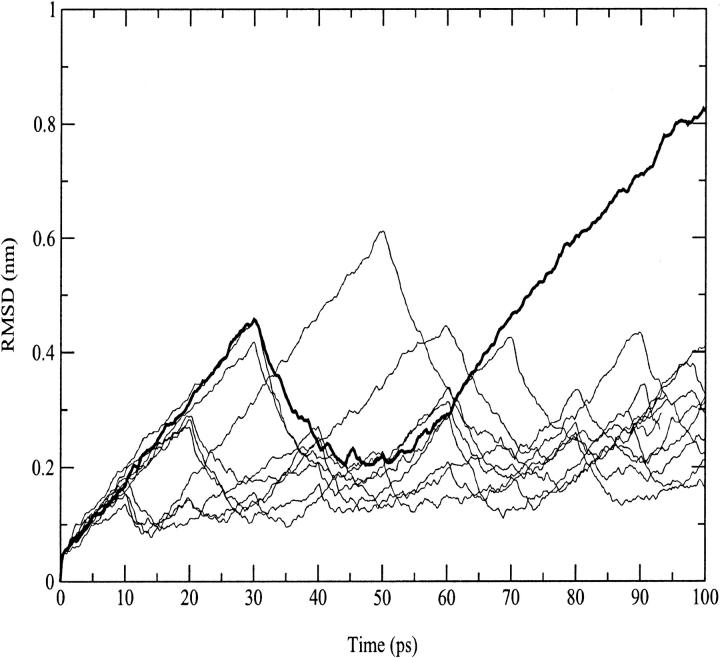
To verify the different tendency of the system to unfold along the native essential directions, we have used the ED sampling technique (see Methods section). As reported in the Methods section, the system was confined to move separately along each of the first 10 native eigenvectors. In Fig. 9, backbone RMSDs with respect to the crystal structure during the ED sampling along each of the first 10 native fluctuation eigenvectors are reported. Fig. 9 shows the typical pattern observed in other ED sampling simulations (Amadei et al., 1996), with large structural rearrangements during the different ED cycles. The trajectory sampled along the seventh eigenvector shows the largest deviation and a clear propensity of unfolding. The sampling along the other eigenvectors determines large deviations, but no unfolding, as fast as for the seventh eigenvector.
FIGURE 9.
Backbone-backbone RMSD from the starting structure during the ED sampling along each of the first seven native fluctuation eigenvectors. The seventh eigenvector is shown in bold.
CONCLUSIONS
In this paper we have analyzed the evolution of native essential dynamics motions during the thermal induced unfolding of cytc. We have performed three simulations of thermal unfolding at T = 550 K of the horse heart cytc. The structural results are in agreement with experimental literature data. In particular the partial unfolded conformations generated during the simulated unfolding process have an average native helix content of 67.5% and preserve the native contacts between the two terminal helices.
From the ED analysis, it resulted that the directions of motions defined by the first native eigenvectors (essential subspace) account for the unfolding directions. In particular the seventh native eigenvector provides the major contribution to the unfolding mechanism. This motion involves loop 1 and the groups composed by loop 2, loop 3, helix 60, and the two terminal helices, respectively. Furthermore, ED sampling simulations along each of the first 10 eigenvectors have confirmed the previous observation, showing a marked tendency to a rapid unfolding of cytc, when the system is confined to move along the seventh eigenvector.
These results show that the early stage of thermal unfolding in cytc involves the activation of the essential motions in the native protein. In particular, this activation amplifies the fluctuations along one specific eigenvector (in the case of cytc, the seventh eigenvector) that brings to a progressive weakening of native contacts. The presence of a well-defined fingerprint in cytc unfolding dynamics constitutes an interesting starting point for the same investigations on other proteins.
Acknowledgments
The authors thank Dr. Andrea Amadei for stimulating discussions.
This work was supported by the European Commission Research Training Network (project Protein Misfolding) by the Italian Ministero dell'Istruzione, Università e Ricerca (National Project Structural Biology and Dynamics of Redox Proteins), and by the Italian National Research Council Agenzia 2001 (project Basi strutturali del riconoscimento nei sistemi biologici).
References
- Akiyama, S., S. Takahashi, K. Ishimori, and I. Morishima. 2000. Stepwise formation of α-helices during cytochrome c folding. Nat. Struct. Biol. 7:514–520. [DOI] [PubMed] [Google Scholar]
- Akiyama, S., S. Takahashi, T. Kimura, K. Oishimori, I. Morishima, Y. Nishikawa, and T. Fujisawa. 2002. Conformational landscape of cytochrome c folding studied by microsecond-resolved small-angle x-ray scattering. Proc. Natl. Acad. Sci. USA. 99:1329–1334. [DOI] [PMC free article] [PubMed] [Google Scholar]
- Amadei, A., M. A. Ceruso, and A. Di Nola. 1999. On the convergence of the conformational coordinates basis set obtained by the essential dynamics analysis of proteins molecular dynamics simulations. Proteins: Struct. Funct. Genet. 36:419–424. [PubMed] [Google Scholar]
- Amadei, A., A. B. M. Linssen, and H. J. C. Berendsen. 1993. Essential dynamics of proteins. Proteins: Struct. Funct. Genet. 17:412–425. [DOI] [PubMed] [Google Scholar]
- Amadei, A., A. B. M. Linssen, B. L. de Groot, D. M. van Aalten, and H. J. C. Berendsen. 1996. An efficient method for sampling the essential subspace of proteins. J. Biomol. Struct. Dyn. 13:615–625. [DOI] [PubMed] [Google Scholar]
- Bai, Y., T. Sosnick, and L. M. S. Englander. 1995. Protein folding intermediates: native-state hydrogen exchange. Science. 269:192–197. [DOI] [PMC free article] [PubMed] [Google Scholar]
- Banci, L., G. Gori-Savellini, and P. Turano. 1997. A molecular dynamics study in explicit water of the reduced and oxidized forms of yeast iso-1-cytochrome c–solvation and dynamic properties of the two oxidation states. Eur. J. Biochem. 249:716–723. [DOI] [PubMed] [Google Scholar]
- Berendsen, H. J. C., J. P. M. Postma, W. F. van Gunsteren, A. Di Nola, and J. R. Haak. 1984. Molecular dynamics with coupling to an external bath. J. Chem. Phys. 81:3684–3690. [Google Scholar]
- Berendsen, H. J. C., J. P. M. Postma, W. F. van Gunsteren, and J. Hermans. 1981. Interaction models for water in relation to protein hydration. In Intermolecular Forces. B. Pullman, editor. D. Reidel Publishing Company, Dordrecht, The Netherlands. 331–342.
- Bushnell, G. W., G. V. Louie, and G. D. Brayer. 1990. High-resolution three-dimensional structure of horse heart cytochrome c. J. Mol. Biol. 214:585–595. [DOI] [PubMed] [Google Scholar]
- Ceruso, M. A., A. Amadei, and A. Di Nola. 1999a. Effects of core packing on the structure, function and dynamics of a four-helix-bundle protein rop. Proteins: Struct. Funct. Genet. 36:436–446. [DOI] [PubMed] [Google Scholar]
- Ceruso, M. A., A. Grottesi, and A. Di Nola. 1999b. Mechanics and dynamics of B1 domain of protein G: role of packing and surface hydrophobic residues. Protein Sci. 8:147–160. [DOI] [PMC free article] [PubMed] [Google Scholar]
- Colon, W., G. A. Elove, L. P. Wakem, F. Sherman, and H. Roder. 1996. Side chain packing of the N- and C-terminal helices plays a critical role in the kinetics of cytochrome c folding. Biochemistry. 35:5538–5549. [DOI] [PubMed] [Google Scholar]
- Daggett, V. 2002. Molecular dynamics simulations of the protein unfolding/folding reaction. Acc. Chem. Res. 35:422–429. [DOI] [PubMed] [Google Scholar]
- D'Alessandro, M., A. Tenenbaum, and A. Amadei. 2002. Dynamical and statistical mechanical characterization of temperature coupling algorithms. J. Phys. Chem. B. 106:5050–5057. [Google Scholar]
- Day, R., A. J. Bennion, S. Ham, and V. Daggett. 2002. Increasing temperature accelerates protein unfolding without changing the pathway of unfolding. J. Mol. Biol. 322:189–203. [DOI] [PubMed] [Google Scholar]
- de Groot, B., D. van Aalten, A. Amadei, and H. J. C. Berendsen. 1996a. The consistency of large concerted motions in proteins in molecular dynamics simulations. Biophys. J. 71:1707–1713. [DOI] [PMC free article] [PubMed] [Google Scholar]
- de Groot, B. L., A. Amadei, R. M. Scheek, N. A. van Nuland, and H. J. C. Berendsen. 1996b. An extended sampling of the configurational space of HPr from E. coli. Proteins: Struct. Funct. Genet. 26:314–322. [DOI] [PubMed] [Google Scholar]
- de Groot, B. L., A. Amadei, D. M. F. van Aalten, and H. Berendsen. 1996c. Towards an exhaustive sampling of the configurational space of the two forms of peptide hormone guanylin. J. Biom. Str. Dyn. 13:741–751. [DOI] [PubMed] [Google Scholar]
- Dill, K. A., S. Bromberg, K. Yue, K. M. Fiebig, D. P. Yee, P. D. Thomas, and H. S. Chan. 1995. Principles of protein folding: a perspective from simple exact models. Protein Sci. 4:561–602. [DOI] [PMC free article] [PubMed] [Google Scholar]
- Dobson, C. M., A. Sali, and M. Karplus. 1998. Protein folding: A perspective from theory and experiment. Angew. Chem. Int. Ed. 37: 869–893. [DOI] [PubMed] [Google Scholar]
- García, A. E., and G. Hummer. 1999. Conformational dynamics of cytochrome c: correlation to hydrogen exchange. Proteins: Struct. Funct. Gen. 36:175–191. [PubMed] [Google Scholar]
- Hagen, S. J., J. Hofrichter, and W. A. Eaton. 1997. Rate of interchain diffusion of unfolded cytochrome c. J. Phys. Chem. 101:2352–2365. [Google Scholar]
- Hartshorn, R. T., and G. Moore. 1989. A denaturation-induced proton-uptake study of horse ferricytochrome c. Biochem. J. 258:595–598. [DOI] [PMC free article] [PubMed] [Google Scholar]
- Hostetter, D. R., G. T. Weatherly, J. R. Beasley, K. Bortone, D. S. Cohen, S. A. Finger, P. Hardwidge, D. S. Kakouras, A. J. Saunders, S. K. Trojak, J. C. Waldner, and G. J. Pielak. 1999. Partially formed native tertiary interactions in the A-state of cytochrome c. J. Mol. Biol. 289:639–644. [DOI] [PubMed] [Google Scholar]
- Jones, C. M., E. R. Henry, Y. Hu, C. K. Chan, S. D. Luck, A. Bhuyan, H. Roder, J. Hofrichter, and W. A. Eaton. 1993. Fast events in protein folding initiated by nanosecond laser photolysis. Proc. Natl. Acad. Sci. USA. 90:11860–11864. [DOI] [PMC free article] [PubMed] [Google Scholar]
- Kabsch, W., and C. Sander. 1983. Dictionary of protein secondary structure: pattern recognition of hydrogen bonded and geometrical features. Biopolymers. 22:2577–2637. [DOI] [PubMed] [Google Scholar]
- Kitao, A., and N. Go. 1999. Investigating protein dynamics in collective coordinate space. Curr. Opin. Struct. Biol. 9:164–169. [DOI] [PubMed] [Google Scholar]
- Kitao, A., S. Hayward, and N. Go. 1998. Energy landscape of a native protein: jumping-among-minima model. Proteins: Struct. Funct. Genet. 33:496–517. [DOI] [PubMed] [Google Scholar]
- Koradi, R., M. Billeter, and K. Wuthrich. 1996. MOLMOL: a program for display and analysis of macromolecular structures. J. Mol. Graph. 14:51–55. [DOI] [PubMed] [Google Scholar]
- Kraulis, P. J. 1991. MOLSCRIPT: a program to produce both detailed and schematic plots of protein structures. J. Appl. Crystallogr. 24:946–950. [Google Scholar]
- Marmorino, J. L., M. Lehti, and G. J. Pielak. 1998. Native tertiary structure in an A-state. J. Mol. Biol. 275:379–388. [DOI] [PubMed] [Google Scholar]
- Marmorino, J. L., and G. J. Pielak. 1995. A native tertiary interaction stabilizes the A state of cytochrome c. Biochemistry. 34:3140–3143. [DOI] [PubMed] [Google Scholar]
- Merritt, E. A., and D. J. Bacon. 1997. Raster3d: Photorealistic molecular graphics. Methods Enzymol. 277:505–524. [DOI] [PubMed] [Google Scholar]
- Miyamoto, S., and P. A. Kollman. 1992. SETTLE: An analytical version of the SHAKE and RATTLE algorithms for rigid water models. J. Comp. Chem. 13:952–962. [Google Scholar]
- Nakasako, M. 1999. Large-scale networks of hydration water molecules around β-trypsin revealed by cryogenic x-ray crystal structure analysis. J. Mol. Biol. 289:547–564. [DOI] [PubMed] [Google Scholar]
- Pollack, L., M. W. Tate, N. C. Darnton, J. B. Knight, S. M. Gruner, W. A. Eaton, and R. H. Austin. 1999. Compactness of the denatured state of a fast-folding protein measured by submillisecond small-angle x-ray scattering. Proc. Natl. Acad. Sci. USA. 96:10115–10117. [DOI] [PMC free article] [PubMed] [Google Scholar]
- Roccatano, D., A. E. Mark, and S. Hayward. 2001. Investigation of the mechanism of domain closure in citrate synthase by molecular dynamics simulation. J. Mol. Biol. 310:1039–1053. [DOI] [PubMed] [Google Scholar]
- Roder, H., and G. A. Elöve. 1994. Mechanisms of Protein Folding: Frontiers In Molecular Biology. Oxford University Press, New York.
- Ryckaert, J. P., G. Ciccotti, and H. J. C. Berendsen. 1977. Numerical integration of the Cartesian equations of motion in a system with constraints: molecular dynamics of n-alkanes. J. Comp. Phys. 23:327–341. [Google Scholar]
- Shea, J. E., and C. L. Brooks III. 2001. From folding theories to folding proteins: a review and assessment of simulation studies of protein folding and unfolding. Annu. Rev. Phys. Chem. 52:499–535. [DOI] [PubMed] [Google Scholar]
- Simonson, T., and D. Perahia. 1995. Microscopic dielectric properties of cytochrome c from molecular dynamics simulations in aqueous solution. J. Am. Chem. Soc. 117:7987–8000. [DOI] [PMC free article] [PubMed] [Google Scholar]
- van Buuren, A. R., S. J. Marrink, and H. J. C. Berendsen. 1993. A molecular dynamics study of decane/water interface. J. Phys. Chem. 97:9206–9212. [Google Scholar]
- van der Spoel, D., R. van Drunen, and H. J. C. Berendsen. 1994. GROningen MAchine for Chemical Simulation. Department of Biophysical Chemistry, BIOSON Research Institute, The Netherlands. gromacs@chem.rug.nl.
- van Gunsteren, W. F., and H. J. C. Berendsen. 1987. GROMOS manual. BIOMOS, Biomolecular Software, Laboratory of Physical Chemistry, University of Groningen, The Netherlands.
- van Gunsteren, W. F., S. Billeter, A. Eising, P. Hunenberger, P. Kruger, A. E. Mark, W. Scott, and I. Tironi. 1996. Biomolecular Simulations: the GROMOS96 Manual and User Guide. Groningen: BIOMOS bv, Zurich .
- Xu, Y., L. Mayne, and S. Englander. 1998. Evidence for an unfolding and refolding pathway in cytochrome c. Nat. Struct. Biol. 5:774–778. [DOI] [PubMed] [Google Scholar]


