

Abstract
Lung epithelial cells are subjected to large cyclic forces from breathing. However, their response to dynamic stresses is poorly defined. We measured the complex shear modulus (G*(ω)) of human alveolar (A549) and bronchial (BEAS-2B) epithelial cells over three frequency decades (0.1–100 Hz) and at different loading forces (0.1–0.9 nN) with atomic force microscopy. G*(ω) was computed by correcting force-indentation oscillatory data for the tip-cell contact geometry and for the hydrodynamic viscous drag. Both cell types displayed similar viscoelastic properties. The storage modulus G′(ω) increased with frequency following a power law with exponent ∼0.2. The loss modulus G″(ω) was ∼2/3 lower and increased similarly to G′(ω) up to ∼10 Hz, but exhibited a steeper rise at higher frequencies. The cells showed a weak force dependence of G′(ω) and G″(ω). G*(ω) conformed to the power-law model with a structural damping coefficient of ∼0.3, indicating a coupling of elastic and dissipative processes within the cell. Power-law behavior implies a continuum distribution of stress relaxation time constants. This complex dynamics is consistent with the rheology of soft glassy materials close to a glass transition, thereby suggesting that structural disorder and metastability may be fundamental features of cell architecture.
INTRODUCTION
Mechanical forces and associated cell deformations play an important role in fundamental cell processes including mechanotransduction, growth, differentiation, protein and DNA synthesis, motility, and apoptosis (Chicurel et al., 1998; Janmey, 1998; Huang and Ingber, 1999). A better understanding of how mechanical stresses and deformations regulate cellular functions requires a detailed knowledge of the mechanical properties of the cell (Stamenovic and Wang, 2000). The most common approach reported to study cell mechanics is to determine the stiffness or an apparent elastic modulus assuming that the cell is an elastic body (Stamenovic and Coughlin, 1999; Maksym et al., 2000). However, cells exhibit both solid- and liquidlike features, i.e., they are viscoelastic. As such, cells store and dissipate mechanical energy and their response to mechanical stimuli depends on the rate at which the stimulus is applied (Zhu et al., 2000). These microrheological features of cells remain poorly defined (Stamenovic and Wang, 2000). A straightforward and robust approach to characterize cell microrheology is by determining its complex shear modulus (G*(ω)) from oscillatory measurements over a wide frequency range. G*(ω) is defined as the complex ratio in the frequency domain between the applied stress and the resulting strain (Ferry, 1980). The real and imaginary parts of G*(ω) account for the elastic energy stored and the frictional energy dissipated within the cell at different oscillatory frequencies. The ratio between the imaginary and the real parts of G*(ω) indicates the degree of solid- or liquidlike mechanical behavior of the cell.
Knowledge of cell mechanical response to oscillatory stresses is of particular interest in lung epithelial cells because they are subjected to large cyclic forces owing to breathing (Wirtz and Dobbs, 2000). Furthermore, their microrheological properties are fundamental in the maintenance of the structural and functional integrity of the epithelial barrier in the lung. Microrheology of alveolar and bronchial lung epithelial cells have been recently investigated with magnetic twisting cytometry (MTC) by applying local twisting torques to the cell surface through ligand-coated magnetic microbeads (∼5 μm diameter) bound to integrins (Puig-de-Morales et al., 2001; Berrios et al., 2001). This technique computes an apparent dynamic modulus defined as the complex ratio between the oscillatory applied torque and the resulting oscillatory bead rotation. This approach allows the assessment of the frequency dependence of cell mechanics. However, the absolute value of G*(ω) cannot be accurately determined from MTC measurements because the degree of bead embedding is unknown, with the result that the surface of contact between the probe and the cell surface is ill-defined (Fabry et al., 2001; Mijailovich et al., 2002). The contact geometry is also poorly defined in other techniques used in cell microrheology such as microneedles (Heidemann et al., 1999), microplates (Thoumine and Ott, 1997), magnetic bead microrheometry (Bausch et al., 1998), and optical tweezers (Choquet et al., 1997). Moreover, some of these techniques probe cell mechanics with microbeads (∼5 μm diameter) specifically bound to cell membrane receptors, which can induce the formation and recruitment of focal adhesion complexes at the site of bead attachment (Plopper and Ingber, 1993; Choquet et al. 1997). This local reorganization of the cortical cytoskeleton may result in alterations of the microrheological behavior of the cell.
In contrast to other techniques, atomic force microscopy (AFM) (Binnig et al, 1986) enables the measurement of absolute values of G*(ω) with minimum cytoskeleton reorganization. AFM uses a sharp tip at the end of a flexible cantilever to locally indent the sample by applying loading forces to the surface whereas the tip-sample distance is controlled with a piezoactuator. Therefore, an uncoated tip can be used to apply compressive stresses directly to the cell surface without specific binding to cell membrane receptors. Given that the shape of the AFM indenter is well-defined, the use of a suitable contact elastic model enables the determination of the cell indentation and the tip-cell contact geometry. AFM has been widely used to estimate an apparent Young's modulus of several cell types by assuming that they are pure elastic material (Radmacher et al., 1996; Wu et al., 1998; Charras and Horton, 2002). However, there is little information on oscillatory mechanics probed with AFM. Shroff and co-workers applied low amplitude oscillations to cultured myocytes and computed an apparent dynamic modulus as the ratio between the applied force and cell indentation (Shroff et al., 1995). Nevertheless, this ratio did not take into account the tip-cell surface of contact. Moreover, these measurements were not corrected for the artifact of the hydrodynamic viscous drag on the cantilever. Recently, Mahaffy and co-workers reported a method to compute G*(ω) accounting for the tip-cell contact geometry (Mahaffy et al., 2000). Although this method was tested in a soft gel, it was only applied in two single fibroblasts. Moreover, the oscillatory measurements were corrected for a viscous drag estimated by oscillating the cantilever above the sample surface but not in contact. We have recently shown that the drag force increases inversely to the distance between the sample and the surface of the cantilever, and that the viscous drag in contact measurements can be more accurately determined by means of a scaled spherical hydrodynamic model for the cantilever (Alcaraz et al., 2002).
The aim of this work was to measure the complex shear modulus of lung epithelial cells in a broad frequency range from force-indentation AFM measurements corrected for the tip-cell contact geometry and for the viscous drag. Low-amplitude (50 nm) sinusoidal oscillations were applied to the surface of cultured human alveolar (A549) and bronchial (BEAS-2B) epithelial cells. Oscillations were applied at different frequencies (0.1–100 Hz) and loading forces (0.1–0.9 nN).
MATERIALS AND METHODS
Cell culture
The study was carried out in cells from human alveolar (A549) and bronchial (BEAS-2B) epithelial cell lines (CCL-185 and CRL-9609, respectively, ATCC, Manassas, VA). The cell culture medium for A549 cells consisted of HEPES (Sigma Chemical, St. Louis, MO) buffered RPMI 1640 with 10% inactivated fetal calf serum (Biological Industries, Kibbutz Beit Haemek, Israel), 1 mM L-glutamine, 100 U/ml penicillin, 100 mg/ml streptomycin (GIBCO, Gaithersburg, MD) and 2 μg/ml amphotericin B (Bristol-Myers Squibb Co., New Brunswick, NJ). BEAS-2B cells were cultured in HEPES buffered RPMI 1640 supplemented with 1% fetal calf serum, 1 mM L-glutamine, 20 μM hydrocortisone (Sigma Chemical),10 ng/ml epidermal growth factor (Calbiochem, La Jolla, CA), 10 μg/ml insulin, 50 nM sodium selenite (Sigma Chemical), 10 μg/ml human transferrin (GIBCO), and the same antibiotics. Both cell types were incubated at 37°C and 5% CO2. Two days before the experiments, cells were trypsinized and plated on 10-mm diameter glass cover slips, which had been previously washed with acetone and ethanol.
Experimental setup
The microrheology of adherent cells was probed with a homemade stand-alone atomic force apparatus mounted on the stage of an inverted optical microscope (Axiovert S100, Zeiss, Göttingen, Germany). Silicon nitride triangular cantilevers with nominal spring constant k = 0.01 N/m and cantilever length of 200 μm (uncoated Microlevers, Thermomicroscopes, Sunnyvale, CA) were used to indent the cells. The punch of the cantilever was a regular four-sided pyramid with a nominal semiincluded angle θ = 35°. These nominal k and θ values were used for data processing. A single-axis piezoelectric translator equipped with a position sensor (P.841.20, Physik Instrumente, Waldbronn, Germany) and servocontrolled with a proportional-integral analog feedback was used to drive the vertical displacement of the cantilever. The cantilever deflection (d) was measured using the optical lever method. The photodiode and position sensor (z) signals were low-pass filtered (Butterworth analog filter, 256 Hz, 8 poles), sampled with a 16-bit data acquisition board (PC-MIO-16XE-10, National Instruments, Austin, TX) and stored in a microcomputer for subsequent analysis.
Measurements
AFM measurements were carried out at room temperature on cultured glass cover slips with nonsupplemented HEPES buffered RPMI 1640 medium. The relationship between photodiode signal and cantilever deflection was calibrated before cell measurements. The calibration factor was taken as the slope of the linear relationship between the photodiode and position sensor signals recorded with the cantilever in contact with a bare region of the cultured glass cover slip. The force (F) on the cantilever was computed using Hooke's law (F = kd). The microrheology of A549 (N = 12) and BEAS-2B (N = 7) cells was probed on the central region of the cell. For each cell, we first determined the zero force offset and the contact point (zc) by recording a force-displacement (F-z) curve (6 μm/s, 3 μm of amplitude) with a maximum loading force of ∼2.5 nN. The F-z curves were obtained by monitoring F and z while the piezotranslator was ramped forward and backward over the cell at constant speed with enough amplitude to clearly discriminate between tip-cell contact and noncontact. The F-z curves were sampled at 1000 Hz and digitally low-pass filtered at 20 Hz (Butterworth, 8 poles). After ∼1 min of cell recovery, low-amplitude (50 nm) sinusoidal oscillations with frequencies (f) ranging from 0.1 to 100 Hz were applied to the piezotranslator with the cantilever in contact with the cell at a loading operating force (Fo) of ∼0.4 nN. For each oscillation frequency, we recorded at least 12 cycles of F and z signals sampled at 3000 Hz. To investigate the dependence of cell mechanical response on Fo, sinusoidal oscillations at 1 Hz were also performed at higher (∼0.9 nN) and lower (∼0.1 nN) loading forces. Measurements for the different frequencies and loading forces were applied in random order. Finally, to correct for the hydrodynamic drag force, we recorded the drag force on the cantilever (Fd) while sinusoidally oscillating the cantilever (100 Hz, 50-nm amplitude) at different tip-substrate separations (h) (0.2–8 μm) above a bare region of the glass cover slip. At each distance, the drag factor b(h) was computed as b(h) = Fd/v where v is the relative cantilever-liquid velocity ( , where the dot indicates time derivative). The drag factor at contact (b(0)) was determined by extrapolating b(h) to h = 0 with a scaled spherical hydrodynamic model (Alcaraz et al., 2002).
Data processing
The force applied on the cantilever was corrected for the zero-force offset that was computed as the mean force of the noncontact part of the F-z curve recorded on each cell. Cell indentation depth (δ) was calculated as δ = z − zc − d. Force and indentation of a four-sided pyramidal indenter are related as (Bilodeau, 1992)
 |
(1) |
where E and ν are the Young's modulus and the Poisson's ratio of the cell, respectively. ν was assumed to be 0.5. Eq. 1 was used to compute both the contact point and the complex shear modulus.
To compute zc, we expressed Eq. 1 in terms of z and d as
 |
(2) |
E and zc were estimated by least-squares fitting Eq. 2 to the loading trace of the F-z curve (0.2–0.5 nN) recorded on each cell (Rotsch et al., 1999).
For low-amplitude oscillations around an operating indentation (δo), Eq. 1 can be approximated by taking the first term of the Taylor expansion (Mahaffy et al., 2000)
 |
(3) |
Expressing Eq. 3 in terms of the shear modulus G = E/2(1 + ν) (Landau and Lifshitz, 1986) and solving it for G,
 |
(4) |
This equation can be transformed to the frequency domain through the use of the correspondence principle (Findley et al., 1976), thus providing an expression for G*(ω)
 |
(5) |
where ω is the angular frequency (ω = 2πf), and F(ω) and δ(ω) are the Fourier transforms of F and δ at ω, respectively. In contact dynamic experiments, the measured F is the sum of the force due to the sample (the cell) and the hydrodynamic drag force due to the viscous friction of the cantilever with the surrounding liquid. The drag force can be expressed as Fd = b(0)v, where v is the relative velocity between the surface of the cantilever and the liquid v = dδ/dt (Alcaraz et al., 2002). Because the drag factor does not depend on the loading force applied by the sample, b(0) can be estimated from noncontact measurements taken at different distances as described in the measurements section. The contribution of Fd in the frequency domain has the form  (where i is the imaginary unit and Fd(ω) is the Fourier transform of Fd) (Alcaraz et al., 2002). Therefore, Eq. 5 can be corrected for the hydrodynamic artifact as
 |
(6) |
Eq. 6 is the final expression used to compute G*(ω). According to this equation, the frequency dependence of the cell mechanical response is included in the term in brackets, whereas the factor (1 − ν)/(3δo tanθ) accounts for the dependence on the tip geometry, the operating indentation, and the cell Poisson's ratio.
G*(ω) data were separated into real (in-phase) and imaginary (out-of-phase) parts (G*(ω) = G′(ω) + iG″(ω)). G′(ω) is the storage modulus and it is a measure of the elastic energy stored and recovered per cycle of oscillation. G″(ω) is the loss modulus and it accounts for the energy dissipated per cycle of sinusoidal deformation (Ferry, 1980). We also computed the loss tangent G″(ω)/G′(ω), which is an index of the solidlike (≪1) or liquidlike (≫1) behavior of the cell.
The projected contact area between the pyramidal indenter and the loaded cell was computed as (Bilodeau, 1992)
 |
(7) |
This equation was used to estimate the effective pressure (P) applied by the indenter onto the surface of the cell as P = Fo/A.
Data are reported as mean ± SE. Means of G′(ω), G″(ω), and G″(ω)/G′(ω) for different operating forces were compared with one-way repeated measurements analysis of variance (ANOVA) (SigmaStat, SPSS, Chicago, IL). Statistical significance was assumed at p < 0.05.
Modeling
G*(ω) data were fitted with the power-law structural damping model (Hildebrandt, 1969; Fredberg and Stamenovic, 1989; Maksym et al., 2000; Fabry et al., 2001)
 |
(8) |
where η = tan(απ/2) is the hysteresivity or structural damping coefficient of the model, α is the power-law exponent,  is a scale factor for the storage and loss moduli and ωo is a scale factor for frequency. For simplicity, we took ωo = 1 s−1. This model assumes a storage modulus that increases with frequency following a power law with exponent α, and a loss modulus that includes a term that is a fraction η of the storage modulus and a Newtonian viscous term. This link between G′(ω) and G″(ω) by the coefficient η is a feature of the structural-damping behavior. The three independent parameters of the model (
 , α, and μ) were obtained by fitting Eq. 8 to the average G*(ω) by nonlinear regression analysis (SigmaPlot, SPSS, Chicago, IL).
RESULTS
An example of F-z curve recorded in A549 cells is shown in Fig. 1. Similar behavior was observed in BEAS-2B cells. On the left side of Fig. 1 (z < zc = 1.38 μm), both the approaching and withdrawing forces were constant, indicating that the cantilever was not in contact with the cell. The small separation between these curves was due to the hydrodynamic viscous drag on the cantilever. The average force in the noncontact part was taken as the zero-force offset. The withdrawing curve exhibited some degree of unspecific adhesion (F < 0) between the tip and the cantilever before the contact was lost. The force beyond the contact point (z > zc) exhibited a nonlinear shape due to the rise in the contact area with increasing force. At this low speed (6 μm/s), the marked hysteresis was primarily caused by energy dissipation within the cell. Young's modulus computed from the approaching curves was 1.59 ± 0.33 kPa and 1.55 ± 0.41 kPa for A549 and BEAS-2B cells, respectively.
FIGURE 1.

Illustration of the experimental process. The solid and dashed lines show an example of a force-displacement (F-z) curve recorded in the central region of an A549 cell before sinusoidal oscillation measurements. The F-z curve shows the force measured while the piezotranslator was extended (solid line) toward the cell and retracted (dashed line) at constant velocity (6 μm/s). This curve exhibits hysteresis indicative of viscoelasticity. The retracted limb shows unspecific adhesion before the tip-cell contact was lost (F < 0). The arrow indicates the estimated contact point (zc). The complex shear modulus was computed from low amplitude (50 nm) sinusoidal oscillations (0.1–100 Hz) taken at different operating points (∼0.1–0.9 nN).
The operating conditions of cell oscillatory measurements are listed in Table 1. The values of the drag factor at contact b(0) used to correct the viscous drag in the oscillatory measurements (Eq. 6) ranged from 7.02 to 9.3 μN·s/m.
TABLE 1.
Operating conditions of the oscillatory measurements on A549 and BEAS-2B cells
| A549 | A549 | A549 | BEAS-2B | BEAS-2B | BEAS-2B | |
|---|---|---|---|---|---|---|
| Fo (nN) | 0.1 ± 0.08 | 0.30 ± 0.08 | 0.68 ± 0.13 | 0.28 ± 0.09 | 0.40 ± 0.04 | 0.87 ± 0.17 |
| δo (μm) | 0.99 ± 0.11 | 1.32 ± 0.15 | 1.66 ± 0.18 | 0.78 ± 0.11 | 1.04 ± 0.09 | 1.45 ± 0.13 |
| A (μm2) | 0.76 ± 0.17 | 1.36 ± 030 | 2.13 ± 0.45 | 0.47 ± 0.13 | 0.84 ± 0.13 | 1.62 ± 0.29 |
| P (Pa) | 135 ± 104 | 224 ± 75 | 320 ± 93 | 602 ± 255 | 473 ± 90 | 535 ± 139 |
Fo, operating force; δo, operating indentation; A, contact area; P, effective pressure.
Data are mean ± SE.
Fig. 2 shows force-indentation loops obtained from the same A549 cell as in Fig. 1 at different frequencies and corrected for the viscous drag. In this figure, δ is the Fourier component of the indentation at the oscillation frequency, whereas the corresponding oscillatory component F was computed using Eq. 6. The slope and hysteresis of the loops, which can be related to cell stiffness and energy dissipation, respectively, exhibited a marked rise with frequency, even at the lowest frequencies. Although the applied oscillation amplitude was constant (50 nm), the resulting cell indentation amplitude decreased by ∼50% with increasing frequency, owing to the rise in cell stiffness and friction.
FIGURE 2.

Fourier components at the oscillation frequency, corrected for the viscous drag, of force-indentation (F-δ) loops measured at different frequencies at mean operating force Fo ∼ 0.53 nN and indentation depth δo ∼ 760 nm. The loops became steeper and exhibited larger hysteresis as frequency increased. Data were obtained in the same cell as in Fig. 1.
The components of the complex shear modulus measured at different frequencies in the alveolar and bronchial lung epithelial cells are shown in Figs. 3 and 4. G′(ω) of A549 cells was 438 Pa at the lowest frequency (0.1 Hz), and increased linearly in a log-log scale. G″(ω) was approximately threefold lower than G′(ω). Both moduli displayed similar frequency dependence up to 10 Hz, thereby exhibiting solidlike behavior characterized by a loss tangent of ∼0.33. However, G″(ω) showed a more marked frequency dependence at higher frequencies and crossovered G′(ω) at ∼100 Hz. We found similar rheological features in BEAS-2B cells, although G′(ω) and G″(ω) values were slightly higher (∼5%) (Fig. 3).
FIGURE 3.
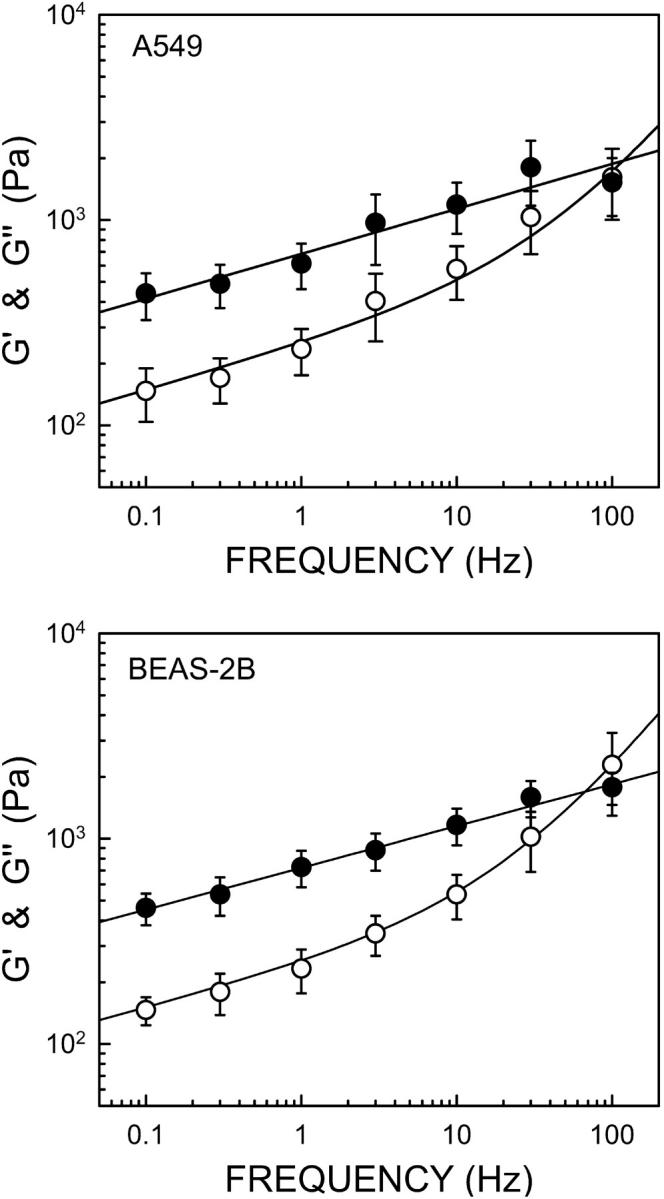
Frequency dependence of the storage modulus G′ (filled symbols) and the loss modulus G″ (open symbols) measured on A549 cells (N = 12) and on BEAS-2B cells (N = 7) at different oscillation frequencies. Data are mean ± SE. Solid lines are the fit of the power-law structural damping model (Eq. 8) (r2 = 0.95 and 0.99 for A549 and BEAS-2B, respectively). The fitted power-law exponent (α) was 0.22 for A549 and 0.20 for BEAS-2B. The Newtonian coefficient of the model (μ) was 1.68 and 2.69 Pa·s for A549 and BEAS-2B cells, respectively.
FIGURE 4.
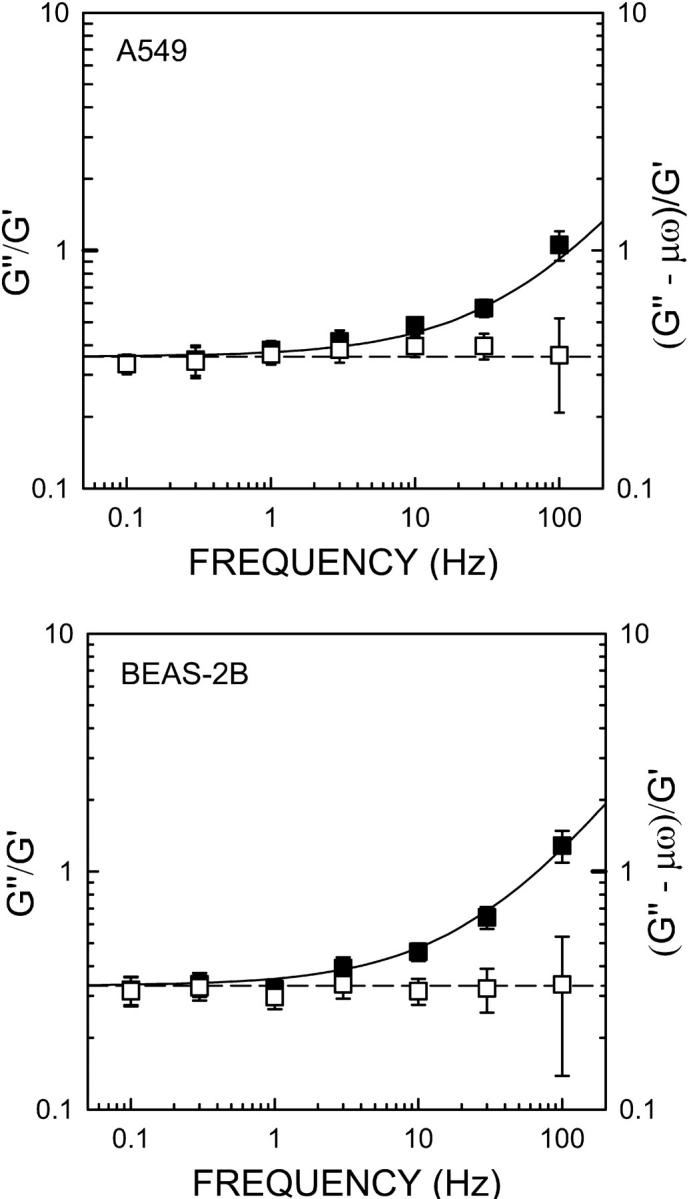
Frequency dependence of the loss tangent G″/G′ (filled symbols) measured on A549 and BEAS-2B cells. Data are mean ± SE. Solid line is the loss tangent obtained from the fit of the structural damping model (Eq. 8). The measured loss modulus corrected for the fitted Newtonian viscosity ((G″ − ωμ)/G′) (open symbols) conformed very well to the fitted constant hysteresivity of the model (η = tan(απ/2)) (dashed line). The value of η was 0.36 and 0.33 for A549 and BEAS-2B cells, respectively.
The power-law model (Eq. 8) described the complex shear modulus of both A549 (r2 = 0.95, p < 0.01) and BEAS-2B cells (r2 = 0.99, p < 0.01) very well (Figs. 3 and 4). The power-law exponent was 0.22 for A549 and 0.20 for BEAS-2B cells, and the corresponding hysteresivities were 0.36 and 0.33, respectively. Thus, both α and η were very close in both cell types.  values were slightly different (458 Pa for A549 and 496 Pa for BEAS-2B). A larger difference was observed in μ (1.68 and 2.69 Pa·s). The loss tangent was rather constant at low frequencies (<10 Hz), but it increased at larger frequencies (Fig. 4). In contrast, the loss tangent corrected by the fitted Newtonian viscosity ((G″(ω) − ωμ)/G′(ω)) was constant over the frequency range measured (Fig. 4).
The complex shear moduli of A549 and BEAS-2B cells measured at 1 Hz showed weak changes when varying the operating force. In A549 cells, G′(ω) and G″(ω) increased by 40% and 64% when Fo was increased from 0.1 to 0.7 nN, respectively, although only the increase in G″(ω) was statistically significant. The corresponding loss tangent increase (17%) did not reach statistical significance. BEAS-2B cells exhibited a weaker dependence on the loading force, and the changes in G′(ω), G″(ω), and G″(ω)/G′(ω) were found not significant.
DISCUSSION
We measured the complex shear modulus of human alveolar and bronchial epithelial cells with AFM over three frequency decades (0.1–100 Hz) and at different loading forces (∼0.1–0.9 nN). G*(ω) was obtained from force-indentation oscillatory measurements corrected for the tip-cell contact geometry and for the viscous drag. Both cell types exhibited similar viscoelastic behavior. G′(ω) data at 0.1 Hz were ∼450 Pa and they increased weakly with frequency following a power law with exponent α ∼0.2. G″(ω) was ∼2/3 lower than G′(ω) and increased similarly to it up to ∼10 Hz, but displayed a greater frequency dependence at higher frequencies. G*(ω) did not depend much on the loading force. This microrheological behavior conformed very well to the power-law model with a structural damping coefficient of ∼0.3.
The cell mechanical response was characterized by determining the complex shear modulus, which is commonly used in the rheology of soft viscoelastic bodies (Ferry, 1980). G*(ω) was computed using a mathematical expression (Eq. 6) derived from the contact elastic model corresponding to the pyramidal geometry of the AFM indenter. This expression was obtained using a similar approach to that reported by Mahaffy and co-workers (Mahaffy et al., 2000). According to Eq. 6, the frequency-independent term of G*(ω) is not simply a shape factor as was previously suggested (Radmacher et al., 1993), but depends on the operating indentation and Poisson's ratio of the cell. It should be noted that the use of conical or parabolic contact elastic models instead of the pyramidal model would overestimate this frequency-independent term (Eq. 6). Indeed, assuming δo = 1 μm and a nominal tip radius R = 50 nm, the corresponding term for the conical ((1 − ν)π/(8δo tanθ)) and parabolic ((1 − ν)/(4(Rδo)1/2) models (Sneddon, 1965) are 18% and 135% higher than the pyramidal model ((1 − ν)/(3δo tanθ)), respectively. The frequency-dependent term in Eq. 6 defines a model-free apparent dynamic modulus that characterizes the frequency dependence of the cell's mechanical properties. Nevertheless, it cannot be used to compare absolute measurements taken under different operating conditions and with different tip geometries. The apparent dynamic modulus was corrected for the viscous drag artifact (Eq. 6). The measurements of the viscous drag were consistent with data reported previously (Alcaraz et al., 2002). Cell culture medium exhibited locally a pure viscous behavior. Therefore, the induced hydrodynamic drag force on the cantilever did not alter G′(ω), but overestimated G″(ω). We found that this overestimation of G″(ω) was negligible (<5%) for frequencies ≤0.3 Hz, but it increased with frequency and became larger than 50% for oscillations above 10 Hz. It is noteworthy that the drag factor estimated at contact was different for each cantilever used (∼30% of variation) and therefore it should be determined in each experiment.
Our experimental approach was subjected to some limitations. First, we assumed that the cell is an incompressible material (ν = 0.5). This is a common assumption owing to the high water content of cells, although other authors have used lower values down to 0.3 (Charras and Horton, 2002). This uncertainty in ν may result in an overestimation of G*(ω) up to ∼25%. Second, we assumed a perfect pyramidal shape for the AFM punch (Eq. 1). Nevertheless, the actual geometry of the indenter was a blunted pyramid that merged smoothly into a spherical tip with a nominal radius (R) of 50 nm. The tip defect, defined as the distance between the actual apex of the indenter and the theoretical vertex of the pyramid (R(cosθ − 1)), was ∼32 nm. This tip defect was small compared with the indentation depth of our measurements (∼800–1600 nm) (Table 1). Thus, our complex moduli might slightly overestimate the actual values by 5–10% (Briscoe et al., 1994). Third, we did not take into account the finite thickness of the indented cells, which might overestimate G*(ω). For a spherical indenter, this overestimation can be approximated as ∼(Rδ)1/2/t, where t is the thickness of the sample (Dimitriadis et al., 2002). Taking the indentation as the apparent radius of our pyramidal tips and given the thickness of our cells (∼7 μm; measured from AFM images obtained in separate experiments) and the range of δ (Table 1), the finite thickness effect would result in an overestimation lower than ∼20%. Moreover, finite element analysis of cantilever indentation taking into account the actual geometry of the probe showed minor effects of the rigid substrate in nearly linear materials for indentations <20–30% relative to sample thickness (Costa and Yin, 1999). Therefore, our approach provided a fairly accurate estimate of G*(ω) from AFM oscillatory measurements. Moreover, these assumptions do not affect the absolute values of the loss tangent or the frequency dependence of G*(ω).
To our knowledge, G*(ω) data reported in this work are the first AFM microrheological measurements on living cells with accurate correction for the viscous drag artifact. Low-amplitude sinusoidal oscillatory measurements were first reported by Shroff and co-workers (Shroff et al., 1995). They computed the apparent dynamic modulus F(ω)/δ(ω) of cultured myocytes without correcting it for the tip-cell contact geometry or for the viscous drag. Because this latter artifact only affects G″(ω) for frequencies higher than ∼0.3 Hz, G′(ω) and the low-frequency range of G″(ω) can be estimated from Shroff's data using Eq. 5 for ν = 0.5 and compared with our data. Thus, G′(ω) of myocytes would increase smoothly with frequency (0.2–200 Hz) from ∼25 to ∼90 kPa, which are one order of magnitude greater than our values. This higher stiffness of myocytes with respect to lung epithelial cells could be attributed to the different cell type or to the primary culture origin of the myocytes. In contrast, the loss tangent at low frequencies was fairly constant ∼0.2, which is in agreement with our results. More recently, Mahaffy and co-workers measured the complex viscoelastic modulus  of two fibroblasts from 50 to 300 Hz (Mahaffy et al., 2000). G′(ω) derived from Mahaffy's data (taking ν = 0.5) fell within the same range as our values and increased weakly with frequency. However, the loss tangent at the lowest frequency was much higher than ours (∼0.9), which could be due to an overestimation of G″(ω) owing to undercorrection of viscous drag. It should be noted that the marked frequency dependence of G*(ω) observed in lung epithelial cells and in other cells, even at low frequencies, indicates that Young's modulus values reported in AFM studies are meaningless without specifying the rate of deformation at which they were obtained. The elastic shear modulus estimated from E (Eq. 2) obtained from the F-z curves (3 μm peak-to-peak amplitude, 1 Hz) using the relationship G = E/2(1 + ν) was 0.53 ± 0.11 and 0.52 ± 0.14 kPa for A549 and BEAS-2B, respectively. These values underestimate G′(ω) at the same frequency (1 Hz) by 14% for A549 and by 29% for BEAS-2B cells. The differences can be attributed to the large amplitude of the F-z curves and to the fact that the computation of E neglects the effect of energy dissipation. Thus, E provides a rough estimation of G′(ω) at the frequency of measurement.
The amplitude of G*(ω) we found in bronchial epithelial cells is one order of magnitude higher than the apparent complex modulus reported with MTC on the same cell type (BEAS-2B) (Puig-de-Morales et al., 2001). The lower values obtained with MTC can be attributed to the partial embedding of the magnetic bead in the cell surface. Indeed, a recent finite element analysis showed that 10–20% of bead embedding results in an underestimation of the actual dynamic modulus by a factor of 10 (Mijailovich et al., 2002). Other factors such as cytoskeletal remodeling induced by the bead (Plopper and Ingber, 1993) and the higher temperature (37°C) of the MTC measurements (Lo and Ferrier, 1999) might also contribute to this difference. On the other hand, our frequency dependence is in good agreement with that found with MTC between 0.03 and 16 Hz (Puig-de-Morales et al., 2001). Both the storage and the loss moduli measured with MTC revealed a weak power law with similar exponents (α ∼1/4) and a loss tangent ∼0.5 that varied little with frequency. Moreover, these data conformed well to the power-law model with an exponent of 0.27 and hysteresivity of 0.45, which are close to our values. A similar power-law frequency dependence has been observed in human airway smooth muscle cells and other cell types probed with MTC over five frequency decades (0.01– 1000 Hz) (Maksym et al., 2000; Fabry et al., 2001). Comparable frequency behavior was observed in intracellular measurements of G*(ω) by laser tracking the Brownian motion of perinuclear organules in kidney epithelial cells (Yamada et al., 2000). In contrast, a transition from a solid-like plateau to a power-law regime with a higher exponent (α ≥ 1/2) than ours has been reported in F-actin gels (Ziemann et al., 1994; Gittes et al., 1997; Palmer et al. 1999). None of these rheological features were observed in our cell measurements, thereby suggesting that F-actin models are too simple to account for the complex rheology of the cells.
Lung epithelial cells were subjected to low-amplitude oscillations in a broad frequency range including breathing frequency and at different operating forces corresponding to pressures ranging from 0.13 to 0.60 kPa (Table 1). Given the thickness of the cells, the indentations applied resulted in relative deformations of 10–20%. Lung transpulmonary pressure ranges from ∼0.1 kPa at residual lung volume to ∼3 kPa at total lung capacity (Agostoni and Hyatt, 1986). Morphometric analysis of lung electron micrographs showed a rise of ∼40% in alveolar epithelial surface area when lung volume increased this volume range (Tschumperlin and Margulies, 1999). Therefore, we probed the cells under pressures and deformations comparable with those that are developed in the lung during breathing. Under these conditions, G*(ω) of the epithelial cells showed a relatively small increase with respect to the operating force. This behavior is consistent with the weak dependence of Young's modulus on the applied force that has been obtained from AFM force-displacement curves measured on human platelets with maximum loading forces of 0.45 nN (Radmacher et al., 1996) and on fibroblasts with indentations up to 1 μm (Rotsch et al., 1999; Mahaffy et al., 2000). By contrast, a marked rise in E with force has been observed for indentations larger than 1 μm on fibroblasts (Mahaffy et al., 2000) and kidney epithelial cells (Hoh and Schoenenberger, 1994). This suggests that cell mechanics is fairly linear for applied forces < ∼1 nN and indentations < ∼1 μm.
Owing to the relatively large indentation depth and to the contact area of our measurements (Table 1), it can be assumed that we probed the mechanical response of the plasma membrane, the cytoskeleton, and the cytosol beneath the deformed cell surface (Lekka et al., 1999; You and Yu, 1999). Nevertheless, the molecular mechanisms underlying cell rheology remain poorly understood. Thus, the relationship between the components of the complex shear modulus and the different cytoskeletal elements and other internal cell structures responsible for cell microrheology has not been established yet. However, a mechanism has been suggested to account for the link between (G″(ω) − μω) and G′(ω) and for their constant ratio. This coupling between energy elastic storage and viscous dissipation may be explained if the sources of frictional and elastic stresses occur in the same stress-bearing elements (structural damping law), which are expected to reside in cytoskeletal structures (Maksym et al., 2000). It is remarkable that this coupling between energy storage and dissipation has been observed not only in different adherent cells but also in many soft biological tissues (Fredberg and Stamenovic, 1989; Wakatsuki et al., 2000). The occurrence of similar rheological features at different biological scales is consistent with the notion that the hierarchical assembly of biological structures is governed by similar architectural principles (Ingber, 1998).
Power-law frequency behavior corresponds in the time domain to a continuous distribution of relaxation time constants. Indeed, G*(ω) ∼ ωα is transformed into a relaxation modulus that decays with time as a power-law G(t) ∼ t−α (Hildebrandt, 1969). This step response corresponds to a relaxation spectrum (H(τ) ∼ −dG(t)/dlnt) with a continuous distribution of time constants whose contribution decreases also as a power law (∼τ−α). This indicates that the internal relaxation processes associated with the rheological behavior of lung epithelial cells are not tied to any particular timescale. A continuum spectrum of relaxation times is not consistent with the discrete number of time constants predicted by simple viscoelastic models (combination of springs and dashpots) used to characterize AFM step experiments (A-Hassan et al., 1998; Wu et al., 1998). These studies estimated single cell relaxation time constants at room temperature in the range of 1–10 s. Accordingly, G″(ω) should exhibit a peak and G′(ω) a sudden slope change at a characteristic frequency in the range of 0.1–1 Hz. None of these features were observed in our data. This discrepancy could be due to the limited timescale of these step measurements and to the lack of correction for the viscous drag (A-Hassan et al., 1998). Finally, it should be noted that a spring-dashpot combination featuring a simple cell model of an elastic cell membrane enclosing a viscous cytoplasm (Stamenovic and Wang, 2000) fails to account for the power-law cell dynamics we found.
The power-law rheology of the cells reflects molecular adjustments of the cytoskeleton matrix over a wide range of timescales. A physical basis of this power-law empiricism has recently been suggested by Fabry and co-workers (Fabry et al., 2001), who interpreted this model as a particular case of soft glassy rheology (SGR) (Sollich et al., 1997). According to this theory, cell rheology can be considered as a result of complex relaxation of its structural elements, which are agitated and rearranged by mutual weak interactions within its internal matrix. This structural relaxation suggests that cytoskeleton elements are not permanently attached to each other, allowing molecular rearrangements and flow. This interpretation assumes that the glassy behavior is a natural consequence of disorder and metastability of cell internal structures. According to SGR, the power-law exponent α is related to matrix agitation. Thus, soft glassy materials exhibit a solidlike behavior in the limit of α = 0 (where the glass transition takes place) and fluidlike features for α = 1. The weak exponent we found (α ∼ 0.2) suggests that the rheology of lung epithelial cells resembled that of a soft glassy material close to the glass transition. Moreover, the similar G*(ω) we observed in two different cell types is consistent with the SGR hypothesis that glassy dynamics is not a feature of particular molecular mechanisms but is rather a reflection of a generic system property at some higher level of structural organization (Sollich et al., 1997; Fabry et al., 2001). SGR offers a new conceptual framework with which to explain how cells maintain their shape or flow during different cellular processes such as contraction, spreading, locomotion, and crawling. Changes between fluid- and solidlike features revealed during these processes have been attributed to a sol-gel transition regulated by covalent cross-linking of actin filaments (Stossel, 1993). Instead, SGR suggests that changes in the level of internal disorder and matrix agitation associated with cytoskeleton contraction or remodeling might modulate the ability of the cell to maintain its shape or to flow.
CONCLUSIONS
Atomic force microscopy was used to measure the complex shear modulus of alveolar and bronchial epithelial cells over three frequency decades with applied strains and stresses in the physiological range. Both alveolar and bronchial cells revealed similar viscoelastic features, thus indicating that they have similar structural organization. The storage modulus increased with frequency following a power law with a weak exponent. The cells exhibited a predominantly elastic behavior at low frequencies with the loss modulus increasing with the same power law. The loss modulus showed a sharper increase at higher frequencies although it did not attain a pure Newtonian viscous behavior. Both moduli depended weakly on the loading force, indicating a fairly linear behavior of the cells under the experimental conditions. This rheological behavior conformed to the structural damping law suggesting a coupling between elastic and frictional processes within the cell. The power-law frequency dependence indicates a complex cell dynamics with no characteristic frequency or timescale. The measured rheological features were not consistent with simple linear viscoelastic models based on a combination of a discrete number of springs and dashpots. In contrast, the rheology of lung epithelial cells resembled that of soft glassy materials close to a glass transition, which suggests that structural disorder and metastability may be fundamental features of cell organization.
Acknowledgments
The authors thank Miguel Rodriguez for his technical assistance, and M. Rotger and J.J. Fredberg for their helpful comments and suggestions.
This work was supported in part by grants from the Ministerio de Ciencia y Techología (SAF-2002-03616), (DGESIC-PM980027), and National Institues of Health (HL-65960).
References
- Agostoni, E., and R. E. Hyatt. 1986. Static behavior of the respiratory system. In Handbook of Physiology. The Respiratory System, Vol. 3, Sec. 3, Chap. 9. A. P. Fishman, editor. Am. Physiol. Soc., Washington, DC. 113–130.
- A-Hassan, E., W. Heinz, M. D. Antonik, N. P. D'Costa, S. Nageswaran, C. A. Schoenenberger, and J. H. Hoh. 1998. Relative microelastic mapping of living cells by atomic force microscopy. Biophys. J. 74:1564–1578. [DOI] [PMC free article] [PubMed] [Google Scholar]
- Alcaraz, J., L. Buscemi, M. Puig-de-Morales, J. Colchero, A. M. Baró, and D. Navajas. 2002. Correction of microrheological measurements of soft samples with atomic force microscopy for the hydrodynamic drag on the cantilever. Langmuir. 18:716–721. [Google Scholar]
- Bausch, A. R., F. Ziemann, A. A. Boulbitch, K. Jacobson, and E. Sackmann. 1998. Local measurements of viscoelastic parameters of adherent cell surface by magnetic bead microrheology. Biophys. J. 75:2038–2049. [DOI] [PMC free article] [PubMed] [Google Scholar]
- Bilodeau, G. 1992. Regular pyramid punch problem. J. Appl. Mech. 59:519–523. [Google Scholar]
- Berrios, J. C., M. A. Schroeder, and R. D. Hubmayr. 2001. Mechanical properties of alveolar epithelial cells in culture. J. Appl. Physiol. 91:65–73. [DOI] [PubMed] [Google Scholar]
- Binnig, G., C. F. Quate, and C. Gerber. 1986. Atomic force microscope. Phys. Rev. Lett. 56:930–933. [DOI] [PubMed] [Google Scholar]
- Briscoe, B. J., K. S. Sebastian, and M. J. Adams. 1994. The effect of indenter geometry on the elastic response to indentation. J. Phys. D: Appl. Phys. 27:1156–1162. [Google Scholar]
- Costa, K. D., and F. C. P. Yin. 1999. Analysis of indentation: implications for measuring mechanical properties with atomic force microscopy. J. Biomech. Eng. Trans. ASME. 121:462–471. [DOI] [PubMed] [Google Scholar]
- Charras, G., and M. Horton. 2002. Determination of cellular strains by combined atomic force microscopy and finite element modeling. Biophys. J. 83:858–879. [DOI] [PMC free article] [PubMed] [Google Scholar]
- Chicurel, M. E., C. S. Chen, and D. E. Ingber. 1998. Cellular control lies in the balance of forces. Curr. Opin. Cell Biol. 10:232–239. [DOI] [PubMed] [Google Scholar]
- Choquet, D., D. P. Felsenfeld, and M. P. Sheetz. 1997. Extracellular matrix rigidity causes strengthening of integrin-cytoskeleton linkages. Cell. 88:39–48. [DOI] [PubMed] [Google Scholar]
- Dimitriadis, E. K., F. Horkay, J. Maresca, B. Kachar, and R. S. Chadwick. 2002. Determination of elastic moduli of thin layers of soft material using the atomic force microscope. Biophys. J. 82:2798–2810. [DOI] [PMC free article] [PubMed] [Google Scholar]
- Fabry, B., G. N. Maksym, J. Butler, M. Glogauer, D. Navajas, and J. Fredberg. 2001. Scaling the microrheology of living cells. Phys. Rev. Lett. 87:148102–148105. [DOI] [PubMed] [Google Scholar]
- Ferry, J. D. 1980. Viscoelastic Properties of Polymers. John Wiley and Sons, New York.
- Findley, W., J. Lai, and K. Onaran. 1976. Creep and Relaxation of Nonlinear Viscoelastic Materials. Dover Publications, Inc., New York.
- Fredberg, J. J., and D. Stamenovic. 1989. On the imperfect elasticity of lung tissue. J. Appl. Physiol. 67:2408–2419. [DOI] [PubMed] [Google Scholar]
- Gittes, F., B. Schnurr, P. D. Olmsted, F. C. MacKintosh, and C. F. Schmidt. 1997. Microscopic viscoelasticity: shear moduli of soft materials determined from thermal fluctuations. Phys. Rev. Lett. 79:3286–3289. [Google Scholar]
- Heidemann, S. R., S. Kaech, R. E. Buxbaum, and A. Matus. 1999. Direct observations of the mechanical behaviors of the cytoskeleton in living fibroblasts. J. Cell Biol. 145:109–122. [DOI] [PMC free article] [PubMed] [Google Scholar]
- Hildebrandt, J. 1969. Comparison of mathematical models for cat lung and viscoelastic balloon derived by Laplace transform methods from pressure-volume data. Bull. Math. Biophys. 31:651–667. [DOI] [PubMed] [Google Scholar]
- Hoh, J. H., and C. A. Schoenenberger. 1994. Surface morphology and mechanical properties of MDCK monolayers by atomic force microscopy. J. Cell Sci. 107:1105–1114. [DOI] [PubMed] [Google Scholar]
- Huang, S., and D. E. Ingber. 1999. The structural and mechanical complexity of cell-growth control. Nat. Cell Biol. 1:E131–E138. [DOI] [PubMed] [Google Scholar]
- Ingber, D. 1998. The architecture of life. Sci. Am. 278:48–57. [DOI] [PubMed] [Google Scholar]
- Janmey, P. 1998. The cytoskeleton and cell signaling: component localization and mechanical coupling. Physiol. Rev. 78:763–781. [DOI] [PubMed] [Google Scholar]
- Landau, L. D., and E. M. Lifshitz. 1986. Theory of Elasticity. Pergamon Press, Oxford.
- Lekka, M., P. Laidler, D. Gil, J. Lekki, Z. Stachura, and A. Z. Hrynkiewicz. 1999. Elasticity of normal and cancerous human bladder cells studied by scanning force microscopy. Eur. Biophys. J. 28:312–316. [DOI] [PubMed] [Google Scholar]
- Lo, C. M., and J. Ferrier. 1999. Electrically measuring viscoelastic parameters of adherent cell layers under controlled magnetic forces. Eur. Biophys. J. 28:112–118. [DOI] [PubMed] [Google Scholar]
- Mahaffy, R. E., C. K. Shih, F. C. MacKintosh, and J. Kas. 2000. Scanning probe-based frequency-dependent microrheology of polymer gels and biological cells. Phys. Rev. Lett. 85:880–883. [DOI] [PubMed] [Google Scholar]
- Maksym, G. N., B. Fabry, J. P. Butler, D. Navajas, D. J. Tschumperlin, J. D. Laporte, and J. J. Fredberg. 2000. Mechanical properties of cultured human airway smooth muscle cells from 0.05 to 0.4 Hz. J. Appl. Physiol. 89:1619–1632. [DOI] [PubMed] [Google Scholar]
- Mijailovich, S. M., M. Kojic, M. Zivkovic, B. Fabry, and J. J. Fredberg. 2002. A finite element model of cell deformation during magnetic bead twisting. J. Appl. Physiol. 93:1429–1436. [DOI] [PubMed] [Google Scholar]
- Palmer, A., T. G. Mason, J. Xu, S. C. Kuo, and D. Wirtz. 1999. Diffusing wave spectroscopy microrheology of actin filament networks. Biophys. J. 76:1063–1071. [DOI] [PMC free article] [PubMed] [Google Scholar]
- Plopper, G., and D. E. Ingber. 1993. Rapid induction and isolation of focal adhesion complexes. Biochem. Biophys. Res. Commun. 193:571–578. [DOI] [PubMed] [Google Scholar]
- Puig-de-Morales, M., M. Grabulosa, J. Alcaraz, J. Mullol, G. N. Maksym, J. J. Fredberg, and D. Navajas. 2001. Microrheology of cultured airway epithelial cells measured by magnetic twisting cytometry with frequency domain demodulation. J. Appl. Physiol. 91:1152–1159. [DOI] [PubMed] [Google Scholar]
- Radmacher, M., R. W. Tillmann, and H. E. Gaub. 1993. Imaging viscoelasticity by force modulation with the atomic force microscope. Biophys. J. 64:735–742. [DOI] [PMC free article] [PubMed] [Google Scholar]
- Radmacher, M., M. Fritz, C. M. Kacher, J. P. Cleveland, and P. K. Hansma. 1996. Measuring the viscoelastic properties of human platelets with the atomic force microscope. Biophys. J. 70:556–567. [DOI] [PMC free article] [PubMed] [Google Scholar]
- Rotsch, C., K. Jacobson, and M. Radmacher. 1999. Dimensional and mechanical dynamics of active and stable edges in motile fibroblasts investigated by using atomic force microscopy. Proc. Natl. Acad. Sci. USA. 96:921–926. [DOI] [PMC free article] [PubMed] [Google Scholar]
- Shroff, S. G., D. R. Saner, and R. Lal. 1995. Dynamic micromechanical properties of cultured rat atrial myocytes measured by atomic-force microscopy. Am. J. Physiol. Cell Physiol. 38:C286–C292. [DOI] [PubMed] [Google Scholar]
- Sneddon, I. N. 1965. The relaxation between load and penetration in the axisymmetric Boussinesq problem for a punch of arbitrary profile. Int. J. Engng. Sci. 3:47–57. [Google Scholar]
- Sollich, P., F. Lequeux, P. Hébraud, and M. Cauberghs. 1997. Rheology of soft glassy materials. Phys. Rev. Lett. 78:2020–2023. [Google Scholar]
- Stamenovic, D., and M. F. Coughlin. 1999. The role of prestress and architecture of the cytoskeleton and deformability of cytoskeletal filaments in mechanics of adherent cells: a quantitative analysis. J. Theor. Biol. 201:63–74. [DOI] [PubMed] [Google Scholar]
- Stamenovic, D., and N. Wang. 2000. Cellular responses to mechanical stress. Invited review: engineering approaches to cytoskeletal mechanics. J. Appl. Physiol. 89:2085–2090. [DOI] [PubMed] [Google Scholar]
- Stossel, T. P. 1993. On the crawling of animal cells. Science. 260:1086–1094. [DOI] [PubMed] [Google Scholar]
- Thoumine, O., and A. Ott. 1997. Time scale dependent viscoelastic and contractile regimes in fibroblasts probed by microplate manipulation. J. Cell Sci. 110:2109–2116. [DOI] [PubMed] [Google Scholar]
- Tschumperlin, D. J., and S. S. Margulies. 1999. Alveolar epithelial surface area-volume relationship in isolated rat lungs. J. Appl. Physiol. 86:2026–2033. [DOI] [PubMed] [Google Scholar]
- Wakatsuki, T., M. Kolodney, G. Zahalak, and E. Elson. 2000. Cell mechanics studied by a reconstituted model tissue. Biophys. J. 79:2353–2368. [DOI] [PMC free article] [PubMed] [Google Scholar]
- Wirtz, H. R., and L. G. Dobbs. 2000. The effects of mechanical forces on lung functions. Respir. Physiol. 119:1–17. [DOI] [PubMed] [Google Scholar]
- Wu, H. W., T. Kuhn, and V. T. Moy. 1998. Mechanical properties of l929 cells measured by atomic force microscopy: effects of anticytoskeletal drugs and membrane crosslinking. Scanning. 20:389–397. [DOI] [PubMed] [Google Scholar]
- Yamada, S., D. Wirtz, and S. C. Kuo. 2000. Mechanics of living cells measured by laser tracking microrheology. Biophys. J. 78:1736–1747. [DOI] [PMC free article] [PubMed] [Google Scholar]
- You, H., and L. Yu. 1999. Atomic force microscopy imaging of living cells: progress, problems and prospects. Methods Cell Sci. 21:1–17. [DOI] [PubMed] [Google Scholar]
- Zhu, C., G. Bao, and N. Wang. 2000. Cell mechanics: mechanical response, cell adhesion, and molecular deformation. Annu. Rev. Biomed. Eng. 02:189–226. [DOI] [PubMed] [Google Scholar]
- Ziemann, F., L. Rädler, and E. Sackmann. 1994. Local measurements of viscoelastic moduli of entangled actin networks using an oscillating magnetic bead micro-rheometer. Biophys. J. 66:2210–2216. [DOI] [PMC free article] [PubMed] [Google Scholar]