

Abstract
We use the well-known structural and functional properties of the gramicidin A channel to test the appropriateness of force fields commonly used in molecular dynamics (MD) simulations of ion channels. For this purpose, the high-resolution structure of the gramicidin A dimer is embedded in a dimyristoylphosphatidylcholine bilayer, and the potential of mean force of a K+ ion is calculated along the channel axis using the umbrella sampling method. Calculations are performed using two of the most common force fields in MD simulations: CHARMM and GROMACS. Both force fields lead to large central barriers for K+ ion permeation, that are substantially higher than those deduced from the physiological data by inverse methods. In long MD simulations lasting over 60 ns, several ions are observed to enter the binding site but none of them crossed the channel despite the presence of a large driving field. The present results, taken together with many earlier studies, highlights the shortcomings of the standard force fields used in MD simulations of ion channels and calls for construction of more appropriate force fields for this purpose.
INTRODUCTION
Molecular dynamics (MD) has become an indispensable tool in studies of biomolecules with wide-ranging applications from enzyme catalysis to protein structure and interactions (Wang et al., 2001; Hansson et al., 2002). The key inputs in all classical MD studies are the force fields used in the simulations. Ideally, the force fields should be determined from ab initio quantum mechanical calculations. However, this is a difficult route to follow in practice, and phenomenological approaches that rely on fitting the force field parameters to the bulk properties of proteins and lipids in solution have become the norm in all well-established MD packages, such as AMBER (Weiner et al., 1984), CHARMM (Brooks et al., 1983) and GROMACS (Hermans et al., 1984). Typically, nonbonded interactions are represented in terms of the pairwise Coulomb and Lennard-Jones interactions, and harmonic constraints are employed to represent the covalent bonds among the protein and lipid atoms. Despite their simplicity and neglect of polarization effects, these force fields have been quite successful in description of protein-lipid complexes. Careful parameterization and their continuous updating have, no doubt, been instrumental in this success.
Whereas it is generally acknowledged that the polarization effects are important and should be included in the parameterization of the force fields (Partenskii and Jordan, 1992; Halgren and Damm, 2001), there is still a perceivable ambivalence toward achieving this goal. Heavy computational overheads constituted a valid reason for ignoring polarization a decade ago, but this is not true anymore. A more likely reason for the present reluctance is the lack of compelling evidence that demonstrates unequivocally the failure of the standard force fields. It is worthwhile to emphasize that these force fields do include the polarization effects implicitly at the mean field level through the use of effective dipole moments that are larger than the gas-phase values. The problem in making a case for an explicit inclusion of polarization is that the mean field treatment is found to be quite adequate in current MD simulations of biomolecules, and it is difficult to argue with success.
One biological process that could provide evidence for the breakdown of the standard force fields is the permeation of ions across membrane channels (Kuyucak et al., 2001; Tieleman et al., 2001). Force fields for ions and water molecules are optimized from the bulk properties of electrolyte solutions, and therefore, the standard force fields provide an excellent description of ions in bulk water. But when an ion enters from bulk water to a channel, it encounters a rather different environment. First, the channel is made of protein molecules which have very different polarization characteristics compared to water. Secondly, because of confinement, the water molecules in the pore are likely to have a different response to the ion compared to those in bulk. Under these circumstances, one could expect the average treatment of polarization effects in the standard force fields to be inadequate for description of ion permeation in channels.
Here we investigate the above conjecture using the gramicidin A (GA) channel as a test case, which arguably is the best candidate for this purpose. The molecular structure of the GA channel has been known since the early seventies (Urry, 1971), and more recently, its structure has been refined to a high-resolution using solid-state (Ketchem et al., 1993, 1997; Koeppe et al., 1994) and liquid-state (Arseniev et al., 1986; Townsley et al., 2001) NMR. Functional properties of the GA channel are also very well known from numerous physiological studies (Andersen and Koeppe, 1992; Busath, 1993). In addition, the channel's structure is such that ion permeation energetics are governed by strong interactions among the ion, peptide, and water, making it easier to uncover any inadequacies in their treatment by current MD force fields. Thus, as far as testing models using the structure-function relationship is concerned, the GA channel remains unrivalled among ion channels. The most direct test would be to calculate the conductance of ions in the GA channel from MD simulations and compare it with the experimental data. Unfortunately, this is not as yet feasible with the current computers, and we need to resort to a more indirect method; namely, calculate the potential of mean force (PMF) for an ion traversing the channel from MD and estimate the conductance from this PMF using a more coarse grained method such as Brownian dynamics (BD) simulations. In fact, BD simulations have already been used in extracting plausible PMF profiles for conduction of K+ ions in the GA channel. Edwards et al. (2002) constructed a potential energy profile for a K+ ion moving across the pore, which reproduces all the experimental data when incorporated in BD simulations. Thus the proposed test simply involves comparison of the PMF determined from MD with that extracted from experiments via the inverse method using BD simulations.
Since GA has been the subject of numerous computational studies in the past (for reviews, see Pullman, 1987; Partenskii and Jordan, 1992; Roux and Karplus, 1994; Roux, 2002), it may appear surprising that such a test has not been performed earlier. There were indeed a number of PMF calculations for monovalent cations in the GA channel that predicted large central barriers incompatible with the experimental observations (e.g., Jordan, 1990; Roux and Karplus, 1993). However, due to limitations in computing power, simplified representations of the channel-lipid complex were used in these earlier calculations. Thus, the observed discrepancies could be due to shortcomings in the model system rather than in the force fields. There currently exists no PMF calculation that employs the full atomic structure of the GA dimer embedded in a lipid bilayer, and gives a continuous profile from outside to the center of the channel. There are some PMF calculations satisfying the first criterion (e.g., Woolf and Roux, 1997) but these are limited to the vicinity of the binding site at the channel entrance, and therefore could not be used for the proposed test.
METHODS
Model system
The initial MD system consists of the GA dimer embedded in a bilayer consisting of 96 dimyristoylphosphatidylcholine (DMPC) molecules and 3209 water molecules, corresponding to over 33 water molecules per lipid molecule, easily sufficient for solvation of headgroups. The procedure for the generation of the bilayer and inclusion of the channel protein is described by Chiu et al. (1995, 1999), who kindly provided the initial coordinates for the simulation system. The initial GA structure consists of one monomer with coordinates from Ketchem et al. (1997), and a second monomer from Koeppe et al. (1994), which exhibit different rotomers of the Trp-9 indole ring. The Koeppe et al. monomer sits at the top (positive z) and the Ketchem et al. monomer (with stacked Trp-9 and 15 indole rings) sits at the bottom, as illustrated in Fig. 2. In some earlier MD simulations, an 8:1 DMPC/GA ratio was employed to emulate the conditions of the NMR experiments (Woolf and Roux, 1994, 1997; Tang et al., 2000). We prefer the 48:1 DMPC/GA ratio here because it reflects the excess lipid condition in physiological experiments better.
FIGURE 2.

The model system: GA dimer embedded in a DMPC bilayer and solvated with 3191 water molecules and nine pairs of KCl ions. K+ ions are indicated by yellow spheres and Cl− ions by green spheres.
The initial structure is placed in an orthorhombic periodic box and equilibrated with surface-tension coupling. Using a coupling time-constant of 1 ps, a pressure coupling of 1 atm is applied in the z-direction and a surface tension of 46 dyn/cm in the xy-plane. When the system is equilibrated with this surface-tension coupling for long periods, large changes in surface area of the membrane are observed. The system area, measured over a simulation period of 24 ns, is shown in Fig. 1 (gray line). The same test is repeated with a 150-mM solution of KCl in the reservoirs and the surface area of the membrane is again plotted in Fig. 1 (black line). It is seen that, although the ions tend to stabilize the membrane slightly, the change in the size of the system is still too large to enable reliable calculations. Similar scale variations in the surface area of the membrane have been seen by Lindahl and Edholm (2000), which is attributed to low frequency oscillations in the area of the lipid. Thus it is concluded that with the chosen structure and force fields, surface-tension coupling is inappropriate for maintaining the shape of the membrane over such long time scales.
FIGURE 1.

Change in the surface area of the membrane during a 24-ns simulation that employed surface-tension coupling. The gray line shows the simulation results without ions in the system and the black line, those with a 150-mM KCl solution.
Therefore, in the remaining simulations, the periodic box is fixed in the x- and y-directions, while it experiences Berendsen pressure coupling (Berendsen et al., 1984) in the z-direction, parallel to the normal of the membrane and the axis of the GA channel. Since the volume compressibility of water and lipid are very similar (Braganza and Worchester, 1986), a value of 4.5 × 10⁻⁵atm−1 is used to define the rescaling of coordinates for the z-pressure coupling at 1 atm. The z-dimension of the box is 66 Å after an equilibration period of 24 ns. The x- and y-dimensions of the box are 67 and 51.5 Å, respectively. This gives an area of 3450 Å2, or 67 Å2 per lipid after subtracting 250 Å2 for the area of the GA peptide orthogonal to the channel axis (Woolf and Roux, 1996). In other simulations of GA with DMPC, similar areas per lipid has been found, e.g., 64 Å2 (Woolf and Roux, 1994) and 69 Å2 (Tang et al., 2000). All the MD values are slightly larger than the experimental value of 59.6 Å2 (Nagle and Tristram-Nagle, 2000), which is presumably due to the small system size. The fixed surface area has been employed in previous simulations of the GA channel (Woolf and Roux, 1994, 1997) to avoid the large fluctuations and maintain a well-defined area per lipid throughout the simulations.
Fig. 2 shows the system structure after the initial equilibration period with the semi-isotropic pressure coupling, using the MD procedure described below. Following equilibration for 2 ns, 18 water molecules in the reservoirs are replaced by nine pairs of potassium and chloride ions to create an electrolyte solution of ∼150 mM. These ions are indicated in Fig. 2. In one set of simulations studying ion binding to GA, number of ion pairs is increased to 28 corresponding to a 500-mM electrolyte solution. Further simulations with ions in place are described below.
Molecular dynamics
Calculations have been carried out with the GROMACS 3.0 program (Lindahl et al., 2001; Berendsen et al, 1995). We have employed both the extended-atom GROMACS (Berendsen et al, 1995) and the all-hydrogen CHARMM PARAM27 (Mackerell et al., 1998) force fields. These two force fields are known to possess significantly different ion-protein solvation properties (Roux and Bernèche, 2002), and therefore any congruence between their predictions for the PMF should make the conclusions drawn more robust. Simulations with the CHARMM force field are also carried out using the GROMACS program because of the considerable increase in computational speed (up to a factor of 5). To ensure that the CHARMM force field is correctly translated into GROMACS 3.0, we have carried out short simulations with the PARAM27 force field using the CHARMM v.25 program (Brooks et al., 1983) and compared the bonded and nonbonded energy components with those obtained from the GROMACS runs. With the exception of the Urey-Bradley angle-energy terms, for which harmonic functions of bond angle can be found that accurately reproduce the 1–3 bond constraints, the conversion of the PARAM27 force field into GROMACS format is straightforward.
In order to use the all-hydrogen force field of PARAM27, all hydrogen atoms on nonpolar groups are added by CHARMM using the bonded geometry of that force field. The number of atoms in the system, after adding hydrogens to the GA dimer and DMPC bilayer, increased from 14,323 to 21,471, making simulations with the PARAM27 force field ∼2.7 times longer than those with the GROMACS force field. Bonded and nonbonded parameters for DMPC molecules with the GROMACS force field are those derived by Chiu et al. (1995). The same atomic charges and charge groups as determined by Chiu et al. (1995) have been used. Default CHARMM PARAM27 parameters (Schlenkrich et al., 1996) have been employed for DMPC molecules in the case of that force field. Similarly lipid-protein and lipid-water interactions are as defined in those force fields.
The water model employed with the GROMACS force field is SPC (simple point charge, Berendsen et al., 1981). Since the water inside the channel is far from bulk-like, the additional polarization contributions of the extended SPC (Berendsen et al., 1987) with respect to the original SPC are not likely to be appropriate for the study of ion channels (Tieleman et al., 1997). The water model used with the CHARMM PARAM27 force field is TIP3P (transferable intermolecular potential with three points, Jorgensen et al., 1983), because of the particular design of PARAM27 for this water model. Ion-water, ion-protein, and ion-lipid interactions use the default GROMACS and PARAM27 parameters. For GROMACS, this involves the ionic parameters of Straatsma and Berendsen (1998), whereas for PARAM27 the parameters of Beglov and Roux (1994) are implemented.
Terminal residues formyl and ethanolamide are assigned atomic partial charges based on most similar atomic groups in other residues in the force fields. The formyl termini have been patched onto the last valine residue in the sequence of each monomer. Carbonyl and amide groups are far less polar in the GROMACS force field compared to those in CHARMM PARAM27. For example, the charges on N- and H-atoms in CHARMM are −0.47 and +0.31e, while those for GROMACS are −0.28 and +0.28e, respectively. Similarly for carbonyl dipoles, the charge on C- and O-atoms for CHARMM are +0.51 and −0.51e, whereas those for GROMACS are +0.38 and −0.38e, respectively.
Following the procedure employed by Chiu et al. (1995, 1999), all bonds have been constrained with the GROMACS force field. This is done to prevent a large change in the starting structure as received from that group. However, the constraining of bonds involving heavy atoms does affect the thermodynamics of the system and is therefore not desirable. Thus, when employing the PARAM27 all-hydrogen force field, only bonds involving hydrogen atoms are constrained. This results in additional speed of the GROMACS force field with respect to the CHARMM force field. All constraints used the LINCS algorithm of GROMACS (Lindahl et al., 2001).
Electrostatic interactions are computed without any truncation using the particle-mesh Ewald algorithm implemented in GROMACS. Because of the sensitivity of the PMF to the long-ranged interactions with the remainder of the system, such a treatment of electrostatics is essential. A Fourier spacing of 1.4 Å is used, with cubic interpolation. The list of nonbonded interactions is truncated at 10 Å, whereas Lennard-Jones interactions are computed out to 15 Å. Berendsen temperature coupling is used during all equilibration to maintain a temperature of 298 K. A time-step of 2 fs is employed for all simulations and trajectory data is written at 2-ps intervals during equilibration, and at 20-fs intervals during analysis runs.
Initial equilibration runs, as described in the previous section, consisted of steepest descent minimization with 1000 steps, followed by heating to 298 K over 50 ps, and then equilibration with temperature coupling, with and without ionic solution. This equilibration is carried out for 24 ns with surface-tension coupling, or 2 ns with semi-isotropic pressure coupling in the z-direction. After this period, the system is transformed into an all-hydrogen system, and a further 2 ns of equilibration is carried out with the PARAM27 force field. In the case of the GROMACS force field, a K+ ion is interchanged with a water molecule near the binding site, assumed to be near z = 10 Å from the center of mass of the GA dimer (Woolf and Roux, 1997). This ion is held with a 1-dimensional harmonic constraint of 10 kT/Å2 for a further 2 ns of simulation. This is to be the starting point for PMF calculations with that force field. Because of the longer computational times with the all-hydrogen PARAM27 force field, three starting points are generated. These are at approximately z = 0, 10, and 15 Å from the center of mass of the GA dimer. Equilibration for ∼1 ns is carried out at each position before profile calculation, to be described below, is carried out. We have checked the directionality of the results in a few sample calculations where the ion is moved in the opposite direction.
Equilibration is carried out on one or four CPUs of a 667-mHz Compaq Alphaserver. Simulation times with the GROMACS force field are ∼52 h/ns on a single CPU, and 15 h on four CPUs. With the CHARMM PARAM27 force field the times are increased to ∼140 and 41 CPU h/ns, for one and four CPUs, respectively.
Umbrella sampling
The potential of mean force W(z) of potassium ions along the GA channel axis is related to their average distribution function 〈ρ(z)〉 as
 |
(1) |
where z0 is a reference point in the bulk solution. As will be seen below, generation of adequate samples of ion distribution in the GA channel from MD simulations remains problematic within the limited time available, and Eq. 1 cannot be used in a direct manner to obtain the PMF. This problem has been overcome using the umbrella sampling method of Torrie and Valleau (1977). We introduce harmonic biasing potentials of the form
 |
(2) |
to constrain an ion to the neighborhood of zi and hence enhance its sampling in that window. For each window potential wi, MD simulations are carried out to obtain the biased ion distribution. These distributions are then unbiased and combined to give a PMF by means of the weighted histogram analysis method (Kumar et al., 1992). A detailed description of this method as employed in the present work is given by Souaille and Roux (2001).
The direction of z- in the window potential is a constant, parallel to the side of the simulation box, and does not vary with the orientation of the GA dimer. Analysis over a test simulation where an ion is slowly moved into the channel shows that the maximum deviation in the channel axis, as measured through the center of mass of each monomer, is 17°. This corresponds to a cosine of ∼5%, leading to a maximum error of 0.5 Å in the ion position near the binding site. Since the depth and not the exact position of the binding site is the key result in the study, such an error may be overlooked, and correction for small rotations may be neglected.
To ensure a large overlap of configurations, a window size of Δz = 0.2 Å and a force constant of K = 25 kT/Å2 are used. The window potential (Eq. 2) has the value wi = 0.125 kT at the window boundary, rising to 1.5 kT at z − zi = 0.35 Å. So a test ion will have no impediment in visiting the neighboring window. In test simulations using other values of Δz and K, no discernible effects on the calculated PMFs are observed. The biased ion distributions are determined using a bin size of 0.05 Å. Again tests using larger (up to 0.2 Å) or smaller (down to 0.01 Å) bin sizes have led to similar PMF profiles. Therefore, the above parameters for the window potential and bin size are employed in all the PMF calculations. Simulation times of 60–100 ps for each window have been used. Using longer simulation times has also had no effect on the PMF. Simulations within each window consist of 10 ps of equilibration followed by 50 ps of trajectory generation, for the case of the 60-ps simulations, or 20-ps of equilibration and 80-ps of production for the 100-ps simulations. During the equilibration periods, while the ion is adjusting to it's new window function from the adjacent window, temperature coupling at 298 K is invoked. Half of the PMF profiles are obtained without invoking temperature coupling during the production periods. This absence of coupling has been seen to have no noticeable impact on the mean temperature.
The z-coordinate of the constrained ion is recorded at every time step. Each PMF profile is constructed using ∼100 windows, corresponding to sampling of roughly 2.5 million configurations. Thus the final PMF, which is the average of 10 such profiles, is based on 25 million configurations. For comparison, a previously calculated PMF of the sodium ion across the GA binding site was based on 12,000 configurations (Woolf and Roux, 1997).
RESULTS AND DISCUSSION
MD simulations of binding and permeation
The computational power provided by an Alphaserver is such that one can simulate the system for tens of nanoseconds and get information about ion binding and conduction in the GA channel by brute force. The present simulations of the GA-lipid system are more than an order-of-magnitude longer than similar MD studies performed in the past (e.g., Chiu et al., 1999; Tang et al., 2000). Whereas the present MD simulations are still not long enough to provide sufficient configurational sampling, they do compliment the PMF results given in the next section, thus reinforcing the conclusions.
To set some appropriate time scales for the simulations, we analyze the conductance data for K+ ions in the GA channel (Andersen, personal communication, 2000). Fitting the current-concentration data at 0.4-V applied voltage using the Michaelis-Menten equation.
 |
(3) |
yields Imax = 19 pA for the maximum current and Ks = 0.63 M for the half-maximum concentration. If we assume that the transit time of ions across the binding sites is independent of concentration, and the access time is inversely proportional to it, they can be estimated from Imax and Ks as
 |
(4) |
where e is the unit charge, and a rigid single-occupancy of the channel is assumed. For the quoted values of Imax and Ks at c = 0.15 M, we obtain ttr = 8.4 ns, and tac = 35 ns. The latter time is relatively long and suggests use of a higher concentration in studies of ion binding to GA for improved sampling.
We first consider ion binding to GA in the absence of an applied electric field. In several simulations lasting a total of 68 ns, trajectories of 28 pairs of KCl ions (0.5 M) are generated. Ions are observed to enter the GA pore and remain in the binding sites for periods up to several nanoseconds. The concentration of ions in the binding site, determined from the average number of ions in a cylinder with diameter and height 4 Å, and centered at z = 10 Å, is ∼9 M. Although this is only a crude estimate, the order-of-magnitude enhancement in concentration indicates that ions do bind to GA, and there must be a sizable potential well at the pore entrance. The concentration of ions in the central region of the channel, on the other hand, is found to be exactly zero. That is, no ion is ever seen in the region between z = −8 and +8 Å during the 68-ns simulation period.
Next we study whether the ions in one binding site can make a successful transition to the other site under a driving field. For this purpose, nine pairs of KCl (150 mM) are simulated for a total of 63 ns under a uniform electric field of 5 × 10⁷ V/m in the z-direction, which roughly corresponds to a membrane potential difference of 0.35 V. From the measured conductance value, two K+ ions may be expected to transit across the channel in this time interval. Discarding short excursions of ions lasting <0.1 ns, ions are observed to bind to the lower site in four events lasting for 0.35, 0.67, 1.85, and 7.75 ns. Despite the presence of a very large driving field, in none of these events are ions observed to cross the channel, all exiting back to the solution. While the sampling time is not long enough to be decisive, failure of ions to cross the channel in all four events suggests that they must be facing a substantial central barrier in the channel. In all the MD simulations in this section, the CHARMM PARAM27 force field has been employed; although, based on calculations described below, similar results are anticipated for GROMACS.
The above examples highlight the difficulties of obtaining quantitative results from unbiased MD simulations even when a considerably longer time scale than usual is employed. To prove beyond a reasonable doubt that ions are unable to cross the channel, one has to simulate the system for even longer (milliseconds) periods. Similarly, ions are not sampled in the central region of GA during the 68-ns run. Thus the average ion distribution obtained from this run cannot be used to determine the PMF of ions in the GA channel using Eq. 1. In such situations, it is necessary to use alternative methods to study ion permeation, where biasing is introduced such that sampling can be achieved within the entire pore. Below we use the umbrella sampling method to determine the PMF of potassium ions.
Potential of mean force
The results of the PMF calculations obtained using the CHARMM PARAM27 and GROMACS force fields are shown in Fig. 3. The CHARMM PMF shown at the top includes a dashed curve corresponding to an average of five profiles covering the upper monomer (with the structure of Koeppe et al., 1994), which are generated using the same initial positions but different velocity seedings. The dotted curve corresponds to an average of another five profiles covering the lower monomer (with the structure of Ketchem et al., 1997), generated using different initial configurations both in positions and velocities. The average of these two PMFs is drawn as a solid curve in the figure. We remark that the original orientations of tryptophan-9 side chains in each monomer are maintained throughout these simulations. This could lead to some asymmetry in the PMF because changes in the Trp dipoles are observed to cause significant modulations in the channel currents (Andersen et al., 1998), as well as in the ion-dipole potentials (Dorigo et al., 1999). Different samplings in the two PMF calculations could be another source for the observed asymmetry. Overall, both the upper and lower monomer profiles exhibit similar features that we focus on here. In the top half, a binding site is seen near 10 Å, whereas the lower monomer exhibits a binding site with two minima near 9 and 11 Å. The average profile exhibits a single binding site at ∼9.5–11 Å from the GA center of mass, whose depth is ∼6 kT. Although there are some uncertainties associated with the bulk reference point in the 1-dimensional PMF, the fact that the PMF has leveled off for all practical purposes confers some degree of confidence on the calculated well depth. This well is followed by a central barrier with a height of 22 kT with respect to the well. For comparison, the corresponding well depth and barrier height, extracted from the conductance data of potassium ions using BD simulations, are 8 kT and 5 kT, respectively (Edwards et al., 2002). A simple estimate using the Boltzmann factor indicates that the excess barrier in the CHARMM PMF would lead to a suppression of the current by a factor of 10−7.
FIGURE 3.

PMF profiles of a K+ ion along the central axis of the GA channel calculated with the CHARMM PARAM27 (top) and GROMACS (bottom) force fields. The origin refers to the center of mass of the GA dimer. In the top figure, each PMF curve is an average of five profiles, determined using different initial conditions. The dashed curve corresponds to the upper monomer of GA, and the dotted one corresponds to the lower monomer. The solid curve is the mean of these two PMFs. In the bottom figure, the solid curve shows the average of seven PMF profiles obtained from the upper monomer. The dashed line shows the average PMF obtained by excluding the two of the profiles where the GA channel is not properly solvated.
The GROMACS PMF, which is obtained from an average of seven profiles with differing initial velocity distributions, exhibits broadly similar features (solid line in Fig. 3, bottom). It has a well depth of ∼4 kT and a barrier height of ∼26 kT. The smaller well depth and larger barrier height compared to the CHARMM PMF are expected from the smaller partial charges on the peptides in the GROMACS force field. In this connection, we note that in two of the sample profiles, the GA channel have not been adequately solvated. When these two samples are excluded from the PMF analysis, a similar profile is obtained but the barrier height is reduced by ∼5 kT (dashed line in the figure). The average barrier calculated from these two samples only is found to be over 35 kT. This indicates that a proper solvation of the channel has a significant effect on the calculated PMFs. Overall the PMF results presented in Fig. 3 are consistent with the long-time simulations presented in the previous section, where ions are observed to bind to GA but do not cross the channel.
It is of interest to compare the present results with those obtained by Roux and Karplus (1993), where the lipid bilayer was represented by neutral Lennard-Jones spheres, and a periodic β-helix was used in calculation of the PMF inside the pore. The PMF they obtained for a sodium ion exhibited two binding sites at 9.3 and 11 Å, and had a well depth and barrier height of ∼12 kT and 22 kT, respectively. Another feature of this calculation was the oscillations in the PMF that were associated with the binding sites along the periodic structure (Roux and Karplus, 1993). Such oscillations are also observed in our individual PMF calculations but they are almost washed out after averaging over the ensemble of profiles. We also remark that the size of the oscillations with the larger K+ ion are expected to be smaller (Roux and Karplus, 1991). In a following PMF calculation, which included the DMPC bilayer and partial polarization of the protein but was limited to the entrance region of the channel, a broad binding site ∼11 Å was observed (Woolf and Roux, 1997). Because the sodium conductance is only half that of potassium, one expects similar PMF profiles for both ions. Thus there is also broad agreement between the present and previous PMF calculations, especially with regard to the predicted barrier height and the location of the binding site. The change in the PMF from a well at the pore entrance to a barrier at the center may be explained by the fact that the residues at either end of the GA dimer have more flexibility compared to those at the center, and by the abundance of bulklike water at the entrance. For a quantitative answer, we turn to a structural analysis of the system.
Structural analysis
Since the structural changes in the GA dimer due to the presence of an ion have been studied in numerous MD simulations in the past, we do not repeat such a comprehensive analysis here. There are, nevertheless, some features of the GA system that are worthwhile revisiting because they might shed some light to the discrepancies observed above. An ion inside the GA pore is coordinated by just two water molecules, which means a substantial loss in solvation energy. Inasmuch as the ions do permeate across the GA channel, this loss must be compensated by other interaction mechanisms. One mechanism is offered by the flexibility of the carbonyl and amide dipoles, which could reorient themselves in the presence of an ion so as to provide a more favorable environment. A second mechanism is provided by the alignment of the water dipoles along the channel axis. We present a brief analysis of these two features below. All the simulations in this section are carried out with the CHARMM PARAM27 force field.
In earlier work on GA, reorientation of the carbonyl dipoles was deemed essential for compensating the losses in solvation energy of an ion (Roux and Karplus, 1994; Dorman et al., 1996). However, recent NMR experiments see little change in the GA structure upon cation binding, indicating a more rigid structure (Tian et al., 1996; Tian and Cross, 1999). More recent MD simulations have also predicted reduced deflection of the carbonyl dipoles (10–15°) more in line with the experiments (Woolf and Roux, 1997). In Fig. 4, we show the average projection of the carbonyl dipole vectors onto the GA (z-) axis (cos θ; open circles) in the absence (A) and presence (B) of a K+ ion in the lower binding site. Here the cosines rather than the angles themselves are plotted because the errors in some residues are too large, which would have obscured the results. Close analysis reveals that carbonyls are undergoing significant rotations under the influence of the ion in the binding site. However, we note that a carbonyl dipole does not necessarily remain in the plane defined by itself and the GA axis. Hence defining an angle only with respect the GA axis is not sufficient for determining the deflection angle γ between the dipole orientations in the presence and absence of an ion in the channel. In addition to the projection angle θ, one needs to specify a second angle, which we take as φ in spherical coordinates, with the x-axis defined by the normal vector from the z-axis to the carbonyl carbon atom. Denoting the dipole orientations in the presence of the ion by (θ, φ) and in its absence by (θ′, φ′), the deflection angle γ is given by
 |
(5) |
It is clear from Eq. 5 that when φ is ignored, one obtains a smaller deflection angle from the difference of θ angles only. To give an extreme example, for θ = θ′ = 90° and φ − φ′ = 90°, the angle between the dipole vectors is γ = 90° but ignoring φ would result in γ = 0°. We note that solid-state NMR experiments are not sensitive to fluctuations in φ, and hence measure only the deflections in θ.
FIGURE 4.
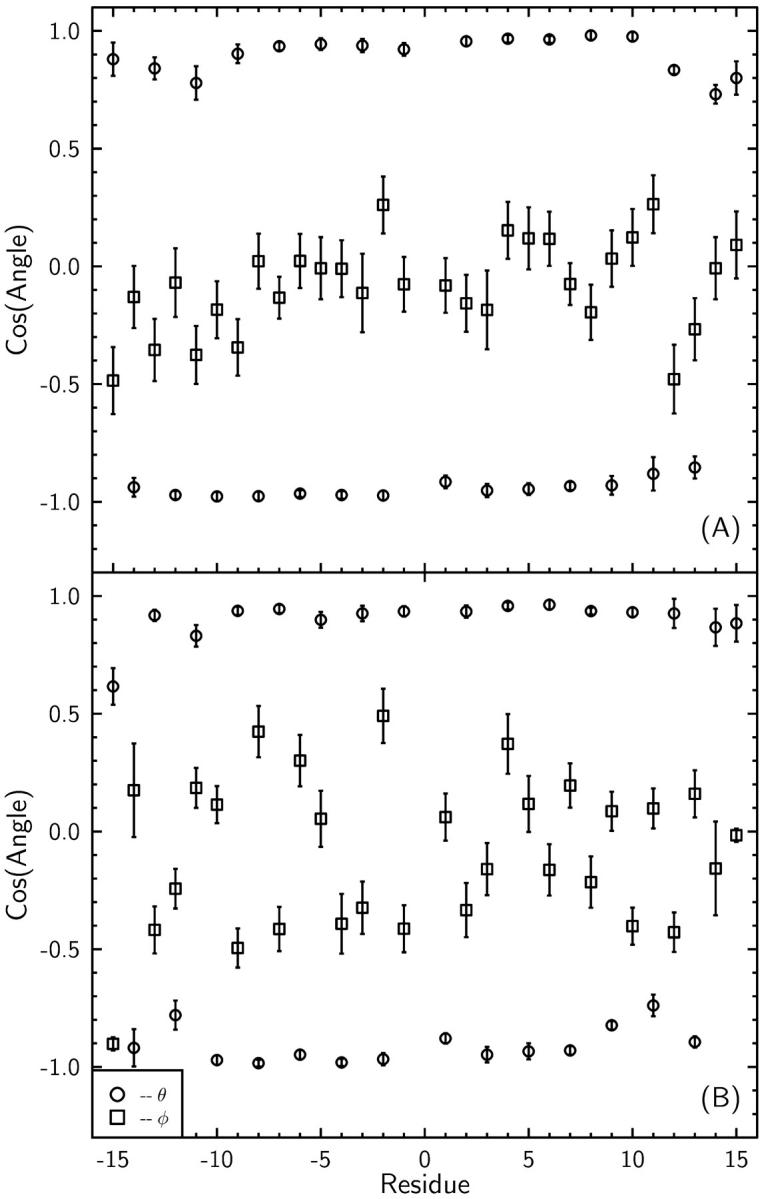
Orientation of carbonyl dipoles in the absence of any ions in the channel (A), and with a K+ ion in the lower binding site (B). The carbonyl groups in the lower part are indicated by negative numbers. The orientation of the dipole vector is described by the angles θ and φ in spherical coordinates centered at the carbonyl carbon atoms. The z-axis is taken parallel to the GA axis and the x-axis is defined by the normal vector from the z-axis to the carbon atom. Thus for cosφ = 1, the dipole is in the x–z plane pointing out and for cosφ = −1, it is pointing in. In the case of cosφ = 0, the dipole vector remains tangent to the y–z (helical) plane. The results are obtained from 50-ps production runs after 4-ns equilibration with and without the K+ ion in the binding site. Using longer production runs have led essentially to the same results. The K+ ion is not constrained during the MD simulations.
It is seen in Fig. 4 A that in the absence of an ion, the carbonyl dipoles remain more or less parallel to the z-axis, pointing in opposite directions in alternating residues as found in the NMR structure. An ion in the lower binding site (at z ≈ −10.7 Å) perturbs this picture by changing the orientations of a few carbonyl dipoles nearby and, to a lesser extent, at the opposite end of the channel. When this analysis is repeated using a longer time scale (100 ps), similar results are obtained. A possible explanation for the deflection of carbonyl bonds at the other end of the channel involves the displacement of the water column. We observe a displacement of the water molecules near the binding site by ∼1 Å when there is an ion at the other binding site. We note that because the water motion in the GA channel is very slow, longer production times are required to be certain that the deflections at the far end of the channel are caused by the shifting water positions or not. Whatever the cause, this observation indicates that the force-field allows considerable flexibility to the backbone of the GA protein.
The angle γ between the average dipole orientations in Fig. 4 A and B are plotted in Fig. 5. The largest γ occurs for Trp15′ (32°), followed by Leu12′ (25°) and Trp11′ (20°). The deflection of Trp15 has not been reported experimentally (Tian et al., 1996) or in past MD simulations (Woolf and Roux, 1997), because it is exposed to the bulk electrolyte and subject to large variations. The smaller deflection angles found in Woolf and Roux (1997) are presumably due to their use of a single angle (θ) in their analysis and a different reference for the unperturbed GA system. For example, in their Fig. 12 A, if one uses a position where the ion is outside as the reference angle, the deflection angle for Leu10 for an ion at z = 9.2 Å would increase from the quoted 15° to 20°. Regardless of how they are calculated, these deflection angles are rather large and cannot be easily reconciled with the NMR experiments quoted above.
FIGURE 5.

The average deflection angle γ of carbonyl dipoles upon binding of a K+ ion in the lower site. Here cosγ is determined from the angles in Fig. 4 using Eq. 5. Fluctuations in γ are not shown as their estimate from those in θ and φ angles using the standard differential formula leads to large values (≈30°).
Although it is difficult to explain the origin of the discrepancy regarding the predicted flexibility of carbonyl dipoles, their role in creating the binding sites in the PMF calculations in Fig. 3 is obvious. Thus a more rigid GA structure is expected to have reduced well depths in the PMFs, creating even greater problems for the standard force fields. The flexibility of these dipoles indicates that their strength plays a large role in the energy of the ion, and in particular the depth of the binding site. However, widely differing parameterizations of GA, in the context of CHARMM and GROMACS force fields, have been seen to lead to similar PMFs in this study (Fig. 3). Substantially increased polarization of the backbone in the CHARMM force field has led to only a 4-kT decrease in the magnitude of the energy barrier presented to the ion. This suggests that the ion-water and water-water interactions may be playing an even more significant role in the ion permeation energetics in this narrow channel compared to the ion-peptide and water-peptide interactions. Therefore, careful modeling of these interactions is essential to understand the discrepancies noted here and elsewhere.
The fact that the dipole moments of water molecules in the channel are strongly aligned with the GA axis is well known, though there are differences about the degree of correlations and their persistence with distance from an ion (Partenskii and Jordan, 1992; Roux and Karplus, 1994). In Fig. 6, we show the time course of water dipole projections on the GA axis with a K+ ion in the lower binding site (A) and with the ion at channel center (B). In (A), the first five water molecules above the ion maintain a near maximal correlation with the ion, that is, the alignment of the dipoles with the z-axis is not degraded as one moves away from it. This happens only in the sixth and seventh water molecules near the upper binding site, which offer no net alignment. A similar situation is observed for the two water molecules in the lower binding site (below the ion). When the ion is at the channel center (B), the water molecules both above and below the ion again maintain their near maximal correlations, except the last ones near the binding sites.
FIGURE 6.


Time course of the projections of water dipole moments on the GA dimer axis (cosθ). As indicated in the figures, there is a K+ ion at the lower binding site in (A), and the ion is constrained to the center of the GA dimer in (B). Each window shows the time dependence of the dipole moment of a particular water molecule in the pore. The windows are arranged according to the order of the ion-water column in the pore. Thus the water dipoles above the ion have projection values cosθ ≈ 1, and those below the ion have cosθ ≈ −1. With the exception of the water molecule at the bottom in B (which leaves the pore after 40 ps), all the others retain their average positions in the pore.
These observations suggest that a strengthening of the ion-water and water-water interactions could lower the energy of an ion in the center of the channel more than when it resides in the binding site. Since polarization by dipole reorientation is not possible in this maximally aligned situation, increased interactions must originate from electronic polarization, which can be modeled using a polarizable force field. For the rigid, nonpolarizable water models such as SPC and TIP3P, ion-water and water-water interaction energies are limited by the value of their water dipole moment μ ≈ 2.3 D. Ab initio MD simulations, on the other hand, indicate that the effective dipole moment of water can be as large as 3 D (Silvestrelli and Parrinello, 1999), and a recent polarizable water model with a similar average μ-value has been shown to be quite successful in explaining the properties of water (Guillot and Guissani, 2001). Thus use of a polarizable force field may help in solving the problems pointed out in this work.
Importance of polarization in ion permeation in the GA channel has long been emphasized by Jordan and collaborators (Jordan, 1990; Partenskii and Jordan, 1992; Duca and Jordan, 1998). Unfortunately, due to the schematic nature of the model systems they employed, realistic comparisons with experiments were not possible. Roux and collaborators have also attempted to include partial polarization of the protein atoms while still using a nonpolarizable water model (Roux and Karplus, 1993; Woolf and Roux, 1997). As argued by Duca and Jordan (1998), such an approach suffers from not being self-consistent. Besides, as the above discussion suggests, the polarizability of water is likely to play an equally important role in lowering the calculated energy barriers as that of the protein. Very recently Guidoni and Carloni (2002) have carried out a density functional study of the KcsA channel and found that the polarization effects play an important role in enabling the transition of a K+ ion from one binding site to another. More investigations of this type are needed to assess the role of polarization in ion permeation.
CONCLUSIONS
The present tests of the two commonly used force fields, CHARMM and GROMACS, in the GA channel has important ramifications for both future developments of force fields and their applications to ion channels. In the former case, the clear failure of the nonpolarizable force fields to describe the ion permeation in the GA channel provides the long-sought-after evidence for the necessity of including polarization in simulation of biological processes. As such it should give an impetus to the development of polarizable force fields. This problem is clearly more acute for MD simulations of ion channels and invites a more critical assessment of such applications. In the past MD studies of GA, the observed discrepancies in barrier heights have been downplayed while stressing agreement with secondary observables such as valence selectivity and multiple ion occupancy. Surely the primary observable in ion permeation is conductance, or as translated to the MD methodology, the PMF of ions in the channel. While there are orders-of-magnitude discrepancies in the conduction rates of ions, it would appear to be futile looking for agreement in other observables.
It is harder to assess the implications of these results for other ion channels. The single-file nature of the GA channel has, no doubt, contributed to the magnitude of the discrepancy. It appears that this is quite a special situation, not encountered in other biological ion channels. For example, in the narrow selectivity filter of the KcsA potassium channel (Doyle et al., 1998), two potassium ions are sandwiched between three water molecules, that is, there are no long columns of water in single-file. Thus the PMF results for other channels may not show as severe deviation from experiments as in the case of GA. Naturally, the only way to settle these issues and go beyond mere speculation is to perform reliable calculations of the PMF profiles of ions across those channels which have a known atomic structure.
Acknowledgments
All calculations were carried out with the Compaq Alphaserver of the ANU Supercomputer Facility. We thank R. Brown for his help in implementing the CHARMM PARAM27 force field in the GROMACS program, S.W. Chiu for providing the initial coordinates of the simulation system, and B. Roux and D.P. Tieleman for helpful discussions.
This work was supported by grants from the Australian Research Council and the National Health and Medical Research Council of Australia.
Note added in proof: After this paper was accepted, we found that the 1–4 interactions involving two hydrogen atoms and the Urey-Bradley terms in the CHARMM force field were not correctly translated into the GROMACS program. We have recalculated the potential of mean force using the CHARMM program and obtained similar barriers, indicating that these errors were within the statistical variation of the results.
Toby Allen's present address is Dept. of Biochemistry, Weill Medical College of Cornell University, 1300 York Ave., New York, NY 10021.
References
- Andersen, O. S., and R. E. Koeppe. 1992. Molecular determinants of channel function. Physiol. Rev. 72:89–158. [DOI] [PubMed] [Google Scholar]
- Andersen, O. S., D. V. Greathouse, L. L. Providence, M. D. Becker, and R. E. Koeppe, II. 1998. Importance of tryptophan dipoles for protein function: 5-fluorination of tryptophans in gramicidin A channels. J. Am. Chem. Soc. 120:5142–5146. [Google Scholar]
- Arseniev, A. S., A. L. Lomize, I. L. Barsukov, and V. F. Bystrov. 1986. Gramicidin A transmembrane ion channel. Three-dimensional structure reconstruction based on NMR spectroscopy and energy refinement. Biol. Membr. 3:1077–1104. [Google Scholar]
- Beglov, D., and B. Roux. 1994. Finite representation of an infinite bulk system: solvent boundary potential for computer simulations. J. Chem. Phys. 100:9050–9063. [Google Scholar]
- Berendsen, H. J. C., D. van der Spoel, and R. van Drunen. 1995. GROMACS: a message-passing parallel molecular dynamics implementation. Comput. Phys. Commun. 91:43–56. [Google Scholar]
- Berendsen, H. J. C., J. R. Grigera, and T. P. Straatsma. 1987. The missing term in effective pair potentials. J. Phys. Chem. 91:6269–6271. [Google Scholar]
- Berendsen, H. J. C., J. P. M. Postma, W. F. van Gunsteren, A. DiNola, and J. R. Haak. 1984. Molecular dynamics with coupling to an external bath. J. Chem. Phys. 81:3684–3690. [Google Scholar]
- Berendsen, H. J. C., J. P. M. Postma, W. F. van Gunsteren, and J. Hermans. 1981. Interaction models of water in relation to protein hydration. In Intermolecular Forces. B. Pullman, and D. Reidel, editors. Dordrecht, The Netherlands. pp. 331–342.
- Braganza, L. F., and D. L. Worchester. 1986. Structural changes in lipid bilayers and biological membranes caused by hydrostatic pressure. Biochemistry. 25:7484–7488. [DOI] [PubMed] [Google Scholar]
- Brooks, B. R., R. E. Bruccoleri, B. D. Olafson, D. J. States, S. Swaminathan, and M. Karplus. 1983. CHARMM: a program for macromolecular energy, minimization, and dynamics calculations. J. Comp. Chem. 4:187–217. [Google Scholar]
- Busath, D. D. 1993. The use of physical methods in determining gramicidin structure and function. Annu. Rev. Physiol. 55:473–501. [DOI] [PubMed] [Google Scholar]
- Chiu, S. W., M. Clark, V. Balaji, S. Subramaniam, H. L. Scott, and E. Jakobsson. 1995. Incorporation of surface tension into molecular dynamics simulation of an interface: a fluid lipid bilayer membrane. Biophys. J. 69:1230–1245. [DOI] [PMC free article] [PubMed] [Google Scholar]
- Chiu, S. W., S. Subramaniam, and E. Jakobsson. 1999. Simulation study of a gramicidin/lipid bilayer system in excess water and lipid. I. Structure of the molecular complex. Biophys. J. 76:1929–1938. [DOI] [PMC free article] [PubMed] [Google Scholar]
- Dorigo, A. E., D. G. Anderson, and D. D. Busath. 1999. Noncontact dipole effects on channel permeation. II. Trp conformations and dipole potentials in gramicidin A. Biophys. J. 76:1897–1908. [DOI] [PMC free article] [PubMed] [Google Scholar]
- Dorman, V., M. B. Partenskii, and P. C. Jordan. 1996. A semi-microscopic Monte Carlo study of permeation energetics in a gramicidin-like channel: the origin of cation selectivity. Biophys. J. 70:121–134. [DOI] [PMC free article] [PubMed] [Google Scholar]
- Doyle, D. A., J. M. Cabral, R. A. Pfuetzner, A. Kuo, J. M. Gulbis, S. L. Cohen, B. T. Chait, and R. MacKinnon. 1998. The structure of the potassium channel: molecular basis of K+ conduction and selectivity. Science. 280:69–77. [DOI] [PubMed] [Google Scholar]
- Duca, K. A., and P. C. Jordan. 1998. Comparison of selectively polarizable force fields for ion-water-peptide interactions: ion translocation in a gramicidin-like channel. J. Phys. Chem. 102:9127–9138. [Google Scholar]
- Edwards, S., B. Corry, S. Kuyucak, and S. H. Chung. 2002. Continuum electrostatics fails to describe ion permeation in the gramicidin channel. Biophys. J. 83:1348–1360. [DOI] [PMC free article] [PubMed] [Google Scholar]
- Guidoni, L., and P. Carloni. 2002. Potassium permeation through the KcsA channel: a density functional study. Biochim. Biophys. Acta. 1563:1–6. [DOI] [PubMed] [Google Scholar]
- Guillot, B., and Y. Guissani. 2001. How to build a better pair potential for water. J. Chem. Phys. 114:6720–6733. [Google Scholar]
- Halgren, T. A., and W. Damm. 2001. Polarizable force fields. Curr. Opin. Sruct. Biol. 11:236–242. [DOI] [PubMed] [Google Scholar]
- Hansson, T., C. Oostenbrink, and W. F. van Gunsteren. 2002. Molecular dynamics simulations. Curr. Opin. Sruct. Biol. 12:190–196. [DOI] [PubMed] [Google Scholar]
- Hermans, J., H. J. C. Berendsen, W. F. van Gunsteren, and J. P. M. Postma. 1984. A consistent empirical potential for water-protein interactions. Biopolymers. 23:1513–1518. [Google Scholar]
- Jordan, P. C. 1990. Ion-water and ion-polypeptide correlations in a gramicidin-like channel. Biophys. J. 58:1133–1156. [DOI] [PMC free article] [PubMed] [Google Scholar]
- Jorgensen, W. L., J. Chandrasekhar, J. D. Madura, R. W. Impey, and M. L. Klein. 1983. Comparison of simple potential functions for simulation of liquid water. J. Chem. Phys. 79:926–935. [Google Scholar]
- Ketchem, R. R., W. Hu, and T. A. Cross. 1993. High-resolution conformation of gramicidin A in a lipid bilayer by solid-state NMR. Science. 261:1457–1460. [DOI] [PubMed] [Google Scholar]
- Ketchem, R. R., B. Roux, and T. A. Cross. 1997. High-resolution polypeptide structure in a lamellar phase lipid environment from solid state NMR derived orientational constraints. Structure. 5:1655–1669. [DOI] [PubMed] [Google Scholar]
- Koeppe, R. E., J. A. Killian, and D. V. Greathouse. 1994. Orientations of the tryptophan 9 and 11 side chains of the gramicidin channel based on deuterium nuclear magnetic resonance spectroscopy. Biophys. J. 66:14–24. [DOI] [PMC free article] [PubMed] [Google Scholar]
- Kumar, S., D. Bouzida, R. H. Swensen, P. A. Kollman, and J. M. Rosenberg. 1992. The weighted histogram analysis method for free-energy calculations on biomolecules. I. The method. J. Comp. Chem. 13:1011–1021. [Google Scholar]
- Kuyucak, S., O. S. Andersen, and S. H. Chung. 2001. Models of permeation in ion channels. Rep. Prog. Phys. 64:1427–1472. [Google Scholar]
- Lindahl, E., and O. Edholm. 2000. Mesoscopic undulations and thickness fluctuations in lipid bilayers from molecular dynamics simulations. Biophys. J. 79:426–433. [DOI] [PMC free article] [PubMed] [Google Scholar]
- Lindahl, E., B. Hess, and D. van der Spoel. 2001. GROMACS 3.0: a package for molecular simulation and trajectory analysis. J. Mol. Mod. 7:306–317. [Google Scholar]
- MacKerell, A. D., Jr., D. Bashford, M. Bellott, R. L. Dunbrack, Jr., J. D. Evanseck, M. J. Field, S. Fisher, J. Gao, H. Guo, S. Ha, D. Joseph-McCarthy, L. Kuchnir, K. Kuczera, F. T. K. Lau, C. Mattos, S. Michnick, T. Ngo, D. T. Nguyen, B. Prodhom, W. E. Reiher III, B. Roux, M. Schlenkrich, J. C. Smith, R. Stote, J. Straub, M. Watanabe, J. Wiorkiewicz-Kuczera, D. Yin, and M. Karplus. 1998. All-atom empirical potential for molecular modeling and dynamics studies of proteins. J. Phys. Chem. B. 102:3586–3616. [DOI] [PubMed] [Google Scholar]
- Nagle, J. F., and S. Tristram-Nagle. 2000. Structure of lipid bilayers. Biochim. Biophys. Acta. 1469:159–195. [DOI] [PMC free article] [PubMed] [Google Scholar]
- Partenskii, M. B., and P. C. Jordan. 1992. Theoretical perspectives on ion-channel electrostatics: continuum and microscopic approaches. Q. Rev. Biophys. 25:477–510. [DOI] [PubMed] [Google Scholar]
- Pullman, A. 1987. Energy profiles in the gramicidin A channel. Q. Rev. Biophys. 20:173–200. [DOI] [PubMed] [Google Scholar]
- Roux, B. 2002. Computational studies of the gramicidin A channel. Acc. Chem. Res. 35:366–375. [DOI] [PubMed] [Google Scholar]
- Roux, B., and S. Bernèche. 2002. On the potential functions used in molecular dynamics simulations of ion channels. Biophys. J. 82:1681–1684. [DOI] [PMC free article] [PubMed] [Google Scholar]
- Roux, B., and M. Karplus. 1994. Molecular dynamics simulations of the gramicidin channel. Annu. Rev. Biophys. Biomol. Struct. 23:731–761. [DOI] [PubMed] [Google Scholar]
- Roux, B., and M. Karplus. 1993. Ion transport in the gramicidin channel: free energy of the solvated right-handed dimer in a model membrane. J. Am. Chem. Soc. 115:3250–3262. [Google Scholar]
- Roux, B., and M. Karplus. 1991. Ion transport in a model gramicidin channel: structure and thermodynamics. Biophys. J. 59:961–981. [DOI] [PMC free article] [PubMed] [Google Scholar]
- Schlenkrich, M. J., J. Brickman Jr., A. D. MacKerell, and M. Karplus. 1996. An empirical potential energy function for phospholipids: criteria for parameter optimization and applications. In Biological Membranes. A Molecular Perspective from Computation and Experiment. K. M. Merz and B. Roux, editors. Birkhauser, Boston, Massachusetts. pp. 31–81.
- Silvestrelli, P. L., and M. Parrinello. 1999. Structural, electronic, and bonding properties of liquid water from first principles. J. Chem. Phys. 111:3572–3580. [Google Scholar]
- Souaille, M., and B. Roux. 2001. Extension to the weighted histogram analysis method: combining umbrella sampling with free energy calculations. Comput. Phys. Commun. 135:40–57. [Google Scholar]
- Straatsma, T. P., and H. J. C. Berendsen. 1988. Free energy of ionic hydration: analysis of a thermodynamic integration technique to evaluate free energy differences by molecular dynamics simulations. J. Chem. Phys. 89:5876–5886. [Google Scholar]
- Tang, Y. Z., W. Z. Chen, and C. X. Wang. 2000. Molecular dynamics simulations of the gramicidin A-dimyristoylphosphatidylcholine system with an ion in the channel pore region. Eur. Biophys. J. 29:523–534. [DOI] [PubMed] [Google Scholar]
- Tian, F., K. C. Lee, W. Hu, and T. A. Cross. 1996. Monovalent cation transport: lack of structural deformation upon cation binding. Biochemistry. 35:11959–11966. [DOI] [PubMed] [Google Scholar]
- Tian, F., and T. A. Cross. 1999. Cation transport: an example of structural based selectivity. J. Mol. Biol. 285:1993–2003. [DOI] [PubMed] [Google Scholar]
- Tieleman, D. P., S. J. Marrink, and H. J. C. Berendsen. 1997. A computer perspective of membranes: molecular dynamics studies of lipid bilayer systems. Biochim. Biophys. Acta. 1331:235–270. [DOI] [PubMed] [Google Scholar]
- Tieleman, D. P., P. C. Biggin, G. R. Smith, and M. S. P. Sansom. 2001. Simulation approaches to ion channel structure-function relationships. Q. Rev. Biophys. 34:473–561. [DOI] [PubMed] [Google Scholar]
- Torrie, G. M., and J. P. Valleau. 1977. Nonphysical sampling distributions in Monte Carlo free-energy estimation: umbrella sampling. J. Comp. Phys. 23:187–199. [Google Scholar]
- Townsley, L. E., W. A. Tucker, S. Sham, and J. F. Hinton. 2001. Structures of gramicidin A, B and C incorporated into sodium dodecyl sulfate micelles. Biochemistry. 40:11676–11686. [DOI] [PubMed] [Google Scholar]
- Urry, D. W. 1971. The gramicidin A transmembrane channel: a proposed πLD helix. Proc. Natl. Acad. Sci. USA. 68:672–676. [DOI] [PMC free article] [PubMed] [Google Scholar]
- Wang, W., O. Donini, C. M. Reyes, and P. A. Kollman. 2001. Biomolecular simulations. Annu. Rev. Biophys. Biomol. Struct. 30:211–243. [DOI] [PubMed] [Google Scholar]
- Weiner, S. J., P. A. Kollman, D. A. Case, U. C. Singh, C. Ghio, G. Alagona, S. Profeta, and P. Weiner. 1984. A new force field for molecular mechanical simulation of nucleic acids and proteins. J. Am. Chem. Soc. 106:765–784. [Google Scholar]
- Woolf, T. B., and B. Roux. 1994. Molecular dynamics simulation of the gramicidin A channel in a phospholipid bilayer. Proc. Natl. Acad. Sci. USA. 91:11631–11635. [DOI] [PMC free article] [PubMed] [Google Scholar]
- Woolf, T. B., and B. Roux. 1996. Structure, energetics, and dynamics of lipid-protein interactions: a molecular dynamics study of the gramicidin A channel in a DMPC bilayer. Proteins. 24:92–114. [DOI] [PubMed] [Google Scholar]
- Woolf, T. B., and B. Roux. 1997. The binding of sodium in the gramicidin A channel: comparison of molecular dynamics with solid state NMR data. Biophys. J. 72:1930–1945. [DOI] [PMC free article] [PubMed] [Google Scholar]