

Abstract
We investigated the internal pH-sensitivity of heterologously expressed hSlo1 BK channels. In the virtual absence of Ca2+ and Mg2+ to isolate the voltage-dependent gating transitions, low internal pH enhanced macroscopic hSlo1 currents by shifting the voltage-dependence of activation to more negative voltages. The activation time course was faster and the deactivation time course was slower with low pH. The estimated Kd value of the stimulatory effect was approximately pH = 6.5 or 0.35 μM. The stimulatory effect was maintained when the auxiliary subunit mouse β1 was coexpressed. Treatment of the hSlo1 channel with the histidine modifying agent diethyl pyrocarbonate also enhanced the hSlo1 currents and greatly diminished the internal pH sensitivity, suggesting that diethyl pyrocarbonate and low pH may work on the same effector mechanism. High concentrations of Ca2+ or Mg2+ also masked the stimulatory effect of low internal pH. These results indicate that the acid-sensitivity of the Slo BK channel may involve the channel domain implicated in the divalent-dependent activation.
INTRODUCTION
The functions of many proteins are profoundly influenced by pH, and it is a fundamentally important topic in biology. Many amino acids contain ionizable side chains that can be influenced by physiological pH. The imidazole side chain of histidine, for example, often has a pKa value of ∼7 (Creighton, 1993), and it is frequently involved in the pH sensitivity of protein function. Regulation of protein functions by pH is also a clinically relevant issue. Ischemic/hypoxic events and trauma are followed by intracellular acidosis. For example, Kintner et al. (Kintner et al., 2000) measured intracellular pH (pHi) and extracellular pH (pHe) in the canine brain and found that hypoxia decreased pHi from 7 to 6.4. In contrast, pHe was much less affected by hypoxia. Oxidative stress after ischemia may also contribute to intracellular acidosis (Tsai et al., 1997). In addition, small fluctuations in pHi have been postulated to mediate activity-dependent regulation of neuronal activity (Chesler and Kaila, 1992; Takahashi and Copenhagen, 1996).
Intracellular acidosis leads to a multitude of physiological responses. Acidosis causes vasodilation in many different blood vessels, including those in the brain and heart (Ledingham et al., 1970; Faraci et al., 1994). Multiple types of pH-dependent ion channels are likely to contribute to the intracellular acidosis-mediated vasodilation. For example, opening of KATP channels may be important in low pHi-induced vasodilation (Ishizaka and Kuo, 1997). Consistent with this idea, heterologously-expressed KATP channels are directly activated by low pHi, and H175 in the C-terminus of the channel participates in the pHi sensitivity (Piao et al., 2001). Hayabuchi et al. (1998) suggested that large conductance Ca2+-dependent K+ channels (Slo1 BK channels) in coronary arteries might be activated by low pHi (Hayabuchi et al., 1998). Opening of these BK channels facilitates hyperpolarization, thus inhibiting further Ca2+ influx through voltage-gated Ca2+ channels to relax blood vessels. Direct neuron-protective roles of BK channels have been proposed in acute ischemic attacks in the brain (Gribkoff et al., 2001). Ischemia induces intracellular acidification in the brain (Kintner et al., 2000), and BK channel openers may protect neurons by restricting Ca2+ entry (Gribkoff et al., 2001). In addition, BK channels have been recently identified in mitochondria and may play important roles in Ca2+-cytotoxicity and cell death (Yermolaieva et al., 2001a; Yermolaieva et al., 2001b; Xu et al., 2002).
Expression of the pore-forming Slo1 α subunit alone is sufficient to form large conductance K+ channels modulated by Ca2+ (Adelman et al., 1992). The Slo1 α channel activation by Ca2+ becomes observable at ≥∼100 nM Ca2+ (Cui et al., 1997; Jan and Jan, 1997). Each Slo1 α subunit is composed of the “core” domain and the “tail” domain. The inferred structural organization of the “core” domain (S0–S6) is similar to that of KV-type voltage-gated K+ channels except for the presence of S0 in Slo (Wei et al., 1994; Meera et al., 1997; Schreiber and Salkoff, 1997). The RCK domain immediately after S6 in the primary amino acid sequence shows a structural motif called the Rossmann fold (Jiang et al., 2001), and the amino acid residues in and/or near this domain at least in part mediate the channel's sensitivity toward intracellular Ca2+ and Mg2+ (Bao et al., 2002; Shi et al., 2002; Xia et al., 2002). Depending on the tissue type, some Ca2+-dependent BK channels, such as those in skeletal muscles, may contain only Slo1 α subunits (Chang et al., 1997) whereas others, such as those in smooth muscle and endocrine cells, also contain β subunits (Tseng-Crank et al., 1994; Dworetzky et al., 1996; Chang et al., 1997; Jiang et al., 1999; Brenner et al., 2000a; Meera et al., 2000). The α subunit gene is alternatively spliced to give different variants to further enhance the functional diversity (Butler et al., 1993; Tseng-Crank et al., 1994; Ferrer et al., 1996; Saito et al., 1997; Xie and McCobb, 1998; Ramanathan et al., 2000). In addition to the Slo1 α subunit that shows a high Ca2+-sensitivity, another variant, Slo3, has been identified (Schreiber et al., 1998). The Slo3 channel is Ca2+ independent and inhibited by H+ (Schreiber et al., 1998).
Uncertainty about the BK channel subunit compositions in various tissues often makes direct comparison of the results obtained using different native channels difficult. For example, the finding by Hayabuchi et al. (Hayabuchi et al., 1998) that low pHi may stimulate native Ca2+-sensitive BK channels in porcine coronary arteries is in contrast with the results of other studies, which typically demonstrated that native Ca2+-sensitive BK channels are inhibited by low pHi. Laurido et al. (1991) reported that BK channels purified from rat skeletal muscle cells are inhibited by low pHi and that this inhibition involves a shift in the macroscopic G-V curve to the right along the voltage axis in a Ca2+-independent manner. Likewise, BK channels in smooth muscle cells, neurons, and endocrine cells are inhibited by low pHi (Kume et al., 1990; Peers and Green, 1991; Church et al., 1998; Liu et al., 1999).
Here we examined how heterologously-expressed hSlo1 channels with defined subunit compositions are regulated by low internal pHi. We found that low pHi increased the hSlo1 channel activity in a divalent-ion dependent manner. The stimulatory effect was mimicked by the histidine modifying reagent diethyl pyrocarbonate (DEPC). We suggest that the DEPC-sensitive residues located in the RCK domain are involved in the pHi regulation of the hSlo1 BK channel.
MATERIALS AND METHODS
Cell culture
Human embryonic kidney (HEK) tsA-201 cells were maintained at 37°C (5% CO2) in high glucose DMEM medium, supplemented with 10% fetal bovine serum, 100 units/ml penicillin, and 0.1 mg/ml streptomycin. Cells were typically plated on poly-D-lysine coated cover slips typically at 75% confluence. The cDNA of interest and a CD8 expression plasmid were transfected at a ratio of 8:1 using FuGENE 6 (Roche Molecular Biochemicals, Indianapolis, IN) according to the protocol provided by the manufacturer. Transfected cells were visually identified ∼18 h after transfection with CD8-antibody-coated beads (Dynal Biotech, Oslo, Norway). The hSlo1 (U11058, hbr1 (Tseng-Crank et al., 1994)) plasmid was provided by Dr. Maria Garcia (Merck Laboratories, Rahway, NJ). The mouse Slo β1-EGFP plasmid where EGFP was fused to the C-terminus of mouse β1 was provided by Dr. Robert Brenner (Stanford University, Stanford, CA). The HEK tsA cells were obtained from Dr. Kevin Campbell (University of Iowa, Iowa City, IA).
E18 Fischer rat hippocampal tissues were obtained from BrainBits (Springfield, IL), and the cells were plated on glass cover slips according to the supplier's instructions. The cells were used for electrophysiology within 1 week of plating.
Electrophysiological recording
The patch-clamp recording was performed using an Axopatch 200A amplifier (Axon, Union City, CA) modified to expand the command voltage range or by an Axopatch 200B. In most of the experiments, an agar bridge was used to isolate the ground electrode from the solution in the recording chamber. Unless otherwise noted, macroscopic patch-currents were low-pass filtered at 5 kHz and digitized at 25 kHz using an ITC16 computer interface (Instrutech, Port Washington, NY). The data were collected and analyzed using Patch Machine (http://www.hoshi.org) and IGOR Pro (WaveMetrics, Lake Oswego, OR) running on Apple Macintosh computers. Linear capacitative and leak currents were subtracted using the standard P/6 protocol. The macroscopic current data acquisition and analysis was carried out essentially as described previously (Tang et al., 2001). The free energy difference in the steady-state activation between pHi = 6.2 and 7.2 was calculated from the G-V curves as described (Cui and Aldrich, 2000) in the following manner:
 |
where (Qapp × V0.5)7.2 represents the G-V parameters estimated at pHi = 7.2 and (Qapp × V0.5)6.2 represents those at pHi = 6.2. The single-channel data were analyzed using Patch Machine. The capacitative and leak currents in the single channel data were subtracted using null sweeps without any openings as templates. When appropriate, the data values are presented as mean ± SE or using boxplots (Tukey, 1977). The error bars are not shown when smaller than the symbol size. All experiments were performed at room temperature (20–24°C).
Reagents and solutions
The extracellular recording solution contained (in mM): 140 KCl, 11 EGTA, 10 HEPES, pH 7.2 (NMDG). The same solution was typically used as the intracellular solution. To compare hSlo currents at different internal pHi, the intracellular solution contained (in mM): 140 KCl, 11 EDTA and either 10 HEPES (NMDG) for pHi 7.2 and 7.7 or 10 MES (NMDG) for pHi 5.7, 6.2, and 6.7. The pH values of the solutions were measured with a Corning M240 pH meter equipped with a liquid-filled glass-body combination electrode. EDTA was used for these pH experiments because its Ca2+-chelating ability was less pH-sensitive than that of EGTA. Free Ca2+ and Mg2+ concentrations were calculated using Patcher's Power Tools for Electrophysiologists (http://www.mpibpc.gwdg.de/abteilungen/140/software/). Other solutions used are indicated in the figure legends.
The divalent chelator BAPTA was not used in this study. We found that ≥1 mM BAPTA (Sigma, St. Louis, MO) reduced hSlo currents when compared with the currents recorded with EGTA (11 mM; Sigma) or EDTA (11 mM; Sigma) in the absence of added Ca2+ or Mg2+. This effect was more noticeable at pHi = 6.2 than 7.2. The inhibitory effect of BAPTA appeared unrelated to its ability to chelate divalent ions since the estimated free Ca2+ concentrations in these solutions were <1 nM, well below the apparent threshold of Ca2+-dependent activation of the Slo1 channel (Cui et al., 1997; Jan and Jan, 1997). Furthermore, the inhibition in the presence of BAPTA is observed without any noticeable shift in the normalized G-V curve. The electrophysiological results are consistent with the idea that BAPTA acts as a fast voltage-dependent blocker of the channel. The inhibition of the hSlo current by BAPTA may necessitate reinterpretations of the results that compare differential effects of EGTA, EDTA, and BAPTA. To avoid potential complications, only EGTA and EDTA were used in this study.
DEPC (Sigma) was kept in nitrogen according to the manufacturer's recommendation. DEPC solutions were prepared immediately before use because the reagent decomposes rapidly in the presence of water with a half life-time of several minutes.
RESULTS
Low pHi stimulates the hSlo1 α channel currents recorded without divalent ions
Gating of the hSlo channel is complex, and allosteric models with at least three allosteric tiers (voltage, Ca2+, and Mg2+) are necessary to adequately describe the gating properties (Shi and Cui, 2001; Zhang et al., 2001). To facilitate data analysis and interpretation, we initially recorded hSlo currents in the virtual absence of Ca2+ and Mg2+. Lower pHi increased currents through hSlo1 α channels (U11058) expressed in HEK cells in the virtual absence of Ca2+ and Mg2+. Representative currents recorded at pHi = 7.2 and 6.2 using EDTA are shown in Fig. 1 A. Although the chelating action of EDTA is pH-dependent, the high concentration of the chelator (11 mM) in the absence of any added Ca2+ or Mg2+ should have kept the free Ca2+ concentration well below the apparent Ca2+ threshold of the Slo channel activation, ∼100 nM (Cui et al., 1997; Jan and Jan, 1997), even at pHi = 5.7. Lowering pHi from 7.2 to 6.2 markedly increased the currents, especially those elicited by small to moderate depolarization (50–150 mV; Fig. 1 B). The fractional current enhancement was progressively smaller with larger depolarization. The G-V curves recorded at different pHi are summarized in Fig. 1 C. The G-V curves at pHi = 7.2 and 7.7 were virtually identical. However, further decreases in pHi from 7.2 to 6.7, 6.2, and 5.7 gradually shifted the G-V curve to more negative voltages (Fig. 1 C). Typically, one pH unit decrease from 7.2 to 6.2 shifted the value of the half-activation voltage of G-V (V0.5) by ∼35 mV to more negative voltages and reduced the apparent charge movement (Qapp) associated with G-V by ∼0.1 e− (Fig. 1 D). These changes correspond to ΔΔG = 1.6 ± 0.2 kcal/mol (n = 7) using the formulation of Cui and Aldrich (Cui and Aldrich, 2000).
FIGURE 1.
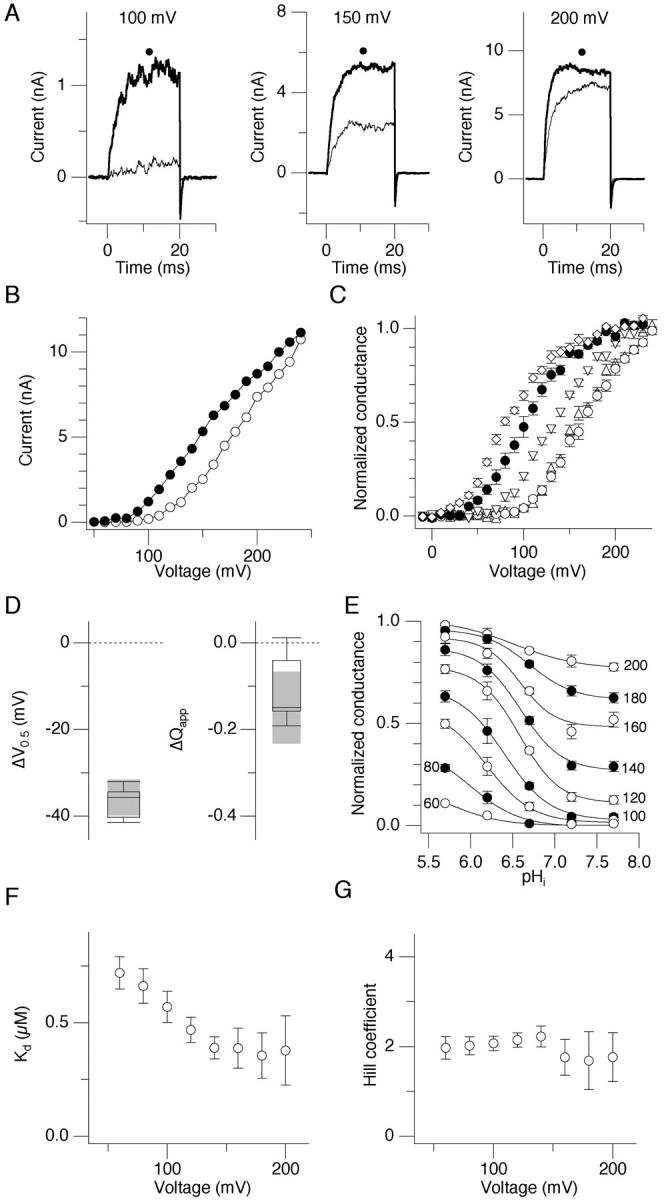
Low pHi enhances hSlo1 α channel currents in the virtual absence of Ca2+ and Mg2+. (A) Representative hSlo currents recorded at pHi = 7.2 and 6.2 at 100, 150, and 200 mV. The currents were elicited by pulses to 100 (left), 150 (center), and 200 (right) mV and then to −40 mV. In each panel, the currents recorded at pHi = 7.2 and 6.2 (denoted by a black dot) are shown. The internal solution contained 11 mM EDTA. (B) Peak I-V curves obtained from the representative patch shown in A at pHi = 7.2 and 6.2. The currents were elicited by pulses to the voltages indicated on the abscissa, and the peak outward currents were measured. (C) Mean G-V curves at different pHi from multiple patches. Triangles, pH 7.7; open circles, pH 7.2; inverse triangles, pH 6.7; filled circles, pH 6.2; squares, pH 5.7. The currents were elicited by pulses to the voltages indicated on the abscissa, and the tail currents were recorded at −40 mV to construct the G-V curves. (D) Box-plots summarizing the changes in V0.5 and Qapp caused by decreasing pHi from 7.2 to 6.2. The G-V curves were obtained as in C and summarized using box-plots (Tukey, 1977). In each experiment, the V0.5 and Qapp values at pHi = 7.2 were subtracted from those at pHi = 6.2. Negative ΔV0.5 values indicate shifts in G-V to the left along the voltage axis. Negative Qapp values indicate that G-V curves are less steep. (E) Normalized macroscopic conductance as a function of pHi. The macroscopic conductance values estimated from the tail currents were normalized to the maximal value obtained after a pulse to 230 mV at pHi = 5.7. The conductance values obtained at different voltages are shown using different symbols, and the voltages are indicated next to the curves. At a given voltage, the normalized conductance is greater at lower pHi. At a given pHi value, the conductance value is greater at more depolarized voltages. The smooth curves represent best fits of the data using the equation G0 + GpH/(1 + 10∧(pH × N − Kd)). G0 represents the pH-insensitive conductance fraction, GpH represents the pH-sensitive conductance fraction, N represents the Hill coefficient, and Kd represents the dissociation constant. n = 4–9. (F) Apparent Kd values at different test voltages for the effect of pHi on the hSlo macroscopic conductance. The Kd values were estimated for individual patches using the fitting procedures described for E. Each determination is based on 3–5 data sets depending on the voltage. (G) The values of the Hill coefficient estimated at different voltages for the effect of pHi on the hSlo macroscopic conductance. The values were estimated for individual patches using the fitting procedures described for E.
The pHi dependence of the voltage-dependent macroscopic conductance normalized to the maximum observed at low pHi with very large depolarization is shown in Fig. 1 E. At a given voltage, the normalized conductance is greater with lower pHi (leftward along the abscissa). At a given pHi value, the conductance value was greater at more depolarized voltages (indicated by different curves). The apparent dissociation constant Kd was voltage dependent and decreased to a plateau value of ∼0.35 μM or pH 6.5 with depolarization (Fig. 1 F). The estimated Hill coefficient value ranged from 1.5 to 2, depending on the test voltage (Fig. 1 G).
Lower pHi slowed the deactivation and accelerated the activation time course (Fig. 2). These changes in the deactivation and activation kinetics persisted even at the extreme voltages examined (−150, 250 mV). The steepness of the voltage dependence of the deactivation and activation time constants did not appear markedly different with different pHi, suggesting that the overall effect of low pHi on the hSlo1 channel kinetics is to shift the voltage dependence to more negative voltages.
FIGURE 2.

(A) Scaled representative tail currents recorded at −150 and −100 mV. In each panel, the current recorded at pHi = 7.2 and pHi = 6.2 (denoted by a black dot) are shown. The currents were elicited by 20-ms prepulses to 160 mV and scaled to facilitate comparison of the time course. (B) Representative currents recorded at 230 and 250 mV. In each panel, the currents recorded at pHi = 7.2 and pHi = 6.2 (denoted by a black dot) are shown. (C) Voltage dependence of the activation and deactivation time constant at different pHi values. The current activation time course and the deactivation time course were fitted with a single exponential, and the results are presented using the semilogarithmic scale. The deactivation time constants were measured from the tail currents elicited as in A. Triangles, pH 7.7; open circles, pH 7.2; inverse triangles, pH 6.7; filled circles, pH 6.2; squares, pH 5.7.
The shape of the macroscopic instantaneous tail I-V curve was not altered by decreasing pHi from 7.2 to 6.2 (data not shown). Furthermore, we did not observe any obvious effect on the single-channel current amplitudes in the voltage range of 20 to 80 mV (data not shown). Thus, the permeation properties of the channel remained largely unaltered by lowering pHi.
In contrast with the marked effects of low pHi on the hSlo channel gating, lowering pHe from 7.2 to 6.2 in the outside-out configuration did not produce any noticeable effect (Fig. 3).
FIGURE 3.

Lowering pHe does not alter hSlo1 currents. (A) Representative hSlo1 currents recorded in the outside-out configuration at pHe = 7.2 and 6.2. The currents were elicited by pulses from 0 to 100 (left) and 150 (right) mV and then to −40 mV. In each panel, the current recorded at pHe = 7.2 and 6.2 are shown. (B) G-V data from two representative experiments recorded at pHe = 7.2 and 6.2.
DEPC increases hSlo1 currents in the virtual absence of Ca2+
The estimated Kd value for the effect of low pHi to alter the macroscopic conductance (Fig. 1; pH 6.5) is comparable to the often-reported pKa value of the histidine side chain. Thus, we hypothesized that protonation of the histidine side chain may be involved in the pHi-induced changes in the hSlo channel gating and tested the hypothesis using the histidine modifying reagent DEPC. DEPC is frequently used to specifically modify histidine residues in proteins (Miles, 1977; Eyzaguirre, 1987) in the concentration range of 0.5 to 14 mM (Dzhandzhugazyan and Plesner, 2000; Pojasek et al., 2000; Kipp et al., 2001). DEPC modifies the side chain of histidine to form a carbethoxy derivative, typically by the addition of a CH3-OCH2-CO group to one of the N atoms in the imidazole group (Miles, 1977; Eyzaguirre, 1987). Application of freshly prepared DEPC (10 mM) to the cytoplasmic side increased the hSlo1 currents recorded in the virtual absence of Ca2+ and Mg2+ (Fig. 4 A). The current increase caused by DEPC for ≥3 min was not reversed by washing the recording chamber, suggesting that DEPC caused a stable modification of the channel (Fig. 4 B). DEPC is an unstable compound and decomposes rapidly in water with a half life-time of minutes. Consistent with this instability, the “aged” DEPC solution, left at room temperature for >4 h, failed to alter the hSlo1 currents (Fig. 4, C and D).
FIGURE 4.

Enhancement of hSlo1 currents by DEPC. (A) Representative hSlo1 currents at 130 mV before and after DEPC treatment. Freshly prepared DEPC was applied to the intracellular side of the inside-out patch for 5 min and the chamber was subsequently washed free of DEPC. The control and the current recorded after the DEPC treatment and wash (denoted by a black dot) are shown. The currents were elicited by pulses from 0 to 130 mV and then to 40 mV. (B) The peak hSlo1 current amplitude as a function of time in a representative experiment. The currents were elicited by pulses from 0 mV to 130 mV every 20 s. The black bar indicates the DEPC treatment duration (10 mM). (C) “Aged” DEPC solution does not alter hSlo1 currents. Representative hSlo1 currents recorded at 130 mV before and after treatment with 10 mM DEPC that was prepared 4 h before the experiment. The DEPC solution was applied to the patch for 5 min and washed out. The tail currents were recorded at 40 mV. (D) Box-plots showing relative changes in the hSlo1 current amplitude at 130 mV caused by fresh (n = 11) and aged (n = 5) 10 mM DEPC solutions. DEPC was applied for 5 min and washed out. The currents were elicited by pulses from 0 to 130 mV.
DEPC modifies voltage-dependent activation of the hSlo1 α channel
Treatment of the hSlo1 α channel with DEPC (10 mM, 5 min) applied to the cytoplasmic side shifted the peak I-V curve to more negative voltages such that fractionally larger currents were observed with small and moderate depolarization (e.g., 50–150 mV; Fig. 5, A and B). Comparison of the voltage dependence of the normalized macroscopic G-V curves before and after DEPC treatment revealed that the treatment shifted the V0.5 value to more negative voltages by ∼35 mV (Fig. 5, C and D). The apparent charge movement associated was reduced by ∼0.2e− (Fig. 5 D). These DEPC-induced changes in the G-V curve are generally similar to those observed with lowering pHi from 7.2 to 6.2 (see Fig. 1). The estimated ΔΔG induced by DEPC treatment calculated from the changes in the Qapp and V0.5 values (Cui and Aldrich, 2000) was 1.4 ± 0.1 kcal/mol (n = 5).
FIGURE 5.

DEPC treatment shifts the hSlo1 channel activation to more negative voltages. (A) Representative hSlo1 currents recorded in the inside-out configuration at 100 and 150 mV before and after DEPC treatment. The currents were elicited by pulses from −30 to 100 or 150 mV and then to −40 mV. DEPC (10 mM) was applied for 5 min and washed out (denoted by black dots). (B) Representative hSlo1 peak I-V curves before (open circles) and after (filled circles) DEPC treatment. The currents were elicited and DEPC treatment was performed as described in A. (C) Normalized macroscopic conductance before (open circles) and after (filled circles) DEPC modification. The tail hSlo1 currents were recorded at −40 mV after prepulses to different voltages and fitted with a single exponential. The extrapolated current values at time t = 0 were normalized to the maximal value recorded after a prepulse to 250 mV in each condition in each patch. n = 6. (D) Comparisons of the estimated V0.5 and Qapp values before and after DEPC treatment. In each patch, macroscopic G-V curves were estimated as in C and fitted with Boltzmann curves. The V0.5 (left) and Qapp values (right) before and after DEPC treatment are compared using boxplots. n = 6.
DEPC altered the voltage-dependent kinetics of the hSlo1 α channel. At a given voltage, the deactivation time course after DEPC treatment was slower (Fig. 6, A and C). In a separate set of experiments, we also confirmed that the slowing effect of DEPC remained even at −150 mV (see Fig. 8). The apparent reversal potential remained unaltered by DEPC. In addition, DEPC treatment accelerated the activation kinetics (Fig. 6, B and C). These results together suggest that the effects of low pHi and DEPC on the hSlo1 channel gating are comparable, suggesting that H+ and DEPC may involve the same effector. DEPC treatment did not alter the single-channel current amplitudes in the voltage range of 20–80 mV (data not shown).
FIGURE 6.

DEPC accelerates the hSlo1 activation time course and slows the deactivation time course. (A) Scaled representative hSlo1 tail currents before and after DEPC treatment at −50 and −20 mV. The currents were elicited by prepulses to 160 mV for 20 ms and scaled for comparison. In each panel, the control current and the current after DEPC treatment are shown (denoted by a black dot). DEPC (10 mM) was applied for 5 min and washed out. (B) Representative hSlo1 activation time courses at 230 and 250 mV. The currents were elicited by pulses to 230 and 250 mV. (C) Voltage dependence of the activation and deactivation time constant before (open circles) and after (filled circles) DEPC treatment. The currents elicited at the voltages indicated on the abscissa were fitted with a single exponential, and time constant values were plotted as a function of the test voltage. n = 4–8.
FIGURE 8.

DEPC treatment diminishes the stimulatory effect of low pHi. (A) Representative currents at pHi = 7.2 and 6.2 recorded in the inside-out configuration at 90 and 130 mV before (left) and after (right) DEPC treatment. The tail currents were recorded at −40 mV. In each panel, the currents recorded at pHi = 7.2 and 6.2 (denoted by a black dot) are shown superimposed. The patch was treated with DEPC (10 mM) for 5 min and DEPC was washed out. (B) G-V curves at pHi = 6.2 and 7.2 before (left) and after (right) DEPC treatment. In each panel, the G-V curve at pHi = 7.2 (open circles) and 6.2 (filled circles) are shown superimposed. The currents were elicited as in A to generate the G-V curves. (C) Comparison of the G-V curve parameters V0.5 and Qapp at pHi = 7.2 and 6.2 before and after DEPC treatment. In each boxplot, the parameter values at pHi = 7.2 and 6.2 are compared. In each experiment, the G-V curves at pHi = 7.2 and 6.2 were first obtained. The patch was then treated with DEPC (10 mM) for 5 min and DEPC was washed out. G-V curves were then determined again at pHi = 7.2 and 6.2. n = 5. (D) Voltage dependence of the activation/deactivation time constant before (left) and after (right) DEPC treatment. In each panel, the time constant values at pHi = 7.2 (open circles) and 6.2 (filled circles) are shown superimposed. The currents were elicited as in A.
DEPC is effective from either side of the membrane
DEPC is also effective when applied from the extracellular side. The effectiveness of DEPC applied to the extracellular side is illustrated in Fig. 7 A. Incubation with DEPC in the extracellular medium for >3 min followed by wash increased hSlo1 currents in a stable manner. The G-V curves before and after DEPC treatment are compared in Fig. 7 B. Extracellular DEPC treatment shifted the V0.5 value from 159 to 114 mV and decreased the Qapp value from 0.99 e− to 0.68 e−. The changes induced by extracellular application of DEPC were generally similar to those by application of DEPC to the intracellular side. This finding suggests that DEPC may readily transverse the membrane and/or that the DEPC targets are accessible from either side of the membrane.
FIGURE 7.

DEPC also alters hSlo1 channels when applied from the extracellular side. (A) Representative hSlo1 currents recorded in the outside-out configuration at 100 and 150 mV before and after DEPC treatment (denoted by a black dot). DEPC 10 mM was present in the chamber for 5 min and washed out. The currents were elicited by pulses from 0 mV to the voltages indicated and then to 40 mV. (B) Normalized macroscopic conductance before (open circles) and after (filled circles) DEPC treatment in the outside-out configuration. The currents were elicited as in A. n = 6. The V0.5 and Qapp values before DEPC were 159 mV and 0.99 e−, and after DEPC treatment they were 114 mV and 0.68 e−.
Hydroxylamine
Modification of the histidine imidazole group by DEPC can be reversed by hydroxylamine, and this reversibility is often used as a sign of the histidine specific action of DEPC (Dzhandzhugazyan and Plesner, 2000; Kipp et al., 2001). The reversal reaction with hydroxylamine, however, often requires ≥250 mM hydroxylamine (Dzhandzhugazyan and Plesner, 2000; Kipp et al., 2001), which is incompatible with our electrophysiology experiments. We found that application of 20 mM hydroxylamine for up to 5 min from either side of the membrane was ineffective in reversing the gating changes caused by DEPC (data not shown).
DEPC treatment diminishes the stimulatory effects of low pHi
If the stimulatory effect of low pHi is mediated by the DEPC-sensitive sites that normally show differential protonation in the pHi range examined, DEPC, which typically adds a CH3-OCH2-CO group to histidine, should reduce the channel's pHi sensitivity. We recorded hSlo1 α currents at pHi = 7.2 and 6.2 before and after treatment with DEPC. Representative effects of DEPC on the currents at 90 and 130 mV at pHi = 6.2 and 7.2 are shown in Fig. 8 A, and the normalized G-V curves are shown in Fig. 8 B. As presented earlier, lowering pHi from 7.2 to 6.2 shifted the V0.5 value of the control hSlo1 α channel by ∼35 mV (Fig. 8 B, left). After treatment with DEPC, the same pHi decrease had a markedly smaller effect on the G-V curve (Fig. 8 B, right). Fig. 8 C compares the changes in V0.5 and Qapp between pHi = 7.2 and 6.2 before and after DEPC treatment. In the control unmodified hSlo1 α channel, lowering pHi from 7.2 to 6.2 typically moved the V0.5 value by ∼35 mV from 175 mV to 135 mV. After DEPC treatment, the same pHi decrease changed the V0.5 value only by ∼10 mV from 130 to 120 mV. Lowering pHi was essentially ineffective in altering the Qapp value after DEPC treatment (Fig. 8 C, right).
The effects of low pHi on the channel kinetics were also diminished by DEPC. After DEPC treatment, lowering pHi to 6.2 from 7.2 produced negligible effects on the deactivation time course (<50 mV) or the activation time course (>50 mV; Fig. 8 D, right).
Ca2+ and Mg2+ interfere with the stimulatory effect of low pHi
The exclusion of Ca2+ and Mg2+ from the recording solutions allowed us to focus on the voltage-dependent gating steps of the Slo1 channel. We also examined how the presence of physiological concentrations of these divalent ions affected the pHi sensitivity of the hSlo1 α channel. With 1 mM Mg2+ and 1 μM Ca2+, the currents recorded at pHi = 7.2 and 6.2 were similar in amplitude (Fig. 9 A). In the presence of these divalent ions, lowering pHi from 7.2 to 6.2 failed to alter the G-V curve in a noticeable way (Fig. 9 B). We showed earlier that in the virtual absence of Ca2+ and Mg2+, the deactivation time course was slower with lower pHi (cf. Fig. 2) and that the activation time course was faster. In contrast, in the presence of Ca2+ and Mg2+, lowering pHi to 6.2 accelerated the activation and deactivation kinetics; the time constant values were smaller at all the voltages examined at pHi = 6.2 (Fig. 9 C).
FIGURE 9.

High Ca2+ and Mg2+ antagonize the stimulatory effect of low pHi. (A) Representative hSlo1 currents recorded in the inside-out configuration in the presence of 1 mM Mg2+ and 1 μM Ca2+ in the bath solution. The currents were elicited by pulses from −30 mV to the voltages indicated and then to −40 mV. The pHi = 7.2 internal solution contained (in mM): 140 KCl, 1 EDTA, 2 MgCl2, 0.1 CaCl2, 10 HEPES (NMDG). The pHi = 6.2 internal solution contained (in mM): 140 KCl, 1 EDTA, 2 MgCl2, 0.1 CaCl2, 10 MES (NMDG). In each panel, the currents recorded at pHi = 7.2 and pHi = 6.2 (denoted by black dots) are shown. (B) G-V curves at pHi = 7.2 (open circles) and 6.2 (filled circles) with 1 mM Mg2+ and 1 μM Ca2+. The estimated mean V0.5 and Qapp at pHi = 7.2 are 100 mV and 1.1 e−, and 94 mV and 1.1 e− at pHi = 6.2. n = 8. (C) Voltage dependence of the activation and deactivation time constants at pHi = 7.2 (open circles) and 6.2 (filled circles). (D) Representative hSlo1 currents recorded in the inside-out configuration in the presence of 10 mM Mg2+ and no added Ca2+. The currents were elicited by pulses from −40 mV to the voltages indicated and then −50 mV. The pHi = 7.2 internal solution contained (in mM): 140 KCl, 2 EDTA, 12 MgCl2, 10 HEPES (NMDG). The pHi = 6.2 internal solution contained MES in place of HEPES. Free [Mg2+] is calculated to be ∼10 mM. The data were filtered at 10 kHz and sampled at 100 kHz. (E) G-V curves at pHi = 7.2 (open circles) and 6.2 (filled circles) with 10 mM Mg2+. The estimated V0.5 and Qapp at pHi = 7.2 are 82 mV and 1.3 e−, and 85 mV and 1.2 e− at pHi = 6.2. The currents were elicited as in D. n = 7. (F) Representative hSlo1 currents recorded with 200 μM Ca2+. The currents were elicited by pulses from −100 to −20 or 20 mV and then to −110 mV. The pHi = 7.2 solution contained (in mM): 140 KCl, 0.2 CaCl2, 10 HEPES (NMDG). The pHi = 6.2 solution contained (in mM): 140 KCl, 0.2 CaCl2, 10 MES (NMDG). No divalent chelator was used. (G) G-V curves at pHi = 7.2 (open circles) and 6.2 (closed circles) with 200 μM Ca2+. The currents were elicited as in F. The V0.5 and Qapp values at pHi = 7.2 and 6.2 were 17 mV, 1.0 e− and 15 mV, 0.98 e−. n = 6.
To examine whether it was Ca2+ or Mg2+ that antagonized the stimulatory effect of low pHi, we examined how low pHi interacted with Ca2+ and Mg2+ separately. Low pHi was ineffective when the internal solution contained ∼10 mM Mg2+ without any added Ca2+. Representative hSlo1 currents recorded with 10 mM Mg2+ at pHi = 7.2 and 6.2 are shown in Fig. 9 D and the G-V curves are shown in Fig. 9 E. The results indicate that high Mg2+ alone is capable of interfering with the stimulatory effect of low pHi. Similarly, high Ca2+ without any added Mg2+ also antagonized the stimulatory effect of low pHi. Representative hSlo currents recorded with high internal Ca2+ (200 μM) are shown in Fig. 9 F, and the resulting G-V curves are summarized in Fig. 9 G.
The pHi sensitivity is retained when the auxiliary subunit mouse β1 is coexpressed
The Slo β1 subunit contributes to the Slo currents, particularly in smooth muscle cells (Knaus et al., 1995; Tseng-Crank et al., 1996; Chang et al., 1997). Low internal pHi was effective in enhancing currents through hSlo1 α/mouse β1 channels. The markedly slower activation and deactivation time courses confirmed functional expression of mouse β1 (Fig. 10 A (Cox and Aldrich, 2000)). Lowering pHi from 7.2 to 6.2 enhanced the currents by shifting the V0.5 value to more negative voltages (Fig. 10, B and C). The Qapp value was also decreased by the pHi decrease (Fig. 10 C). These changes observed using the hSlo1 α/mouse β1 channel complex are similar to those observed with the α subunit alone.
FIGURE 10.

Low pHi stimulates the Slo1 currents in the presence of the mouse β1 subunit. (A) Representative hSlo1 α/mouse β1 currents at 80 and 120 mV at pHi = 7.2 and pHi = 6.2 (denoted by black dots). The currents were elicited by pulses to the voltages indicated and then to −40 mV. (B) Mean G-V curves at pHi = 7.2 (open circles) and 6.2 (filled circles). The tail currents were recorded at −40 mV after prepulses to the voltages indicated on the abscissa to construct the G-V curves. (C) Changes in the estimated V0.5 value and Qapp value in response to lowering pHi from 7.2 to 6.2. In each experiment, the V0.5 and Qapp values were estimated at the two pHi values and the values at pHi = 7.2 were subtracted from those at pHi = 6.2.
DEPC modifies hSlo1 α/mouse β1 channel currents
As expected from the observation presented above that the pHi-sensitivity is retained in the hSlo1 α/mouse β1 channel complex, DEPC was also effective in enhancing the currents when mouse β1 was coexpressed. The effects of DEPC on hSlo1 α/mouse β1 channel complexes are summarized in Fig. 11. Treatment with DEPC was effective in increasing the currents elicited with small and moderate depolarization by shifting the G-V curve to the left.
FIGURE 11.

DEPC alters hSlo1 currents in the presence of the mouse β1 subunit. (A) Representative hSlo1 α/mouse β1 currents before and after treatment with 10 mM DEPC (denoted by black dots). DEPC was applied to the patch in the inside-out configuration for 5 min and washed out. The currents were elicited by pulses to 80 mV (left) and 120 mV (right) and then to −40 mV. In each panel, the currents before and after DEPC treatment are shown. (B) G-V curves before (open circles) and after (filled circles) DEPC treatment. n = 7. (C) Comparison of the V0.5 and Qapp values before and after DEPC treatment using boxplots. n = 7.
Low pHi stimulates native BK channels
Many studies reported that low pHi inhibited native BK channels (Kume et al., 1990; Peers and Green, 1991; Church et al., 1998; Liu et al., 1999). To better relate our results obtained using heterologously-expressed hSlo channels with defined subunit compositions to the existing results obtained using native BK channels, we also examined how low internal pHi affected native BK channels in rat hippocampal neurons. Fig. 12 illustrates representative BK channel openings elicited by pulses to 80 mV in the virtual absence of Ca2+ and Mg2+ with EDTA. These openings were identified as BK channel openings based on the large single-channel current amplitude, high Ca2+ sensitivity, and K+-selectivity (data not shown). Decreasing pHi from 7.2 to 6.2 dramatically increased the channel activity. This is clearly observed in the ensemble averages constructed from >100 sweeps. In the example patch shown, the peak open probability at pHi = 6.2 was ∼8 times greater than that at pHi = 7.2. In contrast with the drastic change in the channel gating, the single channel amplitude was not altered by the pHi decrease.
FIGURE 12.

Low pHi stimulates the activity of rat hippocampal neuron BK channels. (A) Representative rat hippocampal neuron BK channel openings elicited by pulses from 0 to 80 mV in the inside-out configuration at pHi = 7.2 (left) and 6.2 (right). In each panel, the ensemble average constructed from >100 sweeps is shown at the bottom. The openings were recorded using the standard low Ca2+/Mg2+ high K+ solutions in the pipette and in the recording chamber. This patch contained four channels as evidenced by four overlapping openings when the internal Ca2+ concentration was raised to 13 μM. The data were filtered at 10 kHz and sampled at 100 kHz. Similar results were obtained in four other patches.
DISCUSSION
Low pHi stimulates the hSlo channel activity in the virtual absence of Ca2+ and Mg2+ by shifting the G-V curve to more negative voltages. This shift in G-V is accompanied by acceleration of the activation time course and by slowing of the deactivation time course. Treatment with the histidine modifying reagent DEPC largely mimics the effects of low pHi. The effect of low pHi to shift the G-V curve is absent in the presence of a high concentration of Mg2+ or Ca2+.
DEPC targets
Low pHi enhances hSlo1 currents by shifting the voltage dependence of activation to more negative voltages. Treatment of hSlo channels with freshly prepared DEPC for >3 min typically causes similar gating changes and markedly diminishes the channel's sensitivity toward pHi, suggesting that DEPC-sensitive sites may mediate the stimulatory effects of low pHi. Although DEPC is frequently used to specifically modify the amino acid histidine, the target specificity of DEPC is not perfect. DEPC may react with other amino acids under some conditions (Miles, 1977), and some caution is warranted with its specificity (Meves, 2001). Hydroxylamine reacts with DEPC-modified histidine to re-form the imidazole group, and this reversibility is used to confirm the histidine-specific action of DEPC (Dzhandzhugazyan and Plesner, 2000; Pojasek et al., 2000; Kipp et al., 2001). However, the reaction of hydroxylamine itself may not be completely specific, and the concentration required, often ≥250 mM, is not compatible with electrophysiological measurements. We did not find any consistent reversibility at 10 mM. The failure to reverse the effects of DEPC by hydroxylamine is most likely related to the low hydroxylamine concentration used. Although we were not able to demonstrate the reversibility using hydroxylamine, we suggest that histidine is important in mediating the low pHi effect for the following reasons. First, the electrophysiological effects of low pHi and DEPC treatment are similar. Second, the low pHi-sensitivity of the hSlo1 channel is largely absent after DEPC treatment. Third, the apparent Kd of the low pHi effect on the hSlo G-V curve is within the range of pKa reported for the imidazole group (Creighton, 1993).
Possible mechanisms underlying the actions of DEPC and low pHi
The presence of a high concentration of Ca2+ or Mg2+ abolishes the stimulatory effects of low pHi on the hSlo1 channel. This finding suggests that the action of H+ may involve the divalent sensitivity mechanism of the channel. Voltage, Ca2+, and Mg2+ are considered to represent three allosteric tiers in activation of the hSlo1 channel, each acting distinctly to open the channel pore gate (Shi and Cui, 2001; Zhang et al., 2001). These allosteric variables contribute to the total free energy of the channel opening in an additive fashion (Shi and Cui, 2001; Zhang et al., 2001). Since the stimulatory H+ action is essentially absent in the presence of high concentrations of Ca2+ or Mg2+, our results do not directly support the idea that H+ represents an additional full allosteric tier of the channel gating scheme. We cannot, however, exclude the possibility that the intrinsic stimulatory effect of H+ is somehow masked by high concentrations of divalent ions. H+ may induce the same allosteric conformational changes promoted by Mg2+ and/or Ca2+ such that the channel becomes preactivated and opens more readily with depolarization.
The Slo1 channel possesses at least two distinct divalent-sensitive gating mechanisms: the high-affinity Ca2+-selective mechanism and the low-affinity nonselective mechanism (Zhang et al., 1995; Shi and Cui, 2001; Zhang et al., 2001; Shi et al., 2002; Xia et al., 2002). The low-affinity mechanism could be activated by millimolar concentrations of Mg2+ and/or Ca2+, and it involves the RCK domain located downstream of S6 in the α subunit primary amino acid sequence (Shi et al., 2002; Xia et al., 2002). The high-affinity mechanism may involve both the Ca2+ bowl located in the distal C-terminus of the channel (Schreiber and Salkoff, 1997) and the RCK domain (Bao et al., 2002; Xia et al., 2002), although the importance of the core domain cannot be excluded (Piskorowski and Aldrich, 2002). The RCK domains in some bacterial K+ channels are considered to be an essential gating machinery (Jiang et al., 2002b; Jiang et al., 2002a). The information concerning binding of Ca2+ and Mg2+ to their respective binding sites on the Slo1 channel may be transmitted to the channel pore via the RCK domain. Based on the findings that the RCK domain in the hSlo α channel is involved in both the high-affinity and low-affinity divalent ion sensitivity (Xia et al., 2002) and that the low pHi effects are largely diminished by Ca2+ or Mg2+, we suggest that the stimulatory action of H+ is in part mediated by the RCK domain.
D367 in the Slo1 RCK domain is considered to contribute to the high-affinity Ca2+-dependent activation mechanism (Xia et al., 2002). E374, Q397, and E399 are important in the low-affinity divalent sensitivity of the channel (Shi et al., 2002; Xia et al., 2002), probably by directly coordinating binding of Mg2+ to the Slo1 α channel (Shi et al., 2002). Furthermore, H350 and H379 may be located close to these binding sites, and the histidine side chains may be arranged in a stacking manner to influence the channel pore in response to Mg2+ binding (Shi et al., 2002). Therefore, we postulate that DEPC and pHi may work via H350 and/or H379; protonation and DEPC-induced modifications of these residues mimic the conformation changes promoted by Mg2+ binding and possibly Ca2+ binding to the RCK domain to facilitate the channel pore opening. Protonation of H350 and H379 may repel each other through electrostatic mechanisms and DEPC treatment may displace these two histidine residues by steric mechanisms, predisposing the channel to open by ∼1.4–1.6 kcal/mol. In contrast with the stimulatory effect on Slo1 as demonstrated here, low pHi inhibits the Ca2+-independent mSlo3 channel expressed in spermatocytes (Schreiber et al., 1998). H350 and H379 in hSlo1 are conserved in mSlo3, suggesting that the inhibitory pH-sensitivity of Slo3 may involve a different mechanism.
Undoubtedly, pHi is expected to alter multiple sites in the channel. For example, H+ could influence the side chains of E374 and E399 involved in the Mg2+ action and of D367 involved in the Ca2+ action. The pKa values of these residues are expected to be markedly lower than the H+ concentrations examined in this study, and the results reported here are not likely to include major contributions from these acidic residues. Nevertheless, the small shift in G-V observed even after treatment with DEPC may reflect such contributions from these residues.
Potential physiological implications
Free intracellular Mg2+ concentrations have been estimated to be 0.25 and 1 mM, and intracellular ATP may play an important role in regulation of free Mg2+ levels by acting as an Mg2+ sink (Grubbs, 2002). The apparent Kd of the Slo1 channel to intracellular Mg2+ is voltage dependent, decreasing exponentially to 10 mM at 120 mV (Shi and Cui, 2001; Zhang et al., 2001). This study estimates that the Kd value of the channel for H+ is ∼0.35 μM (pH 6.5) at 120 mV, ∼5 times the typical intracellular H+ concentration. Any intracellular acidosis, such as that after hypoxia (Kintner et al., 2000), will increase the likelihood that the stimulatory action of H+ on the Slo1 channel described here could play a physiological role. After hypoxia, pHi in the brain may fall from 7 to 6.4 (Kintner et al., 2000), comparable to the Kd value estimated for the H+ action on the Slo1 channel.
Previous studies showed that low pHi inhibited native BK channels in a variety of preparations (Kume et al., 1990; Peers and Green, 1991; Church et al., 1998; Liu et al., 1999). We find that neither the presence of the auxiliary subunit mouse β1 nor moderate to high levels of Ca2+ and Mg2+ consistently turns the effect of low pHi on the heterologously-expressed Slo channel into an inhibitory one. Low pHi inhibits the rat skeletal muscle BK channel by shifting the G-V curve to more positive voltages in a Ca2+-independent manner (Laurido et al., 1991). This is essentially the exact opposite of our observation. The skeletal muscle BK channels are likely to be formed without β subunits (Brenner et al., 2000b), and the results presented here using the hSlo1 α subunit alone may be comparable. In addition, Church et al. (1998) reported a potent inhibition of BK channels in rat hippocampal neurons by low pHi without internal Mg2+. Our own results using rat hippocampal neurons show that native Ca2+-sensitive BK channels are potently simulated by low pHi in the virtual absence of divalent ions. Therefore, this study establishes that both native and heterologously expressed BK channels have an intrinsic ability to be stimulated by low pHi. It remains unresolved why some native BK channels appear to be inhibited by pHi. Given the complexity of the BK channel gating with multiple allosteric tiers and a large modulatory repertoire, H+ may act as an inhibitory stimulus only under restricted conditions. A systematic study involving voltage, Ca2+, Mg2+, H+, splice variants, subunit compositions, and other modulatory conditions will be required to resolve this issue.
Acknowledgments
We thank Dr. R. Xu for technical assistance and the late T. Dowd for engineering.
The work was in part supported by the National Institutes of Health (GM 57654) and the American Heart Association.
References
- Adelman, J. P., K. Z. Shen, M. P. Kavanaugh, R. A. Warren, Y. N. Wu, A. Lagrutta, C. T. Bond, and R. A. North. 1992. Calcium-activated potassium channels expressed from cloned complementary DNAs. Neuron. 9:209–216. [DOI] [PubMed] [Google Scholar]
- Bao, L., A. M. Rapin, E. C. Holmstrand, and D. H. Cox. 2002. Elimination of the BKCa channel's high-affinity Ca2+ sensitivity. J. Gen. Physiol. 120:173–189. [DOI] [PMC free article] [PubMed] [Google Scholar]
- Brenner, R., T. J. Jegla, A. Wickenden, Y. Liu, and R. W. Aldrich. 2000a. Cloning and functional characterization of novel large conductance calcium-activated potassium channel beta subunits, hKCNMB3 and hKCNMB4. J. Biol. Chem. 275:6453–6461. [DOI] [PubMed] [Google Scholar]
- Brenner, R., G. J. Perez, A. D. Bonev, D. M. Eckman, J. C. Kosek, S. W. Wiler, A. J. Patterson, M. T. Nelson, and R. W. Aldrich. 2000b. Vasoregulation by the beta1 subunit of the calcium-activated potassium channel. Nature. 407:870–876. [DOI] [PubMed] [Google Scholar]
- Butler, A., S. Tsunoda, D. P. McCobb, A. Wei, and L. Salkoff. 1993. mSlo, a complex mouse gene encoding “maxi” calcium-activated potassium channels. Science. 261:221–224. [DOI] [PubMed] [Google Scholar]
- Chang, C. P., S. I. Dworetzky, J. Wang, and M. E. Goldstein. 1997. Differential expression of the alpha and beta subunits of the large-conductance calcium-activated potassium channel: implication for channel diversity. Brain Res. Mol. Brain Res. 45:33–40. [DOI] [PubMed] [Google Scholar]
- Chesler, M., and K. Kaila. 1992. Modulation of pH by neuronal activity. Trends Neurosci. 15:396–402. [DOI] [PubMed] [Google Scholar]
- Church, J., K. A. Baxter, and J. G. McLarnon. 1998. pH modulation of Ca2+ responses and a Ca2+-dependent K+ channel in cultured rat hippocampal neurones. J. Physiol. (Lond.). 511:119–132. [DOI] [PMC free article] [PubMed] [Google Scholar]
- Cox, D. H., and R. W. Aldrich. 2000. Role of the beta1 subunit in large-conductance Ca2+-activated K+ channel gating energetics. Mechanisms of enhanced Ca2+ sensitivity. J. Gen. Physiol. 116:411–432. [DOI] [PMC free article] [PubMed] [Google Scholar]
- Creighton, T. E. 1993. Proteins: Structures and Molecular Properties. W. H. Freeman, New York.
- Cui, J., and R. W. Aldrich. 2000. Allosteric linkage between voltage and Ca2+-dependent activation of BK-type mslo1 K+ channels. Biochemistry. 39:15612–15619. [DOI] [PubMed] [Google Scholar]
- Cui, J., D. H. Cox, and R. W. Aldrich. 1997. Intrinsic voltage dependence and Ca2+ regulation of mslo large conductance Ca-activated K+ channels. J. Gen. Physiol. 109:647–673. [DOI] [PMC free article] [PubMed] [Google Scholar]
- Dworetzky, S. I., C. G. Boissard, J. T. Lum-Ragan, M. C. McKay, D. J. Post-Munson, J. T. Trojnacki, C. P. Chang, and V. K. Gribkoff. 1996. Phenotypic alteration of a human BK (hSlo) channel by hSlo beta subunit coexpression: changes in blocker sensitivity, activation/relaxation and inactivation kinetics, and protein kinase A modulation. J. Neurosci. 16:4543–4550. [DOI] [PMC free article] [PubMed] [Google Scholar]
- Dzhandzhugazyan, K. N., and L. Plesner. 2000. Diethyl pyrocarbonate inactivates CD39/ecto-ATPDase by modifying His-59. Biochim. Biophys. Acta. 1466:267–277. [DOI] [PubMed] [Google Scholar]
- Eyzaguirre, J. 1987. Chemical modification of enzymes—an overview. In The Use of Group-Specific Reagents. J. Eyzaguirre, editor. John Wiley, New York. 9–22.
- Faraci, F. M., K. R. Breese, and D. D. Heistad. 1994. Cerebral vasodilation during hypercapnia. Role of glibenclamide-sensitive potassium channels and nitric oxide. Stroke. 25:1679–1683. [DOI] [PubMed] [Google Scholar]
- Ferrer, J., J. Wasson, L. Salkoff, and M. A. Permutt. 1996. Cloning of human pancreatic islet large conductance Ca2+-activated K+ channel (hSlo) cDNAs: evidence for high levels of expression in pancreatic islets and identification of a flanking genetic marker. Diabetologia. 39:891–898. [DOI] [PubMed] [Google Scholar]
- Gribkoff, V. K., J. E. Starrett, Jr., S. I. Dworetzky, P. Hewawasam, C. G. Boissard, D. A. Cook, S. W. Frantz, K. Heman, J. R. Hibbard, K. Huston, G. Johnson, B. S. Krishnan, G. G. Kinney, L. A. Lombardo, N. A. Meanwell, P. B. Molinoff, R. A. Myers, S. L. Moon, A. Ortiz, L. Pajor, R. L. Pieschl, D. J. Post-Munson, L. J. Signor, N. Srinivas, M. T. Taber, G. Thalody, J. T. Trojnacki, H. Wiener, K. Yeleswaram, and S. W. Yeola. 2001. Targeting acute ischemic stroke with a calcium-sensitive opener of maxi-K potassium channels. Nat. Med. 7:471–477. [DOI] [PubMed] [Google Scholar]
- Grubbs, R. D. 2002. Intracellular magnesium and magnesium buffering. Biometals. 15:251–259. [DOI] [PubMed] [Google Scholar]
- Hayabuchi, Y., Y. Nakaya, S. Matsuoka, and Y. Kuroda. 1998. Effect of acidosis on Ca2+-activated K+ channels in cultured porcine coronary artery smooth muscle cells. Pflugers Arch. 436:509–514. [DOI] [PubMed] [Google Scholar]
- Ishizaka, H., and L. Kuo. 1997. Endothelial ATP-sensitive potassium channels mediate coronary microvascular dilation to hyperosmolarity. Am. J. Physiol. 273:H104–H112. [DOI] [PubMed] [Google Scholar]
- Jan, L. Y., and Y. N. Jan. 1997. Ways and means for left shifts in the MaxiK channel. Proc. Natl. Acad. Sci. USA. 94:13383–13385. [DOI] [PMC free article] [PubMed] [Google Scholar]
- Jiang, Y., A. Lee, J. Chen, M. Cadene, B. T. Chait, and R. MacKinnon. 2002a. Crystal structure and mechanism of a calcium-gated potassium channel. Nature. 417:515–522. [DOI] [PubMed] [Google Scholar]
- Jiang, Y., A. Lee, J. Chen, M. Cadene, B. T. Chait, and R. MacKinnon. 2002b. The open pore conformation of potassium channels. Nature. 417:523–526. [DOI] [PubMed] [Google Scholar]
- Jiang, Y., A. Pico, M. Cadene, B. T. Chait, and R. MacKinnon. 2001. Structure of the RCK domain from the E. coli K+ channel and demonstration of its presence in the human BK channel. Neuron. 29:593–601. [DOI] [PubMed] [Google Scholar]
- Jiang, Z., M. Wallner, P. Meera, and L. Toro. 1999. Human and rodent MaxiK channel beta-subunit genes: cloning and characterization. Genomics. 55:57–67. [DOI] [PubMed] [Google Scholar]
- Kintner, D. B., M. K. Anderson, J. H. Fitzpatrick, Jr., K. A. Sailor, and D. D. Gilboe. 2000. 31P-MRS-based determination of brain intracellular and interstitial pH: its application to in vivo H+ compartmentation and cellular regulation during hypoxic/ischemic conditions. Neurochem. Res. 25:1385–1396. [DOI] [PubMed] [Google Scholar]
- Kipp, B. H., P. M. Kelley, and D. Njus. 2001. Evidence for an essential histidine residue in the ascorbate-binding site of cytochrome b561. Biochemistry. 40:3931–3937. [DOI] [PubMed] [Google Scholar]
- Knaus, H. G., A. Eberhart, R. O. Koch, P. Munujos, W. A. Schmalhofer, J. W. Warmke, G. J. Kaczorowski, and M. L. Garcia. 1995. Characterization of tissue-expressed alpha subunits of the high conductance Ca2+-activated K+ channel. J. Biol. Chem. 270:22434–22439. [DOI] [PubMed] [Google Scholar]
- Kume, H., K. Takagi, T. Satake, H. Tokuno, and T. Tomita. 1990. Effects of intracellular pH on calcium-activated potassium channels in rabbit tracheal smooth muscle. J. Physiol. (Lond.). 424:445–457. [DOI] [PMC free article] [PubMed] [Google Scholar]
- Laurido, C., S. Candia, D. Wolff, and R. Latorre. 1991. Proton modulation of a Ca2+-activated K+ channel from rat skeletal muscle incorporated into planar bilayers. J. Gen. Physiol. 98:1025–1042. [DOI] [PMC free article] [PubMed] [Google Scholar]
- Ledingham, I. M., T. I. McBride, J. R. Parratt, and J. P. Vance. 1970. The effect of hypercapnia on myocardial blood flow and metabolism. J. Physiol. (Lond.). 210:87–105. [DOI] [PMC free article] [PubMed] [Google Scholar]
- Liu, H., E. Moczydlowski, and G. G. Haddad. 1999. O2 deprivation inhibits Ca2+-activated K+ channels via cytosolic factors in mice neocortical neurons. J. Clin. Invest. 104:577–588. [DOI] [PMC free article] [PubMed] [Google Scholar]
- Meera, P., M. Wallner, M. Song, and L. Toro. 1997. Large conductance voltage- and calcium-dependent K+ channel, a distinct member of voltage-dependent ion channels with seven N-terminal transmembrane segments (S0–S6), an extracellular N terminus, and an intracellular (S9–S10) C terminus. Proc. Natl. Acad. Sci. USA. 94:14066–14071. [DOI] [PMC free article] [PubMed] [Google Scholar]
- Meera, P., M. Wallner, and L. Toro. 2000. A neuronal beta subunit (KCNMB4) makes the large conductance, voltage- and Ca2+-activated K+ channel resistant to charybdotoxin and iberiotoxin. Proc. Natl. Acad. Sci. USA. 97:5562–5567. [DOI] [PMC free article] [PubMed] [Google Scholar]
- Meves, H. 2001. Slowing of ERG current deactivation in NG108–15 cells by the histidine-specific reagent diethylpyrocarbonate. Neuropharmacology. 41:220–228. [DOI] [PubMed] [Google Scholar]
- Miles, E. W. 1977. Modification of histidyl residues in proteins by diethylpyrocarbonate. Methods Enzymol. 47:431–442. [DOI] [PubMed] [Google Scholar]
- Peers, C., and F. K. Green. 1991. Inhibition of Ca2+-activated K+ currents by intracellular acidosis in isolated type I cells of the neonatal rat carotid body. J. Physiol. (Lond.). 437:589–602. [DOI] [PMC free article] [PubMed] [Google Scholar]
- Piao, H., N. Cui, H. Xu, J. Mao, A. Rojas, R. Wang, L. Abdulkadir, L. Li, J. Wu, and C. Jiang. 2001. Requirement of multiple protein domains and residues for gating KATP channels by intracellular pH. J. Biol. Chem. 276:36673–36680. [DOI] [PubMed] [Google Scholar]
- Piskorowski, R., and R. W. Aldrich. 2002. Calcium activation of BKCa potassium channels lacking the calcium bowl and RCK domains. Nature. 420:499–502. [DOI] [PubMed] [Google Scholar]
- Pojasek, K., Z. Shriver, Y. Hu, and R. Sasisekharan. 2000. Histidine 295 and histidine 510 are crucial for the enzymatic degradation of heparan sulfate by heparinase III. Biochemistry. 39:4012–4019. [DOI] [PubMed] [Google Scholar]
- Ramanathan, K., T. H. Michael, and P. A. Fuchs. 2000. Beta subunits modulate alternatively spliced, large conductance, calcium-activated potassium channels of avian hair cells. J. Neurosci. 20:1675–1684. [DOI] [PMC free article] [PubMed] [Google Scholar]
- Saito, M., C. Nelson, L. Salkoff, and C. J. Lingle. 1997. A cysteine-rich domain defined by a novel exon in a slo variant in rat adrenal chromaffin cells and PC12 cells. J. Biol. Chem. 272:11710–11717. [DOI] [PubMed] [Google Scholar]
- Schreiber, M., and L. Salkoff. 1997. A novel calcium-sensing domain in the BK channel. Biophys. J. 73:1355–1363. [DOI] [PMC free article] [PubMed] [Google Scholar]
- Schreiber, M., A. Wei, A. Yuan, J. Gaut, M. Saito, and L. Salkoff. 1998. Slo3, a novel pH-sensitive K+ channel from mammalian spermatocytes. J. Biol. Chem. 273:3509–3516. [DOI] [PubMed] [Google Scholar]
- Shi, J., and J. Cui. 2001. Intracellular Mg2+ enhances the function of BK-type Ca2+-activated K+ channels. J. Gen. Physiol. 118:589–606. [DOI] [PMC free article] [PubMed] [Google Scholar]
- Shi, J., G. Krishnamoorthy, Y. Yang, L. Hu, N. Chaturvedi, D. Harilal, J. Qin, and J. Cui. 2002. Mechanism of magnesium activation of calcium-activated potassium channels. Nature. 418:876–880. [DOI] [PubMed] [Google Scholar]
- Takahashi, K. I., and D. R. Copenhagen. 1996. Modulation of neuronal function by intracellular pH. Neurosci. Res. 24:109–116. [DOI] [PubMed] [Google Scholar]
- Tang, X. D., H. Daggett, M. Hanner, M. L. Garcia, O. B. McManus, N. Brot, H. Weissbach, S. H. Heinemann, and T. Hoshi. 2001. Oxidative regulation of large conductance calcium-activated potassium channels. J. Gen. Physiol. 117:253–274. [DOI] [PMC free article] [PubMed] [Google Scholar]
- Tsai, K. L., S. M. Wang, C. C. Chen, T. H. Fong, and M. L. Wu. 1997. Mechanism of oxidative stress-induced intracellular acidosis in rat cerebellar astrocytes and C6 glioma cells. J. Physiol. (Lond.). 502:161–174. [DOI] [PMC free article] [PubMed] [Google Scholar]
- Tseng-Crank, J., C. D. Foster, J. D. Krause, R. Mertz, N. Godinot, T. J. DiChiara, and P. H. Reinhart. 1994. Cloning, expression, and distribution of functionally distinct Ca2+-activated K+ channel isoforms from human brain. Neuron. 13:1315–1330. [DOI] [PubMed] [Google Scholar]
- Tseng-Crank, J., N. Godinot, T. E. Johansen, P. K. Ahring, D. Strobaek, R. Mertz, C. D. Foster, S. P. Olesen, and P. H. Reinhart. 1996. Cloning, expression, and distribution of a Ca2+-activated K+ channel beta-subunit from human brain. Proc. Natl. Acad. Sci. USA. 93:9200–9205. [DOI] [PMC free article] [PubMed] [Google Scholar]
- Tukey, J. W. 1977. Exploratory Data Analysis. Addison-Wesley, Reading, MA.
- Wei, A., C. Solaro, C. Lingle, and L. Salkoff. 1994. Calcium sensitivity of BK-type KCa channels determined by a separate domain. Neuron. 13:671–681. [DOI] [PubMed] [Google Scholar]
- Xia, X. M., X. Zeng, and C. J. Lingle. 2002. Multiple regulatory sites in large-conductance calcium-activated potassium channels. Nature. 418:880–884. [DOI] [PubMed] [Google Scholar]
- Xie, J., and D. P. McCobb. 1998. Control of alternative splicing of potassium channels by stress hormones. Science. 280:443–446. [DOI] [PubMed] [Google Scholar]
- Xu, W., Y. Liu, S. Wang, T. McDonald, J. E. Van Eyk, A. Sidor, and B. O'Rourke. 2002. Cytoprotective role of Ca2+-activated K+ channels in the cardiac inner mitochondrial membrane. Science. 298:1029–1033. [DOI] [PubMed] [Google Scholar]
- Yermolaieva, O., X. D. Tang, H. Daggett, and T. Hoshi. 2001a. Calcium-activated mitochondrial K channel is involved in regulation of mitochondrial membrane potential and permeability transition. Biophys. J. 80:237a. [Google Scholar]
- Yermolaieva, O., X. D. Tang, H. T. Daggett, C. A. Schinstock, and T. Hoshi. 2001b. Calcium-activated mitochondrial K channel is involved in regulation of calcium-induced cytochrome c release and cell death. Abstr. Soc. Neurosci. 27:272.3. [Google Scholar]
- Zhang, X., E. Puil, and D. A. Mathers. 1995. Effects of intracellular Mg2+ on the properties of large-conductance, Ca2+-dependent K+ channels in rat cerebrovascular smooth muscle cells. J. Cereb. Blood Flow Metab. 15:1066–1074. [DOI] [PubMed] [Google Scholar]
- Zhang, X., C. R. Solaro, and C. J. Lingle. 2001. Allosteric regulation of BK channel gating by Ca2+ and Mg2+ through a nonselective, low affinity divalent cation site. J. Gen. Physiol. 118:607–635. [DOI] [PMC free article] [PubMed] [Google Scholar]