

Abstract
Modulation of the type 1 inositol (1,4,5)-trisphosphate receptors (InsP3R1) by cytosolic calcium (Ca2+) plays an essential role in their signaling function, but structural determinants and mechanisms responsible for the InsP3R1 regulation by Ca2+ are poorly understood. Using DT40 cell expression system and Ca2+ imaging assay, in our previous study we identified a critical role of E2100 residue in the InsP3R1 modulation by Ca2+. By using intrinsic tryptophan fluorescence measurements in the present study we determined that the putative InsP3R1 Ca2+-sensor region (E1932–R2270) binds Ca2+ with 0.16 μM affinity. We further established that E2100D and E2100Q mutations decrease Ca2+-binding affinity of the putative InsP3R1 Ca2+-sensor region to 1 μM. In planar lipid bilayer experiments with recombinant InsP3R1 expressed in Spodoptera frugiperda cells we discovered that E2100D and E2100Q mutations shifted the peak of the InsP3R1 bell-shaped Ca2+ dependence from 0.2 μM to 1.5 μM Ca2+. In agreement with the biochemical data, we found that the apparent affinities of Ca2+ activating and inhibitory sites of the InsP3R1 were 0.2 μM for the wild-type channels and 1–2 μM Ca2+ for the E2100D and E2100Q mutants. The results obtained in our study support the hypothesis that E2100 residue forms a part of the InsP3R1 Ca2+ sensor.
INTRODUCTION
The inositol (1,4,5)-trisphosphate receptor (InsP3R) is an intracellular calcium (Ca2+) release channel that plays a critical role in Ca2+ signaling (Berridge, 1993). Three mammalian isoforms of InsP3R—type I (InsP3R1), type II (InsP3R2), and type III (InsP3R3)—have been identified (Furuichi et al., 1994), with only limited information available to date about differences in their functional properties (Miyakawa et al., 1999; Thrower et al., 2001). The InsP3R are subjected to multiple levels of regulation (Berridge, 1993; Bezprozvanny and Ehrlich, 1995; Taylor, 1998). Binding of InsP3 triggers the InsP3R channel opening. The activity of InsP3R1 is under feedback control by cytosolic Ca2+; at low Ca2+ concentrations, Ca2+ acts as co-activator of the InsP3R1, and at higher Ca2+ concentrations the InsP3R1 is inhibited by Ca2+ (Bezprozvanny et al., 1991; Finch et al., 1991; Iino, 1990; Kaznacheyeva et al., 1998). This property of InsP3R1, called bell-shaped Ca2+ dependence, is essential for generation of Ca2+ waves and Ca2+ oscillations (Berridge, 1993; De Young and Keizer, 1992; Lechleiter and Clapham, 1992; Parker et al., 1996). Despite crucial importance for the InsP3R1 signaling function, very little is known about structural determinants and mechanisms responsible for the InsP3R1 regulation by cytosolic Ca2+.
The ryanodine receptor (RyanR) is another Ca2+-gated intracellular Ca2+ release channel with distant sequence homology to the InsP3R (Furuichi et al., 1994). All three mammalian isoforms of the RyanR share a conserved glutamate residue in the putative Ca2+-sensor region—E3885 in RyanR3, E4032 in RyanR1, and E3987 in RyanR2. This critical glutamate is conserved in the RyanR family from Caenorhabditis elegans to mammalian isoforms (Fig. 1). Point mutations of the conserved glutamate to alanine induced 1000- to 3000-fold reduction in the RyanR2 sensitivity to Ca2+ activation (Li and Chen, 2001), and >10,000-fold reduction in the RyanR3 sensitivity to Ca2+ activation (Chen et al., 1998). Analogous mutation of RyanR1 abolished channel activity (Du and MacLennan, 1998). The InsP3R gene family is homologous to the RyanR family in the putative Ca2+-sensor region and also contains a conserved glutamate residue (Miyakawa et al., 2001; see also Fig. 1, this article). In the rat InsP3R1 the conserved glutamate is located at position 2100 (E2100) (Fig. 1). Using DT40 cell expression system and Ca2+ imaging assay, in the previous work we demonstrated that E2100D mutation resulted in ∼10-fold decrease in the InsP3R1 sensitivity to Ca2+ activation (Miyakawa et al., 2001).
FIGURE 1.

Alignment of the putative cytosolic Ca2+ sensor for the InsP3R and RyanR gene families. The sequence of rat InsP3R1 (P29994, amino acids 2061–2133) is aligned with the corresponding region of rat InsP3R2 (P29995), rat InsP3R3 (Q63269), Xenopus InsP3R (Q91908), Drosophila InsP3R (P29993), and C. elegans InsP3R (Q9Y0A1). The sequence of rabbit RyanR1 (P11716, amino acids 3991–4067) is aligned with the corresponding region of rabbit RyanR2 (P30957), rabbit RyanR3 (Q9TS33), bullfrog RyanR (Q91319), Drosophila RyanR (Q24498), and C. elegans RyanR (P91905). The sequence alignment was performed by ClustalW and the residues conserved between InsP3R and RyanR gene families were shaded by BOXSHADE. The secondary structure prediction for the InsP3R Ca2+-sensor region performed by PSIPRED is shown above the alignment. PSIPRED predicts nearly identical secondary structure for the RyanR Ca2+-sensor region (not shown). The conserved glutamate residue (E2100 in InsP3R1) mutated in the previous (Miyakawa et al., 2001) and in the present work is indicated.
In the present study we performed further biochemical and functional characterization of the putative InsP3R1 Ca2+ sensor. Using intrinsic tryptophan fluorescence spectroscopy we determined Ca2+-binding affinity of the wild-type and E2100 mutant putative InsP3R1 Ca2+-sensor region. Obtained biochemical results were correlated with the functional analysis of the wild-type InsP3R1 and E2100 mutants in planar lipid bilayers. The results obtained in our study support the hypothesis that E2100 residue forms a part of the InsP3R1 Ca2+ sensor.
MATERIALS AND METHODS
Expression and purification of the putative InsP3R1 Ca2+-sensor region
The putative Ca2+-sensor region (E1932–R2270) of rat InsP3R1 (Mignery et al., 1990) was amplified by PCR and cloned into XbaI/XhoI sites of pGEX-KG (Amersham-Pharmacia Biotech, Piscataway, NJ) bacterial expression vector to generate GST-RT1-Cas (Calcium-sensor) construct. The GST-E2100D-Cas and GST-E2100Q-Cas constructs were generated using the same procedure on the basis of InsP3R1-E2100D and InsP3R1-E2100Q mutants (Miyakawa et al., 2001). Generated constructs were verified by sequencing and transformed into protease-deficient BL21 bacterial expression host strain. Recombinant GST-RT1-Cas, GST-E2100D-Cas, and GST-E2100Q-Cas fusion proteins were expressed in 2 liters of BL21 cells by 0.8 mM isopropyl β-d-thiogalactoside induction at 15°C. The cells were harvested 20 h postinduction and resuspended in 50 ml of the lysis buffer (50 mM Imidasole pH 7.0, 100 mM NaCl, 10 mM EDTA, 1 mM DTT, 0.5 mg/ml lysozyme, 1% Triton X-100) with addition of the protease inhibitors. The cells were disrupted by sonication (Branson Sonifier 450, VWR USA, West Chester, PA), clarified by centrifugation at 15,000 rpm (Beckman JA-10) and incubated with 2 ml of glutathione-sepharose 4B beads (Amersham-Pharmacia Biotech). The glutathione-sepharose 4B beads were pelleted at 2000 rpm, washed with 5 volumes of the low salt buffer (20 mM Imidasole pH 7.0, 100 mM NaCl, 1 mM EDTA, 1 mM DTT) and the high salt buffer (20 mM Imidasole pH 7.0, 1M NaCl, 1mM EDTA, 1 mM DTT, 0.1% sodium azide). The GST-RT1-Cas, GST-E2100D-Cas, and GST-E2100Q-Cas fusion proteins attached to glutathione-sepharose 4B beads were resuspended in 2 ml of PBS (pH 7.35), mixed with 100 μL of thrombin solution (100 Thrombin cleavage units), incubated at room temperature for 4 h with constant mixing and centrifuged at 2000 rpm. Obtained supernatants were collected, transferred to fresh tubes, and diluted by PBS to the total volume of 6 ml. Resulting samples of RT1-Cas, E2100D-Cas, and E2100Q-Cas recombinant proteins were analyzed by SDS-PAGE electrophoresis and Coomassie staining.
Intrinsic tryptophan fluorescence spectroscopy
Intrinsic tryptophan fluorescence spectroscopy of RT1-Cas, E2100D-Cas, and E2100Q-Cas recombinant proteins was performed immediately after thrombin cleavage using a DeltaRAM Illuminator (Photon Technology International, Lawrenceville, NJ). During these measurements, a quartz cuvette containing 2 ml of recombinant proteins at 80 μg/ml in PBS was supplemented with 1 mM EGTA and 1 mM HEDTA (pH 7.35). The free Ca2+ concentration in the cuvette was adjusted in the range of pCa 9.4–2 by consecutive additions of calibrated CaCl2 stock solutions with constant stirring. The free Ca2+ concentration in the cuvette was calculated using MaxChelator (http://www.stanford.edu/∼cpatton/maxc.html). Intrinsic tryptophan fluorescence was excited by 280-nm (2-nm slit width) light, and emission spectra were collected at room temperature in the 290- to 500-nm range with 2-nm step size. The experiments were controlled and analyzed by the Felix software package (Photon Technology International).
The absolute peak tryptophan fluorescence values at each Ca2+ concentration were determined from the generated emission spectra (F(Ca2+)). The measured fluorescence values were corrected for dilution Fcor (Ca2+) = F0/(1 + v/V), where Fcor (Ca2+) is dilution-corrected fluorescence value, F0 is a peak fluorescence value with no CaCl2 added (pCa 9.4), v is a total volume of CaCl2 added, and V is a starting solution volume in the cuvette (2 ml). The difference between measured and dilution-corrected peak tryptophan fluorescence values ΔF(Ca2+) = F(Ca2+) − Fcor(Ca2+) was taken as a measure of Ca2+-induced conformational changes in RT1-Cas, E2100D-Cas, and E2100Q-Cas recombinant proteins (Ward, 1985). The ΔF values at each Ca2+ concentration were normalized to the maximal ΔF value (ΔFmax) measured at pCa 2.0 in the same experiment. The normalized ΔF values from three independent experiments for each recombinant protein were averaged together. The Ca2+ dependence of the normalized and averaged ΔF values were fit by the least-squares method (Microcal Origin 4.1) using the Hill equation ΔF/ΔFmax (Ca2+) = [Ca2+]n/([Ca2+]n + kCan), where [Ca2+] is a Ca2+ concentration in the cuvette, n is a Hill coefficient, and kCa is an apparent affinity for Ca2+. Resulting kCa and n-values for RT1-Cas, E2100D-Cas, and E2100Q-Cas recombinant proteins are presented in the text. The confidence range of kCa and n-values was determined from the quality of the fit.
Generation of recombinant baculoviruses
Generation of recombinant baculovirus expressing wild-type rat InsP3R1 (RT1) was previously described (Nosyreva et al., 2002; Tu et al., 2002). The E2100D and E2100Q mutations of InsP3R1 in pIRES2-EGFP vector were previously described (Miyakawa et al., 2001). The 2.5 kb BamH1/BamH1 fragment (3797, 6329) of InsP3R1 sequence containing E2100D and E2100Q mutations was isolated and subcloned into BamH1 digested and CIAP-dephosphorylated pFastBac1-InsP3R1 plasmid with EcoR1, BamH1, Xho1, Kpn1, and Sph1 sites removed from the polylinker sequence. The orientation of BamH1/BamH1 fragment was verified by PCR and the presence of E2100D and E2100Q mutations in resulting pFastBac1-E2100D and pFastBac1-E2100Q plasmids was verified by sequencing. The recombinant E2100D and E2100Q baculoviruses encoding InsP3R1-E2100D and InsP3R1-E2100Q mutants were generated and amplified using Bac-to-Bac system (Invitrogen, Carlsbad, CA) as described previously for the RT1 virus (Nosyreva et al., 2002; Tu et al., 2002) to yield baculoviral stock of 108–109 pfu/ml titer.
Expression of InsP3R1 mutants in Sf9 cells
The InsP3R1 mutants were expressed in Spodoptera frugiperda (Sf9) cells as previously described (Nosyreva et al., 2002; Tu et al., 2002). Briefly, Sf9 cells were obtained from ATCC and cultured in suspension culture in supplemented Grace's Insect Media with 10% FBS at 27°C. For the InsP3R1 expression, 150 ml of Sf9 cell cultures were infected by RT1, E2100D, and E2100Q baculovirus at MOI of 5–10. 66 h postinfection, Sf9 cells were collected by centrifugation at 4°C for 5 min at 800 rpm (GH 3.8 rotor, Beckman Instruments, Fullerton, CA). The cellular pellet was resuspended in 25 ml of homogenization buffer (Sucrose 0.25 M, HEPES 5 mM, pH 7.4) supplemented with protease inhibitors cocktail (1mM EDTA, aprotinin 2 μg/ml, leupeptin 10 μg/ml, benzamidine 1 mM, AEBSF 2.2 mM, pepstatin 10 μg/ml, and PMSF 0.1 mg/ml). Cells were disrupted by sonication (Branson Ultrasonics, Danbury, CT) and manually homogenized on ice with glass-Teflon homogenizer. The microsomes were isolated from Sf9 cell homogenate by gradient centrifugation as previously described for HEK293 cells (Kaznacheyeva et al., 1998). The final microsomal preparation was resuspended in 0.5 ml of the storage buffer (10% sucrose, 10 mM MOPS pH 7.0) to yield typically 6 mg/ml of protein (Bradford assay, Bio-Rad, Hercules, CA), aliquoted, quickly frozen in liquid nitrogen and stored at −80°C. Expression of InsP3R1 wild-type E2100D and E2100Q mutants was confirmed by Western blotting. The anti-InsP3R1 rabbit polyclonal antibody (T443) was previously described (Kaznacheyeva et al., 1998).
Single channel recordings and analysis of the mutant InsP3R1 activity
Recombinant RT1, E2100D, and E2100Q channels expressed in Sf9 cells were incorporated into the bilayer by microsomal vesicle fusion as previously described (Nosyreva et al., 2002; Tu et al., 2002). Single channel currents were recorded at 0 mV transmembrane potential using 50 mM Ba2+ dissolved in HEPES (pH 7.35) in the trans (intraluminal) side as a charge carrier (Bezprozvanny and Ehrlich, 1994). The cis (cytosolic) chamber contained 110 mM Tris dissolved in HEPES (pH 7.35). To obtain Ca2+ dependence of the InsP3R we follow the protocol from Bezprozvanny et al. (1991). Free Ca2+ concentration in the cis chamber was controlled in the range 10 nM (pCa 8) to 10 μM (pCa 5) by mixture of 1 mM EGTA, 1 mM HEDTA, and variable concentrations of CaCl2. The resulting free Ca2+ concentration was calculated by using a program described in Fabiato (1988). All recordings of InsP3R1 activity were performed in the presence of 0.5 mM Na2ATP (Bezprozvanny and Ehrlich, 1993) and 2 μM InsP3. All additions (InsP3, ATP, and CaCl2) were to the cis chamber from the concentrated stocks with at least 30-s stirring of solutions in both chambers. The InsP3R1 single-channel currents were amplified (Warner Instruments OC-725, Hamden, CT), filtered at 1 kHz by low pass 8-pole Bessel filter, digitized at 5 kHz (Digidata 1200, Axon Instruments) and stored on computer hard drive and recordable optical discs.
For off-line computer analysis (pClamp 7, Axon Instruments, Foster City, CA), single-channel data were filtered digitally at 500 Hz; for presentation of the current traces, data were filtered at 200 Hz. Evidence for the presence of two to three functional channels in the bilayer was obtained in the majority of experiments. The number of active channels in the bilayer was estimated as a maximal number of simultaneously open channels during the course of an experiment (Horn, 1991). The open probability of closed level, and first and second open levels, was determined by using half-threshold crossing criteria (t ≥ 2 ms) from the records lasting at least 2.5 min. The single-channel open probability (Po) for one channel was calculated using the binomial distribution for the levels 0, 1, and 2, and assuming that the channels were identical and independent (Colquhoun and Hawkes, 1983).
To generate complete Ca2+-dependence curves, the experiments with persistent InsP3R1 activity for duration of the experiment (>30 min) were chosen for analysis to prevent artifacts related to irreversible channel inactivation occasionally observed in the bilayers. To construct Ca2+-dependence curves for the wild-type and mutant InsP3R1, the determined values of Po were averaged across several independent experiments at each Ca2+ concentration. The averaged values of Po are presented as mean ± SE (n = number of independent experiments) and fit by the least-squares methods (Sigma Plot 5, Jandel Scientific, San Rafael, CA) using the bell-shaped equation Po ([Ca2+]) = 4Pm kn[Ca2+]n/((kn + [Ca2+]n)(Kn + [Ca2+]n), modified from Bezprozvanny et al. (1991), where Pm is a parameter proportional to the maximal Po value, n is a Hill coefficient, k is the apparent affinity of the Ca2+ activating site, and K is the apparent affinity of the Ca2+ inhibitory site. The parameters of the optimal fit (Pm, n, k, and K) for each InsP3R1 form are presented in the text. The confidence range of k- and K-values was determined from the quality of the fit. The fitting procedure used in this article differs from the procedure used in our previous articles (Bezprozvanny et al., 1991; Kaznacheyeva et al., 1998; Nosyreva et al., 2002; Tu et al., 2002), in that Po values in the present article were not normalized to the maximal Po before averaging and fitting. Because Po values were not normalized, Pm is equal to maximal Po only in the case when k = K. If k ≠ K, parameter Pm is proportional (and higher) than maximal Po.
RESULTS
Ca2+ binding to the putative InsP3R1 Ca2+-sensor region
Our previous Ca2+ imaging experiments suggested an importance of E2100 residue in InsP3R1 modulation by Ca2+ (Miyakawa et al., 2001). Based on these results we reasoned that the part of the InsP3R1 sequence surrounding E2100 residue forms the InsP3R1 Ca2+ sensor. To test this hypothesis, we expressed and purified the putative InsP3R1 Ca2+-sensor region RT1-Cas (E1932–R2270, Fig. 2 A) as described in Methods. The amino-terminal boundary of RT1-Cas construct (E1932) was chosen based on the limited trypsin digest pattern of the InsP3R1 (Yoshikawa et al., 1999). The carboxyl-terminal boundary (R2270) was chosen by the proximity of the first InsP3R1 transmembrane domain M1 (S2276–Y2294, Fig. 2 A). To investigate the effects of E2100 mutations, we also expressed and purified E2100D-Cas and E2100Q-Cas proteins (see Methods). Similar yield of RT1-Cas, E2100D-Cas, and E2100Q-Cas proteins was achieved in our experiments (Fig. 2 B, gel). The mobility of these proteins on SDS-gel was consistent with the predicted molecular weight of 39 kDa (Fig. 2 B, gel), indicating that the full-length RT1-Cas, E2100D-Cas, and E2100Q-Cas proteins were obtained in our expression/purification scheme.
FIGURE 2.

Expression and purification of the putative InsP3R1 Ca2+-sensor region. (A) Domain structure of the InsP3R1 (adapted from Mignery and Sudhof, 1990). The boundaries of the amino-terminal InsP3-binding domain InsP3R-N (1–604), the carboxyl-terminal channel-forming domain InsP3R-C (2276-2749) with transmembrane domains M1–M6, the middle coupling domain InsP3R-M (605–2275) are indicated. The putative InsP3R1 Ca2+-sensor region Cas (1932–2270) is shaded. The mutations of E2100 residue (Miyakawa et al., 2001), W1577 residue (CaM-binding site; see Nosyreva et al., 2002), and the alternative splicing in SII site (Tu et al., 2002) were previously analyzed. (B) Expression and purification of the putative InsP3R1 Ca2+-sensor region. Samples of GST-Cas attached to glutathione beads (GST-Cas), Cas proteins released by thrombin cleavage (Thrombin), and glutathione beads after thrombin cleavage (beads) were analyzed by SDS-PAGE gel electrophoresis (10% polyacrylamide gel stained with Coomassie Blue). The predicted molecular weight of GST-Cas (68 kDa), Cas (39 kDa), and GST (29 kDa) are indicated by the arrows. 1/60 (GST-Cas and beads lanes) or 1/200 (thrombin lanes) of total protein was loaded on the gel for RT1, E2100D, and E2100Q.
The putative InsP3R1 Ca2+-sensor region contains two tryptophan residues (W2255 and W2267) and 11 tyrosine residues. The fluorescence emission spectra (excitation at 280 nm) of RT1-Cas protein displayed a well-defined peak at 332 nm (Fig. 3 A), consistent with a partially buried position of W2255 and W2267 residues in the hydrophobic core of RT1-Cas protein. We reasoned that binding of Ca2+ may induce a conformation change of RT1-Cas fragment which may affect intrinsic tryptophan fluorescence signal (Ward, 1985). A similar approach has been taken recently in studies of NEFA Ca2+ binding (Kroll et al., 1999) and apolipophorin III proton binding (Weers et al., 2001). To test this hypothesis, we collected emission spectra (excitation at 280 nm) of RT1-Cas protein at different Ca2+ concentrations (pCa 9.4–pCa 2.0, buffered by 1 mM EGTA and 1 mM HEDTA). We found that the position of the emission peak (λmax) remained constant at 332 nm (Fig. 3 A). However, a systematic and saturable change in the intensity of RT1-Cas fluorescent signal as a function of Ca2+ was observed (Fig. 3 A). To compare the data from different experiments, the observed changes in RT1-Cas peak fluorescence intensity (ΔF) were corrected for dilution, normalized to the maximal change in the peak fluorescence intensity (ΔFmax), averaged, and plotted against Ca2+ concentration (Fig. 4, open circles). Best fit to the average RT1-Cas data (Fig. 4, curve) yielded an apparent Ca2+-binding affinity kCa of 0.16 ± 0.02 μM Ca2+ and Hill coefficient n of 0.54 ± 0.02 (Table 1).
FIGURE 3.
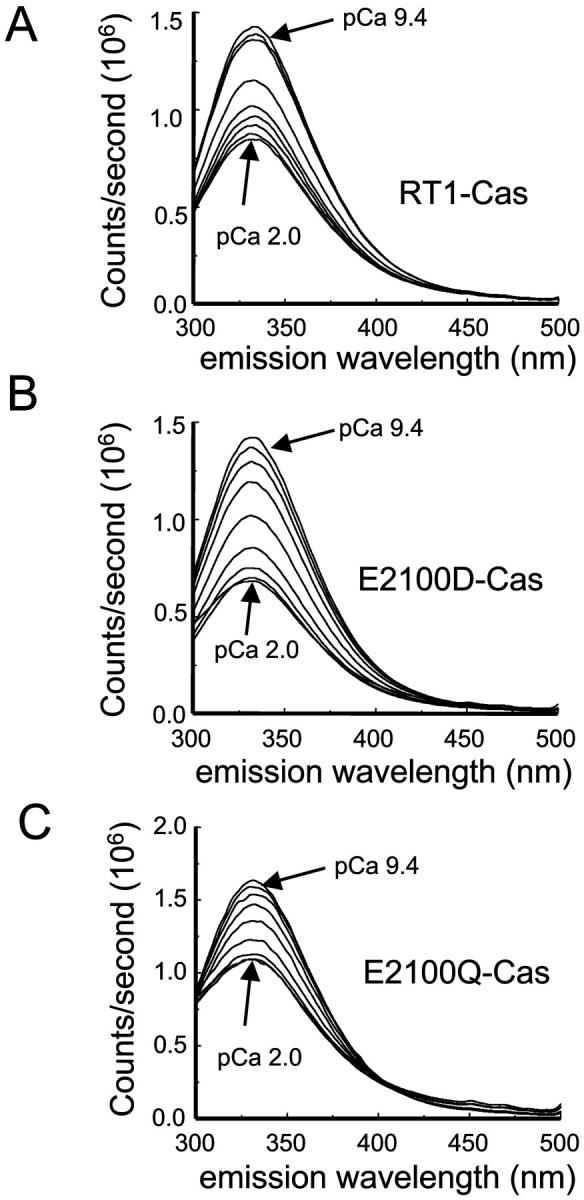
Intrinsic tryptophan fluorescence emission spectra of the putative InsP3R1 Ca2+-sensor region. Representative intrinsic tryptophan fluorescence emission spectra of RT1-Cas (A), E2100D-Cas (B), and E2100Q-Cas (C) proteins at variable Ca2+ concentrations (pCa 9.4–pCa 2.0, as indicated). Similar results were obtained in at least three independent experiments with RT1-Cas, E2100D-Cas, and E2100Q-Cas proteins.
FIGURE 4.

Ca2+ binding to the putative InsP3R1 Ca2+-sensor region. Dilution-corrected and normalized changes in the peak fluorescence intensity (ΔF/ΔFmax) were averaged together at each Ca2+ concentration and shown as mean ± SE (n = 3) for RT1-Cas (open circles), E2100D-Cas (filled circles), and E2100Q-Cas (open triangles). The data were fit by the Hill equation (see Methods). The parameters of the optimal fits (smooth curves) are presented in Table 1.
TABLE 1.
Parameters of the biochemical and functional analysis of the InsP3R1 Ca2+ sensor
| Ca2+ Binding
|
Bell-shaped Ca2+ Dependence
|
||||||
|---|---|---|---|---|---|---|---|
| InsP3R1 isoform | Affinity for Ca2+KCa (μM) | Hill coefficient n | Pm | Hill coefficient n | Affinity of the activating site k (μM) | Affinity of the inhibitory site K (μM) | Peak of Ca2+ dependence (pCa) |
| RT1 | 0.16 ± 0.02 | 0.54 ± 0.02 | 0.30 | 1.3 | 0.22 ± 0.01 | 0.20 ± 0.01 | 6.71 |
| E2100D | 1.0 ± 0.3 | 0.49 ± 0.04 | 0.27 | 1.2 | 1.11 ± 0.07 | 1.85 ± 0.10 | 5.81 |
| E2100Q | 1.1 ± 0.3 | 0.45 ± 0.05 | 0.27 | 0.9 | 1.44 ± 0.14 | 0.94 ± 0.09 | 5.94 |
What are the effects of E2100 mutations on affinity of putative InsP3R1 Ca2+ sensor for Ca2+? To answer this question, we collected tryptophan fluorescence emission spectra of E2100D-Cas and E2100Q-Cas recombinant proteins at different Ca2+ concentrations. Similar to the experiments with RT1-Cas (Fig. 3 A), we observed a systematic and saturable Ca2+-dependent change in the intensity of E2100D-Cas and E2100Q-Cas intrinsic fluorescent signals (Fig. 3, B and C). Just as with RT1-Cas, the λmax of E2100D-Cas and E2100Q-Cas emission spectra remained constant at 332 nm (Fig. 3, B and C). The observed changes in E2100D-Cas and E2100Q-Cas peak fluorescence intensity (ΔF) were corrected for dilution, normalized, and averaged as described for RT1-Cas. Best fit to the average E2100D-Cas and E2100Q-Cas data (Fig. 4, filled circles and open triangles) yielded kCa = 1.0 ± 0.3 μM Ca2+, n = 0.49 ± 0.04 for E2100D-Cas; and kCa = 1.1 ± 0.3 μM Ca2+, n = 0.45 ± 0.05 for E2100Q-Cas (Table 1).
Functional expression of InsP3R1 E2100 mutants in Sf9 cells
Mutations of E2100 residue resulted in five- to sixfold reduction in the affinity of InsP3R1 putative Ca2+ sensor for Ca2+ (Figs. 3 and 4, Table 1). What are the effects of E2100 mutations on InsP3R1 modulation by Ca2+? Previously we addressed this question in Ca2+ imaging studies with the DT40 cell expression system (Miyakawa et al., 2001). To gain an additional insight into the significance of E2100 residue for the InsP3R1 function, we took an advantage of our ability to measure single-channel activity of recombinant InsP3R1 expressed in Sf9 cells (Nosyreva et al., 2002; Tu et al., 2002). To analyze the functional effect of E2100 mutations on InsP3R1 activity at the single-channel level, we generated RT1, E2100D, and E2100Q baculoviruses as described in Methods. Microsomes isolated from Sf9 cells infected with RT1, E2100D, and E2100Q baculoviruses, but not from noninfected cells, contained large quantities of InsP3R1 detectable by Western blotting (Fig. 5). Small amounts of endogenous InsP3R1 were detected in microsomes from noninfected Sf9 cells when the blots were overexposed (data not shown). The apparent molecular size of recombinant RT1 and E2100 mutants was identical to the InsP3R1 present in rat cerebellar microsomes (Fig. 4 A). The immunopositive bands of smaller molecular weight detected in samples of rat cerebellar microsomes and microsomes from RT1-infected Sf9 cells correspond to products of partial InsP3R1 proteolysis. When expressed in Sf9 cells, E2100Q appears to be somewhat more sensitive to proteolysis than RT1 and E2100D (Fig. 5).
FIGURE 5.

Expression of RT1 and E2100 mutants in Sf9 cells. Rat cerebellum microsomes (cer) and microsomes isolated from noninfected SF9 cells (Sf9 cells), and Sf9 cells infected with RT1, E2100D, and E2100Q baculoviruses, were analyzed by Western blotting with the anti-InsP3R1 polyclonal antibody. For each microsomal preparation, 20 μg of total protein was loaded on the gel.
When microsomes isolated from Sf9 cells infected with RT1, E2100D, and E2100Q baculoviruses were fused to planar lipid bilayers, functional InsP3-gated channels were recorded (Fig. 6). The InsP3-gated channels were observed in 15 out of 20 experiments with RT1, in 16 out of 20 experiments with E2100D, and in 15 out of 22 experiments with E2100Q. The InsP3-gated channels were never (n = 5) observed in experiments with the microsomes from noninfected Sf9 cells, and we concluded that endogenous InsP3R background in Sf9 cells does not interfere with recordings of recombinant InsP3R1 activity. At pCa 6.7 and in the presence of 0.5 mM ATP and 2 μM InsP3 (standard recording conditions), the mean open time was 5.8 ± 0.4 ms (n = 4) for RT1 (Fig. 6 A), 6.8 ± 0.1 ms (n = 4) for E2100D (Fig. 6 B), and 7.8 ± 0.4 ms (n = 3) for E2100Q (Fig. 6 C). In the same conditions the unitary current amplitude at 0 mV transmembrane potential was 2.0 ± 0.1 pA (n = 4) for RT1 (Fig. 6 A), 1.8 ± 0.1 pA (n = 4) for E2100D (Fig. 6 B), and 1.8 ± 0.1 pA (n = 3) for E2100Q (Fig. 6 C). Thus, in standard recording conditions the E2100D and E2100Q mutations resulted in 10% reduction in the unitary current size and 20–30% increase in the open dwell time when compared to RT1. In our previous study we discovered that an alternative splicing of SII region and opt mutation in the InsP3R1-coupling domain affect InsP3R1 single-channel conductance (Tu et al., 2002). Thus, in contrast to the generally accepted domain structure of InsP3R1 (Mignery and Sudhof, 1990), the InsP3R1 unitary current size appears to be sensitive to changes in the primary sequence of the InsP3R1 modulatory region.
FIGURE 6.

Single-channel properties of RT1 and E2100 mutants. Representative channel activity of RT1 (A), E2100D (B), and E2100Q (C) recorded in the presence of 0.2 μM Ca2+, 0.5 mM Na2ATP, and 2 μM InsP3 (standard recording conditions). Current records are shown at compressed and expanded timescales as indicated. Unitary current amplitude histograms and open dwell time distributions from the same experiment are shown below the current records. Unitary currents were fitted with a Gaussian function that was centered at 2.0 pA for RT1, 1.7 pA for E2100D, and 1.6 pA for E2100Q. Open time distributions were fit with a single exponential function (curve) that yielded a τ0 of 5.3 ms for RT1, 6.9 ms for E2100D, and 7.3 ms for E2100Q. Similar analysis was performed for at least three independent experiments with RT1, E2100D, and E2100Q.
Modulation of InsP3R1 and E2100 mutants by cytosolic Ca2+
Bell-shaped Ca2+ dependence of InsP3R1 activity on cytosolic Ca2+ (Bezprozvanny et al., 1991; Finch et al., 1991; Iino, 1990) is one of the most fundamental InsP3R1 properties responsible for complex spatiotemporal aspects of Ca2+ signaling (Berridge, 1993). In the next series of experiments we evaluated modulation of recombinant rat InsP3R1 by cytosolic Ca2+. We found that RT1 channels display bell-shaped Ca2+ dependence with the maximal open probability at 200 nM Ca2+, half-maximal activation at 100 nM Ca2+, and half-inhibition at 1 μM Ca2+ (Fig. 7). These results are in agreement with the behavior of native cerebellar InsP3R (Bezprozvanny et al., 1991), recombinant rat InsP3R1 expressed in HEK-293 and COS cells (Kaznacheyeva et al., 1998; Ramos-Franco et al., 1998), and with our previous findings with the InsP3R1 expressed in Sf9 cells (Nosyreva et al., 2002; Tu et al., 2002). To obtain quantitative description of RT1 Ca2+ dependence, the data from four independent experiments were averaged together and fit by the bell-shaped equation modified from Bezprozvanny et al. (1991) as described in Methods. The parameters of the optimal Ca2+-dependence fit (Fig. 7 B, smooth curve) are presented in Table 1. From the fit we estimated that for RT1 channels, the apparent affinities of Ca2+-activating and Ca2+-inhibitory sites are 0.22 ± 0.01 μM and 0.20 ± 0.01 μM Ca2+, respectively (Table 1).
FIGURE 7.

RT1 Ca2+ dependence. (A) The current recordings of RT1 from the same experiment at different Ca2+ concentrations as indicated. (B) Bell-shaped Ca2+ dependence of the RT1 channels. The data from independent experiments were averaged together at each Ca2+ concentration as described in Methods, and shown as mean ± SE (n = 4; filled circles). The averaged data were fitted by the bell-shaped equation modified from Bezprozvanny et al. (1991) as explained in Methods. The parameters of optimal fit (smooth curve) are in Table 1.
Using DT40 cell expression system and Ca2+ imaging assay, in the previous article we demonstrated that E2100D mutation resulted in ∼10-fold decrease in the InsP3R1 sensitivity to Ca2+ activation, but could not analyze inhibitory portion of E2100D Ca2+ dependence (Miyakawa et al., 2001). In the same study we also established that E2100Q forms a functional InsP3-sensitive channel, but could not determine E2100Q Ca2+ dependence (Miyakawa et al., 2001). Here, we took advantage of our ability to perform single-channel recordings of E2100D and E2100Q channels (Fig. 6, B and C), and determined complete Ca2+ dependence of E2100 mutants in planar lipid bilayers. We found that both E2100D (Fig. 8) and E2100Q (Fig. 9) displayed bell-shaped Ca2+ dependence. When compared to RT1, the bell-shaped Ca2+ dependence of both E2100D and E2100Q was shifted to ∼sevenfold higher Ca2+ concentrations, with the peak at 1.5 μM Ca2+ (Figs. 8 B and 9 B). To obtain a quantitative description of E2100D and E2100Q Ca2+ dependence, the data from several experiments (n = 4 for E2100D and n = 3 for E2100Q) were averaged together and fit by the modified bell-shaped equation as described in Methods. The parameters of the optimal Ca2+ dependence fits (Figs. 8 B and 9 B, thick smooth curves) are presented in Table 1. From the fit we determined that in E2100D and E2100Q mutants the apparent affinity of both Ca2+-activating and Ca2+ inhibitory sites was decreased from 0.2 μM Ca2+ to 1–2 μM Ca2+ (Table 1).
FIGURE 8.

E2100D Ca2+ dependence. (A) The current recordings of E2100D mutant from the same experiment at different Ca2+ concentrations as indicated. (B) Bell-shaped Ca2+ dependence of E2100D mutant. The data from independent experiments were averaged together at each Ca2+ concentration as described in Methods and shown as mean ± SE (n = 4) (filled circles). The averaged data were fitted by the bell-shaped equation modified from Bezprozvanny et al. (1991) as explained in Methods. The parameters of optimal fit (smooth thick curve) are in Table 1. The thin smooth line represents RT1 Ca2+ dependence from Fig. 7 B.
FIGURE 9.

E2100Q Ca2+ dependence. (A) The current recordings of E2100Q mutant from the same experiment at different Ca2+ concentrations as indicated. (B) Bell-shaped Ca2+ dependence of E2100Q mutant. The data from independent experiments were averaged together at each Ca2+ concentration as described in Methods, and shown as mean ± SE (n = 3; filled circles). The averaged data were fitted by the bell-shaped equation modified from Bezprozvanny et al. (1991) as explained in Methods. The parameters of optimal fit (smooth thick curve) are in Table 1. The thin smooth line represents RT1 Ca2+ dependence from Fig. 7 B.
DISCUSSION
An importance of E2100 residue for InsP3R1 modulation by Ca2+ was demonstrated in Ca2+ imaging experiments described in our previous article (Miyakawa et al., 2001). From these results we proposed that the region surrounding E2100 residue serves as a putative Ca2+ sensor of the InsP3R1. In the present article we tested this hypothesis by a combination of biochemical and functional methods. Using 45Ca2+ overlay assay, a Ca2+-binding site has been previously detected in a heterologously expressed 1961–2220 region of rat InsP3R1 (Mignery et al., 1992). A number of additional Ca2+-binding sites in the InsP3R1 sequence were discovered using a similar approach (Sienaert et al., 1996, 1997), including a site in the region between 2124–2146 amino acids with 0.8 μM affinity for Ca2+. Mutation of E2139 residue located within this region had no effect on Ca2+ sensitivity of the InsP3R1 expressed in DT-40 cells (Miyakawa et al., 2001), but it is possible that this or other motifs may also contribute to Ca2+ binding in the regulatory site of the InsP3R1. Using intrinsic tryptophan fluorescence assay, here we demonstrated that the putative InsP3R1 Ca2+-sensor region (E1932–R2270, Fig. 2 A) forms Ca2+-binding site with the affinity of 0.16 μM Ca2+ (Figs. 3 and 4, Table 1). The Hill coefficient of 0.5 measured in our experiments (Fig. 4, Table 1) indicates a negative cooperativity in association of InsP3R1 putative Ca2+-sensor region with Ca2+, which may be due to multimerization of recombinant proteins during our measurements or due to the presence of multiple Ca2+-binding sites within the InsP3R1 putative Ca2+-sensor region. Further experiments will be needed to discriminate between these possibilities.
The E2100 residue is highly conserved in the InsP3R gene family from C. elegans to mammalian isoforms (Fig. 1). The homologous glutamate residue in the RyanR gene family is also highly conserved (Fig. 1) and has been shown to play a critical role in RyanR activation by Ca2+ for RyanR2 (Li and Chen, 2001) and RyanR3 (Chen et al., 1998). Thus, both families of Ca2+ release channels appear to employ similar molecular mechanism for Ca2+-dependent gating. Secondary structure prediction for the InsP3R Ca2+-sensor region (Fig. 1) and for the corresponding region of RyanR (data not shown) suggests that the conserved glutamate residue (E2100 in InsP3R1) is located at the tip of a long α-helix followed by a loop-helix-loop-helix motif. Interestingly, the part of the long α-helix immediately preceding the conserved glutamate residue is very hydrophobic and highly conserved between InsP3R and RyanR gene families (Fig. 1). Similar helix-loop-helix unit often forms a part of Ca2+-binding site in proteins (Kawasaki and Kretsinger, 1995) and it is likely that the Ca2+-sensor region of InsP3R and RyanR contains a similar fold. Three-dimensional structure determination of the corresponding InsP3R/RyanR region will help to test the latter hypothesis.
Our fluorescence measurements indicate that the association with Ca2+ induces a conformational change of the putative InsP3R1 Ca2+-sensor region that quenches intrinsic tryptophan fluorescence signal (Figs. 3 and 4). It is likely that in the context of the full-length InsP3R1 the observed conformational changes are linked to the InsP3R1 gating mechanism. We also concluded that both E2100D and E2100Q mutations reduced the affinity of the putative InsP3R1 Ca2+-sensor region for Ca2+ ∼five- to sixfold, to 1 μM Ca2+ (Figs. 3 and 4, Table 1). Thus, in agreement with our hypothesis (Miyakawa et al., 2001), the E2100 residue indeed plays a critical role in function of InsP3R1 Ca2+ sensor. One explanation of these results is that E2100 residue plays a direct role in coordinating a Ca2+ ion. In this case we have to assume that the role of E2100 residue in Ca2+ coordination is lost to an equal degree in both E2100D and E2100Q mutants, presumably due to compensation by other residues. An alternative explanation is that E2100 residue plays an important role in maintaining an overall structure of InsP3R1 Ca2+-binding site, and that both E2100D and E2100Q mutations disrupt this structure to a similar degree. Importantly, the peak of intrinsic tryptophan emission spectra for RT1, E2100D, and E2100Q fragments was positioned at the same λmax = 332 nm, indicating that the overall secondary and tertiary structure of the InsP3R1 putative Ca2+-sensor region is maintained in E2100 mutants. The intrinsic tryptophan fluorescence measurements described here can be used to search for other residues important for Ca2+ binding to InsP3R1 Ca2+ sensor. Ultimately, a solution of three-dimensional structure of InsP3R1 Ca2+-sensor region will be required to determine the exact role played by E2100 residue and to identify the residues involved in coordinating a Ca2+ ion.
The importance of E2100 residue for InsP3R1 modulation by Ca2+ was further supported in functional experiments performed with recombinant InsP3R1 channels reconstituted into planar lipid bilayers. We discovered that E2100D and E2100Q mutations shifted the sensitivity of InsP3R1 to activation by Ca2+ ∼sevenfold when compared to RT1 channels (Figs. 7–9). From these experiments we estimated that the apparent affinity of Ca2+ activating site was equal to 0.22 μM Ca2+ for RT1 (Fig. 7, Table 1), and 1.1–1.5 μM Ca2+ for E2100D and E2100Q (Figs. 8 and 9, and Table 1). Thus, the apparent affinities of InsP3R1 activating Ca2+-binding site estimated for RT1, E2100D, and E2100Q channels from current recordings are in good agreement with the InsP3R1 putative Ca2+-sensor-binding affinities determined in intrinsic tryptophan fluorescence measurements (Table 1). Our data with E2100D mutant are in agreement with the previous functional analysis in DT40 cells (Miyakawa et al., 2001). In the previous article we found that sensitivity of InsP3R1 to activation by Ca2+ is shifted by a factor of ∼10 with the peak at ∼3 μM Ca2+ (Miyakawa et al., 2001). We also found that BCR activation in DT40 cells expressing E2100D mutant leads to a single Ca2+ spike, in contrast to Ca2+ oscillations observed in wild-type InsP3R1-expressing cells (Miyakawa et al., 2001). These results suggest that sensitivity of InsP3R1 to Ca2+ is important for Ca2+ dynamics in living cells. The data obtained with E2100 mutants in the present study (Fig. 8) are in quantitative agreement with results from DT40 cells (Miyakawa et al., 2001). Only a small fraction of E2100Q expression DT40 cells responded to BCR stimulation, and responses were low in amplitude (Miyakawa et al., 2001). Thus the Ca2+ dependence of E2100Q mutant could not be analyzed in the study with DT40 cells (Miyakawa et al., 2001). Here we were able to obtain functional recordings of E2100Q channels in bilayers and discovered that Ca2+ sensitivity of E2100Q channels is similar to Ca2+ sensitivity of E2100D channels (Fig. 9). Thus, weak response in E2100Q-transfected DT40 cells are not likely to be due to an additional shift in Ca2+-sensitivity and most likely results from insufficient expression or misassembly of E2100Q mutants in DT40 cells. In agreement with this hypothesis, the E2100Q channels were recorded in bilayers less frequently than the wild-type or E2100D channels, indicating that many E2100Q proteins do not form functional channels when expressed in Sf9 cells.
Interestingly, mutations of E2100 residue affected not only the Ca2+-activating site, but also the Ca2+-inhibitory site of the InsP3R1 (Figs. 7–9, and Table 1). The inhibitory portion of E2100D Ca2+ dependence has not been previously analyzed due to limitations of the Ca2+ imaging method (Miyakawa et al., 2001). An original formal mathematical description of cerebellar InsP3R bell-shaped Ca2+ dependence assumed independent binding of Ca2+ to activating and inhibitory sites present on each InsP3R1 subunit (Bezprozvanny et al., 1991). The physical basis for this model is that a number of Ca2+ ions bound to the activating and inhibitory binding sites on each InsP3R1 subunit has a combined effect on InsP3R1 open probability. Similar assumption was made in the more recent mathematical analysis of Xenopus InsP3R biphasic Ca2+ dependence (Mak et al., 1998). Thus, the effect of E2100 mutations on the apparent affinity of InsP3R1 Ca2+ inhibitory site was unexpected. One potential explanation to this finding is offered by a sequential Ca2+-binding model (Bezprozvanny, 1994; Finch et al., 1991; Othmer and Tang, 1993; Taylor, 1998), according to which Ca2+ inhibitory site is exposed only after Ca2+ is bound in the activating site. Another possible explanation of our results is that E2100 forms a part of both activating and inhibitory Ca2+-binding sites. The molecular identity of InsP3R1 inhibitory Ca2+-binding site is controversial. Calmodulin has been strongly implicated in Ca2+-dependent inhibition of cerebellar InsP3R1 (Michikawa et al., 1999). However, recent data suggested that the high affinity Ca2+-calmodulin-binding site in the coupling region of InsP3R1 (Yamada et al., 1995) does not play a direct role in the biphasic modulation of InsP3R1 by Ca2+ (Nosyreva et al., 2002; Zhang and Joseph, 2001). Thus, the Ca2+ inhibitory site can be a part of InsP3R1 sequence, which may include E2100. Future experiments with additional InsP3R1 Ca2+-sensor mutants will be required to test these and other potential hypotheses.
Acknowledgments
We are grateful to Gregory Mignery and Thomas C. Südhof for the kind gift of the rat InsP3R1 clone, and to Phil Thomas for advice and encouragement with tryptophan fluorescence measurements. We are thankful to Phyllis Foley for the administrative assistance and to Anton Maximov and Humbert De Smedt for comments on the manuscript.
Supported by the Welch Foundation, the National Institutes of Health grant R01 NS38082 (to I.B.), and by a grant from the Ministry of Education, Culture, Sports, Science and Technology of Japan (to M.I.).
References
- Berridge, M. J. 1993. Inositol trisphosphate and calcium signalling. Nature. 361:315–325. [DOI] [PubMed] [Google Scholar]
- Bezprozvanny, I. 1994. Theoretical analysis of calcium wave propagation based on inositol (1,4,5)-trisphosphate (InsP3) receptor functional properties. Cell Calcium. 16:151–166. [DOI] [PubMed] [Google Scholar]
- Bezprozvanny, I., and B. E. Ehrlich. 1993. ATP modulates the function of inositol 1,4,5-trisphosphate-gated channels at two sites. Neuron. 10:1175–1184. [DOI] [PubMed] [Google Scholar]
- Bezprozvanny, I., and B. E. Ehrlich. 1994. Inositol (1,4,5)-trisphosphate (InsP3)-gated Ca channels from cerebellum: conduction properties for divalent cations and regulation by intraluminal calcium. J. Gen. Physiol. 104:821–856. [DOI] [PMC free article] [PubMed] [Google Scholar]
- Bezprozvanny, I., and B. E. Ehrlich. 1995. The inositol 1,4,5-trisphosphate (InsP3) receptor. J. Membr. Biol. 145:205–216. [DOI] [PubMed] [Google Scholar]
- Bezprozvanny, I., J. Watras, and B. E. Ehrlich. 1991. Bell-shaped calcium-response curves of Ins1,4,5P3- and calcium-gated channels from endoplasmic reticulum of cerebellum. Nature. 351:751–754. [DOI] [PubMed] [Google Scholar]
- Chen, S. R., K. Ebisawa, X. Li, and L. Zhang. 1998. Molecular identification of the ryanodine receptor Ca2+ sensor. J. Biol. Chem. 273:14675–14678. [DOI] [PubMed] [Google Scholar]
- Colquhoun, D., and A. G. Hawkes. 1983. The principles of stochastic interpretation of ion-channel mechanisms. In Single-Channel Recording. B. Sakmann and E. Neher, editors. Plenum Press, New York. 135–174.
- De Young, G. W., and J. Keizer. 1992. A single pool IP3-receptor-based model for agonist stimulated Ca2+ oscillations. Proc. Natl. Acad. Sci. USA. 89:9895–9899. [DOI] [PMC free article] [PubMed] [Google Scholar]
- Du, G. G., and D. H. MacLennan. 1998. Functional consequences of mutations of conserved, polar amino acids in transmembrane sequences of the Ca2+ release channel (ryanodine receptor) of rabbit skeletal muscle sarcoplasmic reticulum. J. Biol. Chem. 273:31867–31872. [DOI] [PubMed] [Google Scholar]
- Fabiato, A. 1988. Computer programs for calculating total from specified free or free from specified total ionic concentrations in aqueous solutions containing multiple metals and ligands. Methods Enzymol. 157:378–417. [DOI] [PubMed] [Google Scholar]
- Finch, E. A., T. J. Turner, and S. M. Goldin. 1991. Calcium as a coagonist of inositol 1,4,5-trisphosphate-induced calcium release. Science. 252:443–446. [DOI] [PubMed] [Google Scholar]
- Furuichi, T., K. Kohda, A. Miyawaki, and K. Mikoshiba. 1994. Intracellular channels. Curr. Opin. Neurobiol. 4:294–303. [DOI] [PubMed] [Google Scholar]
- Horn, R. 1991. Estimating the number of channels in patch recordings. Biophys. J. 60:433–439. [DOI] [PMC free article] [PubMed] [Google Scholar]
- Iino, M. 1990. Biphasic Ca2+ dependence of inositol 1,4,5-trisphosphate-induced Ca release in smooth muscle cells of the guinea pig taenia caeci. J. Gen. Physiol. 95:1103–1122. [DOI] [PMC free article] [PubMed] [Google Scholar]
- Kawasaki, H., and R. H. Kretsinger. 1995. Calcium-binding proteins 1: EF-hands. Prot. Prof. 2:297–490. [PubMed] [Google Scholar]
- Kaznacheyeva, E., V. D. Lupu, and I. Bezprozvanny. 1998. Single-channel properties of inositol (1,4,5)-trisphosphate receptor heterologously expressed in HEK-293 cells. J. Gen. Physiol. 111:847–856. [DOI] [PMC free article] [PubMed] [Google Scholar]
- Kroll, K. A., S. Otte, G. Hirschfeld, S. Barnikol-Watanabe, H. Gotz, H. Sternbach, H. D. Kratzin, H. U. Barnikol, and N. Hilschmann. 1999. Heterologous overexpression of human NEFA and studies on the two EF- hand calcium-binding sites. Biochem. Biophys. Res. Commun. 260:1–8. [DOI] [PubMed] [Google Scholar]
- Lechleiter, J. D., and D. E. Clapham. 1992. Molecular mechanisms of intracellular calcium excitability in Xenopus laevis oocytes. Cell. 69:283–294. [DOI] [PubMed] [Google Scholar]
- Li, P., and S. R. Chen. 2001. Molecular basis of Ca2+ activation of the mouse cardiac Ca2+ release channel (ryanodine receptor). J. Gen. Physiol. 118:33–44. [DOI] [PMC free article] [PubMed] [Google Scholar]
- Mak, D. O., S. McBride, and J. K. Foskett. 1998. Inositol 1,4,5-trisphosphate activation of inositol trisphosphate receptor Ca2+ channel by ligand tuning of Ca2+ inhibition. Proc. Natl. Acad. Sci. USA. 95:15821–15825. [DOI] [PMC free article] [PubMed] [Google Scholar]
- Michikawa, T., J. Hirota, S. Kawano, M. Hiraoka, M. Yamada, T. Furuichi, and K. Mikoshiba. 1999. Calmodulin mediates calcium-dependent inactivation of the cerebellar type 1 inositol 1,4,5-trisphosphate receptor. Neuron. 23:799–808. [DOI] [PubMed] [Google Scholar]
- Mignery, G. A., P. A. Johnston, and T. C. Sudhof. 1992. Mechanism of Ca2+-inhibition of InsP3 binding to the cerebellar InsP3 receptor. J. Biol. Chem. 267:7450–7455. [PubMed] [Google Scholar]
- Mignery, G. A., C. L. Newton, B. T. Archer, and T. C. Sudhof. 1990. Structure and expression of the rat inositol 1,4,5-trisphosphate receptor. J. Biol. Chem. 265:12679–12685. [PubMed] [Google Scholar]
- Mignery, G. A., and T. C. Sudhof. 1990. The ligand binding site and transduction mechanism in the inositol-1,4,5-triphosphate receptor. EMBO J. 9:3893–3898. [DOI] [PMC free article] [PubMed] [Google Scholar]
- Miyakawa, T., A. Maeda, T. Yamazawa, K. Hirose, T. Kurosaki, and M. Iino. 1999. Encoding of Ca2+ signals by differential expression of IP3 receptor subtypes. EMBO J. 18:1303–1308. [DOI] [PMC free article] [PubMed] [Google Scholar]
- Miyakawa, T., A. Mizushima, K. Hirose, T. Yamazawa, I. Bezprozvanny, T. Kurosaki, and M. Iino. 2001. Ca2+-sensor region of IP3 receptor controls intracellular Ca2+ signaling. EMBO J. 20:1674–1680. [DOI] [PMC free article] [PubMed] [Google Scholar]
- Nosyreva, E., T. Miyakawa, Z. Wang, L. Glouchankova, A. Mizushima, M. Iino, and I. Bezprozvanny. 2002. The high affinity calcium-calmodulin-binding site does not play a role in modulation of type 1 inositol (1,4,5)-trisphosphate receptor function by calcium and calmodulin. Biochem. J. 365:659–667. [DOI] [PMC free article] [PubMed] [Google Scholar]
- Othmer, H. G., and Y. Tang. 1993. Oscillations and waves in a model of InsP3-controlled calcium dynamics. In Experimental and Theoretical Advances in Biological Pattern Formation. H. G. Othmer, editor. Plenum Press, New York. 277–299.
- Parker, I., J. Choi, and Y. Yao. 1996. Elementary events of InsP3-induced Ca2+ liberation in Xenopus oocytes: hot spots, puffs and blips. Cell Calcium. 20:105–121. [DOI] [PubMed] [Google Scholar]
- Ramos-Franco, J., S. Caenepeel, M. Fill, and G. Mignery. 1998. Single channel function of recombinant type-1 inositol 1,4,5-trisphosphate receptor ligand binding domain splice variants. Biophys. J. 75:2783–2793. [DOI] [PMC free article] [PubMed] [Google Scholar]
- Sienaert, I., H. De Smedt, J. B. Parys, L. Missiaen, S. Vanlingen, H. Sipma, and R. Casteels. 1996. Characterization of a cytosolic and a luminal Ca2+ binding site in the type I inositol 1,4,5-trisphosphate receptor. J. Biol. Chem. 271:27005–27012. [DOI] [PubMed] [Google Scholar]
- Sienaert, I., L. Missiaen, H. De Smedt, J. B. Parys, H. Sipma, and R. Casteels. 1997. Molecular and functional evidence for multiple Ca2+-binding domains in the type 1 inositol 1,4,5-trisphosphate receptor. J. Biol. Chem. 272:25899–25906. [DOI] [PubMed] [Google Scholar]
- Taylor, C. W. 1998. Inositol trisphosphate receptors: Ca2+-modulated intracellular Ca2+ channels. Biochim. Biophys. Acta. 1436:19–33. [DOI] [PubMed] [Google Scholar]
- Thrower, E. C., R. E. Hagar, and B. E. Ehrlich. 2001. Regulation of Ins1,4,5P3 receptor isoforms by endogenous modulators. Trends Pharmacol. Sci. 22:580–586. [DOI] [PubMed] [Google Scholar]
- Tu, H., T. Miyakawa, Z. Wang, L. Glouchankova, M. Iino, and I. Bezprozvanny. 2002. Functional characterization of the type 1 inositol 1,4,5-trisphosphate receptor coupling domain SII(+/−) splice variants and the opisthotonos mutant form. Biophys. J. 82:1995–2004. [DOI] [PMC free article] [PubMed] [Google Scholar]
- Ward, L. D. 1985. Measurement of ligand binding to proteins by fluorescence spectroscopy. Methods Enzymol. 117:400–414. [DOI] [PubMed] [Google Scholar]
- Weers, P. M., C. M. Kay, and R. O. Ryan. 2001. Conformational changes of an exchangeable apolipoprotein, apolipophorin III from Locusta migratoria, at low pH: correlation with lipid binding. Biochemistry. 40:7754–7760. [DOI] [PubMed] [Google Scholar]
- Yamada, M., A. Miyawaki, K. Saito, T. Nakajima, M. Yamamoto-Hino, Y. Ryo, T. Furuichi, and K. Mikoshiba. 1995. The calmodulin-binding domain in the mouse type 1 inositol 1,4,5-trisphosphate receptor. Biochem. J. 308:83–88. [DOI] [PMC free article] [PubMed] [Google Scholar]
- Yoshikawa, F., H. Iwasaki, T. Michikawa, T. Furuichi, and K. Mikoshiba. 1999. Trypsinized cerebellar inositol 1,4,5-trisphosphate receptor. Structural and functional coupling of cleaved ligand binding and channel domains. J. Biol. Chem. 274:316–327. [DOI] [PubMed] [Google Scholar]
- Zhang, X., and S. K. Joseph. 2001. Effect of mutation of a calmodulin binding site on Ca2+ regulation of inositol trisphosphate receptors. Biochem. J. 360:395–400. [DOI] [PMC free article] [PubMed] [Google Scholar]