

Abstract
Recent advances in experimental and computational methods have made it possible to determine with considerable accuracy the structures whose formation is rate limiting for the folding of some small proteins—the transition state ensemble, or TSE. We present a method to analyze and validate all-atom models of such structures. The method is based on the comparison of experimental data with the computation of the change in free energy of the TSE resulting from specific mutations. Each mutation is modeled individually in all members of an ensemble of transition state structures using a method originally developed to predict mutational changes in the stability of native proteins. We first apply this method to six proteins for which we have determined the TSEs with a technique that uses experimental mutational data (Φ-values) as restraints in the structure determination and find a highly significant correlation between the calculated free energy changes and those derived from experimental kinetic data. We then use the procedure to analyze transition state structures determined by molecular dynamics simulations of unfolding, again finding a high correlation. Finally, we use the method to estimate changes in folding rates of several hydrophobic core mutants of Fyn SH3. Taken together, these results show that the procedure developed here is a tool of general validity for analyzing, assessing, and improving the quality of the structures of transition states for protein folding.
INTRODUCTION
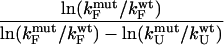
Because of its transient nature, the transition state ensemble for a protein folding reaction can at present be probed experimentally only by kinetic methods. The protein engineering approach (Matouschek et al., 1989) has proved to be the most important experimental strategy for obtaining residue specific information about the interactions present within the transition state ensemble (TSE). Experimental results are usually interpreted in the form of Φ-values, which represent the change in stability accompanying the mutation of a residue in the transition state relative to the effect of the same mutation in the native state. Quantitatively,  where N,
  and U represent the native, transition, and denatured state, respectively, and the first Δ refers to the difference between the mutant and wild-type proteins (Matouschek et al., 1989). Although several assumptions must be made to be able to interpret the experimentally observed Φ-values (Fersht et al., 1992), internal consistency and agreement with computer simulations (Li and Daggett, 1994, 1996; Lazaridis and Karplus, 1997; Shoemaker et al., 1999; Tsai et al., 1999; Vendruscolo et al., 2001; Fersht and Daggett, 2002; Daggett, 2002; Paci et al., 2002a) suggest that they contain remarkably detailed information regarding the structure of the TSEs for protein folding. A problem still open is, however, how to give a rigorous structural interpretation of experimental Φ-values.
Several computational procedures to obtain structural information about the TSE have been developed. These include molecular dynamics simulations of unfolding (Daggett, 2002) or exploration of the free energy surfaces of proteins (Shoemaker et al., 1999; Shea and Brooks 3rd, 2001). Recently, a procedure which extends the information that can be obtained from experimental Φ-values has been developed (Vendruscolo et al., 2001; Paci et al., 2002a). In this method, Φ-values are used as restraints in Monte Carlo or molecular dynamics sampling to obtain a detailed molecular description of the TSE. When carefully validated, these methods have the potential to provide a detailed understanding of the complicated processes that occur during protein folding. It is therefore important to establish tools to analyze TSE structures. In the present study our objective is twofold. First, we aim at developing a general procedure to analyze and validate structural information on transition states for folding. Second, we examine the validity of an often used approximation that assumes that changes in the stability of the TSE resulting from deletion mutations can be modeled as removal of native state contacts (Li and Daggett, 1994; Clementi et al., 2000; Vendruscolo et al., 2001; Li and Shakhnovich, 2001; Paci et al., 2002a; Gsponer and Caflisch, 2002).
Our strategy is to analyze free energy changes upon mutation in the TSE structures. The relationship between structure and stability, in relation to protein engineering studies, has been the subject of intense research for the native states of proteins (Carter et al., 2001; Gromiha et al., 2002; Guerois et al., 2002; Kortemme and Baker, 2002). We here extend these studies to transition state structures. Through the comparison with experimental results we use this method as a validation tool for TSE structures. The calculation of free energy changes is based on a physical model for the dominant interactions present in proteins. This model, FOLD-X, has been shown to be effective in predicting the effects of mutations on the native state stabilities of a large set of proteins (Guerois et al., 2002). Since FOLD-X is computationally rapid, the method that we present can be used effectively to analyze and validate transition state structures in terms of their energetics. The procedure provides us with a direct link between protein structure, and experimentally observed free energy changes and we are therefore not restrained to take only native interactions into account.
METHODS
Computational strategy
As the properties of the free energy surface near the transition state region are intimately linked to kinetic properties, we deal with kinetic data from protein folding and unfolding experiments by focusing on the relationship between experimental and calculated Φ-values. To carry out the analysis we consider four types of Φ-values, listed in Table 1. The quantities measured experimentally by monitoring the changes of folding and unfolding rates due to mutations are defined as  values. Transition state theory, or an alternative rate theory, can then be used to interpret the
  values in terms of changes in stability, by assuming that mutations do not significantly affect the pre-exponential factor (Fersht et al., 1992).
TABLE 1.
| Name | Definition | |
|---|---|---|
 |
|
|
 |
|
|
 |
|
|
 |
|


Experimental and computational definitions of Φ-values. See text for descriptions.
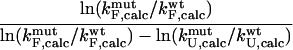
At least three different computational definitions of Φ-values can be utilized to interpret the Φ-values observed experimentally. The most straightforward definition is that of the  values (Table 1) that resembles closely the experimental procedure. The
  values can be obtained by simulating the folding and unfolding process and calculating rates for each reaction for both wild-type and mutant proteins. This approach is, however, extremely demanding computationally and has, to our knowledge, only been applied to simple models of protein folding (Nymeyer et al., 2000; Klimov and Thirumalai, 2002; Sorenson and Head-Gordon, 2002; Treptow et al., 2002). A more suitable definition for all-atom structures is that of
  values (Table 1), where it is assumed that the kinetic properties of the system can be determined from the thermodynamic properties of the native, transition, and unfolded states.
  values are analogous to the transition state theory interpretation of experimental Φ-values described above. Finally, a commonly used definition in computational studies is that of
  values (Table 1) (Li and Daggett, 1994, 1996; Shoemaker et al., 1999; Vendruscolo et al., 2001; Paci et al., 2002a; Li and Shakhnovich, 2001; Gsponer and Caflisch, 2002). In the calculation of
  values, C
 and CN are the number of native atom-atom contacts in the transition and native state, respectively. This method for calculating Φ-values is convenient as the
  values can be readily calculated from protein structures. It is, however, approximate as it is based on the assumption that native state contacts are dominant in the TSE.
We examine the validity of the approximations involved in using  values in computational studies. The first test that we present involves the use of the computational definition of
  values to generate the TSE for a given protein (Vendruscolo et al., 2001; Paci et al., 2002a).
  values are then calculated from these structures, using FOLD-X (Guerois et al., 2002) and compared with the
  values. Finding a correlation between the
  values and the
  values would support the consistency of the following sequence of approximations:
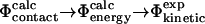 |
In this way, we break down the complex problem of establishing the link between  and
and  values into two simpler problems. Finding a correlation after such a cycle of calculations would support the consistency in the use of the contact interpretation of Φ-values in structure determination of the TSE.
We also calculate free energy changes for mutations for which Φ-values have not been used to generate the TSE. We perform two such sets of calculations. First, we calculate  from a TSE that has been determined using unbiased molecular dynamics simulations (Gsponer and Caflisch, 2002). Secondly, we use only a subset of the experimental data to determine the TSE by restrained simulations and compare the predictions for several additional mutations with experimental data (Northey et al., 2002b).
Determination of transition state structures
All-atom transition state structures for seven proteins were determined from experimental Φ-values (Itzhaki et al., 1995; Villegas et al., 1998; Riddle et al., 1999; Chiti et al., 1999; Hamill et al., 2000; Fowler and Clarke, 2001; Northey et al., 2002a,b) by restrained molecular dynamics simulations (Paci et al., 2002a). The proteins involved are: muscle acylphosphatase (AcP), chymotrypsin inhibitor 2 (CI2), the SH3 domain from the src tyrosine kinase (src SH3), the SH3 domain from Fyn (Fyn SH3), the activation domain of human procarboxypeptidase A2 (ADA2h), the third fibronectin type III domain from tenascin (TNfn3), and the 27th Ig domain from the I-band of human cardiac titin (TI I27). The native state structures of AcP (1APS), CI2 (2CI2), Fyn SH3 (1SHF), ADA2h (1AYE), TNfn3 (1TEN), and TI I27 (1TIT) were taken from the Protein Data Bank (Berman et al., 2000). The structure of the src SH3 domain was extracted from that of the complete src tyrosine kinase (1FMK). The definitions of Φ-values in Table 1 apply only to proteins that fold by two-state kinetics. Since TI I27 folds via an intermediate in the calculations for TI I27 we used Φ-values calculated under conditions where the intermediate is not populated (Fowler and Clarke, 2001).
The transition state structures for src SH3 obtained from unrestrained molecular dynamics simulations of unfolding (Gsponer and Caflisch, 2002) were provided by Jörg Gsponer and Amedeo Caflisch. The native state ensemble was sampled using equilibrium molecular dynamics (Paci et al., 2002a).
Calculation of Φ-values based on free energies
Calculations of  and
and  were carried out using the FOLD-X program (Guerois et al., 2002). FOLD-X takes as input a protein structure file and a list of mutations. With a wild-type native state structure as input, FOLD-X predicts
  using a free energy function that has been parameterized from a large set of native state experimental data. By analogy, using transition state structures as input to FOLD-X, we obtained values for
  . Utilizing the native and transition state structures as input to FOLD-X we therefore calculated
  and
and  for a range of mutations that have been studied experimentally. In total we examined 223 mutations, distributed as follows: AcP (25), src SH3 (39), Fyn SH3 (41), TI I27 (26), ADA2h (15), CI2 (51), and TNfn3 (26). By averaging over ensembles of native and transition state structures we obtained estimates for
  A web interface to FOLD-X can be found at http://fold-x.embl-heidelberg.de (April, 2003).
RESULTS
To calculate Φ-values based on free energies we extended the FOLD-X procedure (Guerois et al., 2002) to transition state structures. As a first step we modeled each mutation in both the native and transition state structures as described previously (Guerois et al., 2002). In Fig. 1 we illustrate the procedure with a specific example. Here the wild-type structure of src SH3 in both the native and transition state, the latter determined as described in Methods, are shown (Fig. 1, A and C). We also show structures for the I56A variant in both the native and transition state as modeled using FOLD-X (Fig. 1, B and D). Changes in free energy accompanying the I56A mutation is then estimated using either the native ( ) or transition (
 ) state structures using FOLD-X; from these numbers we calculate
  . Using only the structures shown in Fig. 1, we estimate
  which is in excellent agreement with the experimental value for I56A (
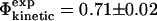 ). However, since the experimental data are averages over an ensemble of molecules it is more appropriate to estimate
  and
and  as averages over the native and transition state ensembles. In this way we obtain
 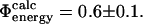 The variance in the calculations of free energy changes in the native and transition state ensembles is caused by the width of the ensembles.
FIGURE 1.

Mutations were modeled in the native and transition state structures as described previously (Guerois et al., 2002; Vriend, 1990). As an example, we show here the wild-type (A and C) and I56A mutant (B and D) of src SH3. In A and B, we show native state structures, whereas in C and D we show a representative member of the respective TSE. Residue 56 is shown by van der Waals spheres, and residues that are in contact with this residue in the native state are shown as ball-and-stick. The figure was prepared using MOLSCRIPT (Kraulis, 1991).
We first present the results for AcP, src SH3, TI I27, ADA2h, CI2, and TNfn3. We repeated the calculations of  and
and  for all the 182 mutations in these six proteins. As an example, we show in Fig. 2 a comparison between the resulting
  and
and  values of TNfn3. The calculated free energy changes for each mutant have been averaged over native and transition state ensembles, each represented by 250 structures. For the 182 mutations studied in the six proteins we have, in total, modeled 182 × 2 × 250 = 91,000 mutations, and for each calculated a ΔΔrG value. While most calculated Φ-values fall within the range 0–1, which can most readily be interpreted in structural terms (Fersht et al., 1992), some are out of this range. In the six proteins that we considered, mutations giving rise to such nonclassical
  values in nearly all cases also have a large standard deviation. Examples in TNfn3 (Fig. 2) are the E86A and T90A mutations which have
  values of 1.2 ± 2.3 and 2 ± 13, respectively.
FIGURE 2.

Comparison of experimental and calculated Φ-values. (A) Bar diagram showing a comparison between the  values (black) and the
  values (white) for TNfn3. (B) Correlation between the
  values and the
  values for TNfn3. Error bars indicate standard deviations.
In several cases we find a large variance in the  values. One of the main factors for this result is that
  is of comparable magnitude to its variance. This situation closely resembles the well-known fact that many mutations are unsuitable for experimental Φ-value analysis as they give rise to small values of ΔΔrG
 (Itzhaki et al., 1995; Riddle et al., 1999; Villegas et al., 1998; Hamill et al., 2000; Fowler and Clarke, 2001; Mirny and Shakhnovich, 2001). It is important to recognize that it is the variance in the determination of
  that defines the magnitude of the change in stability that is needed to calculate a well-defined Φ-value. We therefore use the relative error in
  to select the mutations that are appropriate for further analysis: here we have chosen to examine only the mutations where the relative error in
  is <0.3 (i.e., |σ/
 | <0.3), where σ is the standard deviation of
  We have verified that our conclusions do not depend on the precise value of this cutoff, and that the correlations we observe are highly significant (p < 10−4) as long as we choose the relative error on
  to be <0.5. The value of 0.3 was chosen as a tradeoff: using a higher value introduces more ill-determined
  values into our dataset, whereas lower values leave fewer mutations for analysis. For the subset of 73 mutations that have sufficiently low variance to satisfy this criterion, the
  values are plotted against the experimental data in Fig. 3. The coefficient of correlation is 0.7. These results show that the
  and
and  definitions are highly compatible. Therefore they validate one of the main assumptions of the method that we used to determine the TSE structures by biasing the
  values to be equal to the
  values (see Methods).
FIGURE 3.

Comparison of  values and
  values for the six proteins studied here. Data are shown only for mutations for which the relative error in the determination of the change in native state stability upon mutation is <0.3. The correlation coefficient is 0.7 (p < 10−4). Error bars indicate standard deviations.
The method discussed in this work for comparing  and
and  values can be used to examine transition state structures generated by different techniques. Such calculations are important to demonstrate that
  values can be calculated reliably from TSE structures that have not been determined by using directly the
  approximation. To illustrate this point we repeated the calculations on a TSE for src SH3 consisting of 12 structures that had been calculated by unrestrained molecular dynamics simulations of unfolding (Gsponer and Caflisch, 2002). Calculation of
  values shows good agreement with the experimental results (Fig. 4). The coefficient of correlation is 0.7. Transition state structures determined by computational methods should always be tested against experimental results (Daggett and Fersht, 2003). In earlier studies a comparison of
  and
and  values were used (Li and Daggett, 1994, 1996; Gsponer and Caflisch, 2002). Since, as discussed above, the calculation of
  values involves several approximations, the possibility of calculating free energy changes during (un)folding simulations provides an alternative validation method. Moreover, it also allows for a more detailed study of the formation and disappearance of both native and non-native interactions.
FIGURE 4.

Plot of  values and
  values in a transition state ensemble of src SH3 obtained by unrestrained molecular dynamics simulations (Gsponer and Caflisch, 2002). Data are shown only for mutations for which the relative error in the determination of the change in native state stability upon mutation is <0.3. The correlation coefficient is 0.7 (p < 10−4). Error bars indicate standard deviations.
One of the basic assumptions of the Φ-value analysis is that  can be determined from ratios of folding rate constants (Fersht et al., 1992). We therefore measured the correlation between
 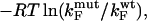 derived from experimental folding rates, and
  The calculated values are plotted against
  values in Fig. 5. There is a significant correlation between the calculated and experimental values of
  (the coefficient of correlation is 0.6). The correlation observed here is slightly weaker than that in Fig. 3 for two reasons: 1), all 182 mutations are included in the plot; and 2), in some cases where the FOLD-X prediction of
  is imprecise, we might observe some compensation for this error in the predicted
  value.
FIGURE 5.

Comparison between experimental and calculated values of  for the six proteins. The experimental values were calculated from the published folding rates. The correlation coefficient is 0.6 (p < 10−4). Error bars indicate standard deviations.
The calculation of both  and
and  may be a useful aid to predict mutations giving modified thermodynamic and folding properties. To illustrate this possibility we performed a set of calculations on mutations in the hydrophobic core of Fyn SH3. First we determined the TSE for Fyn SH3 using experimental Φ-values as input. For these calculations we used results from nine deletion mutations in the hydrophobic core (Northey et al., 2002b) as well as three mutations in polar residues (Northey et al., 2002a). We then calculated
  for 41 core mutations including both deletion and insertion mutations. Since only nine of these 41 mutations were used to generate the TSE, the results allow us to judge the predictive power of the method. Importantly, the set includes insertion mutations for which a native contact approximation is insufficient for calculating free energy changes. The results are presented in Fig. 6 and shows an overall good correlation between experimental and calculated Φ-values. The three main outliers in the plot correspond to mutations that introduce much larger side chains in the tightly packed folding nucleus consisting of residues I28, A39, and I50. This result is presumably caused by the erratic behavior resulting from such drastic mutations (Northey et al., 2002b). Leaving out these three mutations and the nine mutations that were used to generate the TSE, we obtain a correlation of 0.9 with a slope of 1.1. Interestingly, we are able to predict an increased folding rate of four single and double mutations involving the substitution A39V in the core.
FIGURE 6.

Comparison between experimental and calculated values of  in Fyn SH3. Each point corresponds to either a single or double mutation in the hydrophobic core. Open circles indicate mutations for which the experimental Φ-value was used as restraint in generating the TSE. Not all of these nine mutations are visible in the plot. Three outliers are labeled and are discussed in the text.
DISCUSSION
Structural interpretation of Φ-values
To use kinetic data for determination of the TSE structures, either directly or as a validation tool, it is essential to interpret  values in structural terms. Φ-values have often been rationalized in terms of persistence of native contacts (Li and Daggett, 1994, 1996; Shoemaker et al., 1999; Vendruscolo et al., 2001; Paci et al., 2002a; Li and Shakhnovich, 2001; Gsponer and Caflisch, 2002). Here we instead directly calculate free energy changes from the TSE structures and compare them with the experimentally observed values. Importantly, this method takes into account the specific nature of amino acid side-chains and the possible presence of non-native interactions.
To determine the TSE structures we sample the conformational space so that the fraction of native contacts (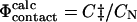 ) present in a given structure is close to the Φ-value determined experimentally. If the ratio differs from the experimental value, we bias the simulations so that the next step in the molecular dynamics sampling is likely to diminish the difference between
  and
and  Here we have explored the relationship between
  and
and  as the latter is a more realistic approximation to
  Previously it has been shown that in the native state there is high correlation between the total number of contacts formed and the total interaction energy of a given residue (Paci et al., 2002b). However, this finding does not by itself prove that
  values are equivalent to
  values, since the latter include entropic terms and non-native interactions as well as the energetic effects of specific mutations.
The results presented here show that there is a good correlation between contact formation and free energy changes in the TSE upon mutation, at least for the type of mutations that are used in Φ-value analysis—the correlation that we obtain between  and
and  (coefficient of correlation 0.7) is almost as high as the one obtained between
  and
and  (coefficient of correlation 0.8 (Guerois et al., 2002)). These results are remarkable given the nature of the calculations involved. First, we take experimental data on the kinetics of protein folding and interpret the changes resulting from specific mutations as loss of native atom-atom contacts. We then generate protein conformations which contain this subset of native contacts. After calculation of mutational free energy changes using a detailed physical model of the interactions present in proteins and modeling of specific mutations, we then compare with experimental data. The fact that we observe a significant correlation between
  and
and  after performing this cycle of calculations suggests that the
  approximation is consistent with the
  interpretation and thus provides an effective method for interpreting the energetic effect of deletion mutations in the TSE.
The relationships between different definitions of Φ-values have been studied previously. For a simple model and a nonfrustrated landscape it has been shown that the  values and the
  values are equivalent; that is, the assumptions of transition state theory are valid in this case (Nymeyer et al., 2000). The relationship between
  and
and  values has also been investigated in a study of the energetic effects of mutations in the native, transition and unfolded states (Pan and Daggett, 2001). A free energy perturbation method was used to calculate Φ-values based on energies rather than contacts, and the results showed a good correlation between the
  and the
  values. Free energy perturbation calculations are important to clarify the theoretical foundations of the protein engineering method. However, they are computationally demanding—the study in Pan and Daggett (2001) was limited to a few mutations and to small ensembles of structures for a single protein—and therefore not practical as a general tool of analysis and validation of TSE structures. Furthermore, the calculations also require a detailed model of the denatured state that may not be available in sufficient detail in some cases.
Analyzing and validating transition state structures
The free energy changes that we calculate from TSE structures can be compared with experimental data and the method can thus can be used as a validation tool. An alternative procedure for validating proposed protein folding transition state structures is to calculate the commitment probability (Du et al., 1998; Li and Shakhnovich, 2001; Gsponer and Caflisch, 2002; Bolhuis et al., 2002). The commitment probability for the native state (pfold) for a given conformation is the probability of folding to the native state when trajectories are repeatedly initiated with random initial momenta from that particular structure. For the TSE, pfold = 0.5, i.e., trajectories initiated from transition state structures reach the native state and the unfolded state with equal probability. This method has been used in conjunction with the Gō model to validate TSE structures (Li and Shakhnovich, 2001). In another study, a small ensemble of transition state structures of src SH3 has been validated by measuring pfold based on an all-atom molecular dynamics approach (Gsponer and Caflisch, 2002). The calculation of pfold provides a validation method for TSE structures. However, its implementation requires the determination of a large number of trajectories to estimate the commitment probability with accuracy, as well as the assumption that the force field used is characterized by a free energy landscape that closely resembles the experimental one. One of the aims of the present study is therefore to propose an alternative and less computationally intensive validation method.
To show that our procedure for validating the TSE is general and to compare the results to the pfold analysis we also calculated  values for another TSE determined previously (Gsponer and Caflisch, 2002). The two TSEs obtained for src SH3, using either restrained (present study) or unrestrained molecular dynamics simulations (Gsponer and Caflisch, 2002), show similar structural features. The TSE obtained using unfolding simulations (Gsponer and Caflisch, 2002) seems to be a structural subset of the broader TSE that we have obtained using experimental data as input to simulations. For this TSE we also find a good correlation between
  and
and  values. These results demonstrate that the procedure can be used to validate structures obtained by different procedures. Importantly, it also shows that two alternative validation methods agree in this specific case. The two methods are complementary, as the pfold analysis directly probes the global kinetic properties of the TSE, whereas individual residues can be examined using our procedure.
Finally, our results on both src and Fyn SH3 shows that it is possible to estimate the effect of specific mutations on changes in kinetics given models of the structures in the TSE. Such structures can be obtained either from a limited set of Φ-values (Fyn SH3) or from unbiased simulations (src SH3). In the case of Fyn SH3 it is particularly interesting to note that we are able to predict the increased folding rate of A39V in Fyn SH3 which is “far beyond the level expected from the volume increase of the side chain” (Northey et al., 2002b).
Further applications of free energy functions to study TSEs
In addition to the development of a general method for examining the quality of TSE structures calculated by different procedures, the results that we present also show that energy functions such as FOLD-X can be used not only for native structures but also for other regions of the protein folding energy landscape. This finding indicates that relatively simple free energy functions may be sufficient for describing important aspects of the protein folding process. In cases where such functions have only been optimized for use with native proteins, the TSEs, when properly validated, may provide an additional database of structures for further development of force fields. Thus, it is likely that by using both native and TSE structures it may be possible to refine functions that describe the energy landscapes for proteins. For example, while we find that the TSEs studied here are dominated by native interactions, in other cases, non-native interactions may be important (Capaldi et al., 2002). Our method would be highly suited to study such systems in realistic all-atom models as the simple, native contact-based method would be insufficient.
The method described here can also be used in an alternative procedure for determining TSEs by biasing simulations with experimental data. If  values can be calculated with sufficient accuracy and speed, it becomes possible to use these rather than
  values to bias simulations. Such an approach would allow one to use nonclassical Φ-values and more directly to study the importance of non-native interactions in the TSE. Also, it would allow for the use of several Φ-values for a single residue as obtained from an experimental fine-structure analysis of the TSE (Fersht et al., 1992), and thus directly to use the chemical information obtained from Φ-values arising from specific mutations. This would result in a higher resolution structure determination of the interactions present in the TSE. Finally, a possibility of calculating the interaction energy, as obtained experimentally in double mutant cycles (Fersht et al., 1992), would provide a tool to determine very precisely the structures in the TSE.
CONCLUSIONS
We have developed an effective procedure to calculate free energy changes and Φ-values from TSE structures using a semiempirical free energy function. In this way it is possible to validate structures of the TSE determined by different approaches, here exemplified by both restrained and unrestrained molecular dynamics simulations. Further, we showed that it is possible to calculate free energy changes in non-native states using a relatively simple and realistic model not based only on native contacts. This will allow for the study of mutational effects in other states, e.g., equilibrium molten globules or in molecular models of conformations which cannot be studied experimentally. For example, we have used the procedure to examine the effect of mutation on the stability of structures along an unfolding trajectory (K. Lindorff-Larsen, unpublished data).
An equally important aim of the work was to devise a procedure to examine the validity of the use of  values in all-atom models of proteins. Our results show that, for residues for which there is a small relative error in the determination of
  we can reproduce the experimental Φ-values. This result supports one of the major assumptions in procedures to calculate TSE structures from experimental data. Finally, we show that there is a clear link between stability and structure in the transition state as well as in the native state and that relatively simple free energy functions can be used to study this relationship in detail.
Advances in the understanding of the mechanisms and determinants of protein folding have required an intimate interplay between experimental and computational methods (Dinner et al., 2000; Daggett and Fersht, 2003; Vendruscolo and Paci, 2003). The TSE structures that we present in this work are determined from experimentally measured Φ-values. At present, this type of experiments provides the most detailed information about the rate limiting structures available. We have shown that the structures that we determined are compatible with a detailed physical model for interpretation of the experiments. An important challenge for experimentalists and theoreticians is to develop further techniques that can be used independently to verify models for structures of transition states for protein folding.
Acknowledgments
We thank Jane Clarke and Martin Karplus for many interesting discussions, and Jörg Gsponer and Amedeo Caflisch for providing their data on src SH3 before publication.
K.L.L. is supported by the Danish Research Agency. C.M.D. is supported in part by a program grant from the Wellcome Trust. M.V. is a Royal Society University Research Fellow.
References
- Berman, H. M., J. Westbrook, Z. Feng, G. Gillirand, T. N. Bhat, H. Weissig, I. N. Shindyalov, and P. E. Bourne. 2000. The Protein Data Bank. Nucleic Acids Res. 28:235–242. [DOI] [PMC free article] [PubMed] [Google Scholar]
- Bolhuis, P. G., D. Chandler, C. Dellago, and P. L. Geissler. 2002. Transition path sampling: throwing ropes over rough mountain passes, in the dark. Annu. Rev. Phys. Chem. 53:291–318. [DOI] [PubMed] [Google Scholar]
- Capaldi, A. P., C. Kleanthous, and S. E. Radford. 2002. Im7 folding mechanism: misfolding on a path to the native state. Nat. Struct. Biol. 9:209–216. [DOI] [PubMed] [Google Scholar]
- Carter, C. W., B. C. LeFebvre, S. A. Cammer, A. Tropsha, and M. H. Edgell. 2001. Four-body potentials reveal protein-specific correlations to stability changes caused by hydrophobic core mutations. J. Mol. Biol. 311:625–638. [DOI] [PubMed] [Google Scholar]
- Chiti, F., N. Taddei, P. M. White, M. Bucciantini, F. Magherini, M. Stefani, and C. M. Dobson. 1999. Mutational analysis of acylphosphatase suggests the importance of topology and contact order in protein folding. Nat. Struct. Biol. 6:1005–1009. [DOI] [PubMed] [Google Scholar]
- Clementi, C., H. Nymeyer, and J. N. Onuchic. 2000. Topological and energetic factors: what determines the structural detail of the transition state ensemble and “en-route” intermediates for protein folding? An investigation for small globular proteins. J. Mol. Biol. 298:937–953. [DOI] [PubMed] [Google Scholar]
- Daggett, V. 2002. Molecular dynamics simulations of the protein unfolding/folding reaction. Acc. Chem. Res. 35:422–429. [DOI] [PubMed] [Google Scholar]
- Daggett, V., and A. R. Fersht. 2003. Is there a unifying mechanism for protein folding? Trends Biochem. Sci. 28:18–25. [DOI] [PubMed] [Google Scholar]
- Dinner, A. R., A. Sali, L. J. Smith, C. M. Dobson, and M. Karplus. 2000. Understanding protein folding via free-energy surfaces from theory and experiment. Trends Biochem. Sci. 25:331–339. [DOI] [PubMed] [Google Scholar]
- Du, R., V. S. Pande, A. Y. Grosberg, T. Tanaka, and E. I. Shakhnovich. 1998. On the transition coordinate for protein folding. J. Chem. Phys. 108:334–350. [Google Scholar]
- Fersht, A. R., and V. Daggett. 2002. Protein folding and unfolding at atomic resolution. Cell. 108:573–582. [DOI] [PubMed] [Google Scholar]
- Fersht, A. R., A. Matouschek, and L. Serrano. 1992. The folding of an enzyme. I. Theory of protein engineering analysis of stability and pathway of protein folding. J. Mol. Biol. 224:771–782. [DOI] [PubMed] [Google Scholar]
- Fowler, S. B., and J. Clarke. 2001. Mapping the folding pathway of an immunoglobulin domain: structural detail from Φ value analysis and movement of the transition state. Structure. 9:355–366. [DOI] [PubMed] [Google Scholar]
- Gromiha, M. M., H. Uedaira, J. An, S. Selvaraj, P. Prabakaran, and A. Sarai. 2002. ProTherm, thermodynamic database for proteins and mutants: developments in version 3.0. Nucleic Acids Res. 30:301–302. [DOI] [PMC free article] [PubMed] [Google Scholar]
- Gsponer, J., and A. Caflisch. 2002. Molecular dynamics simulations of protein folding from the transition state. Proc. Natl. Acad. Sci. USA. 99:6719–6724. [DOI] [PMC free article] [PubMed] [Google Scholar]
- Guerois, R., J. E. Nielsen, and L. Serrano. 2002. Predicting changes in the stability of proteins and protein complexes: a study of more than 1000 mutations. J. Mol. Biol. 320:369–387. [DOI] [PubMed] [Google Scholar]
- Hamill, S. J., A. Steward, and J. Clarke. 2000. The folding of an immunoglobulin-like Greek key protein is defined by a common-core nucleus and regions constrained by topology. J. Mol. Biol. 297:165–178. [DOI] [PubMed] [Google Scholar]
- Itzhaki, L. S., D. E. Otzen, and A. R. Fersht. 1995. The structure of the transition state for folding of chymotrypsin inhibitor 2 analysed by protein engineering methods: evidence for a nucleation-condensation mechanism for protein folding. J. Mol. Biol. 254:260–288. [DOI] [PubMed] [Google Scholar]
- Klimov, D. K., and D. Thirumalai. 2002. Stiffness of the distal loop restricts the structural heterogeneity of the transition state ensemble in SH3 domains. J. Mol. Biol. 315:721–737. [DOI] [PubMed] [Google Scholar]
- Kortemme, T., and D. Baker. 2002. A simple physical model for binding energy hot spots in protein-protein complexes. Proc. Natl. Acad. Sci. USA. 99:14116–14121. [DOI] [PMC free article] [PubMed] [Google Scholar]
- Kraulis, P. J. 1991. MOLSCRIPT: a program to produce both detailed and schematic plots of protein structures. J. Appl. Crystallog. 24:946–950. [Google Scholar]
- Lazaridis, T., and M. Karplus. 1997. ‘New view’ of protein folding reconciled with the old through multiple unfolding simulations. Science. 278:1928–1931. [DOI] [PubMed] [Google Scholar]
- Li, A., and V. Daggett. 1994. Characterization of the transition state of protein unfolding by use of molecular dynamics: chymotrypsin inhibitor 2. Proc. Natl. Acad. Sci. USA. 91:10430–10434. [DOI] [PMC free article] [PubMed] [Google Scholar]
- Li, A., and V. Daggett. 1996. Identification and characterization of the unfolding transition state of chymotrypsin inhibitor 2 by molecular dynamics simulations. J. Mol. Biol. 257:412–429. [DOI] [PubMed] [Google Scholar]
- Li, L., and E. I. Shakhnovich. 2001. Constructing, verifying, and dissecting the folding transition state of chymotrypsin inhibitor 2 with all-atom simulations. Proc. Natl. Acad. Sci. USA. 98:13014–13018. [DOI] [PMC free article] [PubMed] [Google Scholar]
- Matouschek, A., J. T. J. Kellis, L. Serrano, and A. R. Fersht. 1989. Mapping the transition state and pathway of protein folding by protein engineering. Nature. 340:122–126. [DOI] [PubMed] [Google Scholar]
- Mirny, L., and E. Shakhnovich. 2001. Protein folding theory: from lattice to all-atom models. Annu. Rev. Biophys. Biomol. Struct. 30:361–396. [DOI] [PubMed] [Google Scholar]
- Northey, J. G., K. L. Maxwell, and A. R. Davidson. 2002a. Protein folding kinetics beyond the φ value: using multiple amino acid substitutions to investigate the structure of the SH3 domain folding transition state. J. Mol. Biol. 320:389–402. [DOI] [PubMed] [Google Scholar]
- Northey, J. G., A. D. Nardo, and A. R. Davidson. 2002b. Hydrophobic core packing in the SH3 domain folding transition state. Nat. Struct. Biol. 9:126–130. [DOI] [PubMed] [Google Scholar]
- Nymeyer, H., N. D. Socci, and J. N. Onuchic. 2000. Landscape approaches to determine the ensemble of folding transition states: success and failure hinge on the degree of frustration. Proc. Natl. Acad. Sci. USA. 97:634–639. [DOI] [PMC free article] [PubMed] [Google Scholar]
- Paci, E., M. Vendruscolo, C. M. Dobson, and M. Karplus. 2002a. Determination of a transition state at atomic resolution from protein engineering data. J. Mol. Biol. 324:151–163. [DOI] [PubMed] [Google Scholar]
- Paci, E., M. Vendruscolo, and M. Karplus. 2002b. Validity of Gō models: Comparison with a solvent-shielded empirical energy decomposition. Biophys. J. 83:3032–3038. [DOI] [PMC free article] [PubMed] [Google Scholar]
- Pan, Y., and V. Daggett. 2001. Direct comparison of experimental and calculated folding free energies for hydrophobic deletion mutants of chymotrypsin inhibitor 2: free energy perturbation calculations using transition and denatured states from molecular dynamics simulations of unfolding. Biochemistry. 40:2723–2731. [DOI] [PubMed] [Google Scholar]
- Riddle, D. S., V. P. Grantcharova, J. V. Santiago, E. Alm, I. Ruczinski, and D. Baker. 1999. Experiment and theory highlight role of native state topology in SH3 folding. Nat. Struct. Biol. 6:1016–1024. [DOI] [PubMed] [Google Scholar]
- Shea, J.-E., and C. L. Brooks 3rd. 2001. From folding theories to folding proteins: a review and assessment of simulation studies of protein folding and unfolding. Annu. Rev. Phys. Chem. 52:499–535. [DOI] [PubMed] [Google Scholar]
- Shoemaker, B. A., J. Wang, and P. G. Wolynes. 1999. Exploring structures in protein folding funnels with free energy functionals: the transition state ensemble. J. Mol. Biol. 287:675–694. [DOI] [PubMed] [Google Scholar]
- Sorenson, J. M., and T. Head-Gordon. 2002. Protein engineering study of protein L by simulation. J. Comp. Biol. 9:35–54. [DOI] [PubMed] [Google Scholar]
- Treptow, W. L., M. A. A. Barbosa, L. G. Garcia, and A. F. P. de Araújo. 2002. Non-native interactions, effective contact order, and protein folding: a mutational investigation with the energetically frustrated hydrophobic model. Proteins. 49:167–180. [DOI] [PubMed] [Google Scholar]
- Tsai, J., M. Levitt, and D. Baker. 1999. Hierarchy of structure loss in MD simulations of src SH3 domain unfolding. J. Mol. Biol. 291:215–225. [DOI] [PubMed] [Google Scholar]
- Vendruscolo, M., and E. Paci. 2003. Protein folding: bringing theory and experiments closer together. Curr. Op. Struct. Biol. 13:82–87. [DOI] [PubMed] [Google Scholar]
- Vendruscolo, M., E. Paci, C. M. Dobson, and M. Karplus. 2001. Three key residues form a critical contact network in protein folding transition state. Nature. 409:641–645. [DOI] [PubMed] [Google Scholar]
- Villegas, V., J. C. Martinez, F. X. Avilés, and L. Serrano. 1998. Structure of the transition state in the folding process of human procarboxypeptidase A2 activation domain. J. Mol. Biol. 283:1027–1036. [DOI] [PubMed] [Google Scholar]
- Vriend, G. 1990. WHAT-IF: a molecular modeling and drug design program. J. Mol. Graph. 8:52–56. [DOI] [PubMed] [Google Scholar]