

Abstract
According to the different nucleotide occupancies of the F1-ATPase β-subunits and due to the asymmetry imposed through the central γ-subunit, the β-subunit adopts different conformations in the crystal structures. Recently, a spontaneous and nucleotide-independent closure of the open β-subunit upon rotation of the γ-subunit has been proposed. To address the question whether this closure is dictated by interactions to neighbored subunits or whether the open β-subunit behaves like a prestressed “spring,” we report multinanosecond molecular dynamics simulations of the isolated β-subunit with different start conformations and different nucleotide occupancies. We have observed a fast, spontaneous closure motion of the open βE-subunit, consistent with the available x-ray structures. The motions and kinetics are similar to those observed in simulations of the full (αβ)3γ-complex, which support the view of a prestressed “spring,” i.e., that forces internal to the βE-subunit dominate possible interactions from adjacent α-subunits. Additionally, nucleotide removal is found to trigger conformational transitions of the closed βTP-subunit; this provides evidence that the recently resolved half-closed β-subunit conformation is an intermediate state before product release. The observed motions provide a plausible explanation why ADP and Pi are required for the release of bound ATP and why γ-depleted (αβ)3 has a drastically reduced hydrolysis rate.
INTRODUCTION
The mitochondrial enzyme FoF1-ATP synthase synthesizes adenosine triphosphate (ATP), the universal currency of chemical energy in the cell. Using the pH-gradient between the cytosolic site and the matrix, the membrane embedded Fo-part (ab2c10−14, Escherichia coli nomenclature) drives the synthesis of ATP in the F1-headpiece (α3β3γδɛ, see also Fig. 1 A). The latter contains the three nucleotide binding pockets of the enzyme, which are formed mainly by the residues of the three β-subunits. For the reverse (hydrolysis) direction, a rotation of the Fo c-ring consisting of 10–14 identical subunits (Stock et al., 1999; Stahlberg et al., 2001; Seelert et al., 2000) has been observed in the FoF1-ATPase (Sambongi et al., 1999; Pänke et al., 2000). For the isolated F1-part, it has been shown that the hydrolysis of ATP is coupled to a rotation of the central, coiled-coil γ-subunit in 120° steps (Duncan et al., 1995; Sabbert et al., 1996; Noji et al., 1997). These experiments supported the picture of the FoF1-ATP synthase as two tightly coupled, fully reversible rotary motors (Engelbrecht and Junge, 1997; Junge et al., 1997). In synthesis direction, a proton flux across the membrane drives the rotation of the Fo c-ring. This rotary motion is transduced to the F1-motor by the γ- and ɛ-subunits located between Fo and F1. The peripheral subunits δ and b, as parts of the stator, hold the (αβ)3 hexamer of F1 in a fixed position. Thus, for the synthesis cycle, chemical energy is converted into rotational motion by the Fo-part, transmitted by the γ-subunit to the F1-head, and finally reconverted into chemical energy via synthesis of ATP within the three catalytic active sites of the F1-head.
FIGURE 1.
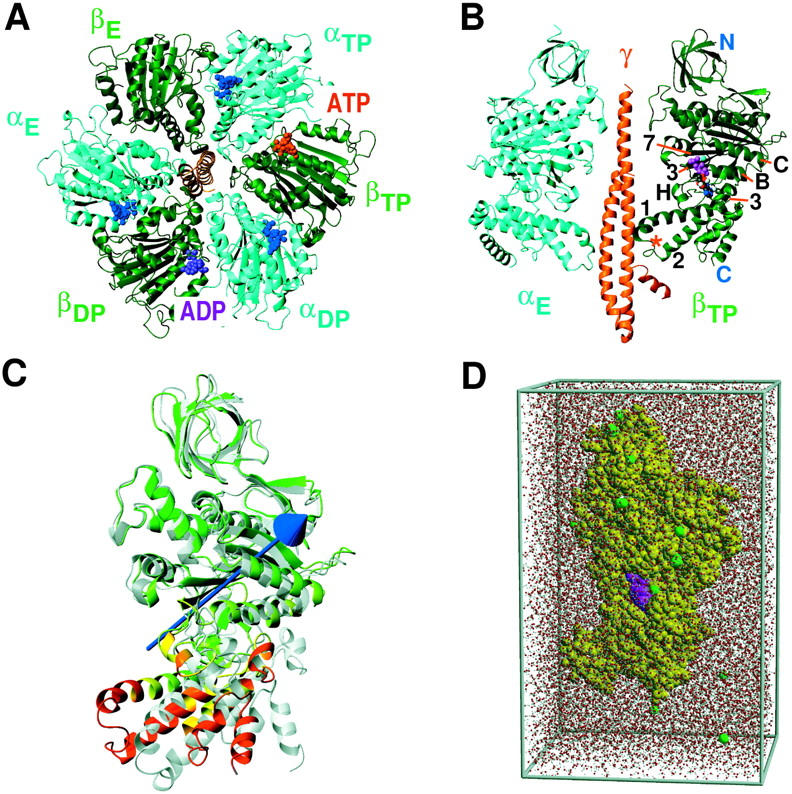
(αβ)3γ-complex of the F1-ATPase (Abrahams et al., 1994), as seen from the membrane (A) and lateral view of the αEβTPγ-fragment (B) together with notation of specific α-helices (3, B, C, and H) and β-sheets (3 and 7) according to Abrahams et al. (1994). The red star indicates the position of the DELSEED sequence (residues 394–400). Shown in C is an overlay of βTP- (colored) and βE-subunit (gray), taken from the x-ray structure (Gibbons et al., 2000), after fitting to the N-terminal and the substrate binding domain with the rotation vector representing the domain motion between lower and upper domain as determined by DynDom (Hayward and Berendsen, 1998; Hayward and Lee, 2002). The periodic simulation system for the isolated β-subunit (yellow; substrate, magenta) in a water box with sodium ions (green) is shown in D.
To achieve the almost 100% efficiency of the F1-motor (Yasuda et al., 1998), a tight coupling of the γ-rotation to structural rearrangements in at least one of the three nucleotide binding pockets has been suggested (Oster and Wang, 2000). This picture is supported by the available F1-unit crystal structures (Abrahams et al., 1994, 1996; van Raaij et al., 1996, Orriss et al., 1998; Gibbons et al., 2000; Braig et al., 2000; Menz et al., 2001), which show the three β-subunits in three different conformations. These differ in their particular position with respect to the asymmetrical γ-subunit and their nucleotide occupancy. As shown in Fig. 1 A, the binding pocket in one of the three β-subunits (βE) is empty, the second one (βDP -subunit) contains ADP, and the third one (βTP-subunit) contains the ATP analog AMP-PNP. In the structure by Abrahams et al. (1994), both the βTP- and βDP-subunits are in a closed conformation (C) and the empty βE-subunit is open (O). As seen in Fig. 1 C, the open conformation shows a large outwards tilt of the lower C-terminal domain by ∼26° with respect to the closed conformation. Recently, the F1-ATPase with a half-closed (HC) βADP+Pi-subunit could be resolved which was interpreted as an intermediate state shortly before product release (Menz et al., 2001).
These findings supported models for the binding change mechanism (Boyer, 1981; Cross, 1981; Duncan et al., 1995; Wang and Oster, 1998; Allison, 1998; Menz et al., 2001), for which each of the β-subunits — or binding pockets — is expected to go through (at least) three states during hydrolysis or synthesis. These states differ in their nucleotide affinities: a tight state with high ATP affinity, a loose state with medium affinity, and an open or low affinity state. Assuming that the (αβ)3γ x-ray conformation with its specific bound nucleotides resembles a snapshot during the hydrolysis cycle, one can assign the open state to the empty βE-subunit and the loose and tight states to the two β-subunits in closed conformations (Abrahams et al., 1994). Motivated by this assignment, the large conformational difference between the open and closed β-subunits was generally assumed to be coupled to the different nucleotide occupancies: the substrate-free β-subunit adopts an open conformation, whereas the β-subunit with bound substrate adopts a closed conformation. The transition from the open to the closed conformation was assumed to be driven by nucleotide rebinding to the βE-subunit, which is empty at this stage of the cycle. For the synthesis cycle, the transition from the closed to the open conformation with subsequent nucleotide release was attributed to the rotation of the γ-subunit.
This view received further support from a nucleotide-free (assembled) (αβ)3 subcomplex structure from Bacillus PS3 (Shirakihara et al., 1997), which shows all β-subunits in open conformation. The latter structure seems to rule out the second possibility mentioned above, namely that the different conformations are dictated by the asymmetrical position of the γ-subunit with respect to the β-subunits, which might hinder the βE-subunit from closure as was originally proposed by Abrahams et al. (1994). However, all β-subunits in the recently resolved structure of chloroplast F1-ATPase ((αβ)3γɛ, isolated from natural source), which is also nucleotide-free, adopt a closed conformation (Groth and Pohl, 2001), rendering the above question again undecided.
A recent molecular dynamics simulation study (Böckmann and Grubmüller, 2002; Böckmann, 2002) of the (αβ)3γ-complex of F1 in explicit solvent environment during which the system was driven in synthesis direction, confirmed that the opening of the βTP-subunit with bound ATP is driven by rotation of the γ-subunit by 120°. Interestingly, the closure of the formerly open empty βE-subunit was found to occur spontaneously and fast, without the need for rebinding of phosphate or ADP. These results suggest that the position of the γ-subunit within the (αβ)3-complex forces the empty βE-subunit into the open conformation.
The fact that βE with bound ADP can also close spontaneously might be concluded from a second molecular dynamics study of the F1-ATPase (Ma et al., 2002). However, this considerably shorter simulation was performed in vacuo with a dielectric coefficient of ɛ = 11 also for the solvent region. Therefore, one cannot rule out that artificial forces onto surface charges of the β-subunit, which are typically directed toward the interior of the protein in a vacuum simulation, contributed the observed conformational closure motion in this case.
The question arises whether the observed spontaneous closure motion (Böckmann and Grubmüller, 2002) of the βE-subunit was promoted by specific interactions between the β-subunit and the adjacent α-subunits or by interactions to the γ-subunit. Alternatively, this large-scale motion might be due to internal forces of the β-subunit and thus would rather be comparable to the relaxation or backsnapping of a pre-stressed “spring”. To answer these questions and to complement the results seen for the full (αβ)3γ-complex, we performed multinanosecond molecular dynamics simulations of the isolated β-subunit in both open and closed conformations with different nucleotide occupancies in explicit solvent environment. Additionally, the specific influence of the bound substrates (ADP and Mg2+) on the β-conformations have been studied and will be discussed in this report.
METHODS
As start structures, an open and a closed β-subunit (residues 9–474 of βE and βTP, respectively) were taken from the recently resolved F1-ATPase at 2.4 Å resolution (Gibbons et al., 2000) (PDB-entry 1E79). Four different simulation systems were set up (see Table 1); namely the (closed) βTP-subunit with bound ADP and Mg2+ (simulation AS), the βTP-subunit with Mg2+ (BS), the βTP-subunit with removed substrates (CS), and the (open) βE-subunit without bound substrate (DS).
TABLE 1.
Simulated systems
| System | AS | BS | CS | DS |
|---|---|---|---|---|
| Subunit and substrate | βTP-ADP + Mg2+ | βTP-Mg2+ | βTP | βE |
| Start conformation | C | C | C | O |
| Total number of atoms thereof | 51,438 | 51,446 | 51,441 | 51,588 |
| protein | 4,404 | 4,404 | 4,404 | 4,404 |
| ADP | 32 | 0 | 0 | 0 |
| Mg2+ | 1 | 1 | 0 | 0 |
| water | 46,983 | 47,025 | 47,019 | 47,166 |
| NA+ ions | 18 | 16 | 18 | 18 |
Composition of simulated systems of the isolated β-subunits of the F1-ATPase.
All simulations were performed in a periodic box (11.7 nm × 6.5 nm × 7.1 nm); the β-subunits were each solvated with 15,673–15,722 SPC (Berendsen et al., 1981) water molecules (Fig. 1 D). Polar and aromatic hydrogen atoms were added to the protein and all other hydrogen atoms were treated via compound atoms. To each of the simulation systems, 16–18 Na+ ions were added to compensate for the net negative charge of the β-subunit and the substrates.
All MD simulations were carried out using the GROMACS simulation suite (Lindahl et al., 2001). Application of the LINCS (Hess et al., 1997) and SETTLE (Miyamoto and Kollman, 1992) methods allowed for an integration step size of 2 fs. Electrostatic interactions were calculated with the Particle-Mesh Ewald method (PME) (Darden et al., 1993). The system was coupled to an external temperature bath (Berendsen et al., 1984) of 300 K with a coupling constant of τT = 0.1 ps separately for the protein, the solvent, and added ions. The pressure was kept constant by a weak coupling to a pressure bath (Berendsen et al., 1984) with τp = 1 ps. The GROMACS force field was applied. Each simulation started with an energy minimization using a steepest descent algorithm (20 steps) and was followed by simulations of 100 ps length with harmonic position restraints applied on all protein atoms (force constant 1000 kJ/mol−1nm−2) to allow relaxation of the solvent molecules.
The conformational motions of the four systems were studied by subsequent free dynamics simulations of 12.5 ns length each. Figs. 1 and 4 were prepared with MOLMOL (Koradi et al., 1996), Figs. 6 and 7 with BobScript (Esnouf, 1997), and Raster3D (Merritt and Bacon, 1997).
FIGURE 4.

Conformational changes seen in the simulations AS, BS, CS, and DS. Shown are the used crystal structures (gray) and the final simulation structures (colored, averaged over 100 ps). The color-code shows RMS deviations (large deviations, red; small deviations, green) from the crystal structures after fitting to the N-terminal and nucleotide binding domain (residues 9–363). Substrates of the crystal structure are colored blue, those from the simulations orange. The upper row shows the β-subunits viewed from the adjacent α-subunit, the lower row as viewed from the central γ-subunit.
FIGURE 6.

Domain movements in the β-subunit from simulation (A–C) and crystal structure (D). Shown are overlays of initial (gray) and final structures (colored) of simulation DS (βE, A), of the extreme projections on the first eigenvector of simulation DS (B), of the initial and final structures of simulation CS (βTP without substrate, C) and of the βE- (colored) and βTP subunits (D) from the x-ray structure (Gibbons et al., 2000). The colored arrows indicate the rotation vector for the domain motions necessary to map the initial (gray) structures on the final (colored) conformations. The blue domains are kept fixed and are used for fitting the respective structures on each other. Bending residues are yellow. The black arrow in D points to the hinge region (residues 177–179) for the closure motion (Masaike et al., 2000).
FIGURE 7.

Main domain motions in the simulations described by angles θ (left) and φ (mid) between upper (residues 17–83, 96–103 114–123, 180–191, 211–235, 260–281, 319–323, colored blue) and lower (residues 132–146, 157–167, 243–250, 331–355, 358–426, 434–473, red) domain as a function of simulation time (right). The horizontal dashed lines denote the respective angles from the x-ray β-conformations. The angles θ and φ were determined independently from each other. The dashed lines show the results from the control simulations in a larger water box (see text).
The correlation coefficient ν for the B-factor BS,X of a group of N residues between simulation (index S) and x-ray structure (index X) was calculated as
 |
(1) |
As a measure for the overlap of the conformational subspaces sampled by the simulations and by the x-ray structures of the β-subunit, the normalized overlap σ of the respective covariance matrices M was used,
 |
(2) |
where the indices K and S distinguish between the covariance matrices for the crystal structure (K) and the simulation (S), respectively. This overlap measure is 1 for identical matrices and 0 for orthogonal matrices.
RESULTS AND DISCUSSION
During the free dynamics simulations, the root mean-square deviations (RMSD) of the backbone atoms from the respective initial structures were monitored. During the first 100 ps, each system shows a steep increase in the RMSD (see Fig. 2 and Table 2) to a typical value of 1.5–2 Å. As can be seen, the system that starts from the closed βTP-conformation with bound ADP and Mg2+ (system AS) then remains relatively close to the starting structure at an RMSD value of ∼2.3 Å. Hence, the βTP-conformation is not only stable in the (αβ)3γ-complex, but also as an isolated β-subunit with bound substrate. This can also be seen from the intactness of the secondary structure (data not shown). In contrast, the β-subunit in the simulation of the closed β-subunit without substrate (system CS), and of the empty open βE-subunit, undergo significant conformational transitions (gray and black dashed lines in Fig. 2), as can be seen from the relatively large RMSD values of 3.3 Å and 4.4 Å, respectively. As will be analyzed in more detail below, this increase is caused by a large motion mainly of the C-terminal domain (residues 364–474), which, however, also leaves the secondary structure nearly unchanged (data not shown).
FIGURE 2.

Root mean-square deviation (RMSD) of the backbone atoms from the respective starting structures during the simulations (compare to Tables 1 and 2). Solid lines refer to systems AS (gray) and BS (black), respectively; dotted lines refer to (empty) systems, CS (gray) and DS (black).
TABLE 2.
RMS deviations from x-ray structures
| RMSD [Å] Fitted to conformation
|
||||
|---|---|---|---|---|
| Simulation
|
Subunit
|
O
|
C
|
H-C
|
| AS | βTP | 4.4 | 2.3 | 3.5 |
| BS | βTP | 3.9 | 2.8 | 2.8 |
| CS | βTP | 4.4 | 3.3 | 3.2 |
| DS | βE | 4.4 | 3.6 | 4.4 |
| βTP | 3.6 | 0.0 | 2.9 | |
| βE | 0.0 | 3.6 | 1.8 | |
Root mean square deviations (using backbone atom positions of residues 9–126 and 129–464) of averaged final simulation structures from the three β-x-ray conformations, i.e., open (O), closed (C), and half-closed (H-C). The last two lines give the deviations of the respective x-ray β-conformations from each other.
The atomic fluctuations of the C-terminal region calculated from the final 10 ns of each trajectory (see Methods) correlate convincingly with the crystallographic B-factors (correlation coefficients 0.63–0.71, see Table 3). For the nucleotide binding domain (residues 82–363), much weaker correlations of 0.11–0.31 are seen. Such weak correlation would indeed be expected from the arrangement of the β-subunits within the F1-complex: at the position of the nucleotide binding domain, the β-subunits have maximal contact to the adjacent α-subunits, which are not included within the simulation systems. Interestingly, the best agreement is obtained for the DELSEED region (residues 394–400) and the adjacent helices 1 and 2. Here, the correlation coefficient for the simulations of the βTP-subunit is 0.66–0.71 and even 0.82 for the βE-subunit (Fig. 3). In this C-terminal region, the influence of the neighbored α-subunits is smaller and allows for enlarged mobilities in the crystal structure, comparable to the situation in the simulation. For the crystal βE-subunit, this effect is even enhanced due to the outwards tilt of this region (see Fig. 1 C), which further reduces the influence of the α-subunits. Therefore, the presence or absence of adjacent α-subunits has only little effect on the dynamics of the C-terminal part of the β-subunit.
TABLE 3.
B-factor correlation coefficients to x-ray structure
| Simulation system | ||||
|---|---|---|---|---|
| Domain | AS | BS | CS | DS |
| N-terminal domain | 0.41 | 0.60 | 0.37 | 0.52 |
| β9–81 | (0.18) | (0.41) | (0.20) | (0.35) |
| Nucleotide domain | 0.11 | 0.18 | 0.25 | 0.13 |
| β82–363 | (0.28) | (0.22) | (0.31) | (0.22) |
| C-terminal domain | 0.67 | 0.63 | 0.73 | 0.71 |
| β364–474 | (0.64) | (0.61) | (0.70) | (0.68) |
| Total system | 0.31 | 0.34 | 0.49 | 0.49 |
| β9–474 | (0.38) | (0.39) | (0.50) | (0.49) |
Correlation coefficients between (residue-averaged) B-factors from the crystal structure and calculated B-factors from the last 10 ns of the corresponding free dynamics simulations. Shown are the correlation coefficients to the open βE-subunit and (in parentheses) to the closed βTP-subunit.
FIGURE 3.

Comparison of the B-factors (averaged over atoms of the residues) from the βE (X-E, gray) and βTP (X-T-ADP, dashed gray line) x-ray structures with the B-factors computed from the MD trajectory of the initially open βE-subunit (DS, black solid line). The residue range of the DELSEED sequence is marked through vertical lines. The regular pattern on both sides of the DELSEED region is caused by the predominantly α-helical conformation of these residues.
The superposition of the respective final simulation structures (averaged over 100 ps) with the corresponding x-ray structures (Fig. 4) shows only small changes for the simulation of the closed βTP-subunit with bound ADP and Mg2+ (AS), suggesting that the adjacent α-subunits and the γ-subunit are not essential for the conformational stability of the β-subunit.
For the ADP-depleted closed βTP-subunit (simulations BS and CS), we observe large conformational changes of the lower C-terminal domain (colored red in Fig. 4). These changes are quite similar to each other. The RMSDs of the final simulation structures to the x-ray C-conformation (gray) are 2.8 and 3.3 Å (see Table 2), respectively, i.e., much larger than the deviation of only 1.8 Å between the two final structures.
As can also be seen in Fig. 4 (BS, CS), substrate removal changes especially the orientation of helices 1 and 2 (connected by the DELSEED sequence) with respect to the N-terminal and nucleotide binding domain, such that the C-terminal region bends toward the open conformation by up to 4.4 Å (DELSEED region, after fitting to the N-terminal and nucleotide binding domain). This opening motion is combined with a counterclockwise pivoting of that region (viewed from the membrane side) toward the αTP-subunit as visible in the bottom row of Fig. 4.
The motions of that region in the open βE-subunit (simulation DS) are quite similar, but proceed in reverse direction. Here, the C-terminal region moves the large distance of more than 15 Å toward the closed conformation (top row) and pivots sidewards toward the adjacent αTP-subunit (bottom row). A similar rotation is observed for the short helix H close to the binding pocket.
The angle between helices B and C increases during the simulations BS, CS, and DS. For the simulations of the closed β-subunit with removed substrates (BS and CS), helix B tilts with respect to helix C, in case of the βE-subunit (DS) helix C with respect to helix B. Helix 3 — adjacent to the nucleotide binding domain — exhibits a large flexibility especially for the simulation of the empty βTP-subunit and the open β-subunit. The orientation of the central β-barrel domain remains close to its initial conformation in all simulations.
The conformational changes described above provide further evidence for a fast and spontaneous, nucleotide-independent closure of the open βE-subunit (Böckmann and Grubmüller, 2002) and suggest that, despite the comparatively slow observed turnover rate (Yasuda et al., 2001), the actual conformational transitions, e.g., triggered by substrate removal in the closed βTP-subunit, can proceed at an ns timescale. It is worth re-emphasizing that the latter changes are not just localized within the nucleotide binding region, but propagate further up in the C-terminal domain by 3 nm as visible in the bottom row of Fig. 4. The timing of these motions will be analyzed in more detail further below.
To distinguish between fluctuations of small amplitudes and domain motions of large amplitudes, we determined the essential conformational subspaces (Amadei et al., 1993) sampled in the simulations by diagonalization of the mass-weighted co-variance matrix (using the heavy backbone atoms) for the four simulations. As can be seen in Fig. 5, the largest eigenvalue for the open subunit (simulation DS, black) is significantly larger than the respective values for the three simulations of the closed β-subunit (gray lines). As shown in the cumulative representation (inset), the motion along the corresponding eigenvector accounts for ∼41% of the total motion, which is also larger than for the closed subunit (26% for AS, 19% for BS, and 30% for CS).
FIGURE 5.

Comparison of the fluctuations of the β-subunit. Shown are the eigenvalues of the mass-weighted co-variance analysis for each simulation (DS, black; AS, BS, and CS, dark to light gray) as well as their cumulative contribution to the total conformational change (inset).
The domain motions obtained from the simulations were identified and quantified with the program DynDom (Hayward and Berendsen, 1998; Hayward and Lee, 2002), which allows us to determine protein domains involved in hinge bending motions (Fig. 6). Shown are the domains (red or blue) that are identified as moving relative to each other, the bending residues (residues at the interdomain boundary, colored yellow), and the respective rotation vectors; the color of the arrowhead denotes the particular moving domain (right-hand rule). Comparison of the crystal βE-subunit with the (averaged) final structure of the open βE-subunit obtained from simulation DS reveals a 22.2° rotation of the lower C-terminal domain and parts of the nucleotide binding domain with respect to the head region (Fig. 6 A and Table 4). The rotation vector — referred to as θ-axis in the following — can be decomposed in a component parallel and in a component perpendicular to the γ-subunit in the F1-complex. The former describes a (clockwise) pivoting motion of the C-terminal domain toward the adjacent αTP-subunit in the F1-complex, the latter a large upwards-tilting of the C-terminal domain, i.e., the closure motion. The closure motion is similar to the one described by the rotation vector obtained by comparing the open x-ray β-conformation with the closed one (Fig. 6 D); the rotation vectors differ by an angle of 26°. As can be seen in Fig. 6 B, the first eigenvector of simulation DS describes this large domain motion to nearly full extent; almost the same domains (see Table 4) move with respect to each other and the respective rotation vectors are almost parallel (angle ≈ 5°). Large changes in main-chain dihedral angles (data not shown) were observed for residues 177–179, comparable to those determined from a comparison of open and closed crystal structures. It was previously shown that simultaneous mutation of these hinge residues (position marked by a black arrow in Fig. 6 D) resulted in almost complete loss of ATPase activity (Masaike et al., 2000).
TABLE 4.
Domain motion analysis
| Simulation CS | Simulation DS | Simulation DS, 1. eigenvector | βTP/βE Crystal structure | |
|---|---|---|---|---|
| Fixed domain | 17–85, 89–125, 179–242, 251–255, 260–281, 298–303, 319–323 | 10–83, 96–103, 114–123, 126–128, 147–156, 168–178, 180–191, 211–235, 253–295, 306–330, 356–357, 427–433 | 11–82, 154–156, 169–171, 175–190, 216–232, 254–296, 307–317 | 10–132, 173–330 |
| Moving domain | 86–88, 132–177, 243–250, 256–257, 295–297, 304–313, 324–473 | 84–95, 104–113, 124–125, 129–146, 157–167, 178, 192–210, 236–252, 296–305, 331–355, 358–426, 434–473 | 128–153, 156–168, 172–174, 191–206, 233–253, 297–306, 331–472 | 133–172, 331–473 |
| Bending residues | 85, 86, 88, 89, 125–132, 177–179, 242, 243, 250, 251, 255–260, 281–295, 297, 298, 303, 304, 313–319, 323, 324 | 83–84, 95–96, 103–110, 113–114, 123–129, 146–147, 156–161, 167–168, 176–180, 191–192, 210–214, 235–236, 252–253, 295–296, 305–306, 330–331, 335–358, 426–430, 433–434 | 82–128, 153–156, 168–169, 171–172, 174–175, 190–191, 206–216, 232–233, 253–254, 296–297, 306–307, 317–331 | 132–133, 172–179, 330–331 |
| Angle of rotation | 17.9° | 22.2° | 26.7° | 26.2° |
| %/Closure motion | 87.1 | 54.2 | 40.2 | 66.5 |
Domain analysis of the substrate-free βTP simulation (CS), of the βE simulation (DS), and comparison with the crystal structure domain analysis between open and closed conformations. In the case of the simulations, start structure and averaged final simulation structure were considered. Additionally, the fourth column gives the respective domain analysis for the extreme projections of the trajectory (simulation DS) on the first eigenvector of the covariance matrix.
The rotation vector for the domain motions in simulation CS (βTP without substrate, Fig. 6 C) includes an angle of 69° to the one described before for the βE-subunit. It intersects the central β-sheet at the β7-strand. As already analyzed above, the rotation around this vector—referred to as φ-axis in the following—describes a pivoting by ∼18° of the lower C-terminal domain (counterclockwise). Here, the fixed (blue) and the moving domain (red) meet at the nucleotide binding pocket. The assignment of these domains (see Table 4) differs from that for the simulation of the βE-subunit in that helix B — and not helix C, as in simulation DS — tilts simultaneously with the C-terminal domain.
Fig. 7 (right panel) shows how the motions of the C-terminal domain proceed as a function of time, as described by the two angles that are defined by the two axes θ and φ (Fig. 7, left), and compares it to those obtained from the respective x-ray structures. As can be seen, the ADP/Mg2+-loaded βTP-subunit (AS) remains close to the initial conformation, whereas the open βE-subunit reaches the closed conformation (θ = 17.8°) within 2 ns (DS). Interestingly, the substrate-free βTP-subunit (CS) approaches the recently resolved half-closed βADP+Pi-conformation (φ = 15.6°) also within 2 ns. The βTP-subunit with removed ADP (BS) takes an intermediate position with respect to the φ-angle, which may be due to a slower conformational transition that cannot be observed on the simulated timescale. The fact that the spontaneous conformational transitions of the isolated β-subunits occur on very similar timescales as those seen for the closure motion observed in the simulation of the (αβ)3γ-complex (Böckmann and Grubmüller, 2002) suggests that the main driving force for the closure is internal to the β-subunit, and not exerted from the adjacent α-subunits.
Note that the observed conformational motions might be affected by artificial interactions with the respective periodic images of the simulation box. To check for such possible artifacts, we have carried out four further simulations with different starting conditions: three of the open βE-subunit (8, 11, and 14 ns long, using differing initial velocities) and one of the closed βTP-subunit with removed substrate (14 ns length). These simulations were carried out with an enlarged water box (>71,000 atoms); the periodic images are ∼2.6 ± 0.2 nm apart from each other versus 1.8 ± 0.3 nm for simulations AS–DS. Also the three control simulations of the βE-subunit display spontaneous closure motions (dashed lines in Fig. 7). One of them (thick dashed line) reaches a closure angle θ similar to the one seen in simulation DS or in the closed x-ray conformation; the other two remain at a somewhat smaller angle (θ ≈ 12°) during the simulation time. For the βTP control simulation, similar pivoting motions are seen as for simulation CS. These results indicate that the closure and pivoting motions are not just accidental, but mostly reproducible at the simulated timescale.
Table 5 quantifies to what extent the conformational transitions seen in the simulations resemble those derived from the x-ray structures (open, closed, and half-closed, respectively) by listing the scalar products (absolute values) of the first eigenvector ( ) of the respective simulation with the difference vectors connecting the particular crystal structures in 3N-dimensional space (N the number of backbone atoms). Such analysis primarily focuses at the similarity of the main conformational motions (in this case, the closure motion) rather than putting equal weight to all fluctuations, as would be the case for RMSD values. Again, in simulation DS, the open conformation exhibits a large movement in the directions connecting the β x-ray conformations, as can be seen from the large scalar products of 0.367 and 0.373 between the (normalized) first eigenvector of the βE-simulation with the one connecting the closed with the open x-ray conformation and the half-closed x-ray conformation, respectively. To judge this number, note that the scalar product between uncorrelated motions follows a Gaussian distribution of 0.015 half-width. Such large overlap (0.289) is also seen for the projection of simulation CS (βTP-subunit with removed substrate) on the vector connecting the closed with the half-closed conformation. Similarly, large values for the normalized overlap σ (see Methods) between the covariance matrices of simulations and crystal structures are seen for simulations CS and DS.
TABLE 5.
Projection of simulation on x-ray structure
| Simulation system |  |
 |
σC-O | σC-H |
|---|---|---|---|---|
| AS | 0.093 | 0.005 | 0.028 | 0.002 |
| BS | 0.044 | 0.040 | 0.012 | 0.012 |
| CS | 0.172 | 0.289 | 0.056 | 0.111 |
| DS | 0.367 | 0.373 | 0.152 | 0.176 |
Scalar product (absolute values) of the first eigenvector  of simulations AS, BS, CS, and DS, respectively, with the difference vectors connecting the particular crystal structures in 3N-dimensional space (N is the number of backbone atoms). Here, we considered the vectors connecting the closed β-conformation (PDB entry 1E79) with the open
  and with the half-closed β-crystal structure
  . The last two columns show the normalized overlap of the covariance matrix from the simulations with the particular difference vector (σC-O and σC-H).
Fig. 8 provides a graphical overview by projecting the four simulation trajectories onto the two-dimensional subspace defined by the three different x-ray conformations of the β-subunit. As can be seen, the conformation of the open βE-subunit (simulation DS, red) approaches the closed x-ray conformation even up to 80%. Additionally, the conformational transitions triggered by removal of the substrate from the closed βTP-subunit approach the half-closed conformation to a significant extent (simulations BS and CS, green and blue curves, respectively). This result underscores the strong influence of both ADP and Mg2+ on the conformation of the β-subunits.
FIGURE 8.

Projection of simulation trajectories (colored lines) onto the subspace spanned by the x-ray structures of the closed, open, and half-closed β-conformations (diamonds). The respective projections of the control simulations are shown as dashed lines; colored light blue for the βTP-subunit without substrate and in light red colors in case of the three βE control simulations.
Although both systems, CS and DS, are identical in that they lack any substrate, they adopt different conformations during the simulations, because they start from different structures (closed/open, respectively). Both adopt a closed-like conformation in that their C-terminal domains are bent upwards toward the N-terminal headgroups but differ in the pivoting φ-angle by >30°. We suggest that there exists an energy barrier located between these two states that prohibits completion of the conformational motion within the simulation timescale, and which is overcome upon substrate binding to the empty βE-subunit or, in the F1-complex, lowered by interactions to the adjacent α-subunits. This view is supported by the observation that the tilt angle between the helices B and C near the binding pocket is increased from 45° to 67° in the simulation of the empty βE-subunit, rather than decreased as one would expect from comparison to the closed conformation (tilt angle 25°). Remarkably, for the closed β-subunit without substrate (simulation CS), this angle is increased to 34°, exactly the value found for the crystal half-closed conformation (Menz et al., 2001). In this context, it will be interesting to see if the closure motion of the βE-subunit is indeed completed upon re-insertion of substrate into the binding pocket. However, such study is outside the scope of this report.
SUMMARY AND CONCLUSIONS
Four multinanosecond simulations of the isolated β-subunit of the F1-ATPase have been carried out, starting from both the open conformation (βE) and the closed conformation (βTP), with bound ADP and Mg2+ (as found in the x-ray structure of the F1-complex), with Mg2+ only, and without substrate.
Unperturbed by any bias or steering, the open βE-subunit underwent a large spontaneous conformational change toward the closed crystal β-conformation. In particular, the C-terminal domain bent toward the N-terminal domain by >20° within ns. This fast and spontaneous closure motion is similar to the one induced by rotation of the γ-subunit in simulations of the full (αβ)3γ-complex (Böckmann and Grubmüller, 2002). This supports the view that the empty open βE-subunit adopts a conformation in the F1-complex that resembles a prestressed “spring,” quite in contrast to the common assumption, which attributes the observed differences in the β-conformations rather to the different nucleotide occupancies. The similar kinetics found for both the isolated βE-subunit and the full complex suggest that the internal tension of the βE-subunit dominates possible forces originating from interactions with adjacent α-subunits or the γ-stalk.
We note that our use of the notion of a prestressed “spring” does not imply that the underlying potential of mean force is necessarily harmonic — most likely it is not. Rather, this term implies only that the free energy of the closed conformation is lower than that of the open one.
In recent fluorescence experiments it was found that the F1-ATPase changes its conformation upon phosphate release (Masaike et al., 2002). In our simulations, removal of ADP and Mg2+ from the binding pocket of the closed βTP-subunit triggered a spontaneous sidewards pivoting motion of the βTP-subunit, which does not occur with the substrates in place. Also, this motion proceeded spontaneously within ns. Notably, removal of ADP and Mg2+ from the closed βTP-subunit led to slightly larger conformational changes as compared to those seen upon removal of ADP only. The obtained structure resembles the newly resolved half-closed crystal βADP+Pi conformation and thus supports the interpretation (Menz et al., 2001) that the βADP+Pi conformation is an intermediate state shortly before product release.
Our simulations reveal spontaneous or substrate-dependent conformational motions. Both have implications for the transmission of torque (Menz et al., 2001) in the F1Fo-ATP synthase. Considering the three β-subunits as mechanical devices in the FoF1-ATP synthase for the synthesis direction, the spontaneous back-snapping of the lower C-terminal domain of the empty βE-subunit will likely support the clockwise rotation of the γ-subunit (seen from the membrane). We therefore suggest that the reset, which is required to start the next cycle, consists of the sidewards pivoting motion, described here by a change in the φ-angle, and is triggered by binding of new substrate (ADP and Pi) to this subunit. For the reverse hydrolysis cycle, this pivoting motion is suggested to be the crucial step during the “power stroke” that drives γ-rotation after binding of ATP to the empty β-subunit. In this direction, the reset is achieved through the spontaneous closure of the βE-subunit.
These findings also have implications for the binding change mechanism, which deserve further studies. In particular, our model for the synthesis considers both the γ-rotation induced by the Fo-unit and the active support of this rotation by tilting and pivoting of the β-subunits and thereby can explain why ADP and Pi are required for the release of bound ATP (Hackney and Boyer, 1978) and why an electrochemical gradient alone is not sufficient to promote subunit rotation (Zhou et al., 1997). Additionally, in the hydrolysis direction, the mechanical coupling between the γ-enforced opening of a closed β-subunit and vice versa, the β-supported γ-rotation, might explain the drastically reduced hydrolysis rate of γ-depleted (αβ)3 (Miwa and Yoshida, 1989). The fast spontaneous closure of the substrate-free βE-subunit — and thus the short lifetime of the open conformation — offers a simple explanation for the observed occupation of all three catalytic sites under maximum turnover conditions in tryptophane fluorescence studies (Weber et al., 1993), although the empty site shows very low affinity. Presumably, the intermediate closed-like conformation of the βE-subunit seen in the simulations has an enlarged ATP affinity with respect to the open conformation and thus ensures, together with the fast conformational transition, fast rebinding of the substrate.
Acknowledgments
We thank B. de Groot and G. Schröder for stimulating discussions and for carefully reading the manuscript, and B. de Groot for help with the GROMACS program package.
Computer time was provided by the Göttingen computer center, GWDG.
Helmut Grubmüller's present address is Institute of Biomolecular Sciences, Faculty for Basic Sciences, Ecole Polytechnique Federale de Lausanne, CH-1015 Lausanne, Switzerland.
References
- Abrahams, J. P., S. K. Buchanan, M. J. van Raaij, I. M. Fearnley, A. G. W. Leslie, and J. E. Walker. 1996. The structure of bovine F1-ATPase complexed with the peptide antibiotic efrapeptin. Proc. Natl. Acad. Sci. USA. 93:9420–9424. [DOI] [PMC free article] [PubMed] [Google Scholar]
- Abrahams, J. P., A. G. W. Leslie, R. Lutter, and J. E. Walker. 1994. Structure at 2.8 Å resolution of F1-ATPase from bovine heart mitochondria. Nature. 370:621–628. [DOI] [PubMed] [Google Scholar]
- Allison, W. S. 1998. F1-ATPase: A molecular motor that hydrolyzes ATP with sequential opening and closing of catalytic sites coupled to rotation of its γ-subunit. Acc. Chem. Res. 31:819–826. [Google Scholar]
- Amadei, A., A. B. M. Linssen, and H. J. C. Berendsen. 1993. Essential dynamics of proteins. Proteins. 17:412–425. [DOI] [PubMed] [Google Scholar]
- Berendsen, H. J. C., J. P. M. Postma, W. F. Van Gunsteren, and J. Hermans. 1981. Interaction Model for Water in Relation to Protein Hydration. D. Reidel Publishing Company, Dordrecht, The Netherlands. pp.331–342.
- Berendsen, H. J. C., J. P. M. Postma, W. F. van Gunsteren, A. D. Nola, and J. R. Haak. 1984. Molecular dynamics with coupling to an external bath. J. Chem. Phys. 81:3684–3690. [Google Scholar]
- Böckmann, R. A. 2002. Molekulare Dynamik von Proteinen: Von der α-Helix zur ATP Synthase. Cuvillier Verlag, Göttingen. (PhD thesis.)
- Böckmann, R. A., and H. Grubmüller. 2002. Nanoseconds molecular dynamics simulation of primary mechanical energy transfer steps in F1-ATP synthase. Nat. Struct. Biol. 9:198–202. [DOI] [PubMed] [Google Scholar]
- Boyer, P. D. 1981. Energy Coupling in Photosynthesis. Elsevier, Amsterdam, The Netherlands. pp.231–240.
- Braig, K., R. Menz, M. Montgomery, A. Leslie, and J. Walker. 2000. Structure of bovine mitochondrial F1-ATPase inhibited by Mg2+ ADP and aluminum fluoride. Struct. Fold. Des. 8:567–573. [DOI] [PubMed] [Google Scholar]
- Cross, R. L. 1981. The mechanism and regulation of ATP synthesis by F1-ATPases. Annu. Rev. Biochem. 50:681–714. [DOI] [PubMed] [Google Scholar]
- Darden, T., D. York, and L. Pedersen. 1993. Particle-Mesh Ewald—an Nlog(N) method for Ewald sums in large systems. J. Chem. Phys. 98:10089–10092. [Google Scholar]
- Duncan, T. M., V. V. Bulygin, Y. Zhou, M. L. Hutcheon, and R. L. Cross. 1995. Rotation of subunits during catalysis by Escherichia coli F1-ATPase. Proc. Natl. Acad. Sci. USA. 92:10964–10968. [DOI] [PMC free article] [PubMed] [Google Scholar]
- Engelbrecht, S., and W. Junge. 1997. ATP synthase: a tentative structural model. FEBS Lett. 414:485–491. [DOI] [PubMed] [Google Scholar]
- Esnouf, R. M. 1997. An extensively modified version of MOLSCRIPT that includes greatly enhanced coloring capabilities. J. Mol. Graph. Model. 15:132–134. [DOI] [PubMed] [Google Scholar]
- Gibbons, C., M. G. Montgomery, A. G. W. Leslie, and J. E. Walker. 2000. The structure of the central stalk in bovine F1-ATPase at 2.4 Å resolution. Nat. Struct. Biol. 7:1055–1061. [DOI] [PubMed] [Google Scholar]
- Groth, G., and E. Pohl. 2001. The structure of the chloroplast F1-ATPase at 3.2 Å resolution. J. Biol. Chem. 276:1345–1352. [DOI] [PubMed] [Google Scholar]
- Hackney, D. D., and P. D. Boyer. 1978. Subunit interaction during catalysis—implications of concentration dependency of oxygen exchanges accompanying oxidative-phosphorylation for alternating site cooperativity. J. Biol. Chem. 253:3164–3170. [PubMed] [Google Scholar]
- Hayward, S., and H. J. C. Berendsen. 1998. Systematic analysis of domain motions in proteins from conformational change: new results on citrate synthase and T4 lysozyme. Proteins. 30:144–154. [PubMed] [Google Scholar]
- Hayward, S., and R. A. Lee. 2002. Improvements in the analysis of domain motions in proteins from conformational change: DynDom version 1.50. J. Mol. Graph. 21:181–183. [DOI] [PubMed] [Google Scholar]
- Hess, B., H. Bekker, H. J. C. Berendsen, and J. G. E. M. Fraaije. 1997. LINCS: a linear constraint solver for molecular simulations. J. Comp. Chem. 18:1463–1472. [Google Scholar]
- Junge, W., H. Lill, and S. Engelbrecht. 1997. ATP synthase: an electrochemical transducer with rotatory mechanics. TIBS. 22:420–423. [DOI] [PubMed] [Google Scholar]
- Koradi, R., M. Billeter, and K. Wüthrich. 1996. MOLMOL: a program for display and analysis of macromolecular structures. J. Mol. Graph. 14:51–55. [DOI] [PubMed] [Google Scholar]
- Lindahl, E., B. Hess, and D. van der Spoel. 2001. GROMACS 3.0: a package for molecular simulation and trajectory analysis. J. Mol. Model. 7:306–317. [Google Scholar]
- Ma, J., T. C. Flynn, Q. Cui, A. G. W. Leslie, J. E. Walker, and M. Karplus. 2002. A dynamic analysis of the rotation mechanism for conformational change in F1-ATPase. Structure. 10:921–931. [DOI] [PubMed] [Google Scholar]
- Masaike, T., N. Mitome, H. Noji, E. M. R. Yasuda, K. Kinosita, and M. Yoshida. 2000. Rotation of F1-ATPase and the hinge residues of the β-subunit. J. Exp. Biol. 203:1–8. [DOI] [PubMed] [Google Scholar]
- Masaike, T., E. Muneyuki, H. Noji, K. Kinosita, and M. Yoshida. 2002. F1-ATPase changes its conformation upon phosphate release. J. Biol. Chem. 277:21643–21649. [DOI] [PubMed] [Google Scholar]
- Menz, R. I., J. E. Walker, and A. G. W. Leslie. 2001. Structure of bovine mitochondrial F1-ATPase with nucleotide bound to all three catalytic sites: implications for the mechanism of rotary catalysis. Cell. 106:331–341. [DOI] [PubMed] [Google Scholar]
- Merritt, E. A., and D. J. Bacon. 1997. RASTER 3D: photorealistic molecular graphics. Methods Enzymol. 277:505–524. [DOI] [PubMed] [Google Scholar]
- Miwa, K., and M. Yoshida. 1989. The α3 β3 complex, the catalytic core of F1-ATPase. Proc. Natl. Acad. Sci. USA. 86:6484–6487. [DOI] [PMC free article] [PubMed] [Google Scholar]
- Miyamoto, S., and P. A. Kollman. 1992. SETTLE—an analytical version of the SHAKE and RATTLE algorithm for rigid water models. J. Comp. Chem. 13:952–962. [Google Scholar]
- Noji, H., R. Yasuda, M. Yoshida, and K. Kinosita. 1997. Direct observation of the rotation of F1-ATPase. Nature. 386:299–302. [DOI] [PubMed] [Google Scholar]
- Orriss, G., A. Leslie, K. Braig, and J. Walker. 1998. Bovine F1-ATPase covalently inhibited with 4-chloro-7-nitrobenzofurazan: the structure provides further support for a rotary catalytic mechanism. Structure. 6:831–837. [DOI] [PubMed] [Google Scholar]
- Oster, G., and H. Y. Wang. 2000. Why is the mechanical efficiency of F1-ATPase so high? J. Bioenerg. Biomem. 32:459–469. [DOI] [PubMed] [Google Scholar]
- Pänke, O., K. Gumbiowski, W. Junge, and S. Engelbrecht. 2000. F-ATPase: specific observation of the rotating c subunit oligomer of EFoEF1. FEBS Lett. 472:34–38. [DOI] [PubMed] [Google Scholar]
- Sabbert, D., S. Engelbrecht, and W. Junge. 1996. Intersubunit rotation in active F-ATPase. Nature. 381:623–625. [DOI] [PubMed] [Google Scholar]
- Sambongi, Y., Y. Iko, M. Tanabe, H. Omote, A. I.-K. I. Ueda, T. Yanagida, Y. Wada, and M. Futai. 1999. Mechanical rotation of the c subunit oligomer in ATP synthase (FoF1): direct observation. Science. 286:1722–1724. [DOI] [PubMed] [Google Scholar]
- Seelert, H., A. Poetsch, N. A. Dencher, A. Engel, H. Stahlberg, and D. J. Müller. 2000. Structural biology—proton-powered turbine of a plant motor. Nature. 405:418–419. [DOI] [PubMed] [Google Scholar]
- Shirakihara, Y., A. G. W. Leslie, J. P. Abrahams, J. E. Walker, T. Ueda, Y. Sekimoto, M. Kambara, K. Saika, Y. Kagawa, and M. Yoshida. 1997. The crystal structure of the nucleotide-free α3β3 subcomplex of F1-ATPase from the thermophilic Bacillus PS3 is a symmetric trimer. Structure. 5:825–836. [DOI] [PubMed] [Google Scholar]
- Stahlberg, H., D. J. Müller, K. Suda, D. Fotiadis, A. Engel, T. Meier, U. Matthey, and P. Dimroth. 2001. Bacterial Na+-ATP synthase has an undecameric rotor. EMBO Rep. 2:229–233. [DOI] [PMC free article] [PubMed] [Google Scholar]
- Stock, D., A. G. W. Leslie, and J. E. Walker. 1999. Molecular architecture of the rotary motor in ATP synthase. Science. 286:1700–1705. [DOI] [PubMed] [Google Scholar]
- van Raaij, M., J. P. Abrahams, A. G. W. Leslie, and J. E. Walker. 1996. The structure of bovine F1-ATPase complexed with the antibiotic inhibitor aurovertin B. Proc. Natl. Acad. Sci. USA. 93:6913–6917. [DOI] [PMC free article] [PubMed] [Google Scholar]
- Wang, H., and G. Oster. 1998. Energy transduction in the F1 motor of ATP synthase. Nature. 396:279–282. [DOI] [PubMed] [Google Scholar]
- Weber, J., S. Wilke-Mounts, R. S. F. Lee, E. Grell, and A. E. Senior. 1993. Specific placement of tryptophan in the catalytic sites of Escherichia coli F1-ATPase provides a direct probe of nucleotide-binding—maximal ATP hydrolysis occurs with three sites occupied. J. Biol. Chem. 268:20126–20133. [PubMed] [Google Scholar]
- Yasuda, R., H. Noji, K. Kinosita, and M. Yoshida. 1998. F1-ATPase is a highly efficient molecular motor that rotates with discrete 120° steps. Cell. 93:1117–1124. [DOI] [PubMed] [Google Scholar]
- Yasuda, R., H. Noji, M. Yoshida, K. Kinosita, and H. Itoh. 2001. Resolution of distinct rotational substeps by submillisecond kinetic analysis of F1-ATPase. Nature. 410:898–904. [DOI] [PubMed] [Google Scholar]
- Zhou, Y. T., T. M. Duncan, and R. L. Cross. 1997. Subunit rotation in Escherichia coli FoF1-ATP synthase during oxidative phosphorylation. Proc. Natl. Acad. Sci. USA. 94:10583–10587. [DOI] [PMC free article] [PubMed] [Google Scholar]