

Abstract
Electrostatic interactions govern structural and dynamical properties of membranes and can vary considerably with the composition of the aqueous buffer. We studied the influence of sodium chloride on a pure POPC lipid bilayer by fluorescence correlation spectroscopy experiments and molecular dynamics simulations. Increasing sodium chloride concentration was found to decrease the self-diffusion of POPC lipids within the bilayer. Self-diffusion coefficients calculated from the 100 ns simulations agree with those measured on a millisecond timescale, suggesting that most of the relaxation processes relevant for lipid diffusion are faster than the simulation timescale. As the dominant effect, the molecular dynamics simulations revealed a tight binding of sodium ions to the carbonyl oxygens of on average three lipids leading to larger complexes with reduced mobility. Additionally, the bilayer thickens by ∼2 Å, which increases the order parameter of the fatty acyl chains. Sodium binding alters the electrostatic potential, which is largely compensated by a changed polarization of the aqueous medium and a lipid dipole reorientation.
INTRODUCTION
Biological membranes consist predominantly of lipids and proteins in mass ratios ranging from 0.25 (purple membranes of halobacteria) to 4 (lung surfactant). In most membranes the lipids are the predominant molecular species. Membrane lipids are very heterogeneous in chain length, chain saturation, and headgroup structure. In most biomembranes only ∼10% of the lipids are charged, whereas the remaining lipid fraction is zwitterionic or uncharged, consisting in particular of phosphatidylethanolamines and phosphatidylcholines (POPC). The latter represent ∼50% of all headgroups (Neidlemann, 1993; Sackmann, 1995).
Biological membranes are surrounded by an aqueous buffer containing Na+, K+, Ca2+, Mg2+, or Cl− ions with quite different concentrations inside and outside of the cell. Electrostatic interactions between this ionic buffer and the lipid molecules are crucial for membrane fusion, phase transitions, or transport across the membrane. Divalent cations are known to interact very strongly with charged lipids, but also moderately with zwitterionic lipids (Tatulian, 1993). Despite their ubiquity, knowledge about the interaction of monovalent ions with lipids is less detailed. These interactions are generally assumed to be quite weak. E.g., the dissociation constants of Na+ and Cl− from POPC membranes (Tatulian, 1993) are close to the physiological range of 100–500 mM. In a recent study it was reported that moderate NaCl concentrations induce phase separation in POPC membranes as evidenced in x-ray crystallography (Rappolt et al., 2001). This finding is of quite some relevance, since it indicates that monovalent ions affect the lateral organization of artificial and most likely that of biological membranes.
The interaction of sodium with neutral zwitterionic membranes is the subject of this article. Changes in membrane electrostatics, lateral heterogeneities, and binding of solutes influence the lipid self-diffusion. Therefore, the diffusion coefficients contain information about the membrane state. Some of the various methods to study diffusion characteristics of membranes are fluorescence recovery after photobleaching (Axelrod et al., 1976; Blume, 1993; Almeida and Vaz, 1995), fluorescence correlation spectroscopy (FCS) (Magde et al., 1972; Ehrenberg and Rigler, 1974; Korlach et al., 1999; Schwille et al., 1999; Feigenson and Buboltz, 2001; Hess et al., 2002), single particle tracking (Lee et al., 1991; Schmidt et al., 1996; Schütz et al., 1997; Fujiwara et al., 2002), nuclear magnetic resonance (Fisher, 1978; Kuo and Wade, 1999), and electron spin resonance techniques (King et al., 1987), but also neutron diffraction (Tabony and Perly, 1990; König et al., 1992). Since these techniques are sensitive on different timescales, numerical values for diffusion coefficients vary considerably. Typical values for the diffusion coefficient in fluid lipid membranes of  cm2/s were derived from macroscopic measurements (fluorescence recovery after photobleaching and FCS) on the millisecond timescale, whereas neutron scattering experiments (picosecond timescale) yield values of
  cm2/s to
  cm2/s (Tabony and Perly, 1990; König et al., 1992). The difference in these values originates from different modes of diffusion. On short timescales the diffusion is generally assumed to be dominated by confined motion in a local free volume defined by nearest neighbor lipids, whereas diffusion on the millisecond timescale rather resembles Brownian motion in a viscous fluid (Vaz and Almeida, 1991).
Since the work of van der Ploeg and Berendsen (1982), molecular dynamics (MD) simulations yielded an increasing amount of information on the structure and the dynamics of uncharged membranes in the absence of ions (Heller et al., 1993; Venable et al., 1993; Tieleman et al., 1997; Essmann and Berkowitz, 1999; Moore et al., 2001) and on bilayers with purely negatively charged lipids, with a high concentration of positive ions to counterbalance the charges (Cascales and de la Torre, 1997; Pandit and Berkowitz, 2002). Due to the slow relaxation times associated with ion and lipid diffusion, MD studies of the interaction of ions with lipids close to equilibrium require very long trajectories and an accurate description of the electrostatics (Patra et al., 2003); therefore, a precise computation of self-diffusion coefficients of lipid bilayers in salt solutions has up to now not been possible.
Here, we present a combined effort using both FCS techniques and extended MD simulations to study the influence of sodium chloride on structure and dynamics of a neutral lipid bilayer. It is this combination of experiment and theory that provides a new and detailed picture of the specific interaction between sodium ions and zwitterionic lipid molecules.
METHODS
Materials and fluorescence correlation spectroscopy
Lipids were purchased from Avanti Polar Lipids (Birmingham, AL), and fluorescence labels from Molecular Probes (Leiden, The Netherlands). Oriented multilamellar POPC membranes were created by drying the lipid on a quartz coverslip from a dichloromethane/methanol solution in a high vacuum desiccator. The dry samples were then hydrated with distilled water containing suitable NaCl concentrations and equilibrated for at least 1 h.
Subsequently the diffusion processes in the membranes were investigated by fluorescence correlation spectroscopy. In our FCS setup we used a linearly polarized continuous wave 532 nm Nd:Yag laser (Laser 2000, Wessling, Germany) and suitable filters to attenuate the laser power of 5 mW. We used a 1.20 NA 60× water immersion objective (Olympus; UPLAPO) and a confocal setup with a 100-μm pinhole. The probe was mounted on an optical table equipment with a piezoelectric nanopositioning XYZ-system. The fluorescence signal was detected by two SPCM-AQR-13 avalanche photo diodes (Laser Components, Olching, Germany) with perpendicular polarization. The correlation curves shown in this article are cross-correlation curves between these two channels. Fluorescence markers at two different positions were used, TRITC-DHPE (Fig. 1, top left, N-(6-tetramethylrhodaminethiocarbamoyl)-1,2-dihexadecanoyl-sn-glycero-3-phosphoethanolamine) and BODIPY-C12-DHPE (Fig. 1, top right, 2-(4,4-difluoro-5,7-diphenyl-4-bora-3a, 4a-diaza-s-indacene-3-dodecanoyl)-1-hexadecanoyl-sn-glycero-3-phosphoethanolamine). We investigated the influence of various NaCl concentrations on the lateral diffusion of individual lipids in the fluid phase (Tm = 269.75 K). Timescales were calibrated with a Rhodamine 6G solution at 296 K with a known diffusion coefficient of  cm2/s. The signal from the two APDs was analyzed using a FLEX5000/fast correlator card by Correlator.com (Bridgewater, NJ). Assuming a Gaussian cross section of the focus, the correlation function in a planar system is given by
 |
(1) |
where N is the mean number and τd is the dwell time of the labeled lipids in the focus (Korlach et al., 1999). The term in parentheses is used as normalized correlation function. Temperature control was achieved via water cooling of the objective and the sample cell. During the experiment (2–5 min) the water cooling was switched off to avoid mechanical vibrations. The temperature was measured with an ultra-thin thermocouple directly on the coverslip.
FIGURE 1.
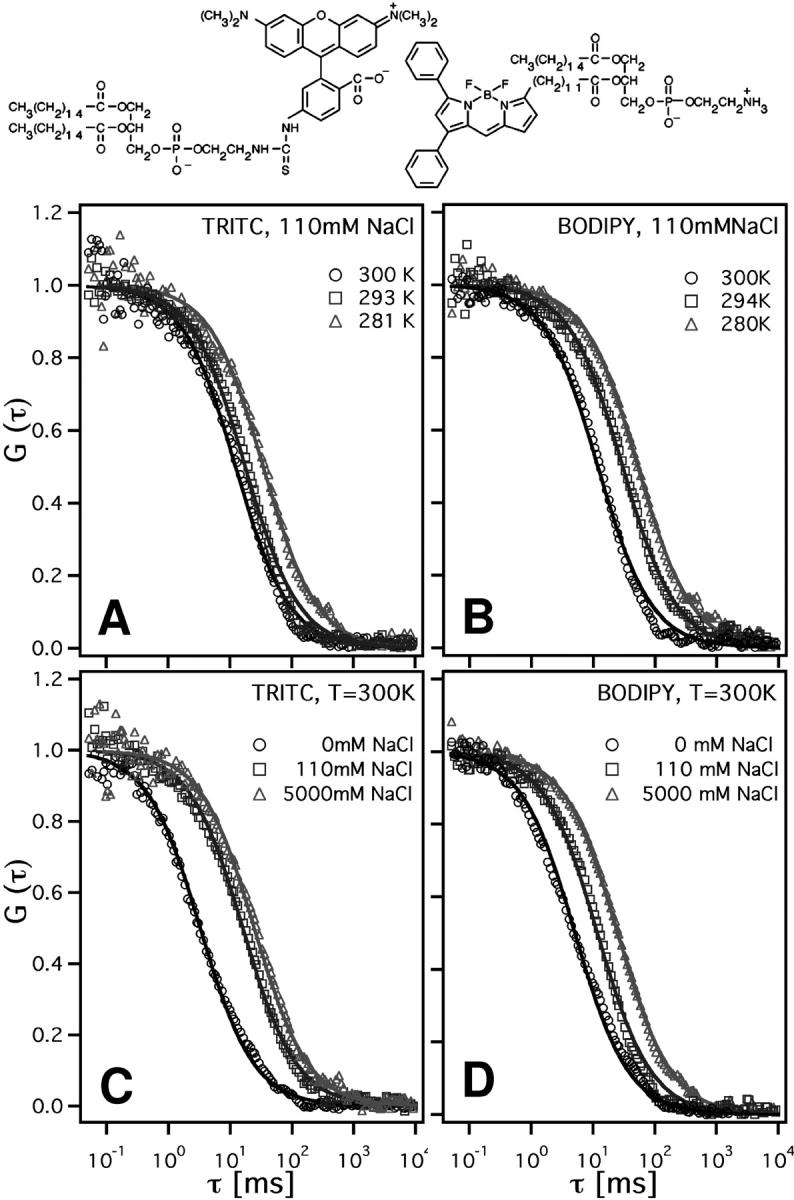
Normalized cross-correlation profiles, (1 + τ/τd)−1, of planar POPC bilayers, using fluorescence markers with labels in the headgroup region (TRITC-DHPE) and in the chain region (Bodipy-C12-HPE). Label structures are given in the top row. Cross correlations at three different temperatures using (A) TRITC-DHPE and (B) BODIPY-C12-HPE, and as a function of NaCl concentration, (C) TRITC-DHPE and (D) BODIPY-C12-HPE.
Calorimetry
Calorimetry was performed using a high sensitivity differential VP-calorimeter (MicroCal, Northampton, MA) with scan rates of 5°/h. Samples were measured in a capillary that was inserted into a glycerol solution to prevent freezing of the aqueous calorimeter cell content.
Molecular dynamics simulations
A bilayer system with 128 POPC lipids was studied. A preequilibrated POPC bilayer (kindly provided by Peter Tieleman (Tieleman et al., 1999)) was used as a start structure. Force-field parameters for the lipids were taken from Berger et al. (1997), and parameters for the unsaturated carbons from the GROMOS87 force field. All simulations were performed in a periodic box filled with 4,800–5,150 SPC (Berendsen et al., 1981) water molecules corresponding to a hydration level of 37–40 waters/lipid, yielding a total system size of >21,000 atoms (Fig. 5 A). Three simulations of more than 100 ns each were carried out (listed in Table 1). The first simulation system (AS) contained lipids and water molecules only; the second (BS) contained additional 10 Na+ and 10 Cl− ions corresponding to an effective concentration of 50 ± 30 mM (calculated further below); and a third, 30 Na+ and 30 Cl− ions (CS), 220 ± 30 mM.
FIGURE 5.

(A) Simulation system (128 POPC lipids; carbon tails, gray; water, light blue; Na+, red; Cl−, green; and hydrophilic headgroups, yellow). (B) Density profiles across the lipid bilayer for simulation CS. Shown are the profiles for POPC ( black), phosphate (purple), water (blue), Na+ ions (red), and Cl− ions (green). Standard deviations are shown in light gray. (C) Radial distribution functions (logarithmic scale) between lipid-bound sodium ions and either lipid carbonyl oxygen atoms (red) or water oxygen atoms (blue). The inset shows the cumulative radial distributions that denote the number of respective oxygen atoms within a sphere of given radius around the sodium. (D) Typical coordination (snapshot) of a bound sodium ion (yellow) by three POPC lipids and two water molecules.
TABLE 1.
Simulated lipid bilayer systems
| System | NaCl No. | [NaCl] | Sim. time [ns] | A/L [nm2] |
|---|---|---|---|---|
| AS | 0 | 0 | 120 | 0.655 ± 0.011 |
| BS | 10 | 50 ± 30 | 140 | 0.625 ± 0.011 |
| CS | 30 | 220 ± 30 | 100 | 0.606 ± 0.009 |
Lipid bilayers with 0, 10, and 30 Na+ and Cl− ions were simulated. Additionally given are the effective NaCl concentration [NaCl]*, the simulation time, and the computed area per lipid (A/L).
All MD simulations were carried out using the GROMACS simulation suite (Lindahl et al., 2001). Application of the LINCS (Hess et al., 1997) and SETTLE (Miyamoto and Kollman, 1992) methods allowed for an integration step size of 2 fs. Electrostatic interactions were calculated with the Particle-Mesh Ewald method (PME) (Darden et al., 1993). The temperature was coupled to an external temperature bath (Berendsen et al., 1984) at 300 K with a coupling constant of τT = 0.1 ps separately for the lipids, the solvent, and ions. The pressure was kept constant by a weak coupling to a pressure bath (Berendsen et al., 1984) with τp = 1 ps. Each simulation started with an energy minimization for 20 steps using steepest descent. Because of initial relaxation effects like the slow binding of ions to the membrane, the first 20 ns of each simulation were excluded from the subsequent analysis.
The lateral self-diffusion coefficient D was estimated from the slope of the averaged mean-square displacement of the center of mass x(t) of single lipids,
 |
(2) |
Since the two monolayers were free to move relative to each other, the obtained mean square displacements were corrected by the center of mass motion of the respective monolayers. For D, the error was estimated by splitting each trajectory into pieces of T = 20 ns, separately for the two monolayers. For each of these parts an average mean square displacement as a function of time was determined (N lipids),
 |
(3) |
The second sum runs over all time frames smaller than T − t. These parts were assumed to be statistically independent from each other.
The area per lipid was estimated by a Gaussian fit with width 0.72 nm of the glycerol C-2 atom positions to a grid with a spacing of 4 Å to account for the area increase due to spontaneous undulations.
Simulations were performed each on eight processors of an IBM-p690 cluster using ∼50,000 CPU h of simulation time.
Electrostatics calculation
The electrostatic potential across the bilayer was calculated by double integration of the averaged charge density ρ across the bilayer,
 |
(4) |
For comparison, assuming a static membrane charge distribution ρm obtained from the MD simulation, the potential ψ(x) and the ionic charge distribution ρi were also calculated from the generalized Poisson-Boltzmann (PB) equation,
 |
(5) |
The permittivity  was chosen to be 78 in bulk water and 4 in the region of the fatty acyl chains with the decrease across the hydrophilic headgroups described by a cosine function of 2.5 nm width. Supposing that the ion density obeys a Boltzmann distribution,
  the solution of the PB equation allowed us to estimate the effective bulk NaCl concentration (
 ) used in the simulation by fitting the PB ion density
  to the ion density calculated from the MD simulations.
RESULTS AND DISCUSSION
FCS experiments
We investigated the diffusion behavior of fluorescence markers in POPC membranes at sodium chloride concentrations from 0 to 5 M.
Diffusion in membranes can most easily be studied on planar membranes using FCS. The planar geometry results in a simple functional behavior of the fluorescence correlation function (Eq. 1). In the literature, both giant unilamellar vesicles (Korlach et al., 1999; Feigenson and Buboltz, 2001) and quartz-supported membranes (Schmidt et al., 1995, 1996; Schütz et al., 1997) have been used. Unilamellar vesicles have the advantage that they represent a free membrane without contact to walls. However, they are subject to surface undulations and are not easy to generate reproducibly. Supported membranes have the advantage that their z-coordinate is defined and no fluctuations in and out of the microscope focus may occur. There are, however, reports that the contact of membranes with the support may influence diffusion and equilibration of the sample (Schütz et al., 1997). We decided to investigate supported multilayers for which only one monolayer out of 10–100 (estimated from the amplitudes of the correlation function) is in contact with the support. Surface effects are therefore negligible.
To measure diffusion we used a charged headgroup-labeled fluorescence marker (TRITC-DHPE). This label has a similar chain region as POPC and is therefore expected to display diffusion coefficients similar to POPC. However, due to its charge it may display an ionic strength dependence that differs from the zwitterionic lipids. The second marker (BODIPY-C12-HPE) is labeled at the sn-2 chain and is uncharged. Due to its enlarged chain region the absolute values of the diffusion coefficients may be slightly reduced, but the ionic strength dependence should be similar to that of POPC. Fig. 1 shows normalized cross-correlation profiles from FCS.
The experimental profiles are reasonably well-fitted using Eq. 1 (solid lines in Fig. 1). Overall, the time dependence of the correlation curve is slightly more stretched than the fit profile. One can thus not exclude that the membrane displays a slight heterogeneity of diffusion coefficients. Furthermore, the exact shape of the theoretical profile strongly depends on the assumption that the microscope focus shape is Gaussian (Hess and Webb, 2002). However, these minor uncertainties in the curve shape are much smaller than the changes induced by the NaCl concentration increase studied here and are therefore neglected.
The temperature dependence is given for the two labels in panels A and B. The ionic strength dependence for the two labels is given in panels C and D. As can be seen, the mean dwell times of the two labels in the focus decrease with increasing temperature and decreasing ionic strength. However, the dwell times of the two labels display a different functional dependence on the two variables, which is likely to be caused by the different charge of the labels.
Fig. 2 shows the diffusion coefficients derived from the fits as well as the results from the MD simulations described below. For TRITC-DHPE at 300 K (A) we found a diffusion coefficient of  cm2/s in the absence of NaCl, which decreases to
  cm2/s for 110 mM NaCl concentration (solid lines serve to guide the eye). Further increase of NaCl has no significant effect on the diffusion coefficient.
FIGURE 2.

Diffusion coefficients of TRITC-DHPE and BODIPY-C12-HPE in POPC multilayers as a function of NaCl concentration and temperature. The open symbols represent the MD simulation results at computed effective NaCl concentrations (see text). (A) Diffusion coefficient of the charged TRITC-DHPE at 281, 293, and 300 K strongly depends on NaCl concentration. (B) Diffusion coefficient of the zwitterionic BODIPY-C12-HPE at 281, 293, and 300 K. Semilogarithmic plots of the same data (insets) display a linear behavior for BODIPY. Solid lines serve as guides to the eye.
Although quantitatively in the same order of magnitude, the diffusion coefficients of the uncharged chain labeled lipid at 300 K displays a smoother dependence on ionic strength. In the absence of NaCl the diffusion coefficient is  cm2/s, similar to that of TRITC-DHPE. Upon NaCl concentration increase the diffusion coefficient decreases to
  cm2/s. Solid lines in panel B represent a D ∝ ln[NaCl] dependence fitted to the data. Since adsorption of ions affects the electrostatic potential of the membrane, we displayed both data sets in a semilogarithmic plot (inserts, Fig. 2) reflecting the fact that in high-field Gouy-Chapman theory the electrostatic potential has a logarithmic dependence on charge density and ionic strength.
Calorimetry
We recorded calorimetric heat capacity profiles of POPC multilayers as a function of the NaCl concentration (Fig. 3). The heat capacity maximum of the calorimetric traces was found at ∼−3.4°C, and the melting enthalpy was 19.8 kJ/mol. Small but noticeable changes were found. Increasing ionic strength changes the shape of the profiles. The heat capacity maximum decreases its value, and the overall profile shifts to higher temperatures. This indicates that the interaction with sodium ions favors the ordered gel phase of the lipid membrane. We will further investigate this effect in the MD section.
FIGURE 3.

Calorimetric profiles of POPC multilayers at different bulk NaCl concentrations. A small but measurable effect on the heat capacity can be seen with increasing ionic strength, leading to a decrease of the cP-maximum and a shift of the calorimetric events to higher temperatures.
MD simulations
Fig. 5 A shows a snapshot of simulation system CS after 30 ns of equilibration. The ion distribution across the bilayer became stationary during the equilibration period of 20 ns (data not shown). Analysis of the trajectories (Fig. 4) reveals remarkably similar behavior of the POPC lipid self-diffusion compared to the FCS results. Simulation lengths of at least 100 ns were necessary to determine the mean square displacement (Eq. 3) of single POPC molecules up to 6 ns with sufficient statistical accuracy. The self-diffusion coefficient was obtained from a least-squares fit to the displacements (Eq. 3) between the second and the sixth ns. Likewise for the 100 to 500 ps timescale, diffusion coefficients between  cm2/s and
  cm2/s are obtained, which are consistent with diffusion coefficients obtained from neutron scattering experiments (Tabony and Perly, 1990; König et al., 1992) on DPPC multilayer at the timescale of 1–10 ps.
FIGURE 4.

Mean-square displacements of POPC lipids computed from the simulations. Shown are the results for the simulation without NaCl (black), at 50 mM NaCl concentration (red), and at 220 mM NaCl concentration (green curves), respectively. The lower inset shows the same data for 0–1 ns. The distribution of displacements for the simulation without ions, n(d), is given in the upper inset at three different times t. The solid lines display a fit to the solution of the two-dimensional diffusion equation, n(d) ∼ d exp(−d2/4Dt).
Also shown in Fig. 4 is a distribution of displacements for system AS after 100 ps, 6 ns, and 40 ns, respectively (inset). The agreement with the solution of the two-dimensional diffusion equation (solid lines), n(d) ∼ d exp(−d2/4Dt), suggests that lipid motion follows normal diffusion in a liquid both at short and long timescales. In particular, and in contrast to the general picture, no confinement by nearest neighbor lipids (König et al., 1995) is observed; rather, the mobility exhibits a smooth decrease with larger timescales.
Also in the simulations, the self-diffusion is significantly lowered from  cm2/s to
  cm2/s when adding Na+ and Cl− ions (220 mM) to the simulation system (
 cm2/s for system BS). This close agreement with the FCS experiments (Fig. 2) allows us to use the simulations for an analysis of the microscopic origin of the experimental finding.
Closer analysis of the simulations suggests a specific interaction between sodium ions and lipids as an explanation for this effect. As can be seen from the atom density profiles (Fig. 5 B), the sodium ions (red curve) penetrate deeply into the membrane, with a density maximum close to the carbon chains of the lipids. The resulting charge density is counterbalanced by a layer of chloride ions, which, however, remain within the water phase. Overall, a diffusive capacitor is set up that causes an electric field of considerable strength near the lipid headgroups.
Evaluation of the distribution of distances (rdf) between the sodium ions and adjacent oxygens yields a threefold coordination of the Na+ ions with the lipid carbonyl oxygens and a coordination with 1–2 water oxygens (Fig. 5 C). Fig. 5 D shows a typical snapshot of such a complex. Due to their threefold increased size as compared to single lipids, these complexes are less mobile. Closer inspection reveals that these complexes are stable at least at the simulation timescale (data not shown).
To obtain an estimate for the resulting effective (averaged) self-diffusion coefficient, we assume that the center of mass mobility of a three-lipid complex is slower by a factor of  than that of a single lipid, as would be the case for independent motion of the three lipids in the limit of very short timescales. In this case, the diffusion coefficient D3 for this complex is reduced by a factor of 3 as compared to the diffusion coefficient D of single lipids. If a fraction x of the lipid molecules forms complexes, while the rest, 1 − x, moves with the single lipid self-diffusion coefficient D, the effective diffusion coefficient reads
 |
(6) |
In our simulations BS and CS we observe fractions of x ≈ 0.23 and x ≈ 0.50, respectively, yielding reductions of the effective diffusion coefficients by factors of 1.2 and 1.5, in good agreement with the reductions directly observed in the simulations (1.05 and 1.5).
Alternatively, the resulting decrease of the overall self-diffusion coefficient could be estimated from the Einstein relation D = μkBT assuming a mobility μ = 1/(4πηh){ln[ηh/(η′r)]−γ} given by the Saffman-Delbrück solution (Saffman and Delbrück, 1975) for Brownian motion of particles in membranes (γ = 0.5772 is Euler's constant). Assuming 1.0 and 0.01 poise for the viscosities η of the bilayer and η′ of the water, respectively, a membrane thickness h of 5 nm, and average radii of the lipids (1 vs. 3) as estimated from the simulations, one obtains diffusion coefficients of 4.2 × 10⁻⁸ cm2/s for the self-diffusion of one lipid and 3.9 × 10⁻⁸ cm2/s for a complex of three lipids, thus explaining only partly the decrease seen in both experiment and simulation. We attribute this discrepancy mainly to an increase in the overall viscosity due to the complex formation, which here is not considered.
Furthermore, the validity of the Saffman-Delbrück approach at the present molecular scale is questionable; therefore, we consider the first explanation more convincing.
As a second consequence of the complex formation, we observe a decrease in the average area per lipid (Table 1) by >8% from 0.655 nm2 to 0.606 nm2 (CS). The obtained surface per POPC molecule for the case without NaCl compares favorably with data from time-resolved resonance energy transfer (0.65 ± 0.03) nm2 (Lantzsch et al., 1994), although experimental values scatter considerably.
A third effect of the binding of sodium ions is the electrostatic repulsion of the two, then positively charged monolayers: already at low NaCl concentration the thickness of the bilayer increases by ∼2 Å. This effect increases the deuterium order parameter of the fatty acyl chains (Fig. 6). For the sn-1 chain we predict that NaCl alters the average order parameter from −0.169 (−0.168 from nuclear magnetic resonance experiments (Seelig and Seelig, 1980)) to −0.197.
FIGURE 6.

Deuterium order parameter profile from experiment (diamonds, from Seelig and Seelig, 1980) and from molecular dynamics (MD) simulations (lines). The MD deuterium order parameter |SCD| is increased upon addition of NaCl (0 mM, solid curve; 50 mM, dashed curve; and 220 mM, dash-dotted curve).
The distance between the phosphates of the two monolayers increases more steadily with the NaCl concentration by 1.1 Å and 2.2 Å for 50 mM and 220 mM, respectively. The change in distance for the nitrogen atoms is even larger with 1.8 and 3.8 Å. This affects also the average angle between the lipid dipole vector and the bilayer normal, which decreases from 69.2° (system AS) to 60.7° (system CS).
Electrostatics
Despite the significant structural changes described so far, the profile of the total electric potential across the bilayer is only slightly changed (Fig. 7). This finding agrees with recent fluorescence experiments (Clarke and Lüpfert, 1999), which also showed no significant effect of NaCl on the fluorescence excitation ratio of dyes bound to DMPC vesicles. However, the individual contributions differ significantly (Fig. 7, bottom). In particular, the potential drop due to the lipid headgroups increases from ∼4.5 V to ∼7 V. This drop is compensated for by both the distribution of ions as a diffusive capacitor, which adds ∼3 V across the membrane water interface, as well as a potential increase due to the orientation of the water dipoles near the membrane surface. The latter increase is smaller by >3 V compared to the case without NaCl. The potential contribution caused by the water dipoles exhibits an additional minimum when NaCl is present. Overall, the region of anisotropic dipole orientation is increased.
FIGURE 7.

(Upper panel) Total electrostatic potential (averaged and symmetrized) across the membrane (system AS, thick black line; BS, thin black line; and CS, gray line). (Lower panel) Contributions of water (dipole) potential (solid lines) and of POPC distribution (dashed lines) to the total electrostatic potential.
Using an average charge distribution obtained from our simulations allows us to go beyond the Gouy-Chapman approximation of a single charged surface (compare to Cevc, 1990) and to compare the ion densities from our simulations with densities obtained from the Poisson-Boltzmann equation (Fig. 8). As can be seen, even in the hydrophilic headgroups the calculated ion densities correspond well with the simulated data. Note that, because in the PB treatment the solvation free energy is not taken into account, an unphysically large ion density in the region of the fatty acyl chains would appear. The comparison to the PB solution allows us to obtain improved values for the effective bulk ion concentration present in the simulations, namely 50 ± 30 mM for system BS, and 220 ± 30 mM for system CS, respectively, which we used in Fig. 2.
FIGURE 8.

Number densities of NA+ ions (thick lines) and Cl− ions (thin lines) obtained from MD simulation (system CS, dashed lines) and from the solution of the Poisson-Boltzmann equation (solid lines; see Methods).
SUMMARY AND CONCLUSIONS
In summary we have shown that sodium chloride alters both structural and dynamical properties of a neutral lipid bilayer to a previously unexpected extent. In particular, and contrary to the common assumption that monovalent ions do not or only slightly affect lipid dynamic behavior, the lateral lipid self-diffusion decreases significantly with increasing ion concentration. Diffusion rates obtained from both FCS measurements and molecular dynamics simulations show good agreement. We note that the considerable length of the simulations and the accurate treatment of electrostatic interactions allowed us to determine the self-diffusion coefficient up to 6 ns with high statistical accuracy.
As a microscopic explanation, the MD simulations suggest a strong interaction between sodium ions and the carbonyl oxygens of the lipids, thus forming tight ion-lipid complexes. We propose this deep binding at the interface between the hydrophobic and the hydrophilic region as an explanation for the phase separation in POPC membranes (Rappolt et al., 2001) as well as for the changed C=O infrared absorption seen in the presence of sodium chloride and for the apparent lack of an influence on the antisymmetric PO2− stretching bands (Binder and Zschörnig, 2002).
Like sodium chloride, H3O+ ions might also bind to the carbonyl groups stronger than expected, which would explain the observed long proton residence times at the membrane surface (Heberle et al., 1994; Alexiev et al., 1995). Indeed, the increase of order upon cation binding with increased membrane thickness is in fact supported by the calorimetry experiments.
The agreement of the values for the diffusion coefficients obtained from the FCS experiments carried out at an ms timescale with those obtained from the multinanoseconds simulations is striking, as it suggests that most dynamical processes that govern the self-diffusion rate are faster than 10 ns, whereas those between 10 ns and ms are either few or do not significantly affect lipid diffusion. The fact that, additionally, both the salt effect on an ms timescale and the subnanosecond diffusion coefficient from neutron scattering experiments are correctly reproduced by the simulations suggests that this agreement is not just accidental. Unexpectedly, the effect on the total electrostatic potential upon ion binding is very small. However, the individual contributions do change significantly, especially the contribution due to the polarization of water molecules, which is weakened inside the hydrophilic headgroups and enhanced in the bulk phase. The resulting increased range of hydration phenomena should lead to an increased bilayer distance in multilayer experiments (Russ et al., 2003).
Our study demonstrates that the role of monovalent ions in organizing the membrane and the role of the membrane as a buffer for ions thus far has been underestimated.
Acknowledgments
We thank B. de Groot, G. Schröder, and V. Knecht for stimulating discussions, for critical reading of the manuscript, and for help with the GROMACS program package. Computer time was provided by the Göttingen computer center, GWDG. We are grateful for the extensive help of C.A.M. Seidel and his group with refining our confocal setup.
A.H. and T.H. were supported by the Volkswagen Foundation (priority area “Physics, Chemistry and Biology with Single Molecules”).
Helmut Grubmüller's present address is Institute of Biomolecular Sciences, Faculty for Basic Sciences, Ecole Polytechnique Federale de Lausanne, CH-1015 Lausanne, Switzerland.
References
- Alexiev, U., R. Mollaaghababa, P. Scherrer, H. G. Khorana, and M. P. Heyn. 1995. Rapid long-range proton diffusion along the surface of the purple membrane and delayed proton transfer into the bulk. Proc. Natl. Acad. Sci. USA. 92:372–376. [DOI] [PMC free article] [PubMed] [Google Scholar]
- Almeida, P. F. F., and W. L. C. Vaz. 1995. Lateral diffusion in membranes. In Structure and Dynamics of Membranes: From Cells to Vesicles. R. Lipowski and E. Sackmann, editors. Elsevier, Amsterdam, The Netherlands. pp.305–357.
- Axelrod, D., D. E. Koppel, J. Schlessinger, E. Elson, and W. W. Webb. 1976. Mobility measurement by analysis of fluorescence photobleaching recovery kinetics. Biophys. J. 16:1055–1069. [DOI] [PMC free article] [PubMed] [Google Scholar]
- Berendsen, H. J. C., J. P. M. Postma, W. F. van Gunsteren, and J. Hermans. 1981. Interaction model for water in relation to protein hydration. D. Reidel Publishing Company, Dordrecht, The Netherlands. pp.331–342.
- Berendsen, H. J. C., J. P. M. Postma, W. F. van Gunsteren, A. D. Nola, and J. R. Haak. 1984. Molecular dynamics with coupling to an external bath. J. Chem. Phys. 81:3684–3690. [Google Scholar]
- Berger, O., O. Edholm, and F. Jähnig. 1997. Molecular dynamics simulations of a fluid bilayer of dipalmitoylphosphatidylcholine at full hydration, constant pressure, and constant temperature. Biophys. J. 72:2002–2013. [DOI] [PMC free article] [PubMed] [Google Scholar]
- Binder, H., and O. Zschörnig. 2002. The effect of metal cations on the phase behaviour and hydration characteristics of phospholipid membranes. Chem. Phys. Lipids. 115:39–61. [DOI] [PubMed] [Google Scholar]
- Blume, A. 1993. Dynamic properties. In Phospholipids Handbook. G. Cevc, editor. Marcel Dekker, Inc., New York. pp.455–509.
- Cascales, J. J., and J. G. de la Torre. 1997. Effect of lithium and sodium ions on a charged membrane of dipalmitoylphosphatidylserine: a study by molecular dynamics simulation. Biochim. Biophys. Acta. 1330:145–156. [DOI] [PubMed] [Google Scholar]
- Cevc, G. 1990. Membrane electrostatics. Biochim. Biophys. Acta. 1031:311–382. [DOI] [PubMed] [Google Scholar]
- Clarke, R. J., and C. Lüpfert. 1999. Influence of anions and cations on the dipole potential of phosphatidylcholine vesicles: a basis for the Hofmeister effect. Biophys. J. 76:2614–2624. [DOI] [PMC free article] [PubMed] [Google Scholar]
- Darden, T., D. York, and L. Pedersen. 1993. Particle mesh Ewald—an Nlog(N) method for Ewald sums in large systems. J. Chem. Phys. 98:10089–10092. [Google Scholar]
- Ehrenberg, M., and R. Rigler. 1974. Rotational Brownian motion and fluorescence intensity fluctuations. Chem. Phys. 5:309–401. [Google Scholar]
- Essmann, U., and M. L. Berkowitz. 1999. Dynamical properties of phospholipid bilayers from computer simulation. Biophys. J. 76:2081–2089. [DOI] [PMC free article] [PubMed] [Google Scholar]
- Feigenson, G. W., and J. T. Buboltz. 2001. Ternary phase diagram of dipalmitoyl-pc/dilauroyl-pc/cholesterol: nanoscopic domain formation driven by cholesterol. Biophys. J. 80:2775–2788. [DOI] [PMC free article] [PubMed] [Google Scholar]
- Fisher, R. W. 1978. Lateral diffusion of the phospholipid molecule in dipalmitoylphosphatidylcholine bilayers. An investigation using nuclear spin-lattice relaxation in the rotating frame. Biochemistry. 17:1177–1183. [DOI] [PubMed] [Google Scholar]
- Fujiwara, T., K. Ritchie, H. Murakoshi, K. Jacobson, and A. Kusumi. 2002. Phospholipids undergo hop diffusion in compartmentalized cell membrane. J. Cell Biol. 157:1071–1081. [DOI] [PMC free article] [PubMed] [Google Scholar]
- Heberle, J., J. Riesle, G. Thiedemann, D. Oesterhelt, and N. A. Dencher. 1994. Proton migration along the membrane surface and retarded surface to bulk transfer. Nature. 370:379–382. [DOI] [PubMed] [Google Scholar]
- Heller, H., M. Schaefer, and K. Schulten. 1993. Molecular dynamics simulation of a bilayer of 200 lipids in the gel and in the liquid crystal phase. J. Phys. Chem. 97:8343–8360. [Google Scholar]
- Hess, B., H. Bekker, H. J. C. Berendsen, and J. G. E. M. Fraaije. 1997. LINCS: a linear constraint solver for molecular simulations. J. Comp. Chem. 18:1463–1472. [Google Scholar]
- Hess, S. T., S. Huang, A. A. Heikal, and W. W. Webb. 2002. Biological and chemical applications of fluorescence correlation spectroscopy: a review. Biochemistry. 41:697–705. [DOI] [PubMed] [Google Scholar]
- Hess, S. T., and W. W. Webb. 2002. Focal volume optics and experimental artifacts in confocal fluorescence correlation spectroscopy. Biophys. J. 83:2300–2317. [DOI] [PMC free article] [PubMed] [Google Scholar]
- King, M. D., J.-H. Sachse, and D. Marsh. 1987. Unconstrained optimization method for interpreting the concentration and temperature dependence of the linewidths of interacting nitroxide spin labels. Application to the measurement of translational diffusion coefficients of spin-labeled phospholipids in membranes. J. Mag. Res. 72:257–267. [Google Scholar]
- König, S., T. M. Bayerl, G. Coddens, D. Richter, and E. Sackmann. 1995. Hydration dependence of chain dynamics and local diffusion in L-dipalmitoylphosphatidylcholine multilayers studied by incoherent quasi-elastic neutron scattering. Biophys. J. 68:1871–1880. [DOI] [PMC free article] [PubMed] [Google Scholar]
- König, S., W. Pfeiffer, T. Bayerl, D. Richter, and E. Sackmann. 1992. Molecular dynamics of lipid bilayers studied by incoherent quasi-elastic neutron scattering. J. Phys. II Fr. 2:1589–1615. [Google Scholar]
- Korlach, J., P. Schwille, W. W. Webb, and G. W. Feigenson. 1999. Characterization of lipid bilayer phases by confocal microscopy and fluorescence correlation spectroscopy. Proc. Natl. Acad. Sci. USA. 96:8461–8466. [DOI] [PMC free article] [PubMed] [Google Scholar]
- Kuo, A. L., and C. G. Wade. 1999. Lipid lateral diffusion by pulsed nuclear magnetic resonance. Biophys. J. 77:2300–2308. [DOI] [PubMed] [Google Scholar]
- Lantzsch, G., H. Binder, and H. Heerklotz. 1994. Surface area per molecule in lipid/c12en membranes as seen by fluorescence resonance energy transfer. J. Fluoresc. 4:339–343. [DOI] [PubMed] [Google Scholar]
- Lee, G. M., A. Ishihara, and K. A. Jacobson. 1991. Direct observation of Brownian motion of lipids in a membrane. Proc. Natl. Acad. Sci. USA. 88:6274–6278. [DOI] [PMC free article] [PubMed] [Google Scholar]
- Lindahl, E., B. Hess, and D. van der Spoel. 2001. GROMACS 3.0: a package for molecular simulation and trajectory analysis. J. Mol. Model. 7:306–317. [Google Scholar]
- Magde, D., W. W. Webb, and E. Elson. 1972. Thermodynamic fluctuations in a reacting system—measurement by fluorescence correlation spectroscopy. Phys. Rev. Lett. 29:705. [Google Scholar]
- Miyamoto, S., and P. A. Kollman. 1992. SETTLE: an analytical version of the SHAKE and RATTLE algorithms for rigid water models. J. Comp. Chem. 13:952–962. [Google Scholar]
- Moore, P. B., C. F. Lopez, and M. L. Klein. 2001. Dynamical properties of a hydrated lipid bilayer from a multinanosecond molecular dynamics simulation. Biophys. J. 81:2484–2494. [DOI] [PMC free article] [PubMed] [Google Scholar]
- Neidleman, S. L. 1993. Occurrence and response to environmental stresses in nonmammalian organisms. In Phospholipids Handbook. G. Cevc, editor. Marcel Dekker, Inc., New York. pp.23–38.
- Pandit, S. A., and M. L. Berkowitz. 2002. Molecular dynamics simulation of dipalmitoylphosphatidylserine bilayer with Na+ counterions. Biophys. J. 82:1818–1827. [DOI] [PMC free article] [PubMed] [Google Scholar]
- Patra, M., M. Karttunen, M. Hyvonen, E. Falck, P. Lindqvist, and I. Vattulainen. 2003. Molecular dynamics simulations of lipid bilayers: major artifacts due to truncating electrostatic interactions. Biophys. J. 84:3636–3645. [DOI] [PMC free article] [PubMed] [Google Scholar]
- Rappolt, M., G. Pabst, H. Amenitsch, and P. Laggner. 2001. Salt-induced phase separation in the liquid crystalline phase of phosphatidylcholines. Coll. Surf. A. 183:171–181. [Google Scholar]
- Russ, C., T. Heimburg, and H.-H. von Grunberg. 2003. The effect of lipid demixing on the electrostatic interaction of planar membranes across a salt solution. Biophys. J. 84:3730–3742. [DOI] [PMC free article] [PubMed] [Google Scholar]
- Sackmann, E. 1995. Physical basis of self-organization and function of membranes: physics of vesicles. In Structure and Dynamics of Membranes: From Cells to Vesicles. R. Lipowski and E. Sackmann, editors. Elsevier, Amsterdam. pp.213–304.
- Saffman, P. G., and M. Delbrück. 1975. Brownian motion in biological membranes. Proc. Natl. Acad. Sci. USA. 72:3111–3113. [DOI] [PMC free article] [PubMed] [Google Scholar]
- Schmidt, T., G. J. Schütz, W. Baumgärtner, H. J. Gruber, and H. Schindler. 1995. Characterization of photophysics and mobility of single molecules in a fluid lipid membrane. J. Phys. Chem. 99:17662–17668. [Google Scholar]
- Schmidt, T., G. J. Schütz, W. Baumgärtner, H. J. Gruber, and H. Schindler. 1996. Imaging of single molecule diffusion. Proc. Natl. Acad. Sci. USA. 93:2926–2929. [DOI] [PMC free article] [PubMed] [Google Scholar]
- Schütz, G. J., H. Schindler, and T. Schmidt. 1997. Single-molecule microscopy an model membranes reveals anomalous diffusion. Biophys. J. 73:1073–1080. [DOI] [PMC free article] [PubMed] [Google Scholar]
- Schwille, P., J. Korlach, and W. W. Webb. 1999. Fluorescence correlation spectroscopy with single-molecule sensitivity on cell and model membranes. Cytometry. 36:176–182. [DOI] [PubMed] [Google Scholar]
- Seelig, J., and A. Seelig. 1980. Lipid conformation in model membranes and biological membranes. Q. Rev. Biophys. 13:19–61. [DOI] [PubMed] [Google Scholar]
- Tabony, J., and B. Perly. 1990. Quasielastic neutron scattering measurements of fast local translational diffusion of lipid molecules in phospholipid bilayers. Biochim. Biophys. Acta. 1063:67–72. [DOI] [PubMed] [Google Scholar]
- Tatulian, S. A. 1993. Ionization and ion binding. In Phospholipids Handbook. G. Cevc, editor. Marcel Dekker, New York. pp.511–552.
- Tieleman, D. P., H. J. C. Berendsen, and M. S. P. Sansom. 1999. Surface binding of alamethicin stabilizes its helical structure: molecular dynamics simulations. Biophys. J. 76:3186–3191. [DOI] [PMC free article] [PubMed] [Google Scholar]
- Tieleman, D. P., S. J. Marrink, and H. J. C. Berendsen. 1997. A computer perspective of membranes: molecular dynamics studies of lipid bilayer systems. Biochim. Biophys. Acta. 1331:235–270. [DOI] [PubMed] [Google Scholar]
- van der Ploeg, P., and H. J. C. Berendsen. 1982. Molecular-dynamics simulation of a bilayer-membrane. J. Chem. Phys. 76:3271–3276. [Google Scholar]
- Vaz, W. L. C., and P. F. Almeida. 1991. Microscopic versus macroscopic diffusion in one-component fluid phase lipid bilayer membranes. Biophys. J. 60:1553–1554. [DOI] [PMC free article] [PubMed] [Google Scholar]
- Venable, R. M., Y. Zhang, B. J. Hardy, and R. W. Pastor. 1993. Molecular dynamics simulations of a lipid bilayer and of hexadecane: an investigation of membrane fluidity. Science. 262:223–226. [DOI] [PubMed] [Google Scholar]