

Abstract
The effect of GuHCl and of NaCl on the structural properties of the hemocyanin (Hc) from Carcinus aestuarii has been studied by small angle x-ray scattering (SAXS) using synchrotron radiation. SAXS data collected as a function of perturbant concentration have been used to analyze conformational states of hexameric holo and apoHc as well as the holo and apoforms of the monomeric subunit CaeSS2. In the case of the holoprotein in GuHCl, two concentration domains were identified: at lower concentration, the perturbant induces aggregation of Hc molecules, whereas at higher concentration the aggregates dissociate with concomitant denaturation of the protein. In contrast, with apoHc the denaturation occurs at rather low GuHCl, pointing to an important effect of the active site bound copper for the stabilization of Hc tertiary structure. The effects of NaCl are similar to those of GuHCl as far as CaeSS2 is concerned, namely oligomerization precedes denaturation, whereas in the case of the hexameric form no aggregation occurs. To improve data analysis, on the basis of the current models for Hc monomers and oligomers, the fraction of each aggregation state and/or unfolded protein has been determined by fitting experimental SAXS curves with form factors calculated from Monte Carlo methods. In addition, a global analysis has been carried out on the basis of a thermodynamic model involving an equilibrium between a monomer in a nativelike and denatured form as well as a class of equilibria among the monomer and other aggregates.
INTRODUCTION
Hemocyanins (Hcs) are giant copper-containing proteins present in the hemolymph of mollusks and arthropods, where their role is the transport and storage of molecular oxygen. The oligomers of arthropod Hcs are formed by aggregation of hexameric building blocks. Such hexamers (usually referred to as 1 × 6-mer aggregates) are formed by ∼75 kDa subunits, each containing one binuclear copper active site responsible for oxygen binding (van Holde and Miller, 1995; Markl and Decker, 1992; Salvato and Beltramini, 1990). The structure of arthropod Hcs has been determined after crystallization of the Panulirus interruptus Hc that is considered as typical of all multihexameric Hcs. The subunits are arranged in a trigonal antiprism to form the hexamer, which represents the building block for the generation of higher aggregation forms: the 2 × 6-mer, the 4 × 6-mer or 8 × 6-mer. The number and arrangement of hexamers within these highly aggregated forms is specie-specific (Markl and Decker, 1992); moreover, most species contain more than one subunit type (Mangum et al., 1991). Rather, several subunits, differing for their sequence and association/dissociation behavior, are present in the oligomers and some of them play a key role for the assembly of the higher aggregation forms (Markl et al., 1979a,b). X-ray crystallography studies on P. interruptus Hc (Volbeda and Hol, 1989a,b) and Limulus polyphemus Hc (Hazes et al., 1993) have shown that the subunit of arthropod Hc is folded as to form three domains. The active site is present in domain 2, where two copper ions are bound by six histidine residues provided by four different antiparallel α-helices. Such studies also have provided important information for understanding how the subunits interact in the hexamer. In particular, two staggered layers of trimers with a threefold symmetry axis make the hexamer. Each subunit has a “back surface” where it interacts with the other subunits of the same layer, a “top surface” completely exposed to the solvent, and a “bottom surface” where it interacts with the subunits of the other trimer. The subunits belonging to the two different layers are related by a twofold symmetry axis. Stronger contacts connect two subunits along the twofold symmetry axis, thus, the hexamer can be better described as a trimer of dimers rather than a dimer of trimers (Linzen et al., 1985; Volbeda and Hol, 1989a,b). As far as the higher aggregation forms are concerned, several studies have provided valuable models to describe the hexamer-hexamer interactions as well as the reciprocal orientations of the threefold symmetry axis of one hexamer with respect to those of the neighboring ones (van Holde and Miller, 1995; Markl and Decker, 1992; Salvato and Beltramini, 1990). More recently, the sequences of all subunits of the 4 × 6-meric Hc from Eurypelma californicum have been determined and used to reconstruct the putative three-dimensional structure of the oligomer by homology modeling (Voit et al., 2000).
Many efforts have been done to characterize these structures also in solution (Pilz et al., 1980; Beltramini et al., 1993, 1996; Decker et al., 1996; Grossmann et al., 2000; Hartmann et al., 2001; Hartmann and Decker, 2002), as well as the association/dissociation behavior of hexamers and subunits (Markl and Decker, 1992; Dainese et al., 1998; Molon et al., 2000). These studies ultimately defined arthropod Hcs as aggregates of the hexameric building blocks. The dissociation equilibrium between monomers, hexamers, and higher order oligomers are shown to affect the oxygen binding of Hcs (Markl and Decker, 1992; Dainese et al., 1998; Molon et al., 2000). In addition, several studies have been addressed to the problem of the conformational stability of these proteins versus various physicochemical conditions, such as pressure (Bonafe et al., 1994) or temperature (Sterner et al., 1995; Beltramini et al., 1999), or the presence of solutes, such as the salts of the Hofmeister's series or ureas (Herskovits et al., 1984). Denatured states of proteins have become increasingly more attractive and interesting because they play an important role in protein folding, transport across membranes, and proteolysis (Dill and Shortle, 1991). Dissociation of oligomers and unfolding of E. californicum subunits occur in the presence of guanidinium hydrochloride (Hübler et al., 1998). In particular, in a thorough denaturation study, Hübler et al. (1998) observed that denaturation of the oligomers starts with dissociation into nativelike subunits, which then lose the bound oxygen before major denaturation of the secondary structure occurs.
On these grounds, we have begun a study on the reversibility of the unfolding process, both in the absence and in the presence of natural or artificial chaperones, in the case of the Hc isolated from the crab Carcinus aestuarii. This Hc has been chosen for its simple quaternary organization and association-dissociation behavior both at the hexameric and monomeric level and because it is possible to isolate one subunit (the CaeSS2 subunit) at alkaline pH, that retains its monomeric state when the buffer conditions are changed to neutrality (Dainese et al., 1998). Thus, the effects of the aggregation state on the protein stability can be comparatively studied under the same experimental conditions. In a previous work on the effects of guanidinium hydrochloride (GuHCl) on the conformation of such Hc subunits, we have disclosed aggregation phenomena occurring in a narrow range of perturbant concentration that precede denaturation (Favilla et al., 2002a,b). In such studies, however, no information on the structure of possible intermediates along the unfolding pathway has been derived.
To obtain further information on the aggregation, dissociation, and denaturation processes, in this work we have studied the effects of GuHCl and NaCl on C. aestuarii Hc in the hexameric state as well as on the CaeSS2 monomer, through the SAXS technique, by using synchrotron radiation. Holo (copper containing) and apo (copper depleted) forms have been used with the aim to disclose effects of the active site bound copper ions on the conformational stability in the presence of GuHCl. To investigate the role of the electrostatic forces on the nature of the interactions between the subunits, SAXS experiments have also been performed as a function of NaCl concentration, i.e., as a function of the ionic strength of the solution. Data analysis has included the determination of the fractions of both the denatured form and the oligomers present at each concentration of GuHCl or NaCl by using form factors calculated from the Monte Carlo method and applied either to each curve separately or by a global analysis based on a thermodynamic model.
MATERIALS AND METHODS
Protein purification
C. aestuarii Hc has been purified from the hemolymph collected from the dorsal lacuna of living crabs (Bubacco et al., 1992). The purified protein has been stored as a concentrated solution (∼100 mg/ml) in 50 mM Tris/HCl buffer at pH = 7.5 containing 20 mM CaCl2 and 20% sucrose at −20°C. To obtain homogeneous preparations of hexameric Hc, the native protein has been overnight incubated in 50 mM Tris/HCl buffer at pH = 9.2 containing 10 mM EDTA, followed by gel filtration on a Pharmacia FPLC system equipped with a Superdex 26/60 prep-grade column equilibrated in the same buffer. The lower retention time material corresponds to the pH stable hexamer, which does not modify its aggregation state, once back to neutral pH (Dainese et al., 1998). This material is referred to as hexameric Hc in the following SAXS studies. The material eluting with longer retention time represents a pool of monomers derived from dissociation of pH unstable hexamers. From this pool, the non-reassociating CaeSS2 subunit has been separated as previously described (Dainese et al., 1998; Zlateva et al., 1996) and referred to as CaeSS2 in the following SAXS studies. Hc concentration has been determined spectrophotometrically, using an extinction coefficient of 1.21 ml mg−1 cm−1at 278 nm, referred to a monomer molecular mass of 75 kDa both in the case of monomeric and hexameric Hc. The presence of oxyHc in the holoHc preparations has been quantified by measuring the absorbance ratio A337/A278 and taking the value of 0.21 for a protein preparation containing 100% oxyHc (Dainese et al., 1998).
ApoHc, both in the monomeric and hexameric state, has been prepared from the corresponding monomeric or hexameric holoforms by dialysis against cyanide and EDTA, as described by Bubacco et al. (1992). The apoderivatives contain <2% of still bound copper and do not exhibit any band at 337 nm.
Preparation of samples and SAXS measurements
Each Hc sample has been measured in the absence or presence of either GuHCl or NaCl at varying concentrations. Samples with GuHCl have been prepared by diluting a concentrated protein solution with 50 mM Tris/HCl buffer containing 7 M GuHCl at pH 7.5 to reach a final concentration of GuHCl between 0 and 3.5 M. The final protein concentrations have been 4.4 and 2.4 mg/ml for holohexameric and holoCaeSS2 Hc samples, and 2.5 mg/ml and 1.3 mg/ml for the apohexameric and apoCaeSS2 samples, respectively. A second series of samples at different ionic strength has been obtained by adding increasing amounts of 4 M NaCl in 50 mM Tris/HCl buffer at pH 7.5 to a concentrated protein solution, to give final salt concentrations between 0 and 3.0 M. Final protein concentrations have been the same as above with GuHCl, NaCl has been varied up to 2.0 M with holo- and to 3.0 M with aposamples. In both cases, reference SAXS curves for each sample have been collected on the corresponding buffer.
SAXS measurements have been performed at room temperature at the Elettra Synchrotron Radiation Facility (Trieste, Italy). The wavelength of the incident beam has been λ = 1.54 Å and the explored Q-range extended from 0.02 to 0.15 Å−1 (Q = 4π sin θ/λ where 2θ is the scattering angle). The cuvettes for solutions have been made of quartz capillaries (diameter 1 mm, wall thickness 0.01 mm) stuck by epoxy in an aluminum holder supplied with screwed covers. The cuvette volume has been ∼50 μl. The detector has been placed at 2.30 m allowing for an angular resolution of 1.5 × 10⁻³°.
Analysis methods
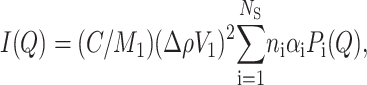
Small angle x-ray scattering is one of the most suitable techniques in studying systems where large structural or conformational changes occur, like aggregation/dissociation or folding/unfolding processes of proteins in solution (Trewhella, 1997; Kataoka et al., 1993, 1995; Pollack et al., 1999; Pérez et al., 2001). Here we are interested in studying diluted solutions (in the order of 10−5 M) of a protein that is present in different aggregation or unfolded states in mutual equilibrium. In the frame of the so-called two-phase model, such a system can be considered as a set of randomly oriented scattering particles all constituted by a unique homogeneous material with electron density ρ, dispersed in a solvent with electron density ρs. In these conditions, the excess x-ray scattering intensity can be written as
 |
(1) |
where C is the weight protein concentration, Δρ = ρ−ρs the contrast, M1 the monomer molecular weight, and V1 its volume. The sum is extended over all the NS protein states, each of them defined by the monomer aggregation number, ni, by the form factor Pi(Q), and by the fraction αi of monomers that are distributed in the ith state, with the normalization condition
 |
(2) |
Pi(Q) contains information on the size and shape of the ith protein form and it is connected through an isotropic Fourier transform to the distance distribution function, pi(r), the probability of finding pair of small volume elements at a distance r within the ith particle,
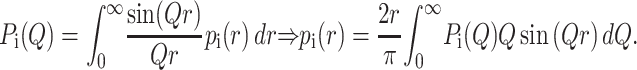 |
(3) |
For globular proteins, the behavior of I(Q) at small Q is approximated by the Guinier law (Guinier and Fournet 1955),
 |
(4) |
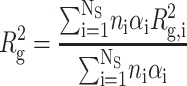
where Rg is the average gyration radius, defined for a mixture of homogeneous scattering particles by
 |
(5) |
 |
(6) |
and
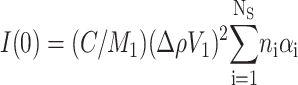 |
(7) |
is the scattering intensity at zero angle. The Guinier approximation is strictly valid only for Q Rg ≤ 1.3 (Feigin and Svergun, 1987). It should be observed that Rg and I(0) are respectively related to the average dimension, aggregation state and protein concentration.
If the structure of all the protein states is known, from a calculation of their corresponding form factors, an analysis of the whole SAXS curve can be performed through Eq. 1, leading to an estimate of the set of fractions αi. This situation occurs in the case of C. aestuarii Hcs, where the structures of most oligomers can be found in the protein data bank (PDB). To calculate the scattering profile of a protein from its crystallographic structure different methods have been described (Svergun, et al., 1995; Kozin et al., 1997; Spinozzi et al., 1998): among them, the Monte Carlo tool gives accurate results when the maximum Q-value does not exceed 0.4–0.5 Å−1 (Hansen, 1990; Henderson, 1996; Ashton et al., 1997; Svergun, 1997; Mariani et al., 2000; Cinelli et al., 2001). In particular, we resort to the Monte Carlo method described in Cinelli et al. (2001), which takes into account the effect of both the chain mobility and the hydration shell on the protein surface by describing the protein boundary with a Gaussian probability profile, characterized by a width σ. By contrast, to calculate scattering form factors of partially folded or completely unfolded protein states, it is necessary to use analytical models that can be found in literature (Flory, 1971). The simplest one is the Debye model (Debye, 1947), which considers a flexible chain with a random walklike conformation (random-coil chain). The corresponding form factor is given by:
 |
(8) |
with 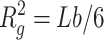 . In this equation, b is the statistical segment (Kuhn) length, representing the separation between two adjacent scattering centers, and L is the contour length, a measurement of the chain length. Notice that to calculate the gyration radius of unfolded proteins, the Debye equation should be preferred to the Guinier approximation (Eq. 8) (Pérez et al., 2001). In particular, it has been shown (Calmettes et al., 1994) that the Debye approximation can be applied in the range Q Rg ≤ 3. More physical models describing semiflexible or wormlike polymers have been developed. A detailed analysis has been recently published by Pedersen and Schurtenberger (1996): they report a Monte Carlo simulation study of the wormlike chain model of Kratky and Porod (1949), both considering the presence or the absence of excluded volume effects. Results are given in terms of approximated analytical expressions, which have been parameterized to reproduce SAXS scattering profiles.
In this work, unfolded states of the Hcs have been described by using the Pedersen's model that includes the effect of the excluded volume. Moreover, the finite section of the protein chain has been modeled by a local cylindrical cross-section. In this fashion, the scattering curve of an unfolded protein can be fitted by using three parameters: the Kuhn length b, the contour length L and the radius Rc of the cross-section. If the unfolded protein volume is estimated, a further constraint among these parameters can be added, namely V = πRc2 L.
It should be observed that a further convenient approach to study the transition from a globular to a random coil state is to plot the scattering data in the Kratky plot: Q2 I(Q) vs. Q, as previously used for globular proteins such as cytochrome c (Kataoka et al., 1993, 1995; Semisotnov et al., 1996; Cinelli et al., 2001). The scattering profile of a globular protein follows the Porod's law with I(Q) proportional to Q−4 at large Q. Thus, in this case a bell-like Kratky plot is expected whose position mainly depends on its gyration radius, Rg. In contrast, for a coil structure, I(Q) varies with Q−2 (the asymptotic behavior of a Debye law, Eq. 8) or Q−1 at moderate or high Q-values, respectively, and the plot raises monotonically to a plateau. As a consequence, the evolution of the plot from the bell-like profile to a plateau curve reports on the transition from the folded to the unfolded state of the protein as a function of the changed solution conditions.
Thermodynamic models
The use of Eq. 1 in fitting the single SAXS curves leads to the determination of the fractions αi of each species present in the sample. By varying the ionic strength or GuHCl amount, aggregation/denaturation processes occur and, as a matter of fact, fractions do change. So by attempting to model the mutual equilibria among various species by using basic thermodynamic expressions dealing with the variation of some physical quantities with the NaCl or GuHCl concentrations, it would be possible to simultaneously fit a set of SAXS curves.
Very recently, Favilla et al. (2002a,b) proposed some basic equilibrium schemes between the forms of C. aestuarii Hcs. In particular, within the global equilibrium Hc1 ↔ HcD between a monomer in a nativelike (Hc1) and denatured (HcD) form, there is a class of equilibria among the monomer in an aggregation-prone conformation (Hc1) and other aggregates. On this basis and over the results coming from the Guinier analysis (see next section), we suggest that three aggregation equilibria, monomer/hexamer (6 Hc1 ↔ Hc6), hexamer/dodecamer (2 Hc6 ↔ Hc12), and dodecamer/icosatetramer (2 Hc12 ↔ Hc24), are the most relevant. The corresponding equilibrium constants are
 |
(9) |
 |
(10) |
 |
(11) |
 |
(12) |
where c = C/M1 is the total monomer molar concentration and αi is the fraction of the i-specie (see above). By combining Eqs. 9–12 with the normalization condition, Eq. 2, one can obtain an implicit equation for α1,
 |
(13) |
which can be solved by numerical methods. At each equilibrium constant, a corresponding free energy ΔG is assigned, according to K = exp(−ΔG/kBT). The simplest way to approximate the free energy is to expand it in a power series of concentrations (cGuHCl and cNaCl) and take only the first-order term,
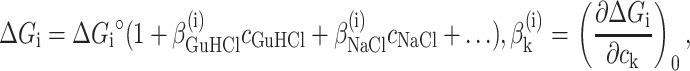 |
(14) |
where ΔGi°,  , and
, and  are fitting parameters. The truncation to the first term in the power expansion seems to be the only feasible as well as honest way to write the ΔGi functions. On the other hand, physical models, such as the Debye-Hückel theory (Debye and Hückel, 1923), able to describe free energies in the wide range of concentrations of both GuHCl and NaCl, cannot be found in literature. In practice, in the presence of the four equilibrium processes, a global fit analysis of the whole set of curves obtained at different values of cGuHCl and cNaCl can be performed by optimizing the following 12 parameters: ΔGD°,
  ,
,  , ΔGA1°,
  ,
,  , ΔGA2°,
  ,
,  , ΔGA3°,
  , and
, and  .
.
Data fitting
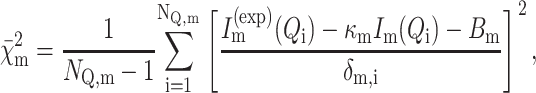
In all cases, the analysis of the NC experimental curves  of NQ,m points has been performed by minimizing the reduced χ2:
 |
(15) |
 |
(16) |
where Im(Q) is the fitting scattering intensity (Eq. 1), κm is a calibration factor, Bm a flat background, and δm,i the experimental uncertainty of the scattering curve at the point Qi.
RESULTS AND DISCUSSION
Unfolding studies by GuHCl: Guinier analysis and Kratky plots
SAXS experiments have been performed on both hexameric and monomeric forms of holo and apoHc as a function of GuHCl concentration in the range from 0 to 3.5 M. A selection of experimental SAXS curves (log I(Q) vs. Q) are shown in Fig. 1, A and B. In the case of hexameric holoHc (Fig. 1 A), the scattering curves show significant differences with increasing denaturant concentration: at 0.5 M GuHCl, a change in shape is already visible, whereas the slope in the low-angle region markedly increases at denaturant concentration >1.5 M. For GuHCl concentrations larger than 1.75 M, the curves are rather flat. These observations suggest that the effect of perturbant is first Hc aggregation and then loss of protein structure. Scattering curves of the corresponding aposamples (not shown) exhibit loss of protein structure already at 0.5 M GuHCl, confirming the lower stability of the hexamer after copper removal.
FIGURE 1.
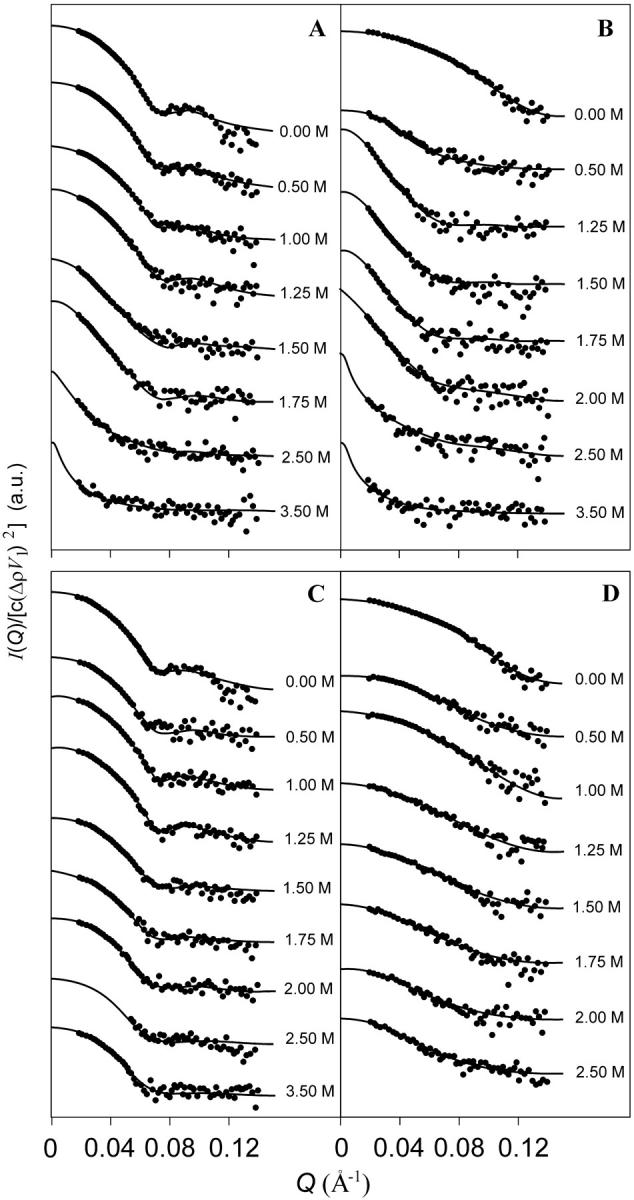
Semilogarithmic SAXS patterns curves of C. aestuarii Hc in the presence of increasing concentrations of GuHCl (A and B) or NaCl (C and D), as indicated. For sake of clarity, the SAXS traces are shifted along the y-axis. Protein samples: A and C, hexameric Hc in the holoform; B and D, CaeSS2 subunit in the holoform. Fitting curves are obtained with the global fitting analysis based on the thermodynamic model of association/unfolding processes.
The SAXS curves of holo-CaeSS2, reported in Fig. 1 B, show a gradual modification of the shape with GuHCl (from 0 to 3.0 M), especially at the lowest Q-values. In particular, the slope increase in this region is more pronounced >0.5 M, indicating that the monomers have a higher tendency to aggregate than the hexamers. Loss of protein structure, indicated by curve flattening, occurs for the monomer >2.0 M GuHCl. SAXS curves for the apo-CaeSS2 (not shown) show the typical flattening, attributed to loss of structure, already at 0.5 M GuHCl, again pointing out the low stability of Hc after copper removal, regardless of quaternary structure.
A first approach to evaluate structural differences among the various samples, as well as the conformational changes brought about by GuHCl, consists of determining the radius of gyration (Rg) of the particles in solution (Table 1) as calculated by the Guinier (Eq. 4) approximations. Variations of this parameter are important because they give an estimate of the change in the dimensions of the particles as the composition of the solution is changed.
TABLE 1.
Experimental radii of gyration of hexameric Hc and CaeSS2 monomer in the holo- and apoforms, as obtained from Guinier analysis, as a function of GuHCl and NaCl concentration
|
Rg (Å)
|
I(0) (a.u.)
|
||||
|---|---|---|---|---|---|
| Δρ (eÅ−3) | Holo | Apo | Holo | Apo | |
| Hexameric Hc | |||||
| GuHCl (M) | |||||
| 0.00 | 0.088 | 49.7 ± 0.1 | 49.1 ± 0.2 | 54.4 ± 0.1 | 13.6 ± 0.1 |
| 0.50 | 0.085 | 52.0 ± 0.2 | – | 53.3 ± 0.2 | – |
| 1.00 | 0.082 | 53.1 ± 0.1 | – | 51.1 ± 0.2 | – |
| 1.25 | 0.081 | 61.5 ± 0.2 | – | 63.7 ± 0.3 | – |
| 1.50 | 0.079 | 78 ± 3 | – | 112 ± 7 | – |
| 1.75 | 0.078 | 86 ± 2 | – | 158 ± 5 | – |
| 2.50 | 0.073 | – | – | – | – |
| 3.50 | 0.067 | – | – | – | – |
| NaCl (M) | |||||
| 0.00 | 0.088 | 49.7 ± 0.1 | 49.1 ± 0.2 | 54.4 ± 0.1 | 13.6 ± 0.1 |
| 0.50 | 0.083 | 49.4 ± 0.2 | 55.0 ± 0.6 | 46.5 ± 0.2 | 11.5 ± 0.2 |
| 1.00 | 0.078 | 50.8 ± 0.1 | 55.5 ± 0.9 | 41.7 ± 0.1 | 10.1 ± 0.2 |
| 1.25 | 0.075 | 50.9 ± 0.2 | 53.4 ± 0.9 | 39.2 ± 0.2 | 8.5 ± 0.2 |
| 1.50 | 0.073 | 51.1 ± 0.2 | 50.5 ± 0.7 | 37.0 ± 0.2 | 6.6 ± 0.1 |
| 1.75 | 0.070 | 49.5 ± 0.4 | 47.8 ± 0.9 | 33.3 ± 0.3 | 5.5 ± 0.1 |
| 2.00 | 0.068 | 49.4 ± 0.4 | 54 ± 2 | 30.8 ± 0.3 | 4.8 ± 0.2 |
| 2.50 | 0.063 | 51.9 ± 0.3 | – | 28.6 ± 0.2 | – |
| CaeSS2 Hc | |||||
| GuHCl (M) | |||||
| 0.00 | 0.088 | 30.7 ± 0.1 | 47 ± 1 | 5.79 ± 0.02 | 2.9 ± 0.1 |
| 0.50 | 0.085 | 46.6 ± 0.6 | – | 17.6 ± 0.3 | – |
| 1.25 | 0.081 | – | – | – | – |
| 1.50 | 0.079 | 77 ± 7 | – | 86 ± 10 | – |
| 1.75 | 0.078 | – | – | – | – |
| 2.00 | 0.076 | – | – | – | – |
| 2.50 | 0.073 | – | – | – | – |
| 3.00 | 0.070 | – | – | – | – |
| NaCl (M) | |||||
| 0.00 | 0.088 | 30.7 ± 0.1 | 47 ± 1 | 5.79 ± 0.02 | 2.9 ± 0.1 |
| 0.50 | 0.083 | 29.6 ± 0.5 | – | 5.3 ± 0.1 | – |
| 1.00 | 0.078 | 33.3 ± 0.3 | – | 5.3 ± 0.1 | – |
| 1.25 | 0.075 | 35.3 ± 0.4 | 30 ± 4 | 5.8 ± 0.1 | 0.5 ± 0.1 |
| 1.50 | 0.073 | 34.1 ± 0.5 | – | 5.7 ± 0.1 | – |
| 1.75 | 0.070 | 36.7 ± 0.6 | – | 6.0 ± 0.1 | – |
| 2.00 | 0.068 | 36.1 ± 0.8 | – | 6.2 ± 0.1 | – |
| 2.50 | 0.063 | 46.1 ± 0.8 | – | 7.5 ± 0.1 | – |
The electron density contrast, Δρ, calculated from the solution chemical composition is also reported.
The Rg value, calculated for holohexamers in buffer (Table 1), is compatible with x-ray crystallography. The dimensions of such aggregates, obtained using RasMol 2.6 package (www.umass.edu/microbio/rasmol/) from the PDB entry 1HC1-6, are 105 × 105 × 87 Å. By applying the Monte Carlo method to this crystallographic structure, the distance distribution function, p(r), has been calculated and through the Eq. 6 a radius of gyration of 49.2 Å has been found, in excellent agreement with the experimental value. The Rg values calculated by the Guinier analysis raise smoothly from 49.7 ± 0.1 to 61.5 ± 0.2 Å as GuHCl concentration increases from 0 to 1.25 M. Above this value Rg increases suddenly: 78 ± 3 Å at 1.5 M and 86 ± 2 Å at 1.75 M. In accordance to Eq. 7, the I(0) values increase as a function of denaturant concentration, suggesting an increase of particle size (Table 1). Above this GuHCl concentration, Kratky plots (Fig. 2 A) show the evolution of the holohexameric Hc peak toward smaller Q-values suggesting that the particles are growing in size, before losing their structure at 2.5 M. At those perturbant concentrations, due to the accessible Q-range, neither the Guinier law nor the Debye approximation can be applied. The behavior of hexamers in the apoform is markedly different from that described above for the corresponding holoform. In the absence of denaturant, Rg = 49.1 ± 0.2 Å is very similar with that of the holoform (Rg = 49.7 ± 0.1 Å, Table 1). Furthermore, the protein undergoes an early denaturation already at 0.5 M GuHCl (again confirmed from Kratky plots, here not shown), with increased uncertainty in the determination of Rg values. Thus, two conclusions can be drawn: in the absence of denaturant the structures of the hexameric holo and apoproteins are rather similar, but in absence of copper the protein becomes more sensitive to the effect of the denaturant. As far as GuHCl is concerned, it appears that there are two effects, that can be discriminated on the basis of the Rg values: the first one consists in an increase of the size of the protein aggregate, with substantial maintenance of the quasiglobular state; in contrast, the second one brings the protein to the unfolded state. The holoform of CaeSS2 exhibits an experimental Rg of 30.7 ± 0.1 Å (Table 1), compatible with the 71 × 52 × 58 Å dimension of the monomer (PDB entry 1HC1), from which, through the Monte Carlo tool (Cinelli et al, 2001), an Rg of 27.8 Å is calculated. Rg increases up to 46.6 ± 0.5 Å in the presence of 1 M GuHCl and reaches a value of 77 ± 7 Å above 1.50 M (Table 1). This behavior suggests an association of monomers into oligomers, which are still globular, as evident from the Kratky plots (see Fig. 2 B): the peak of the curve is markedly shifted to lower Q, in agreement with the transition from the monomeric to the oligomeric state before unfolding above 2 M GuHCl. The aposample shows a particularly interesting behavior, because it gives an Rg value of 47 ± 1 Å, much larger than for CaeSS2-holo in the absence of perturbant. Such value is closer to that of the apoform of the hexamer than to that of the monomer and suggests that aggregation phenomena may occur upon copper removal. As far as the apoforms are concerned (data not shown), the protein is seen to exhibit a greater sensibility to the unfolding effects of GuHCl, being already denatured at 0.5 M GuHCl.
FIGURE 2.
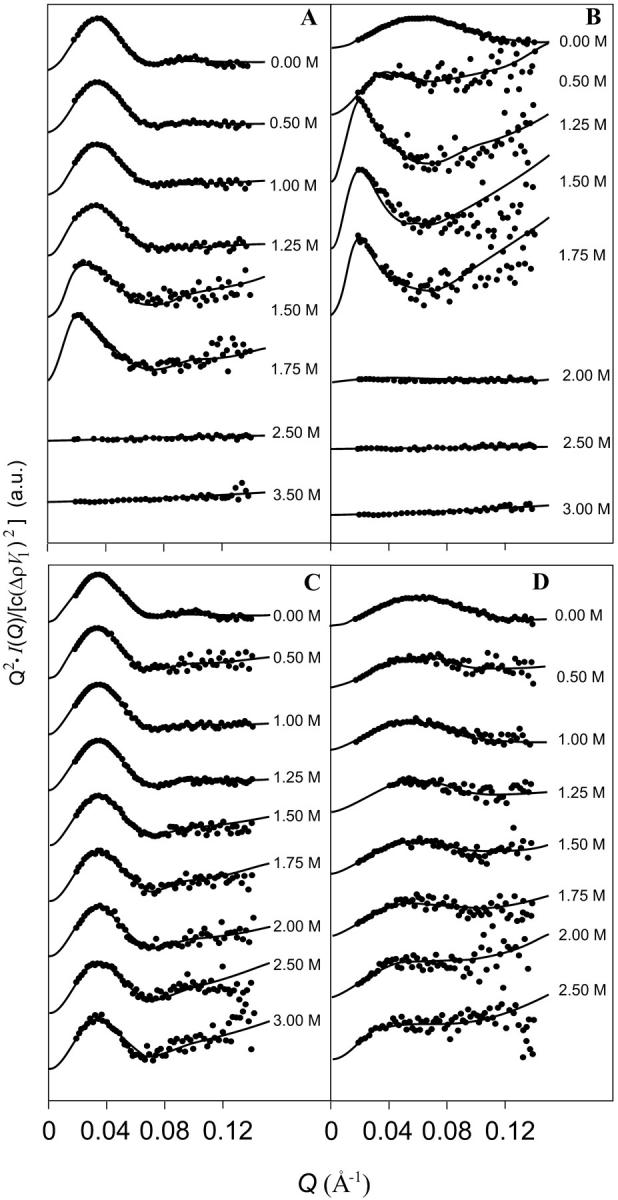
Kratky plots of Carcinus aestuarii Hc in the presence of increasing concentrations of GuHCl (A and B) or NaCl (C and D), as indicated (derived from the SAXS data shown in Fig. 1). For sake of clarity, traces are shifted along the y-axis. Protein samples: A and C, hexameric Hc in the holoform; B and D, CaeSS2 subunit in the holoform. Fitting curves are obtained with the global fitting analysis based on the thermodynamic model of association/unfolding processes.
Aggregation phenomena, depending on the presence of GuHCl, have been also reported in a previous study on the conformation of holo- and apo-CaeSS2 Hc subunits (Favilla et al., 2002a,b), where 1 μM solutions of the protein apoform in the presence of GuHCl have been described to undergo a reversible increase of light scattering. The effect is much more marked with the apo- than with the holoform and occurs at very low denaturant concentration, with a threshold near 50 mM and a maximum value near 0.2–0.5 M, followed by a monotonic decrease of intensity. Above this GuHCl concentration, the light scattering signal of the solution returned to the value in the absence of GuHCl. This effect has been attributed to the shift on native conformation to an aggregation-prone intermediate, along the protein unfolding pathway, soon populated in the presence of GuHCl. At higher denaturant concentrations, hydrophobic residues are better solvated, and the protein turned completely soluble again >1.2 M GuHCl, i.e., well before denaturation. Here we show that the aggregation phenomena, responsible for the marked increase of Rg for the species in solution, are present at all different concentrations of GuHCl. For these SAXS measurements, Hc has been used at concentrations in the 1.3–4.4 mg/ml range, namely 17.3–58.6 μM, that are much higher than those used in the above-mentioned light scattering and spectroscopic measurements (Favilla et al., 2002a,b). Since aggregation phenomena are typically concentration-dependent, by the present approach we observe denaturation pathways which seem much more overlapped to aggregation, as compared with the previous study.
Effect of NaCl: Guinier analysis and Kratky plots
To disclose the effects of ionic strength on the Hc structural properties, the SAXS analysis has been also performed on Hc samples incubated at different NaCl concentrations.
In Fig. 1, C and D, the SAXS profiles of the holohexamer and holo-CaeSS2 are shown and the results of Guinier analyses are summarized in Table 1. Increasing concentrations of NaCl to hexameric holoHc cause very small changes in the scattering curves (Fig. 1 C), although at high Q-values, errors increase with NaCl concentration due to decrease of the contrast (Eq. 1 and Table 1). Accordingly, the gyration radius remains constant and the I(0) values slightly decrease, demonstrating that the protein is stable with respect to the increasing ionic strength. The Kratky plots (Fig. 2 C) of the hexameric holoHc show a peak in the same position, as a function of NaCl, compatible with the preservation of the oligomeric compact structure. For the hexameric apoHc, above 2.0 M there is sudden increase of standard errors in the Rg determination (Table 1), but not for the holohexamer, suggesting that this concentration can be considered the threshold for denaturation of the apoform. Therefore, the conformational stability of the holoform results to be higher than that of apoHc also with respect to ionic strength effects. In this case, however, denaturation occurs apparently without previous aggregation of the oligomers, as described above in the presence of GuHCl. In the case of CaeSS2 holosamples (Fig. 1 D), the trend of the shape of the SAXS patterns and the corresponding increase of the gyration radii (Table 1) are indicative of the presence of particles that become larger as a function of NaCl. Furthermore, the I(0) values are slightly decreasing from 0 to 1 M NaCl and then increasing up to 2.5 M. This effect can be explained with the opposite behavior of the contrast, Δρ, and the average aggregation numbers, ∑niαi with the NaCl concentration (Eq. 7). This effect is in line with the monomeric character of CaeSS2 where the stabilization of monomers within the hexamer is lacking. The Kratky plots obtained in the case of CaeSS2 holoHc (Fig. 2 D) confirm that the increase of dimensions of the particles as a function of NaCl concentration occurs without denaturation, as demonstrated by the maintenance of the peak in the Kratky plots, that is progressively shifted toward smaller angles. As far as CaeSS2 apoHc is concerned (data not shown), the SAXS spectra at NaCl > 0.5 M suggest the formation of larger particles, whereas the flattening of the SAXS curve at 1.25 M NaCl points to the unfolding of the molecule. These results confirm the higher susceptibility of the apoforms to denaturation, attributable to the loss of the stabilizing effect of copper ions, although the oligomeric state makes the hexamer more stable as compared to the monomer.
Determination of distribution of oligomers present in solution
On the basis of the fact that each native protein sample in buffer is composed by particles of homogeneous size, as determined chromatographically during the preparation procedure, we can investigate to what extent the addition of either GuHCl or NaCl affects this initial homogeneity.
Kratky plots demonstrate that GuHCl and NaCl induce aggregation with substantial maintenance of the globular state of the protein before unfolding. Moreover, the converging Rg values of CaeSS2 subunit with those obtained with hexameric Hc support the view of an oligomerization of monomers at the level of hexamers followed by a further aggregation, before denaturation. This consideration agrees quite well with the results of Favilla et al. (2002a,b), which show that aggregation of molecules occurs in a GuHCl concentration range where the spectroscopic analysis show no change in the tertiary structure of the protein. It seems, therefore, correct to address the problem of modeling the aggregation processes considering possible equilibria between oligomers of different size. As C. aestuarii Hc has not yet been crystallized, the resolved structure of P. interruptus Hc has been used to simulate the theoretical curves of each aggregation state. This approximation is correct because the structure of all arthropod Hcs is highly conserved (Gaykema and Hol, 1984; Linzen et al., 1985; Durstewitz and Terwilliger, 1997; Voit et al., 2000).
The structure of the 75-kDa subunit has been obtained from the PDB and the different species have been obtained by adding the different monomers, PDB entries 1HC1, 1HC2,… 1HC6, in such a way that 1HC1 plus 1HC2 gives the structure of a dimer, by adding 1HC3 the structure of a trimer is obtained, and so on up to the structure of the hexamer. In this process, the subunit-subunit contact areas, responsible for the stabilization of the hexamer as resulting from the x-ray analysis (Volbeda and Hol, 1989a,b) have been considered. Hexamers and relative multiples have been built according to the literature models derived by electron microscopy data: the hexamer is composed by two trimers, superposed on the top of each other, staggered 60°, forming a trigonal antiprism (Linzen et al., 1985; Magnus et al., 1991). As no dodecameric Hc has been so far crystallized, this structure has been obtained by the addition of two hexamers superimposed to each other, with the threefold symmetry axis of one hexamer perpendicular to the same axis of the other hexamer (van Holde and Miller, 1995; Taveau et al., 1997). Finally, to form icosatetramers, two dodecamers have been assembled parallel to each other, but staggered 5° in the transversal axis (Sterner et al., 1995). These structures are reported in the gallery of Fig. 3 .
FIGURE 3.

Structural reconstruction of oligomeric Hc. (Top left) Top view of the monomer (PDB entry 1HC1); (top right) top view of the hexamer along the threefold symmetry axis of the aggregate; (bottom left) dodecameric Hc; and (bottom right) icosatetramer. The procedure used for oligomer reconstruction is described under Results and Discussion.
For the monomer, the hexamer, the dodecamer, and the icosatetramer theoretical form factors, Pi(Q), have been calculated (Fig. 4) by the Monte Carlo tool described in the previous section (Cinelli et al, 2001). Data points of Fig. 4 describe the experimental SAXS curve of the hexameric holoHc. For all the oligomers, the width of the Gaussian border has been fixed to 4 Å, as determined by fitting the SAXS curve of the native holohexamer only with the Monte Carlo form factor corresponding to the hexameric state. The monomer dry volume and the averaged electron density, derived from the amino acid composition using data reported by Jacrot and Zaccai (Jacrot, 1976; Jacrot and Zaccai, 1981), are V1 = 94,800 Å3 and ρ = 0.422 eÅ−3, respectively. To derive the structure of the putative completely unfolded states of monomer Hc, four SAXS curves, corresponding to the holo/apohexamer and holo/apoCaeSS2 at the maximum concentration of GuHCl (3.5 M) have been analyzed with the wormlike Pedersen model previously discussed. The four curves (Fig. 5) are well superimposable, suggesting that a unique average form factor could describe the unfolded states. Thus, a global fit has been performed. By fixing the volume to V1, the fitted wormlike parameters are b = 40 ± 1 Å, L = (6.2 ± 0.2) × 103 Å, and Rc = 5.0 ± 0.1 Å. The reduced χ2 (Eq. 15) is 0.22. The corresponding radius of gyration is 258 ± 5 Å, too large to be determined in the investigated Q-range by using the Debye approximation (the condition Q Rg ≤ 3 leads to a maximum Q = 0.01 Å−1). These structural parameters, and in particular the quite low Rc value, show that the protein is completely unfolded. Interestingly, the number of statistical segments, namely L/b = 155 ± 5, is lower than the number of amino acid residues in the monomer (657), suggesting that even under the strongest experimental conditions studied, some correlations among them still remain. Afterwards, the other experimental SAXS curves obtained at different conditions have been analyzed on the basis of the five previously calculated form factors (globular monomer, hexamer, dodecamer, icosatetramer, and unfolded monomer) allowing the fraction αi of each species to vary to get the best fit (Eq. 15). The good results that have been obtained for the single curves induced us to apply a much deeper global analysis based on the thermodynamic model discussed under Materials and Methods. This approach has been applied to the holoforms of both monomeric and hexameric Hc. The corresponding apoforms have been excluded from this analysis since previous work (Favilla et al., 2002a,b) and present results suggest the presence of a molten globulelike state, whose structure cannot be reconciled with the known crystallographic model obtained for the holoprotein. Two global analyses have thus been realized on holohexameric and holo-CaeSS2 samples, by changing in each set of curves the perturbant and salt concentrations, namely cGuHCl and cNaCl. Fitting curves in both semilogarithmic and Kratky forms are shown in Figs. 1–2, whereas the fitting parameters, i.e., χ2, free energies ΔGi°, and slopes βcj(i), are reported in Table 2. The partial  the Rg calculated from the p(r) (Eqs. 5–6), the scaling factors and the backgrounds (κm and Bm), the fractions αi, and the average aggregation numbers, ∑ni αi, for each SAXS curve, are reported in Table 3. For each set of samples, plots of the monomer fractions αi as functions of cGuHCl and cNaCl are shown in Fig. 6. It is worth notice that the two fits have been performed on 16 curves for CaeSS2 and 15 curves for hexamer Hc, leading in all cases to appreciable results. The global fit procedure has been then repeated 10 times by sampling each scattering curve within its experimental error. The errors on the fitting parameters have thus been obtained by calculating their values from each data set and, finally, their standard deviation from the first value.
FIGURE 4.

Form factors Pi(Q) for the monomer, the hexamer, the dodecamer, and the icosatetramer calculated by the Monte Carlo tool. Points refer to the native holohexamer SAXS curve fitted with the only form factor corresponding to the hexameric state.
FIGURE 5.

Global fit of holo- (circles) and apo- (triangles) CaeSS2 subunits, and holo- (squares) and apo- (diamonds) hexamers, at 3.5 M GuHCl, according to the wormlike model. See Results and Discussion.
TABLE 2.
Thermodynamic parameters obtained from the global fit
| χ2 | CaeSS2 Hc | Hexameric Hc | |
|---|---|---|---|
| 0.34 | 0.40 | ||
| ΔGA1° | (kJ/mol) | −112.8 ± 0.9 | −155 ± 1 |
| ΔGA2° | (kJ/mol) | 500 ± 100 | 400 ± 100 |
| ΔGA3° | (kJ/mol) | 200 ± 100 | 100 ± 100 |
| ΔGD° | (kJ/mol) | 120 ± 10 | 140 ± 20 |
 |
0.32 ± 0.04 | −0.01 ± 0.07 | |
 |
−0.9 ± 0.5 | −0.8 ± 0.2 | |
 |
−1.1 ± 0.5 | −0.7 ± 0.3 | |
 |
−0.7 ± 0.1 | −0.53 ± 0.07 | |
 |
0.05 ± 0.01 | 4 ± 1 | |
 |
3 ± 1 | −0.34 ± 0.01 | |
 |
3 ± 1 | −0.4 ± 0.3 | |
 |
−0.3 ± 0.1 | 5 ± 2 |
ΔG° is the free energies of denaturation (D), and of monomer-to-hexamer (A1), hexamer-to-dodecamer (A2), and dodecamer-to-icosatetramer (A3) aggregation. β is a fitting parameter representing the correlation coefficient between free energy and GuHCl or NaCl concentration.
TABLE 3.
Fitting parameters of the single SAXS curves at different GuHCl and NaCl conditions obtained from the global fits of hexameric and CaeSS2 Hc
 |
Rg(Å) | κm (a.u. cm) | Bm (102 a.u.) | α1 | α6 | α12 | α24 | αD | ∑niαi | |
|---|---|---|---|---|---|---|---|---|---|---|
| Hexameric Hc | ||||||||||
| GuHCl (M) | ||||||||||
| 0.00 | 0.79 | 49 ± 1 | 47.5 ± 0.4 | 9 ± 1 | 0.075 ± 0.008 | 0.925 ± 0.008 | – | – | – | 5.62 ± 0.06 |
| 0.50 | 0.61 | 49 ± 1 | 41.4 ± 0.8 | 8 ± 2 | 0.08 ± 0.02 | 0.92 ± 0.02 | – | – | – | 5.6 ± 0.1 |
| 1.00 | 1.27 | 49 ± 1 | 46 ± 1 | 20 ± 4 | 0.09 ± 0.03 | 0.92 ± 0.03 | – | – | – | 5.6 ± 0.2 |
| 1.25 | 0.57 | 64 ± 1 | 42.9 ± 0.6 | 11 ± 7 | 0.08 ± 0.03 | 0.5 ± 0.3 | 0.4 ± 0.2 | – | – | 8 ± 4 |
| 1.50 | 1.01 | 73 ± 1 | 55.5 ± 0.7 | 67 ± 9 | 0.005 ± 0.004 | – | 1.0 ± 0.6 | 0.0 ± 0.3 | – | 12 ± 15 |
| 1.75 | 0.52 | 82 ± 2 | 45 ± 62 | 54 ± 26 | – | – | 0.4 ± 0.3 | 0.6 ± 0.4 | – | 19 ± 13 |
| 2.50 | 0.48 | 226 ± 5 | 44 ± 34 | 6 ± 3 | – | – | – | 0.015 ± 0.007 | 0.985 ± 0.007 | 1.3 ± 0.2 |
| 3.50 | 0.35 | 258 ± 5 | 49 ± 7 | 12 ± 1 | – | – | – | – | 1.000 | 1.000 |
| NaCl (M) | ||||||||||
| 0.00 | 0.79 | 49 ± 1 | 47.5 ± 0.4 | 9 ± 1 | 0.075 ± 0.008 | 0.925 ± 0.008 | – | – | – | 5.62 ± 0.06 |
| 0.50 | 0.57 | 49 ± 1 | 56.1 ± 0.2 | 36 ± 3 | – | 1.000 | – | – | – | 6.000 |
| 1.00 | 0.42 | 49.2 ± 0.8 | 48.1 ± 0.1 | 10.1 ± 0.7 | – | 1.000 | – | – | – | 6.000 |
| 1.25 | 0.33 | 49.2 ± 0.9 | 43.6 ± 0.1 | 9.0 ± 0.6 | – | 1.000 | – | – | – | 6.000 |
| 1.50 | 0.38 | 49.2 ± 0.8 | 55.1 ± 0.2 | 38 ± 1 | – | 1.000 | – | – | – | 6.000 |
| 1.75 | 0.40 | 49 ± 1 | 53.7 ± 0.1 | 50 ± 2 | – | 1.000 | – | – | – | 6.000 |
| 2.00 | 0.55 | 49 ± 1 | 54.9 ± 0.2 | 35 ± 2 | – | 1.000 | – | – | – | 6.000 |
| 2.50 | 0.62 | 49.2 ± 0.9 | 52.8 ± 0.2 | 44 ± 3 | – | 1.000 | – | – | – | 6.000 |
| 3.00 | 0.44 | 57 ± 1 | 47 ± 12 | 38 ± 6 | – | 0.9 ± 0.2 | 0.03 ± 0.05 | 0.04 ± 0.02 | – | 7 ± 2 |
| CaeSS2 Hc | ||||||||||
| GuHCl (M) | ||||||||||
| 0.00 | 0.80 | 30.0 ± 0.7 | 51.7 ± 0.6 | 3 ± 1 | 0.989 ± 0.005 | 0.011 ± 0.005 | – | – | – | 1.06 ± 0.04 |
| 0.50 | 0.43 | 46.5 ± 0.9 | 47 ± 2 | 61 ± 3 | 0.54 ± 0.04 | 0.46 ± 0.06 | – | – | – | 3.3 ± 0.9 |
| 1.25 | 0.61 | 85 ± 2 | 41 ± 2 | 62 ± 6 | 0.01 ± 0.04 | – | 0.001 ± 0.002 | 0.99 ± 0.05 | – | 24 ± 1 |
| 1.50 | 1.03 | 85 ± 2 | 42.1 ± 0.8 | 92.5 ± 0.5 | – | – | – | 1.00 ± 0.02 | 0.002 ± 0.001 | 24.0 ± 0.5 |
| 1.75 | 0.46 | 85 ± 1 | 54 ± 1 | 69 ± 1 | – | – | – | 0.96 ± 0.03 | 0.05 ± 0.02 | 23.0 ± 0.8 |
| 2.00 | 0.46 | 201 ± 2 | 40 ± 24 | 1 ± 1 | – | – | – | 0.0 ± 0.3 | 1.0 ± 0.5 | 2 ± 9 |
| 2.50 | 0.49 | 258 ± 6 | 55.9 ± 0.6 | 0.5 ± 0.1 | – | – | – | – | 1.000 | 1.000 |
| 3.00 | 0.19 | 258 ± 4 | 58 ± 3 | 7.0 ± 0.7 | – | – | – | – | 1.000 | 1.000 |
| NaCl (M) | ||||||||||
| 0.00 | 0.80 | 30.0 ± 0.7 | 51.7 ± 0.6 | 3 ± 1 | 0.989 ± 0.005 | 0.011 ± 0.005 | – | – | – | 1.06 ± 0.04 |
| 0.50 | 0.46 | 32.3 ± 0.5 | 56.8 ± 0.5 | 17 ± 2 | 0.970 ± 0.006 | 0.030 ± 0.006 | – | – | – | 1.15 ± 0.04 |
| 1.00 | 0.60 | 35.9 ± 0.7 | 51.1 ± 0.3 | 2.6 ± 0.7 | 0.931 ± 0.003 | 0.069 ± 0.003 | – | – | – | 1.34 ± 0.02 |
| 1.25 | 0.41 | 37.9 ± 0.8 | 46.4 ± 0.3 | 13.1 ± 0.5 | 0.902 ± 0.004 | 0.098 ± 0.004 | – | – | – | 1.49 ± 0.02 |
| 1.50 | 0.46 | 39.7 ± 0.9 | 58 ± 1 | 19 ± 1 | 0.867 ± 0.009 | 0.133 ± 0.009 | – | – | – | 1.67 ± 0.06 |
| 1.75 | 0.67 | 41.2 ± 0.7 | 52 ± 2 | 23 ± 3 | 0.83 ± 0.02 | 0.17 ± 0.02 | – | – | – | 1.9 ± 0.1 |
| 2.00 | 0.38 | 43 ± 1 | 57 ± 2 | 45 ± 4 | 0.78 ± 0.02 | 0.22 ± 0.02 | – | – | – | 2.1 ± 0.2 |
| 2.50 | 0.45 | 44.5 ± 0.9 | 43 ± 3 | 36 ± 4 | 0.69 ± 0.03 | 0.31 ± 0.05 | – | – | – | 2.5 ± 0.7 |
 is the partial merit functional; Rg is the gyration radius calculated from the p(r); κm and Bm are the scaling factor and the flat background, respectively; αi is the monomer fraction in the ith form; and ∑niαi is the average aggregation number.
FIGURE 6.

Fraction of different aggregation forms present in samples of hexameric holoHc (A and C) and of holo-CaeSS2 (B and D) and in the presence of increasing GuHCl (A and B) or NaCl (C and D) concentrations. The αi values represent the fraction of the ith aggregation state (α1 = monomer, α6 = hexamer, α12 = dodecamer, α24 = isocosatetramer, and αD = denatured) under the various concentrations of GuHCl and NaCl. The lines refer to: α1 = solid line, α6 = long-dashed line, α12 = short-dashed line, α24 = dotted line, and αD = dashed-dotted line.
Results of each set of measurements can be summarized as follows. Hexameric holoHc retains its aggregation state, predominantly constituted by hexamers (accounting for 92% of total Hc) up to 1.25 M GuHCl (Fig. 6 A). In the range 1.25–2.50 M, a shift toward higher aggregation forms (dodecamers and icosatetramers) is observed. Above 2.5 M GuHCl complete dissociation and unfolding occurs. In contrast, when NaCl is added to the same Hc form (Fig. 6 C), there is no change in the fractions αi and the protein molecules keep their hexameric state. As far as the effects of GuHCl on holo-CaeSS2 Hc are concerned (Fig. 6 B), aggregation of hexamers is manifested already below 0.5 M GuHCl and up to 1.0 M. Higher aggregation phenomena are manifested by the increase of the fraction of icosatetramers in the range 1.0–2.0 M. Dissociation and denaturation occurs above 2.0 M. Finally, CaeSS2 retain its monomeric state up to ∼1.0 M NaCl. Then, a progressive increase of the hexameric fraction is observed (Fig. 6 D). Interestingly, the ΔGi° values of the monomer are very similar to those of the hexamer (Table 2), confirming that the present method is able to catch the essential physics of the aggregation and unfolding phenomena. Moreover, the small but significant difference in ΔGA1° can be related to the stabilization free-energy of the interacting subunits within the hexamer. While uncertainties on ΔGA1° and ΔGD° (referred to as hexamer formation and monomer unfolding, respectively) are rather small, much higher values are found for the other two equilibrium processes, namely ΔGA2° and ΔGA3°, indicating our SAXS data do not allow us to well discriminate between dodecamer and icosatetramer forms.
In conclusion, in the present work, we have described the effects of GuHCl and NaCl on the C. aestuarii Hc as resulting from synchrotron SAXS measurements. We have demonstrated a different behavior on the aggregation and denaturing properties of the non-reassociating monomeric CaeSS2 subunit and the hexameric Hc as well as a different stability against the perturbants exhibited by the holo- and apoforms of the same aggregation state. By describing the higher aggregation Hc states (dodecamers and icosatetramers) on the basis of the crystallographic models for the hexamer and the unfolded Hc states with the wormlike model, a combined analysis of the whole set of SAXS curves at different GuHCl and NaCl conditions has been performed. By modeling a scheme of thermodynamic equilibria in solution, transition free energies and their first-order derivatives on GuHCl and NaCl concentration have been derived. The original analysis method here described can be viewed as a general approach in studying aggregation and denaturation of protein in solution by SAXS.
Acknowledgments
C.V.T. thanks FAPESP-SP, Brazil, for a postdoctoral fellowship.
Cilâine Verônica Teixeira's present address is Max-Planck Institute for Colloids and Interfaces, Am Muehlenberg Haus 1, DE-14476 Golm, Germany.
Abbreviations used: Hc, hemocyanin; CaeSS2, structural subunit 2 of Carcinus aestuarii Hc.
References
- Ashton, A. W., M. K. Boehm, J. R. Gallimore, M. B. Pepys, and S. J. Perkins. 1997. Pentameric and decameric structures in solution of serum amyloid P component by x-ray and neutron scattering and molecular modelling analyses. J. Mol. Biol. 272:408–422. [DOI] [PubMed] [Google Scholar]
- Beltramini, M., E. Borghi, P. Di Muro, A. Magaldi, A. La Monaca, B. Salvato, C. Santini, and G. Tognon. 1993. SAXS on invertebrate dioxygen carriers. J. Phys. IV. C8 3:249–252. [Google Scholar]
- Beltramini, M., E. Borghi, P. Di Muro, A. La Monaca, B. Salvato, and C. Santini. 1996. The use of SAXS in the study of quaternary organisation of giant proteins. J. Mol. Struct. 383:231–236. [Google Scholar]
- Beltramini, M., P. Di Muro, R. Favilla, A. La Monaca, P. Mariani, A. Sabatucci, B. Salvato, and P. L. Solari. 1999. SAXS investigations on the temperature dependence of the conformation of 5S hemocyanin subunit of Carcinus aestuarii. J. Mol. Struct. 475:73–82. [Google Scholar]
- Bonafe, C. F. S., J. R. V. Araujo, and J. L. Silva. 1994. Intermediate states of assembly in the dissociation of gastropod hemocyanin by hydrostatic pressure. Biochemistry. 33:2651–2660. [DOI] [PubMed] [Google Scholar]
- Bubacco, L., R. S. Magliozzo, M. Beltramini, B. Salvato, and J. Peisach. 1992. Preparation and spectroscopic characterization of a coupled binuclear center in Co(II) substituted hemocyanin. Biochemistry. 31:9294–9303. [DOI] [PubMed] [Google Scholar]
- Calmettes, P., D. Durand, P. Minard, M. Desmadril, V. Receveur, and J. C. Smith. 1994. How random is a highly denatured protein? Biophy. Chem. 53:105–114. [DOI] [PubMed] [Google Scholar]
- Cinelli, S., F. Spinozzi, R. Itri, F. Carsughi, G. Onori, and P. Mariani. 2001. Structural characterisation of the pH-denatured states of ferricytochrome-c by synchrotron small angle x-ray scattering. Biophys. J. 81:3522–3533. [DOI] [PMC free article] [PubMed] [Google Scholar]
- Dainese, E., P. Di Muro, M. Beltramini, B. Salvato, and H. Decker. 1998. Subunits composition and allosteric control in Carcinus aesturarii hemocyanin. Eur. J. Biochem. 256:350–358. [DOI] [PubMed] [Google Scholar]
- Debye, P. 1947. Molecular-weight determination by light scattering. J. Phys. Coll. Chem. 51:18–32. [DOI] [PubMed] [Google Scholar]
- Debye, P., and E. Hückel. 1923. Zur Theorie der Elektrolyte. I. Gefrierpunktserniedrigung und verwandte Erscheinungen. 24:185–206. [Google Scholar]
- Decker, H., H. Hartmann, R. Sterner, E. Schwarz, and I. Pilz. 1996. Small-angle x-ray scattering reveals differences between the quaternary structures of oxygenated and deoxygenated tarantula hemocyanin. FEBS Lett. 393:226–230. [DOI] [PubMed] [Google Scholar]
- Dill, K. A., and D. Shortle. 1991. Denatured states of proteins. Annu. Rev. Biochem. 60:795–825. [DOI] [PubMed] [Google Scholar]
- Durstewitz, G., and N. B. Terwilliger. 1997. cDNA cloning of a developmentally regulated hemocyanin subunit in the crustacean Cancer magister and phylogenetic analysis of the hemocyanin gene family. Mol. Biol. Evol. 14:266–276. [DOI] [PubMed] [Google Scholar]
- Favilla, R., M. Goldoni, A. Mazzini, P. Di Muro, B. Salvato, and M. Beltramini. 2002a. Guanidinium chloride induced unfolding of a hemocyanin subunit from Carcinus aestuarii. I. Apo form. Biochim. Biophys. Acta. 1597:42–50. [DOI] [PubMed] [Google Scholar]
- Favilla, R., M. Goldoni, F. Del Signore, P. Di Muro, B. Salvato, and M. Beltramini. 2002b. Guanidinium chloride induced unfolding of a hemocyanin subunit from Carcinus aestuarii. II. Holo form. Biochim. Biophys. Acta. 1597:51–59. [DOI] [PubMed] [Google Scholar]
- Feigin, L. A., and D. I. Svergun. 1987. Structure analysis by small-angle x-ray and neutron scattering. New York, Plenum Press.
- Flory, P. 1971. Principles of Polymer Chemistry. Cornell University Press, Ithaca, NY.
- Gaykema, W. P. J., W. G. J. Hol., J. M. Vereijken, N. M. Soeter, H. J. Bak, and J. J. Beintema. 1984. A structure of the copper-containing oxygen-carrying protein Palinurus interruptus hemocyanin. Nature. 309:23–29. [Google Scholar]
- Grossmann, J. G., S. A. Ali, A. Abbasi, Z. Zaidi, S. Stoeva, W. Voelter, and S. S. Hasnain. 2000. Low-resolution molecular structures of isolated functional units from arthropodan and molluscan hemocyanin. Biophys. J. 78:977–981. [DOI] [PMC free article] [PubMed] [Google Scholar]
- Guinier, A., and G. Fournet. 1955. Small Angle Scattering of X-Rays. Wiley, New York.
- Hansen, S. 1990. Calculation of small-angle scattering profiles using Monte Carlo simulation. J. Appl. Crystallogr. 23:344–346. [Google Scholar]
- Hartmann, H., and H. Decker. 2002. All hierarchical levels are involved in conformational transitions of the 4 × 6-meric tarantula hemocyanin upon oxygenation. Biochim. Biophys. Acta. 1601:132–137. [DOI] [PubMed] [Google Scholar]
- Hartmann, H., B. Lohkamp, N. Hellmann, and H. Decker. 2001. The allosteric effector L-lactate induces a conformational change of 2 × 6-meric lobster hemocyanin in the oxy state as revealed by small angle x-ray scattering. J. Biol. Chem. 276:19954–19958. [DOI] [PubMed] [Google Scholar]
- Hazes, B., K. A. Magnus, C. Bonaventura, J. Bonaventura, Z. Dauter, K. H. Kalk, and W. G. Hol. 1993. Crystal structure of deoxygenated Limulus polyphemus subunit II hemocyanin at 2.18 Ångstroms resolution: clues for a mechanism for allosteric regulation. Protein Sci. 2:597–619. [DOI] [PMC free article] [PubMed] [Google Scholar]
- Henderson, S. J. 1996. Monte Carlo modelling of small-angle scattering data from non-interacting homogeneous and heterogeneous particles in solution. Biophys. J. 70:1618–1627. [DOI] [PMC free article] [PubMed] [Google Scholar]
- Herskovits, T. T., M. W. Russell, and S. E. Carberry. 1984. Light-scattering investigation of the subunit structure and sequential dissociation of Homarus americanus hemocyanin. Biochemistry. 23:1875–1881. [Google Scholar]
- Hübler, R., B. Fertl, N. Hellmann, and H. Decker. 1998. On the stability of the 24-meric hemocyanin from Eurypelma californicum. Biochim. Biophys. Acta. 1383:327–339. [DOI] [PubMed] [Google Scholar]
- Jacrot, B. 1976. The study of biological structures by neutron scattering from solution. Rep. Prog. Phys. 39:911–953. [Google Scholar]
- Jacrot, B., and G. Zaccai. 1981. Determination of molecular weight by neutron scattering. Biopolymers. 20:2413–2426. [Google Scholar]
- Kataoka, M., I. Nishii, T. Fujisawa, T. Ueki, F. Tokunaga, and Y. Goto. 1995. Structural characterization of molten globule and native states of apomyoglobin by solution x-ray scattering. J. Mol. Biol. 249:215–228. [DOI] [PubMed] [Google Scholar]
- Kataoka, M., Y. Hagihara, K. Mihara, and Y. Goto. 1993. Molten globule of cytochrome c studied by the small angle x-ray scattering. J. Mol. Biol. 229:591–596. [DOI] [PubMed] [Google Scholar]
- Kozin, M. B., V. V. Volkov, and D. I. Svergun. 1997. ASSA—a program for three-dimensional rendering in solution scattering from biopolymers. J. Appl. Crystallogr. 30:811–815. [Google Scholar]
- Kratky, O., and G. Porod. 1949. Röntgenuntersuchung gelöster faden-moleküle. Rec. Trav. Chim. Pays-Bas. 68:1106–1123. [Google Scholar]
- Linzen, B., N. M. Soeter, A. F. Riggs, H. J. Schneider, W. Schartau, M. D. Moore, E. Yokota, P. Q. Behrens, H. Nakashima, T. Takagi, T. Nemoto, J. M. Vereijken, H. J. Bak, J. J. Beintema, A. Voldeba, W. P. J. Gaykema, and W. G. J. Hol. 1985. The structure of arthropod hemocyanins. Science. 229:519–524. [DOI] [PubMed] [Google Scholar]
- Magnus, K. A., E. E. Lattman, A. Volbeda, and W. G. J. Hol. 1991. Hexamers of subunit II from Limulus hemocyanin (a 48-mer) have the same quaternary structure as whole Panulirus hemocyanin molecules. Proteins Struct. Funct. Gen. 9:240–247. [DOI] [PubMed] [Google Scholar]
- Mangum, C. P., J. Greaves, and J. S Rainer. 1991. Oligomer composition and oxygen binding of the hemocyanin of the blue crab Callinectes sapidus. Biol. Bull. 181:453–458. [DOI] [PubMed] [Google Scholar]
- Mariani, P., F. Carsughi, F. Spinozzi, S. Romanzetti, G. Meier, R. Casadio, and C. M. Bergamini. 2000. Ligand-induced conformational changes in tissue transglutaminase: Monte Carlo analysis of small-angle scattering data. Biophys. J. 78:3240–3251. [DOI] [PMC free article] [PubMed] [Google Scholar]
- Markl, J., A. Hofer, G. Bauer, A. Markl, B. Kempter, M. Brenzinger, and B. Linzen. 1979a. Subunit heterogeneity in arthropod hemocyanin: crustacea. J. Comp. Physiol. 133:167–175. [Google Scholar]
- Markl, J., A. Markl, W. Schartau, and B. Linzen. 1979b. Subunit heterogeneity in arthropod hemocyanin: chelicerata. J. Comp. Physiol. 130:283–292. [Google Scholar]
- Markl, J., and H. Decker. 1992. Molecular structure of the arthropod hemocyanins. In Advances of Environmental Biochemistry and Physiology. C.P. Mangum, editor. Springer-Verlag, Berlin, Germany. pp.325–376.
- Molon, A., P. Di Muro, L. Bubacco, V. Vasilyev, B. Salvato, M. Beltramini, W. Conze, N. Hellmann, and H. Decker. 2000. Molecular heterogeneity of the hemocyanin isolated from the king crab Paralithodes camtschaticae. Eur. J. Biochem. 267:7046–7057. [DOI] [PubMed] [Google Scholar]
- Pedersen, J. S., and P. Schurtenberger. 1996. Scattering functions of semi-flexible polymers with and without excluded volume effects. Macromolecules. 29:7602–7612. [Google Scholar]
- Miller, K. I., and K. E. van Holde. 1974. Oxygen binding by Callianassa californiensis hemocyanin. Biochemistry. 13:1668–1674. [DOI] [PubMed] [Google Scholar]
- Pérez, J., P. Vachette, D. Russo, M. Desmadril, and D. Durand. 2001. Heat-induced unfolding of neocarzinostatin, a small all-protein investigated by small-angle x-ray scattering. J. Mol. Biol. 308:721–743. [DOI] [PubMed] [Google Scholar]
- Pilz, I., K. Goral, M. Hoylaerts, R. Witters, and R. Lontie. 1980. Studies by small-angle x-ray scattering of the quaternary structure of the 24-S component of the haemocyanin of Astacus leptodactylus in solution. Eur. J. Biochem. 105:539–543. [DOI] [PubMed] [Google Scholar]
- Pollack, L., M. W. Tate, N. C. Darnton, J. B. Knight, S. M. Gruner, W. A. Eaton, and R. H. Austin. 1999. Compactness of the denatured state of a fast-folding protein measured by submillisecond small angle x-ray scattering. Proc. Natl. Acad. Sci. USA. 96:10115–10117. [DOI] [PMC free article] [PubMed] [Google Scholar]
- Salvato, B., and M. Beltramini. 1990. Hemocyanins: molecular architecture, structure and reactivity of the binuclear copper active site. Life Chem. Rep. 8:1–47. [Google Scholar]
- Semisotnov, G. V., H. Kihara, N. V. Kotova, K. Kimura, Y. Amemiya, K. Wakabayashi, I. N. Serdyuk, A. A. Timchenko, K. Chiba, K. Nikaido, T. Ikura, and K. Kuwajima. 1996. Protein globularization during folding. A study by synchrotron small-angle x-ray scattering. J. Mol. Biol. 262:559–574. [DOI] [PubMed] [Google Scholar]
- Spinozzi, F., F. Carsughi, and P. Mariani. 1998. Particle shape reconstruction by small-angle scattering. Integration of group theory and maximum entropy to multipole expansion method. J. Chem. Phys. 109:10148–10158. [Google Scholar]
- Sterner, R., T. Vogl, H. J. Hinz, F. Penz, R. Hoff, R. Foll, and H. Decker. 1995. Extreme thermostability of tarantula hemocyanin. FEBS Lett. 364:9–12. [DOI] [PubMed] [Google Scholar]
- Svergun, D. I. 1997. Restoring three-dimensional structure of biopolymers from solution scattering. J. Appl. Crystallogr. 30:792–797. [Google Scholar]
- Svergun, D., C. Barberato, and M. H. J. Koch. 1995. CRYSOL—a program to evaluate x-ray solution scattering of biological macromolecules from atomic coordinates. J. Appl. Crystallogr. 28:768–773. [Google Scholar]
- Taveau, J. C., N. Boisset, J. Lamy, O. Lambert, and J. N. Lamy. 1997. Three-dimensional reconstruction of Limulus polyphemus hemocyanin from cryoelectron microscopy. J. Mol. Biol. 266:1002–1015. [DOI] [PubMed] [Google Scholar]
- Trewhella, J. 1997. Insights into biomolecular function from small-angle scattering. Curr. Opin. Struct. Biol. 7:702–708. [DOI] [PubMed] [Google Scholar]
- van Holde, K. E., and K. I. Miller. 1995. Hemocyanins. Adv. Prot Chem. 47:1–81. [DOI] [PubMed] [Google Scholar]
- Voit, R., G. Feldmaier-Fuchs, T. Schweikardt, H. Decker, and T. Burmester. 2000. Complete sequence of the 24-mer hemocyanin of the tarantula Euryplema californicum. J. Biol. Chem. 275:39339–39344. [DOI] [PubMed] [Google Scholar]
- Volbeda, A., and W. G. J. Hol. 1989a. Crystal structure of hexameric hemocyanin from Panulirus interruptus refined at 3.2 Å resolution. J. Mol. Biol. 209:249–279. [DOI] [PubMed] [Google Scholar]
- Volbeda, A., and W. G. J. Hol. 1989b. Pseudo twofold symmetry in the copper-binding domain of arthropodan haemocyanins. J. Mol. Biol. 206:531–546. [DOI] [PubMed] [Google Scholar]
- Zlateva, T., P. Di Muro, B. Salvato, and M. Beltramini. 1996. The o-diphenol oxidase activity of arthropod hemocyanin. FEBS Lett. 384:251–254. [DOI] [PubMed] [Google Scholar]