Abstract
Evidence for ligand migration toward the xenon-binding cavities in myoglobin comes from a number of laser photolysis studies of MbO2 including mutants and from cryo- and time-resolved crystallography of MbCO. To explore ligand migration in greater detail, we investigated the rebinding kinetics of both MbO2 and MbCO under a xenon partial pressure ranging from 1 to 16 atm over the temperature range (293–77 K). Below 180 K xenon affects to a significant, but minor, extent the thermodynamic parameters for rebinding from the primary docking site in each Mb taxonomic substate. Above 200 K the ligand migrates to the proximal Xe1 site but when the latter is occupied by xenon a new kinetic process appears. It is attributed to rebinding from transient docking sites located on the path between the primary and the secondary docking site of both ligands. Ligand escape exhibits a more complicated pattern than expected. At room temperature O2 and CO escape appears to take place exclusively from the primary site. In contrast, at T ≈ 250 K, roughly 50% of the CO molecules that have escaped from the protein originate from the Xe1 secondary site.
INTRODUCTION
Although their existence was recognized more than 20 years ago (Richards, 1977), internal cavities in small globular proteins have long been considered just as packing defects at the junction of helices. Such cavities, with volume in the range of 30–100 Å3, are generally hydrophobic and have the distinctive feature of being able to bind xenon by noncovalent specific interactions. Thus, x-ray diffraction studies of myoglobin (Mb) revealed the presence of four cavities (Tilton et al., 1984). Xe1 and Xe4 are situated on the proximal and on the distal heme side respectively, Xe2 is intermediary, and Xe3 resides near the surface, far from the iron atom. The affinity of Xe1 for xenon exceeds that of Xe2, Xe3, and Xe4 by more than one order of magnitude.
Protein cavities arouse increasing interest because of their probable role in ligand migration. Early molecular dynamic simulations suggested that in myoglobin the CO ligand may migrate through a limited number of pathways involving docking sites that correspond to protein cavities (Elber and Karplus, 1990; Tilton et al., 1984, 1986). Experimental evidence for ligand migration in myoglobin cavities comes from a number of laser photolysis kinetic studies of wild-type (WT) and mutated Mb, and more recently from trapped intermediate and time-resolved crystallography.
The idea that ligands might possibly compete with xenon for the occupation of protein cavities was put forward by Q. Gibsons's group who showed that MbO2 rebinding kinetics were affected by xenon at a pressure up to 12 atm at room temperature (Scott and Gibson, 1997). Such flash photolysis investigations in solution have remained scarce and were limited to O2 and NO rebinding at physiological temperature (Brunori et al., 1999; Scott et al., 2001). They revealed that the O2 geminate rebinding kinetics with wild-type Mb and Mb mutants were biphasic, and that the slower phase often decreased or disappeared in the presence of xenon (Scott and Gibson, 1997). It was proposed that the fast and slow phases were due to oxygen rebinding from a primary and a secondary docking site, respectively. The effect of xenon on the slow phase led Gibson and co-workers to propose that the secondary site included Xe1 (Brunori et al., 1999; Brunori and Gibson, 2001; Scott and Gibson, 1997).
Single or multiple mutations at critical positions near the heme pocket or near the xenon-binding cavities also led to a mapping of the ligand migration pathway after dissociation. Mutations that inhibited the rapid movement of the ligand away from the iron atom and its access to Xe4 were reported to enhance rapid geminate recombination (Draghi et al., 2002; Ishikawa et al., 2001; Quillin et al., 1995; Carlson et al., 1994; Gibson et al., 1992). Mutations near the Xe4 pocket also had a pronounced effect on the geminate rebinding rates of NO, CO, and O2 and on the ligand migration pathways (Scott et al., 2001; Brunori et al., 1999; Scott and Gibson, 1997). The effect of the mutations was interpreted using molecular dynamics simulations (Draghi et al., 2002; Brunori et al., 1999; Carlson et al., 1996, 1994; Quillin et al., 1995; Li et al., 1993; Gibson et al., 1992). Trajectories for dissociated ligands have been calculated using either the ligand enhanced sampling algorithm (Elber and Karplus, 1990; Gibson et al., 1992) or the single-ligand rebinding protocol (Li et al., 1993). The final picture that emerges from these studies is that ligands do not diffuse randomly but take preferred directions in moving away from the iron, ultimately reaching secondary well-defined sites that correspond to the Xe4 and Xe1 cavities.
Time-resolved crystallography at room temperature (Srajer et al., 1996, 2001) as well as investigations of trapped intermediates excited under photostationary conditions at cryogenic temperatures (Brunori, 2000; Chu et al., 2000; Ostermann et al., 2000; Teng et al., 1997, 1994; Hartmann et al., 1996; Schlichting et al., 1994) have produced evidence for multiple CO docking sites in wild-type and mutant myoglobins. Below 40 K the photodissociated CO was located near the heme, above pyrrole C. This location is regarded as the primary docking site of the ligand. In experiments performed above 160 K, CO has been found to occupy the proximal Xe1 site. Exceptionally, CO has been located also near Xe4 in crystals of mutants of SW Mb in which specific mutations were reported to sterically hinder ligands in the primary docking site at 20–80 K (Brunori, 2000; Ostermann et al., 2000). Because of the difficulty of detecting sites with small ligand occupancy in the crystal, and because the data refer to different proteins, the path actually followed by the ligand between the primary docking site and the proximal Xe1 cavity remains unknown. Thus, despite their great interest, diffraction data do not provide a continuous view of ligand migration. Moreover, although all crystallographic results have been obtained with CO as a ligand, solution rebinding kinetics of MbCO in the presence of xenon have not been reported yet.
Competition with xenon for the occupation of strategic sites also provides a means for testing hypotheses about the route followed by those ligands that accomplish their migration without rebinding and that ultimately escape from the protein. In their study of O2 rebinding with WT and 24 mutants of SW Mb at room temperature, Scott and Gibson (1997) reported that in most cases the total fraction of geminate rebinding does not change significantly upon addition of 12 atm of xenon; they concluded that ligands do not enter or leave the protein via the xenon sites, but escape from the primary state through the histidine gate identified long ago (Perutz and Matthews, 1966). This view was subsequently supported by investigations of 90 Mb mutants mapping the pathways of ligand migration (Scott et al., 2001). In a recent NMR study, McNaughton et al. (2003) determined the equilibrium binding constants of O2 for the 4 Xe cavities of Zn-Mb. Combining their data with earlier kinetics measurements and time-resolved Laue diffraction results, they also concluded that the majority of O2 exits via the histidine gate pathway.
This work is an attempt to explore ligand migration in more detail and in particular to fill the gaps between crystal studies of MbCO and solution kinetics of MbO2. To this end we have investigated the solution rebinding kinetics of both MbO2 and MbCO under a xenon partial pressure ranging from 1 to 16 atm and in a wide temperature range (293–77 K).
MATERIALS AND METHODS
Sample preparation and data collection
Lyophilized sperm whale (SW) Mb (Serva, Heidelberg, Germany) that had been kept in liquid nitrogen was dissolved in 79% (w/w) glycerol (glass transition temperature Tg ≈ 173 K) at a final concentration of 10–25 μM Mb in 50 mM buffer (potassium citrate: phosphate or potassium phosphate for pH 4.8 and 7.3, respectively). The ferrous CO-complexes were prepared by passing a stream of CO above the protein solution submitted to gentle stirring, and by adding a few microliters of a concentrated deaerated dithionite solution. The oxygenated complexes were prepared by passing a stream of argon above the solution, and equilibrating with air after reduction with sodium dithionite. Ligand binding was controlled by following the absorbance change in the Soret.
Xenon was introduced over the protein solution placed in homebuilt cylindrical optical cells withstanding up to 20 atm pressure. The pressure system allowed for flushing with various gases to achieve the assigned partial pressure of xenon and gaseous ligands. The liquid phase was equilibrated with the gas mixtures at 20°C for at least five hours under gentle stirring with a small magnetic bar. Under these conditions kinetic measurements with pure CO between 1 and 20 atm indicated that equilibration was complete as shown by the proportionality of the bimolecular rebinding rate to the CO pressure. For kinetics measurements, the cell was tightly closed, disconnected from the pressure system and introduced into a DN704 cryostat (Oxford Instruments, Oxford, UK). Although the gas pressure decreased approximately threefold upon cooling, reequilibration of the dissolved gases due to pressure change or to change of solubility with temperature is not expected to occur over the duration of the experiments, owing to the very high viscosity of the cold glycerol/water solvent. The solubility of xenon at room temperature was taken as 4.4 mM/atm in water (Rubin et al., 2002), and 1.1 mM/atm in 79% glycerol, assuming a reduction factor of the solubility due to the presence of 79% glycerol similar to that measured for O2 (Lavalette and Tetreau, 1988).
Rebinding kinetics were recorded at 10–20 K intervals. The cooling rate was ∼2 K/min at T ≫ Tg and 0.5 K/min around Tg, and the protein was allowed to equilibrate for an additional 15 min once the desired temperature was reached. Photodissociation was achieved by the 10-ns pulse of the second harmonic (532 nm) of a Q-switched Nd-YAG laser (Quantel, Les Ulis, France). Transient absorption changes were recorded over two decades in amplitude and six to seven decades in time using our fast kinetic spectrometer setup (Tetreau et al., 1997). The kinetics were determined at low spectral resolution in the Soret absorption band of the deliganded (penta-coordinated heme) species between 293 and 77 K. The advantages of low spectral resolution for resolving subtle details in the rate spectra have been previously discussed (Tetreau et al., 2002).
Distribution of rate parameters
Geminate rebinding is a first-order process. Bimolecular rebinding is a second-order process but, at the ligand concentrations used here, pseudo-first order conditions are fulfilled. However, actual rebinding kinetics are never exponential. Above the glass transition temperature of the solvent (T > Tg) this is due to the presence of multiple rebinding processes (one bimolecular and several geminate); at T < Tg to the presence of a wide distribution of CS1 conformers that do not interconvert. In addition, Mb may exist in up to three taxonomic conformers (CS°) (Alben et al., 1982).
Independently of the underlying physical processes, the complex kinetics of such heterogeneous systems are expressed by:
 |
(1) |
in which the probability density of finding the rate k in the ensemble is expressed in log form for convenience. For a series of discrete exponential terms, P(log k) collapses into delta functions. Equation 1 underscores the fact that the rate distribution (or rate spectrum), P(log k), constitutes an alternative but equivalent description of the kinetics. However, the rate distribution is considerably more convenient for displaying, analyzing, and comparing complex processes, in a similar way as is the Fourier frequency spectrum of a complex sound. Thus, all results described below are shown as rate distributions. We obtain P(log k) from the observed kinetics N(t) by Laplace inversion of Eq. 1 using the maximum entropy method (MEM) starting from a set of logarithmically spaced and equiprobable k values (Lavalette et al., 1991; Steinbach et al., 1991). Methodological details can be found in Tetreau et al. (1997).
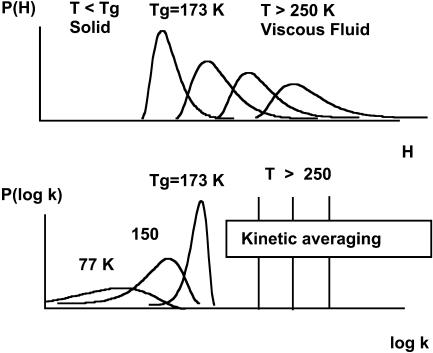
For a better understanding of the various kinetic regimes that will be dealt with in this work, we present a brief summary of the pertinent background. Consider first a protein with one unique “isoform”, i. e., only one taxonomic state (CS0). Such a protein displays only statistical conformational substates, CS1, that give rise to a continuous distribution of the rebinding enthalpy P(H). At thermodynamical equilibrium, CS1 substates permanently interconvert but their proportions necessarily obey Boltzmann's distribution. Consequently P(H) shifts and narrows upon decreasing the temperature (Fig. 1).
FIGURE 1.
Connection between enthalpy distribution (top) and rate parameter distribution (bottom) with temperature for a protein displaying only CS1 statistical conformational substates. Tg refers to 79% (w/w) glycerol/water.
Below Tg, CS1 substates cannot interconvert. The system becomes a frozen, heterogeneous, and nonequilibrium ensemble. Thus, at T < Tg, the ensemble is characterized by one unique distribution P(H, Tg). Because rebinding rates are connected with enthalpy by the Arrhenius/Eyring relations, the ensemble is also kinetically heterogeneous and displays a distribution of rebinding rates P(log k) that can be derived from P(H, Tg) if T, the temperature of the measurement and A, the preexponential factor, are known. P(log k) shifts and broadens upon lowering the temperature below Tg. The overall survival fraction N(t) of unrecombined proteins in the ensemble is given by Eq. 1. In the opposite, knowledge of P(log k) at several temperatures permits to determine A and P(H, Tg) (Tetreau et al., 1997).
At T ≫ Tg, in contrast, P(H) varies with temperature but the link with the corresponding P(log k) is lost, because kinetic averaging sets in. Kinetic averaging takes place when the interconversion rate among the statistical substates becomes larger than the rate of the rebinding reaction. Although the ensemble remains thermodynamically heterogeneous, it appears kinetically homogeneous; i.e., it gives rise to a simple exponential rebinding N(t) = exp(−〈k〉t), whose rate parameter is the statistical average of the rate parameters of all CS1 substates.
 |
(2) |
If, like Mb, a protein displays more than one taxonomic form, the above description applies to each individual CS0 independently. In favorable cases, the low temperature rate spectra P(log k) can be analyzed in terms of several distinct CS0 distributions, each of which is characterized by a {Ai; Pi(H,Tg)} pair (Tetreau et al., 2002).
In the high temperature regime, taxonomic CS0 states themselves become interconvertible. They undergo kinetic averaging and cannot be kinetically distinguished.
Analyzing rate spectra
Low-temperature regime: Gaussian decomposition of activation enthalpies
Despite their unimodal appearance, the low temperature rate spectra of MbCO and MbO2 are a superposition of up to three processes corresponding to rebinding in the taxonomic substates CS0 (Tetreau et al., 2002). To quantify the effect of xenon upon rebinding, we use the temperature invariance of P(H, Tg). We consider the series of rate spectra obtained at different temperatures below Tg and perform a global parametric fit of all P(log k, T) by developing the enthalpy distribution into a sum of temperature invariant Gaussian components:
 |
(3) |
in which the weighting factors of the CS0, αi, remain constant at all temperatures lower than Tg.
The global fit is performed subject to the constraint that enthalpy and rate remain connected by the Eyring relation:
 |
(4) |
with T0 = 100 K.
High-temperature regime: Gaussian decomposition of rate spectra
Above Tg kinetic averaging takes place. Its extent cannot be known a priori, but it is expected to increase with temperature. Several geminate bands are observed, due to rebinding processes occurring from different docking sites of the ligand (see discussion below). Because the two-ways connection with P(H) is lost, the analysis must now be based upon the rate spectra obtained at a fixed temperature with variable xenon pressure. To this end, PT(log k) was fitted with a sum of log-normal components:
 |
(5) |
Because xenon does not significantly affect the protein structure (Tilton et al., 1984), we assume that only the relative amplitudes of the various rate processes change with xenon pressure. To increase accuracy, P(log k) of at least three to four experiments repeated at fixed xenon pressure and temperature were globally analyzed to find their best common Gaussian decomposition from which the “average” P(log k) was obtained. A global Gaussian fit of the series of the average rate spectra obtained at different xenon pressures and constant temperature was finally performed according to Eq. 5.
RESULTS AND DISCUSSION
Xenon sites occupancy in Mb
The proximal (Xe1) site is the most prominent one that binds xenon, the affinity for the other sites being about one order of magnitude less than for Xe1 (Tilton et al., 1984). In the section entitled “Ligand migration above 200 K,” we shall show that for Xe1 p1/2 ≈ 0.4 and ≈0.08 atm at 200 K and 173 K, respectively in 79% w/w glycerol/water.
Taxonomic conformational substates in the presence of xenon (T < Tg)
Below Tg, ligand migration and escape from the protein are prevented by the rigidity of the medium. One single geminate rebinding process, GI, is seen. As the unique process observed when all motions are frozen (T < Tg), GI is attributed to ligand rebinding from the primary site. It is largely nonexponential because, even under spectral monitoring in the Soret, it is actually a superposition of recombinations in the taxonomic substates A0, A1, and A3 (pH 4.8) or A1 and A3 (pH ≥ 7), each of them displaying a distribution of statistical conformers reacting at different rates (Tetreau et al., 2002).
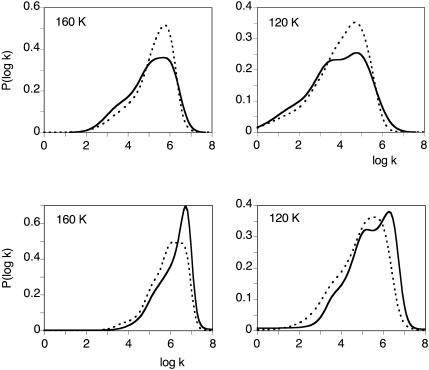
GI remains observable up to room temperature, although with variations in shape and amplitude. The rate distributions of CO rebinding with SW Mb in the presence of 10 atm of xenon (solid lines) are compared in Fig. 2 with those previously determined in the absence of xenon (Tetreau et al., 2002). Small, but significant, differences are noted between the rate spectra at both pH.
FIGURE 2.
Normalized P(log k) rate spectra of CO geminate rebinding with Mb at T < Tg in the absence (dotted lines) and in the presence (solid lines) of 10 atm xenon. The solvent was 79% glycerol water (w/w) at pH 7.3 (top) and 4.8 (bottom).
No measurements could be performed at T < Tg with MbO2 because of its low photolysis quantum yield. At the high laser energy required to obtain a good signal the beam systematically caused the cracking of the glassy sample in the cylindrical cell used to apply the xenon pressure.
Xenon is not expected to alter much the protein structure (Tilton et al., 1984) but small local structural changes might affect the properties of the various CS°. To quantify the changes in terms of thermodynamic parameters, we analyzed the data in the presence of xenon using the same procedure as previously described in details (Tetreau et al., 2002). Our assumptions were that the number of potential taxonomic CS° substates is at most equal to three and that their P(H, Tg) is pH independent. Again it was found that, as in the absence of xenon, the only consistent description requires 3 CS° contributing to the kinetics recorded at pH 4.8 whereas only two are sufficient at pH 7.3. This fact is also supported by the shift toward higher values of the P(log k) spectra upon decreasing the pH that is roughly similar in the absence or in the presence of xenon and can be attributed to an emerging contribution of the A0 substate, which rebinds faster than A1 and A3. The fact that A0 appears at low pH independently of the presence of xenon is not surprising because this CS° corresponds to an alternative conformation of the distal histidine that occurs upon protonation (Vojtechovsky et al. 1999).
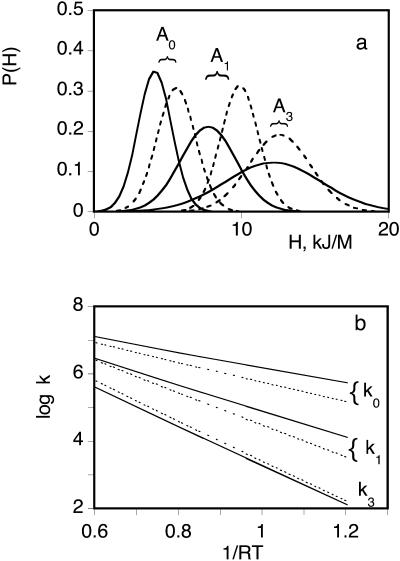
The enthalpy distributions P(H, Tg) are displayed in Fig. 3 a and compared with those previously reported in the absence of xenon (Tetreau et al., 2002). The preexponential factors and P(H, Tg) parameters are given in Table 1. Clearly, the presence of xenon affected both the enthalpy and preexponential factors for CO rebinding with each CS°. Although significant, the changes are not dramatic. In Fig. 3 b the Arrhenius plots of the rebinding rates for the three taxonomic substates in the presence (solid lines) and in the absence of xenon (dotted lines) show that the variation of the rate parameters does not exceed a factor 4 and is often much less.
FIGURE 3.
(a) Normalized enthalpy distributions of the three CS° of SW MbCO in the presence of 10 atm of xenon (solid lines) and in the absence of xenon (dotted lines). (b) Arrhenius plots of kpeak of CO geminate rebinding with the taxonomic substates A0, A1, and A3 of SW Mb in the presence of 10 atm of xenon (solid lines) and in the absence of xenon (dotted lines). The solvent was 79% glycerol water (w/w). The rate distributions changes induced by xenon are not fully saturated at a pressure of 10 atm. In fact, we estimated to ∼3 atm the value for half saturation (from a titration of the difference performed at the log kpeak value). However, one experiment performed at 16 atm yielded data that were so close to the former that one may regard the thermodynamic parameters determined at 10 atm as a good approximation of their true values.
TABLE 1.
Thermodynamic parameters for CO rebinding with the CS° substates of SW Mb
| Log A (s−1)
|
Hpeak (kJ/M)
|
Width (kJ/M)
|
|||||||
|---|---|---|---|---|---|---|---|---|---|
| References | A0 | A1 | A3 | A0 | A1 | A3 | A0 | A1 | A3 |
| This work, 10 atm of xenon, pH 4.8 | 7.9 | 8.2 | 8.5 | 4.1 | 7.8 | 12.2 | 2.7 | 4.4 | 7.6 |
| This work, 10 atm of xenon, pH 7.3 | – | 8.2 | 8.5 | – | 7.8 | 12.2 | – | 4.4 | 7.6 |
| Tetreau et al. (2002), pH 4.8 | 8.1 | 8.7 | 8.8 | 5.6 | 9.9 | 12.6 | 3.0 | 3.0 | 4.9 |
| Tetreau et al. (2002), pH 7.0 | – | 8.9 | 8.7 | – | 9.9 | 12.6 | – | 3.5 | 6.7 |
The widths are the full widths measured at half maximum of the enthalpy distribution. Mean standard deviations are estimated as 0.8 for log A and 1.5 for Hpeak.
To interpret these data we have to know which xenon sites are occupied at a given pressure and temperature. Above Tg, xenon gas should in principle bind with Mb according to its temperature-dependent affinity provided it remains able to enter the protein. It is known that CO is able to detectably escape or enter the protein down to 200 K in 79% glycerol/water (w/w). Because these processes are essentially regulated by the viscosity damping of fluctuations at the protein surface (Beece et al., 1980; Lavalette and Tetreau, 1988) we may assume that this temperature limit remains approximately the same for xenon and CO. Extrapolation of the Arrhenius plot of the equilibrium constant (Fig. 8) indicates that the Xe1 proximal site is saturated at a pressure of 1 atm. Because at this pressure, the change in the P(log k) spectra is <25% of its total value, occupation of the Xe1 site by xenon cannot be responsible for the change of the rate parameters. This conclusion is in accord with the fact that Xe1 being located on the proximal heme side, a direct influence upon CO rebinding from the distal primary site is unlikely. A possibility is a partial occupation of the Xe4 site. This site has a smaller affinity for xenon and may be unsaturated at a pressure of 1 atm. It is located relatively close to the CO primary docking site and to His-64. Although specific structural changes induced on His-64 by the presence of xenon are presently unknown, the occupation of this site might affect both the relative amplitudes of the various CS° and the CO rebinding rate.
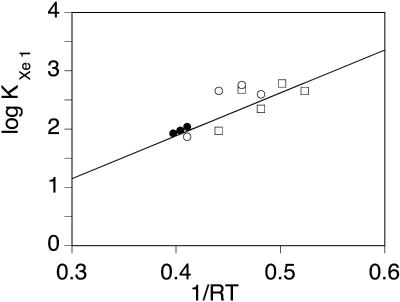
FIGURE 8.
Arrhenius plot of the equilibrium constant for xenon binding to the Xe1 proximal cavity of SW Mb, determined by titrating the changes in the area of process GII upon xenon addition (Oxygen: ○; CO: □). The values determined in Ewing and Maestas (1970) by absorption measurements are shown as closed circles, but were not included in the least-square linear regression.
Ligand migration above 200 K
Rebinding in the absence of xenon
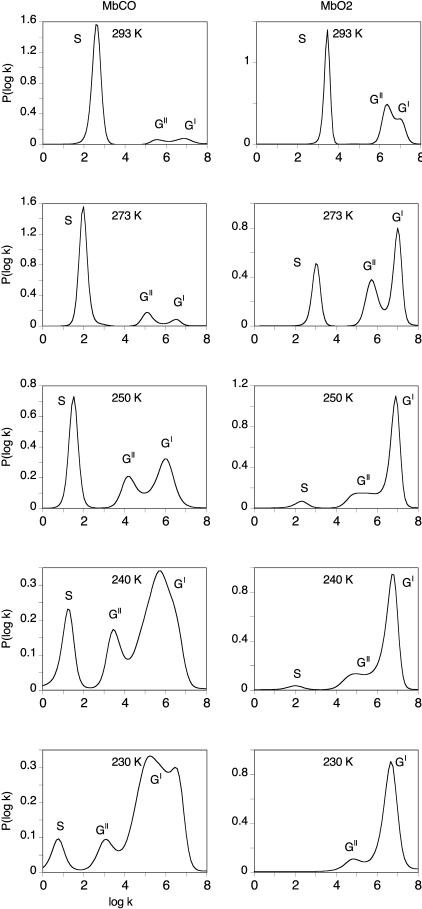
The second part of this work is focused on rebinding processes above 200 K. It is essential to recall that kinetic averaging among the CS0 taxonomic states becomes progressively predominant at these temperatures and that they must be ultimately considered as one kinetic species. Therefore, the appearance of new bands in the rate spectra corresponds to new kinetic processes. The rate distributions for xenon-free SW Mb displayed in Fig. 4 clearly show the advantage of using rate spectra to follow the evolution of the number and relative amplitude of the various processes with temperature. They are in agreement with previous reports (Johnson et al., 1996; Lambright et al., 1993; Steinbach et al., 1991, 1992).
FIGURE 4.
Normalized P(log k) rate spectra for CO (left) and O2 (right) rebinding with SW Mb at T > Tg. S denotes the solvent process. GI is attributed to geminate rebinding with the conformation of the protein/ligand obtained just after photodissociation, and GII to geminate rebinding after ligand migration in the protein. The solvent was 79% glycerol/water (w/w) at pH 7.3; CO and O2 pressures were 1 and 0.2 atm, respectively.
As already mentioned, process GI (rebinding from the primary ligand docking site) remains continuously observable, although with variations in shape and amplitude, between 77 K and 293 K.
Above 180–200 K, two additional, slower processes, GII and S, appear. Like GI, GII is due to geminate recombinations, whereas S corresponds to the bimolecular binding of ligands coming from the solvent with protein molecules from which the initial ligand molecule has escaped (Austin et al., 1975).
Process GII grows at the expense of GI upon increasing the temperature. It is responsible for the slowing down and for the apparent inverse temperature dependence of the kinetics reported long ago (Austin et al., 1975; Steinbach et al., 1991). The appearance of bimolecular rebinding (S) above ∼200 K provides evidence that equilibrium fluctuations have set in, allowing the escape of the ligand into the solvent. Near room temperature, S becomes predominant. But whereas CO escape is almost complete, the yield of O2 geminate rebinding remains appreciable.
Above 200 K, the bandwidth of each process becomes progressively narrower. This means that the kinetics of these processes have become close to exponential because of kinetic averaging of the rate distribution as a consequence of faster fluctuations. Kinetic averaging is expected to occur at temperatures for which the rate of conformer interconversion is much larger than the rebinding rate. Because the solvent process S is particularly slow, kinetic averaging is already observed at 230 K, whereas it occurs only near 250 K for geminate rebinding (Fig. 4). Process GI observed at the lowest temperatures is much broader for CO than for O2.
A fourth peak appears at ∼230 K, a fact that has been previously noticed (Steinbach et al., 1991), but ceases to be resolvable at higher temperature. Although its origin is not firmly established yet, it is likely to be related to the taxonomic substates A1 and A3 that, at pH 7.3, 230 K, may be interconverting on a timescale comparable to that of the rebinding process (Johnson et al., 1996). The existence of similar taxonomic substates A1 and A3 for SW MbO2 has been recently kinetically supported, but their interconversion rate and their relative population are not known (Tetreau et al., 2002). A possible explanation for the narrowing of band GI for O2 compared to CO at 230 K could be either a higher CS° interconversion rate or, alternatively, a change in the population ratio between A1 and A3 because of different ligand–His-64 interactions.
In the past, several explanations have been successively invoked to explain what has often been called “relaxation,” namely the emergence of GII and the slowing down of the overall rebinding near 180 K. GII has been successively attributed to a geminate rebinding process from within the protein matrix starting above 180 K (Austin et al., 1975), to movements of the iron out of the heme plane leading to a time-dependent enthalpy barrier (Steinbach et al., 1991), or to solvent relaxation within the distal pocket (Kleinert et al., 1998). Recent crystallographic experiments on reaction intermediates of Mb have provided the structural basis for closing the debate. The present state of knowledge concerning the connection between Mb dynamics, structure, and CO binding has been recently reviewed (Brunori and Gibson, 2001). In WT SW Mb after photodissociation, the ligand occupies a primary docking site above pyrrole C at 3.6 Å from the metal and parallel to the heme plane. At temperatures high enough, CO begins to migrate toward other sites. The time-resolved diffraction data for WT SW MbCO show that only the CO primary docking site and the Xe1 proximal site are occupied significantly at room temperature (Srajer et al., 2001). Thus, ligand rebinding from these two sites is generally associated with the fastest and slowest geminate phases (GI and GII), respectively (Brunori and Gibson, 2001). This explains why GII can appear only at temperature at which protein motions permit the transit of the ligand from one side of the heme to the other. For the same reason, CO rebinding from Xe1 is about two orders of magnitude slower, because it requires a return from the proximal toward the distal side.
Ligand rebinding in the presence of xenon: competition for the occupation of protein cavities
To check the possibility of nonspecific pressure effects, preliminary experiments were performed with nitrogen. CO/O2 rebinding kinetics recorded under 20 atm N2 were found to be identical to those recorded in the absence of pressure. Thus the kinetic changes described below are specific of the presence of xenon.
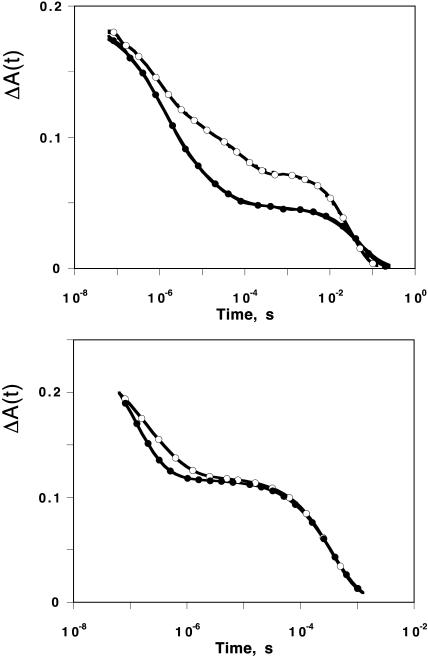
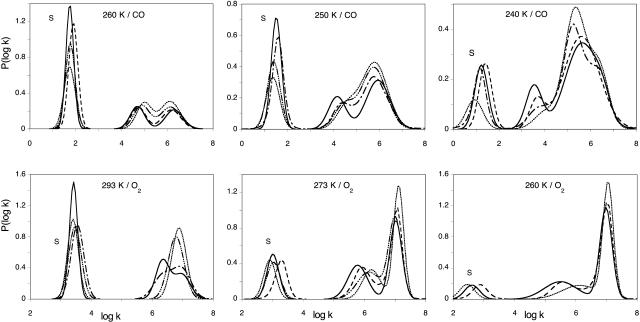
The kinetics of CO and O2 rebinding with Mb were recorded in the presence of xenon at pressures up to 16 atm in the whole temperature range where both geminate processes have sufficient amplitudes to be observable simultaneously. This relatively narrow range extends from 293 to 250 K and from 273 to 230 K for O2 and CO, respectively. Two examples of kinetics are given in Fig. 5. All other results are shown as rate distributions. Displaying the complete series of P(log k) curves at each Xe pressure would lead to unreadable figures. For clarity, Fig. 6 displays only some representative examples. The kinetic changes brought about by xenon are immediately apparent on the rate spectra. Some fluctuations in the peak position of the bimolecular process S are seen, but they are not correlated with xenon pressure. It should be admitted that the partial CO pressure at the equilibration temperature remains subject to some random errors that may account for these fluctuations.
FIGURE 5.
Geminate rebinding kinetics of MbCO at 250 K (top) and MbO2 at 293 K (bottom) in the absence of xenon (○) and in the presence of 16 atm of xenon (•). For clarity, the number of data points was reduced in the figure. The lines are MEM fit to the data. The associated rate distributions are shown in Fig. 6, top middle and bottom left. The solvent was 79% glycerol/water (w/w) at pH 7.3.
FIGURE 6.
Normalized P(log k) rate spectra for CO (top) and O2 (bottom) rebinding with SW Mb at pH 7.3 in the absence /presence of xenon at selected temperatures. Only a few xenon pressures are shown for the readability of the figure. Each curve represents an averaged P(log k) obtained by global analysis according to three Gaussian components of three to four experiments performed at constant xenon pressure (see details in the text). The xenon pressures were 0 (solid line), 2 (dashed line), 3 (dash-dot-dash line), 5 (dash-dot dot dot-dash line), and 15 (dotted line) atm of xenon. S is the bimolecular rebinding from the solvent. All other bands correspond to geminate processes.
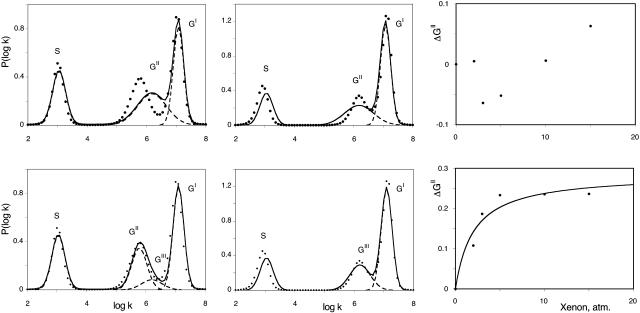
In contrast, the geminate processes being independent on the CO concentration, are not sensitive to these errors. The shape of the spectra is found to change smoothly upon increasing xenon pressure, band GI growing at the expense of the slower band GII. In addition, a new feature becomes evident: the position of the peak of GII seems to shift by ∼Δ(log kpeak) ≈ 0.5 toward higher rates, the largest shift being observed at 273–260 K for O2 and at 250 K for CO. Although smaller at other temperatures, the shift was always observed for both ligands, except for oxygen at 293 K. As we shall show now, this shift is only apparent and results from the emergence of a third geminate process, GIII, that peaks at higher rate values. All rate spectra recorded at the same temperature but at different xenon pressures were fitted globally using tentatively either three or four Gaussians. Fig. 7 shows a representative example. Obviously, the addition of a fourth Gaussian was required to obtain a satisfactory decomposition. This was also supported by the examination of the second derivative (Susi and Byler, 1983, 1986) of P(log k) that displayed four minima. Unfortunately the number of arbitrary parameters required to describe four Gaussians is too large to permit a stable decomposition, unless some constraints are introduced. In line with the preceding considerations, we assumed that xenon affects only the relative amplitude of the kinetic processes but not their peak position and fitted the data accordingly on a four Gaussian basis set taking log kpeak (GII) from the averaged P(log k) curve determined in the absence of xenon (where contribution of GIII is absent or negligible), and log kpeak (GI) and log kpeak (GIII) from the rate spectra at the highest xenon pressure (where GII has disappeared). The random fluctuations in the peak position of the bimolecular process S were an annoyance for the convergence of the fitting procedure. Its peak position was fixed at the average value determined from all the P(log k) spectra. With this basis set, good global fits for all xenon pressures were obtained (see Fig. 7). The consistency is further supported by the titration results of xenon binding illustrated on the right part of Fig. 7. Crystallography and xenon absorption studies have shown that the affinity of xenon for the Xe1 site is higher by about one order of magnitude than that for the other sites. Hence, binding can be regarded as sequential in a first approximation and a titration based on the decrease of the GII band area was attempted. The example given in Fig. 7 (right) shows that the global analysis of the rate spectra according to four Gaussians (right bottom) led to a satisfactory hyperbolic fit, whereas the results (right top) did not order regularly if only three components were introduced in the P(log k) fit. The Arrhenius plot of the equilibrium constant for xenon binding to the proximal cavity Xe1 obtained from our analysis is shown in Fig. 8. Despite some scatter, all observations are satisfactory; the xenon binding affinity for the Xe1 cavity appears ligand independent within uncertainties and increases upon decreasing the temperature. Moreover, the KXe1 values determined independently at higher temperatures by following the addition of xenon to Mb solutions (Ewing and Maestas, 1970) (Fig. 8, closed circles) are well placed on the Arrhenius plot calculated by considering O2 and CO rebinding data together. The binding enthalpy calculated from the Arrhenius plot is ΔH = −4.1 ± 2.2 kJ/M, in agreement with previously reported values (Ewing and Maestas, 1970; Tilton et al., 1986). The order of magnitude appears reasonable for a binding reaction controlled by hydrophobic interactions.
FIGURE 7.
Examples of the global fits of the rate spectra for oxygen rebinding with SW MbO2 at 273 K in the absence of xenon (left) and in the presence of 15 atm of xenon (middle). The points correspond to the P(log k) distributions calculated by MEM from the kinetics, and the lines to the fits. These fits correspond to a sum of three (top) or four (bottom) Gaussians assuming constant band positions and variable amplitudes for the different components. (Right) Corresponding titration curves of the decrease of the area of band GII. Only the four Gaussian hypothesis leads to satisfactory fits of the rate spectra and to a good hyperbolic fit (line) of the titration curve.
Structural origin of the GIII rebinding process
It has been reported that the presence of xenon gas in the Xe1 site of Mb does not modify the protein structure appreciably (Tilton et al., 1984). On the other hand the size of the cavity is unlikely to accommodate xenon and CO or O2 simultaneously. Hence, the regular change of the slower geminate process from GII to GIII upon rising xenon pressure may be expected to reflect the binding equilibrium of xenon in the secondary, proximal docking site for dissociated ligand. As a consequence, the latter either becomes displaced to a new binding site or accumulates in an intermediary transient state, from which recombination (GIII) is faster.
Figs. 4 and 6 reveal a new feature of the ligand migration that could have been hardly suspected without the help of the rate spectra. The ligands recombine from at least three different docking sites that are kinetically distinguishable. Moreover, the necessity of investigating the temperature dependence of the rate spectra is emphasized by the behavior of MbO2 that shows only two geminate bands at room temperature. It is likely that process GIII also exists at 293 K but that it cannot be resolved, because it happens to overlap GI, due to a different temperature dependence. Our observations at 293 K are thus in agreement with those of Scott and Gibson (1997) who reported that the kinetics of O2 rebinding at room temperature were biphasic in SW Mb and several mutants, and found that the amplitude of the slower phase decreased in the presence of 12 atm of xenon.
The picture that emerges from this study is as follows: above 180 K and in the absence of xenon, the photodissociated ligand recombines either directly from its primary docking site (process GI), or after migration toward the proximal Xe1 site (process GII). When the latter is occupied by a xenon atom, a new rebinding process takes over with an intermediate rate (process GIII).
This, however, does not necessarily imply the occupation of an entirely new site. It is more likely to reflect the increased population of one or several intermediate locations on the path between the distal primary site and the proximal Xe1 cavity. Obviously such sites must exist to establish a connection between the distal and the proximal sides of the heme. In the absence of xenon, they are occupied only transiently and leave no detectable kinetic trace because the ligand moves very quickly toward Xe1. Although kinetic information alone is unable to unambiguously provide a clue about the structural origin of the latter sites, two other known cavities Xe4 and Xe2 are well located to provide the required pathway. In the crystal, the mutation L29W greatly stabilizes CO in Xe4 (Brunori et al., 2000; Ostermann et al., 2000) below 180 K, whereas at higher temperature, and in the wild-type Mb, CO is found only in the proximal site Xe1.
Kinetic studies of Mb mutants and molecular dynamics simulations (Quillin et al., 1995; Li et al., 1993; Gibson et al., 1992) also suggest that the secondary movement of ligand after dissociation is toward the Xe4 cavity. It was reported that decreasing the size of the residues adjacent to Xe4 increased the amplitude of the slow secondary phase of O2 geminate rebinding (the GII process of Fig. 4) whereas bulky residues almost completely abolished it (Scott et al., 2001; Scott and Gibson, 1997). The perturbation of ligand migration and rebinding kinetics by mutations at the positions located on the access pathway to the Xe4 site is also well documented. A number of simulations show how the mutation V68A causes dissociated ligands to enter the Xe4 pocket, whereas V68F causes the ligand to stay in the primary docking site, because the benzyl side chain fills the cavity (Quillin et al., 1995). Similarly, the substitution L29A results in essentially free ligand diffusion between the Xe4 site and the heme pocket (Li et al., 1993). Molecular dynamics calculations on a triple mutant of SW Mb revealed that rotation in 10 ps of Ile107 that points toward the tyrosine in L29Y opens a path communicating with the Xe4 site (Brunori et al., 1999).
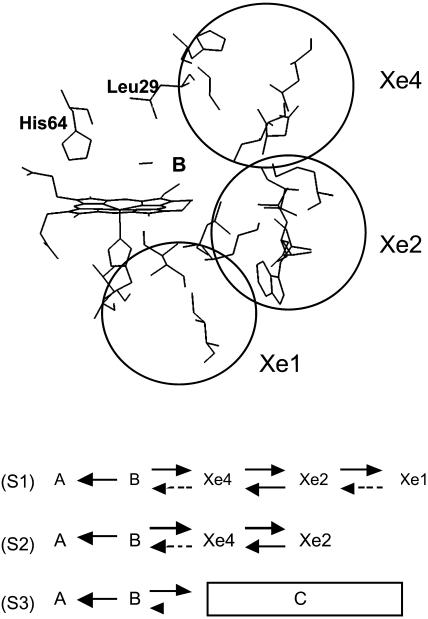
It is therefore reasonable to assume that the Xe4 site may be on the normal migration pathway out of the distal space. Xe4 is close to the cavity that provides the Xe2 binding site (Elber and Karplus, 1990). Xe2 is situated near the heme edge and extends below and above the heme plane. Experimental evidence for the presence of the ligand is not available, but molecular dynamics simulations indicate that it is easily accessible via Xe4 (Elber and Karplus, 1990). Fig. 9 summarizes the relevant structural information and proposes a possible path of ligand migration with its essential kinetic features.
FIGURE 9.
(Top) Xenon-binding cavities in SW myoglobin. This view was obtained with the Insight II (MSI, San Diego, CA) software and the PDB entry 1dws. The xenon binding cavities are outlined as spheres. The residues shown are not within the cavities, but are situated at their periphery as defined by Elber and Karplus (1990). The three cavities extend on both sides of the figure plane. Residues His-64 and Leu-29, which indicate the solvent side and top of the B state are also shown. (Bottom) Kinetic schemes of the assumed ligand migration path in the absence (S1) and in the presence (S2) of xenon. The geminate process GI corresponds to  GII to the slow return from Xe1 and GIII to return from (Xe2 + Xe4). For the sake of comparison with previous works, the global kinetic scheme mostly discussed in the literature is shown as (S3) (Scott and Gibson, 1997) in which the kinetic state C actually encompasses Xe1 and all intermediate sites along the trajectory leading from B to Xe1. Rate limiting steps are denoted by dotted arrows. Escape from the protein is not considered here.
Because all ligands that have not rebound from the primary site B are found to accumulate in Xe1, the outward rates must be predominant (Fig. 9, solid arrows). Molecular dynamics suggests that Xe4 and Xe2 are in a fast equilibrium. Therefore, two rate limiting steps remain along the slow return (process GII) from Xe1 (dotted arrows). Occupation of Xe1 by xenon would then cause CO to accumulate in (Xe4 + Xe2), from which rebinding (process GIII) is faster because one of the rate limiting steps has been removed. Thus the kinetic schemes S1 and S2 of the lower panel of Fig. 9 are consistent with all available structural and kinetic data. The kinetic state C considered in most previous works is a composite state encompassing the predominant Xe1 site as well as the other intermediate states in rapid equilibrium (Scott et al., 2001).
To conclude this section, it is worth noticing that all crystallographic experiments that have provided information about the multiple docking sites concerned the MbCO complex only. It is currently assumed that the docking sites are identical for O2 and CO, but experimental proofs are still rather scarce. In their work, Scott and Gibson (1997) estimated to 3 atm the p1/2 value of half saturation of the decrease of the slow geminate rebinding phase of O2 with SW Mb due to xenon occupation. This value is in agreement with the xenon affinity for the Xe1 proximal site. In addition, mutation effects suggested the involvement of this site. The present work shows that MbO2 and MbCO display a similar kinetic behavior with the same number of kinetically distinguishable rebinding sites. In addition, titrations of xenon binding from the decrease of the area of the GII band of MbO2 and MbCO yield affinity constants that are identical within uncertainties (Fig. 8). This is in accord with CO and O2 occupying virtually the same docking sites during their migration within the protein and supports the idea that the protein defines ligand migration pathways that are to a large extent independent of the specific ligand.
Pathways of ligand escape from the protein
Ligand escape is quantified by the proportion of bimolecular rebinding, S. However, the measurement of the ligand escape yield, Nesc, is plagued with the practical difficulty that the temperature range where bimolecular (S) and geminate (G) processes are simultaneously observable with sufficient accuracy is narrow and differs with ligands: 293–250 K with O2 and 273–230 K with CO, a fact that may account for the limited data available in the literature regarding the latter (Fig. 4).
Because it is the physiological ligand of myoglobin and because it can be relatively easily studied at 293 K, attention has been quite naturally focused on oxygen at physiological temperature (Scott and Gibson, 1997). Although we observe a decrease of the relative yield Nesc of the S process, it is quite small and may not be significant in view of the unavoidable scatter (Figs. 5, bottom, and 6). Thus the O2 escape yield being virtually unaffected by the presence of xenon at physiological temperature, ligand escape must occur in the primary B state because the branching ratio is independent of the population change of the subsequent intermediate states brought about by xenon. For oxygen the present results are compatible with previous studies at room temperature (Scott et al., 2001; Scott and Gibson, 1997) and allow an extension of the conclusions concerning escape from the primary and Xe1 sites down to ∼260 K.
Despite the small CO geminate yield at 293 K (see Fig. 4), we found in repeated experiments that xenon did not affect (within errors) the yield (Nesc ≈ 0.96) of the bimolecular process at 293 K, suggesting that CO behaves in a similar way as O2 at physiological temperature.
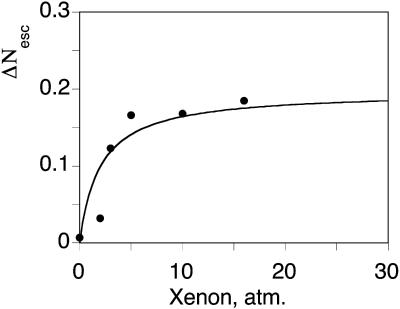
In contrast, between 240 and 260 K, the yield, Nesc is significantly decreased in the presence of xenon (Fig. 6). In addition, the titration of the variations ΔNesc against Xe pressure parallels that of the area of band GII (Fig. 10). These data indicate direct escape of CO from the Xe1 cavity at T ≈ 250 K. The partial yield  of CO escape via the Xe1 channel computed using the asymptotic value of similar titrations at different temperature is shown in Fig. 11.
FIGURE 10.
Decrease of the area of the bimolecular rebinding process S upon increasing the xenon pressure (data points) compared to the titration fit computed by using the affinity constant determined from the geminate measurements (see Fig. 8). A similar titration is not feasible at 293 K because the total of the geminate processes amounts to only 4% of the signal.
FIGURE 11.
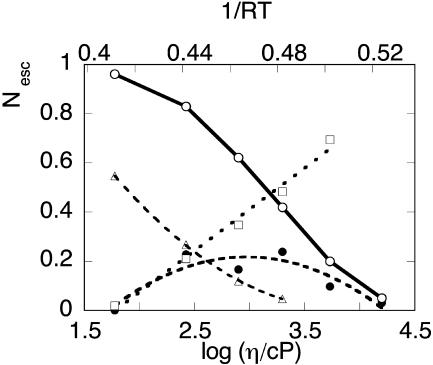
Ligand escape yields from myoglobin as a function of viscosity (lower axis) or temperature (upper axis). ○, CO total escape yield; •,  the absolute yield of CO escape via the Xe1 cavity. Δ, O2 total escape yield. □, fraction
  of CO escaped via Xe1. Lines are drawn to guide the eye. The solvent was Gly 79% w/w.
At 293 K  is negligible compared to the overall escape yield Nesc ≈ 96%. It rises to a maximum of ≈20% at 240–250 K and then decreases simultaneously with the overall Nesc. There must be therefore at least two escape pathways for CO. The first one is predominant at room temperature. For the same reasons that were invoked for O2 it appears to be compatible with the histidine gate pathway but its efficiency decreases at low temperature. The second one undoubtedly implies the Xe1 site and becomes increasingly important as temperature is lowered (Fig. 11): at 250 K 40% of all photodissociated CO molecules escape from the protein, one half via the primary site and another half via Xe1.
Such a complication might have been anticipated because the protein structure is likely to offer more than just one possibility for the ligand to escape. But in a given docking site the route actually followed is determined by the temperature-dependent kinetic competition between the “local” escape rate and the alternative migration and/or rebinding rates.
Ligand escape or migration are not simple activated processes as they require local protein motions for opening and/or closing gates. Protein motions, especially at the surface, are damped by friction in viscous solvents. The (isothermal) viscosity dependence of ligand escape has been reported long ago not only for Mb (Beece et al., 1980) but also for the non-heme oxygen carrier hemerythrin (Lavalette and Tetreau, 1988; Yedgar et al., 1995). A full description of the individual kinetic rates in myoglobin would require a series of measurements in isoviscous solvents at variable temperature and another series at variable viscosity but constant temperature. This was beyond the scope of the present work.
As can be seen in Fig. 11 the solvent viscosity varies by nearly three orders of magnitude whereas 1/RT increases only from 0.4 to 0.5 approximately. The variations of the total escape yield of CO and O2 follow approximately parallel curves. The data suggest the possibility that the viscosity increase of glycerol 79% w/w below 273 K, causes a slowing down of the histidine gate opening so that more ligands rebind or migrate toward the Xe1 site. Although one may expect that the escape rate in this site will be also slowed by viscosity, a substantial escape yield remains possible because the ligand residence time in Xe1 is much longer than in state B as shown by the peak values of GI and GII processes. Whether similar alternative pathways also occur for O2 cannot be determined from the present measurements because the results for O2 are not precise enough, due to the small yield of the S process below 273 K.
It is of interest to compare the present conclusions with those of a recent time-resolved Laue x-ray diffraction study at room temperature (Srajer et al., 2001) indicating that ∼20% of the photodissociated CO were missing 1 ns after photodissociation but that 100% were recovered at 100 ns, with populations shared among the primary B state and the Xe1 site. As suggested by the authors, this might correspond to a spatial distribution along the trajectory of ligands that would be undetectable in their experiment. This is compatible with the transient kinetic phase expected for our scheme S1 immediately after the onset of ligand migration. After completing equilibration, and in the absence of escape, 100% of the ligands must be recovered either in the B or in the Xe1 site because the “quasi” steady state that is now established between the intermediate sites strongly favors the population of Xe1.
SUMMARY OF CONCLUSIONS AND “RELAXATION” PROCESSES IN HEME PROTEINS
Here we have shown that kinetic competition of the ligand with xenon can be combined with low temperature photolysis to get additional information on migration paths in myoglobin. Below 180 K xenon affects to a minor, but significant, extent the enthalpy distribution and preexponential factor for CO rebinding from the primary docking site in each taxonomic substate of myoglobin. New kinetic processes are successively activated when the temperature is progressively raised from T < 100 K to room temperature. In addition to fast rebinding from the primary site B observed at low temperature, (GI), delayed rebinding (GII) appears above ∼200 K because the ligand explores new docking sites.
Saturating the Xe1 site with xenon gas results in the progressive replacement of the delayed rebinding GII by a new kinetic process, GIII, the rate of which is faster than that of the former because one rate limiting step has been removed from the trajectory (scheme S2, Fig. 9). Ligand migration presumably involves four intermediate sites (B, (Xe4 + Xe2), and Xe1) rather than just one (B) at lower temperature (scheme S1, Fig. 9). The appearance of the GIII process indicates that the kinetic state C previously considered (scheme S3, Fig. 9) is a composite state.
Competition with xenon also provides some clues regarding the escape pathways. At physiological temperature (293 K) O2 and CO can reach the secondary Xe1 site, but still return rapidly to the B state and escape via the histidine gate. This conclusion does not hold at lower temperatures and higher viscosities. At ∼250 K, competition with xenon reveals that CO begins to escape from the proximal Xe1 site and that this escape mode becomes dominant as the temperature is lowered still further.
The change of kinetic regime due to the appearance of GII at ∼200 K has been often denoted as “relaxation” in the past literature. It corresponds to the onset of ligand migration powered by protein fluctuations that transiently open gates between the cavities. Other fluctuations are responsible for ligand escape. Both are damped in a viscous solvent and the data indeed suggest that the change of the ligand escape mode might be predominantly regulated by viscosity rather than temperature. Because it is short lived, damping of the fluctuations may easily prevent escape from the primary site B. A similar amount of damping will have only a moderate effect upon the escape yield in the long lived Xe1 site.
The kinetics of CO rebinding with cytochrome P450cam also exhibit a complex pattern with apparent, but superficial similarities with Mb. In P450cam the GII process appears at much lower temperature (T ≈ 140 K) and is presumed to correspond to a rearrangement of the distal pocket, as soon as the protein interior recovers sufficient local mobility for the heme and substrate to “relax” to the more crowded, deliganded conformation. Such local motions being less dependent on the fluctuations of the protein matrix, the change in the kinetic regime was observed well below Tg and the kinetic “relaxation” rate was shown to be decoupled from the solvent's dielectric relaxation (Tetreau et al., 2000).
Thus two heme proteins, P450cam and Mb, provide examples of “nonslaved” and “slaved” processes, respectively (Fenimore et al., 2002). The difference also appears in the arrangement of the kinetic diagram: sequential in Mb (neglecting escape) and parallel (resembling a Jablonkii diagram) in P450cam. To avoid confusion, we would like to suggest that the term “relaxation” should be reserved to denote structural changes between a nonequilibrium and an equilibrium conformation of the ligand environment as presumed in P450cam and to call “delayed rebinding” the ligand migration processes such as observed in myoglobin.
References
- Alben, J. O., D. Beece, S. F. Bowne, W. Doster, L. Eiseinstein, H. Frauenfelder, D. Good, J. D. McDonald, M. C. Marden, and P. P. Moh. 1982. Infrared spectroscopy of photodissociated carboxymyoglobin at low temperatures. Proc. Natl. Acad. Sci. USA. 79:3744–3748. [DOI] [PMC free article] [PubMed] [Google Scholar]
- Austin, R. H., K. W. Beeson, L. Eisenstein, H. Frauenfelder, and I. C. Gunsalus. 1975. Dynamics of ligand binding to myoglobin. Biochemistry. 14:5355–5373. [DOI] [PubMed] [Google Scholar]
- Beece, D., L. Eisenstein, H. Frauenfelder, D. Good, M. C. Marden, L. Reinisch, A. H. Reynolds, L. B. Sorensen, and K. T. Yue. 1980. Solvent viscosity and protein dynamics. Biochemistry. 19:5147–5157. [DOI] [PubMed] [Google Scholar]
- Brunori, M. 2000. Structural dynamics of myoglobin. Biophys. Chem. 86:221–230. [DOI] [PubMed] [Google Scholar]
- Brunori, M., F. Cutruzzola, C. Savino, C. Travaglini-Allocatelli, B. Vallone, and Q. H. Gibson. 1999. Structural dynamics of ligand diffusion in the protein matrix: a study on a new myoglobin mutant Y(B10) Q(E7) R(E10). Biophys. J. 76:1259–1269. [DOI] [PMC free article] [PubMed] [Google Scholar]
- Brunori, M., and Q. H. Gibson. 2001. Cavities and packing defects in the structural dynamics of myoglobin. EMBO Rep. 2:674–679. [DOI] [PMC free article] [PubMed] [Google Scholar]
- Brunori, M., B. Vallone, F. Cutruzolla, C. Travaglini-Allocatelli, J. Berendzen, K. Chu, R. M. Sweet, and I. Schlichting. 2000. The role of cavities in protein dynamics: crystal structure of a photolytic intermediate of a mutant myoglobin. Proc. Natl. Acad. Sci. USA. 97:2058–2063. [DOI] [PMC free article] [PubMed] [Google Scholar]
- Carlson, M. L., R. M. Regan, R. Elber, H. Li, G. N. Phillips, J. S. Olson, and Q. H. Gibson. 1994. Nitric oxide recombination to double mutants of myoglobin: role of ligand diffusion in a fluctuating heme pocket. Biochemistry. 33:10597–10606. [DOI] [PubMed] [Google Scholar]
- Carlson, M. L., R. M. Regan, and Q. H. Gibson. 1996. Distal cavity fluctuations in myoglobin: protein motion and ligand diffusion. Biochemistry. 35:1125–1136. [DOI] [PubMed] [Google Scholar]
- Chu, K., J. Vojtchovsky, B. H. McMahon, R. M. Sweet, J. Berendzen, and I. Schlichting. 2000. Structure of a ligand-binding intermediate in wild-type carbonmonoxymyoglobin. Nature. 403:921–923. [DOI] [PubMed] [Google Scholar]
- Draghi, F., A. E. Miele, C. Travaglini-Allocatelli, B. Vallone, M. Brunori, Q. H. Gibson, and J. S. Olson. 2002. Controlling ligand binding in myoglobin by mutagenesis. J. Biol. Chem. 277:7509–7519. [DOI] [PubMed] [Google Scholar]
- Elber, R., and M. Karplus. 1990. Enhanced sampling in molecular dynamics: use of the time-dependent Hartree approximation for a simulation of carbon monoxide diffusion through myoglobin. J. Am. Chem. Soc. 112:9161–9175. [Google Scholar]
- Ewing, G. J., and S. Maestas. 1970. The thermodynamics of absorption of xenon by myoglobin. J. Phys. Chem. 74:2341–2344. [DOI] [PubMed] [Google Scholar]
- Fenimore, P. W., H. Frauenfelder, B. H. McMahon, and F. G. Parak. 2002. Slaving: solvent fluctuations dominate protein dynamic and functions. Proc. Natl. Acad. Sci. USA. 99:16047–16051. [DOI] [PMC free article] [PubMed] [Google Scholar]
- Gibson, Q. H., R. Regan, R. Elber, J. S. Olson, and T. E. Carver. 1992. Distal pocket residues affect picosecond ligand recombination in myoglobin. J. Biol. Chem. 267:22022–22034. [PubMed] [Google Scholar]
- Hartmann, H., S. Zinser, P. Komninos, R. T. Schneider, G. U. Nienhaus, and F. G. Parak. 1996. X-ray structure determination of a metastable state of carbonmonoxy myoglobin after photodissociation. Proc. Natl. Acad. Sci. USA. 93:7013–7016. [DOI] [PMC free article] [PubMed] [Google Scholar]
- Ishikawa, H., T. Uchida, S. Takahashi, K. Ishimori, and I. Morishima. 2001. Ligand migration in human myoglobin: steric effects of isoleucine 107(G8) on O2 and CO binding. Biophys. J. 80:1507–1517. [DOI] [PMC free article] [PubMed] [Google Scholar]
- Johnson, J. B., D. C. Lamb, H. Frauenfelder, J. D. Müller, B. McMahon, and G. U. Nienhaus. 1996. Ligand binding to heme proteins. VI. Interconversion of taxonomic substates in carbonmonoxymyoglobin. Biophys. J. 71:1563–1573. [DOI] [PMC free article] [PubMed] [Google Scholar]
- Kleinert, T., W. Doster, H. Leyser, W. Petry, V. Schwarz, and M. Settles. 1998. Solvent composition and viscosity effects on the kinetics of CO binding to horse myoglobin. Biochemistry. 37:717–733. [DOI] [PubMed] [Google Scholar]
- Lambright, D. G., S. Balasubramanian, and S. G. Boxer. 1993. Dynamics of protein relaxation in site-specific mutants of human hemoglobin. Biochemistry. 32:10116–10124. [DOI] [PubMed] [Google Scholar]
- Lavalette, D., and C. Tetreau. 1988. Viscosity-dependent energy barriers and equilibrium conformational fluctuations in oxygen recombination with hemerythrin. Eur. J. Biochem. 177:97–108. [DOI] [PubMed] [Google Scholar]
- Lavalette, D., C. Tetreau, J.-C. Brochon, and A. Livesey. 1991. Conformational fluctuations and protein reactivity. Eur. J. Biochem. 196:591–598. [DOI] [PubMed] [Google Scholar]
- Li, H., R. Elber, and J. E. Straub. 1993. Molecular dynamics simulation of NO recombination to myoglobin mutants. J. Biol. Chem. 268:17908–17916. [PubMed] [Google Scholar]
- McNaughton, L., G. Hernandez, and D. M. LeMaster. 2003. Equilibrium O2 distributions in the Zn2+-protoporphyrin IX deoxymyoglobin mimic: application to oxygen migration pathway analysis. J. Am. Chem. Soc. 125:3813–3820. [DOI] [PubMed] [Google Scholar]
- Ostermann, A., R. Waschipky, F. G. Parak, and G. U. Nienhaus. 2000. Ligand binding and conformational motions in myoglobin. Nature. 404:205–208. [DOI] [PubMed] [Google Scholar]
- Perutz, M. F., and F. S. Matthews. 1966. An X-ray study of azide methaemoglobin. J. Mol. Biol. 21:199–202. [DOI] [PubMed] [Google Scholar]
- Quillin, M. L., T. Li, J. S. Olson, G. N. Phillips, Jr., Y. Dou, M. Ikeda-Saïto, R. M. Regan, M. Carlson, Q. H. Gibson, and H. Li. 1995. Structural and functional effects of apolar mutations of the distal valine in myoglobin. J. Mol. Biol. 245:416–436. [DOI] [PubMed] [Google Scholar]
- Richards, F. M. 1977. Areas, volumes, packing and protein structure. Annu. Rev. Biophys. Bioeng. 6:151–176. [DOI] [PubMed] [Google Scholar]
- Rubin, S. M., S.-Y. Lee, E. J. Ruiz, A. Pines, and D. E. Wemmer. 2002. Detection and characterization of xenon-binding sites in proteins by 129Xe NMR spectroscopy. J. Mol. Biol. 322:425–440. [DOI] [PubMed] [Google Scholar]
- Schlichting, I., J. Berendzen, G. N. Phillips, Jr., and R. M. Sweet. 1994. Crystal structure of photolysed carbonmonoxy-myoglobin. Nature. 371:808–812. [DOI] [PubMed] [Google Scholar]
- Scott, E. E., and Q. H. Gibson. 1997. Ligand migration in sperm whale myoglobin. Biochemistry. 36:11909–11917. [DOI] [PubMed] [Google Scholar]
- Scott, E. E., Q. H. Gibson, and J. S. Olson. 2001. Mapping the pathways for O2 entry into and exit from myoglobin. J. Biol. Chem. 276:5177–5188. [DOI] [PubMed] [Google Scholar]
- Srajer, V., Z. Ren, T.-Y. Teng, M. Schmidt, T. Ursby, D. Bourgeois, C. Pradervand, W. Schildkamp, M. Wulff, and K. Moffat. 2001. Protein conformational relaxation and ligand migration in myoglobin: a nanosecond to millisecond movie from time-resolved Laue X-ray diffraction. Biochemistry. 40:13802–13815. [DOI] [PubMed] [Google Scholar]
- Srajer, V., T.-Y. Teng, T. Ursby, C. Praverdand, Z. Ren, S.-I. Adachi, W. Schildkamp, D. Bourgeois, M. Wulff, and K. Moffat. 1996. Photolysis of the carbon monoxide complex of myoglobin: nanosecond time-resolved crystallography. Science. 274:1726–1729. [DOI] [PubMed] [Google Scholar]
- Steinbach, P. J., A. Ansari, J. Berendzen, D. Braunstein, K. Chu, B. R. Cowen, D. Ehrenstein, H. Frauenfelder, J. B. Johnson, and D. C. Lamb. 1991. Ligand binding to heme proteins: connection between dynamics and function. Biochemistry. 30:3988–4001. [DOI] [PubMed] [Google Scholar]
- Steinbach, P. J., K. Chu, H. Frauenfelder, J. B. Johnson, D. C. Lamb, G. U. Nienhaus, T. B. Sauke, and R. D. Young. 1992. Determination of rate distributions from kinetic experiments. Biophys. J. 61:235–245. [DOI] [PMC free article] [PubMed] [Google Scholar]
- Susi, H., and D. M. Byler. 1983. Protein structure by Fourier Transform Infrared Spectroscopy: second derivative spectra. Biochem. Biophys. Res. Commun. 115:391–397. [DOI] [PubMed] [Google Scholar]
- Susi, H., and D. M. Byler. 1986. Resolution-enhanced Fourier Transform Infrared Spectroscopy of enzymes. Methods Enzymol. 130:291–311. [DOI] [PubMed] [Google Scholar]
- Teng, T.-Y., V. Srajer, and K. Moffat. 1997. Initial trajectory of carbon monoxide after photodissociation from myoglobin at cryogenic temperatures. Biochemistry. 36:12087–12100. [DOI] [PubMed] [Google Scholar]
- Teng, T.-Y., V. Srajer, and K. Moffat. 1994. Photolysis-induced structural changes in single crystals of carbonmonoxy myoglobin at 40 K. Nat. Struct. Biol. 1:701–705. [DOI] [PubMed] [Google Scholar]
- Tetreau, C., C. Di Primo, R. Lange, H. Tourbez, and D. Lavalette. 1997. Dynamics of carbon monoxide binding with cytochromes P-450. Biochemistry. 36:10262–10275. [DOI] [PubMed] [Google Scholar]
- Tetreau, C., E. Novikov, M. Tourbez, and D. Lavalette. 2002. Kinetic evidence for three photolyzable taxonomic conformational substates in oxymyoglobin. Biophys. J. 82:2148–2155. [DOI] [PMC free article] [PubMed] [Google Scholar]
- Tetreau, C., M. Tourbez, and D. Lavalette. 2000. Conformational relaxation in hemoproteins: the cytochrome P450cam case. [DOI] [PubMed]
- Tilton, R. F., Jr., U. C. Singh, S. J. Weiner, M. L. Connolly, I. D. Kuntz, Jr., P. A. Kollman, N. Max, and D. A. Case. 1986. Computational studies of the interaction of myoglobin and xenon. J. Mol. Biol. 192:443–456. [DOI] [PubMed] [Google Scholar]
- Tilton, R. F., I. D. Kuntz, and G. A. Petsko. 1984. Cavities in proteins: structure of a metmyoglobin-xenon complex solved to 1.9 Å. Biochemistry. 23:2849–2857. [DOI] [PubMed] [Google Scholar]
- Vojtechovsky, J., K. Chu, J. Berendzen, R. M. Sweet, and I. Schlichting. 1999. Crystal structures of myoglobin-ligand complexes at near-atomic resolution. Biophys. J. 77:2153–2174. [DOI] [PMC free article] [PubMed] [Google Scholar]
- Yedgar, S., C. Tetreau, B. Gavish, and D. Lavalette. 1995. Viscosity dependence of O2 escape from respiratory proteins as a function of cosolvent molecular weight. Biophys. J. 68:665–670. [DOI] [PMC free article] [PubMed] [Google Scholar]


