Abstract
Protonated networks of internal water molecules appear to be involved in proton transfer in various integral membrane proteins. High-resolution x-ray studies of protein crystals at low temperature deliver mean positions of most internal waters, but only limited information about fluctuations within such H-bonded networks formed by water and residues. The question arises as to how water molecules behave inside and on the surface of a fluctuating membrane protein under more physiological conditions. Therefore, as an example, long-time molecular dynamics simulations of bacteriorhodopsin were performed with explicit membrane/water environment. Based on a recent x-ray model the bacteriorhodopsin trimer was inserted in a fully solvated 16 × 16 1-palmitoyl-2-oleoyl-sn-glycero-3-phosphocholine (POPC)-bilayer patch, resulting in a system of ∼84,000 atoms. Unrestrained molecular dynamics calculations of 5 ns were performed using the GROMACS package and force field. Mean water densities were computed to describe the anisotropic distribution of internal water molecules. In the whole protein two larger areas of higher water density are identified. They are located between the central proton binding site, the Schiff base, and the extracellular proton release site. Separated by Arg-82 these water clusters could provide a proton release pathway in a Grotthus-like mechanism as indicated by a continuum absorbance change observed during the photocycle by time-resolved Fourier transform infrared spectroscopy. Residues are identified which are H-bonded to the water clusters and are therefore facilitating proton conduction. Their influence on proton transfer via the H-bonded network as indicated by the continuum absorbance change is predicted. This may explain why several site-directed mutations alter the proton release kinetics without a direct involvement in proton transfer.
INTRODUCTION
Internal structural water molecules seem to play an important role in proton conduction in membrane proteins like bacteriorhodopsin, the photosynthetic reaction center, and cytochrome-c oxydases (for reviews see Lanyi, 1999; Okamura et al., 2000; Ostermeier et al., 1997). For the light-driven proton pump bacteriorhodopsin it has been explicitly shown that H-bonded network proton transfer takes place (LeCoutre et al., 1995; Rammelsberg et al., 1998). bR proteins are arranged in trimers forming a two-dimensional crystalline lattice, the so-called purple membrane found in Halobacterium salinarium. After light excitation bacteriorhodopsin's chromophore retinal, which is bound via a protonated Schiff base to Lys-216 of the protein, undergoes an all-trans to 13-cis isomerization in ∼450 fs. Thereby, free energy is stored that drives a photocycle via the intermediates J, K, L, M, N, and O, characterized by different absorption maxima (Lozier et al., 1975). During the L to M transition the central proton binding site, the protonated Schiff base, is deprotonated and its counterion Asp-85 becomes protonated. (Gerwert et al., 1989, 1990). Concomitantly, a proton is released from the extracellular surface near Glu-204 and Glu-194 (Richter et al., 1996; Rammelsberg et al., 1998). In the M to N reaction the Schiff base is reprotonated by Asp-96 (Gerwert et al., 1990). On the cytoplasmic surface a proton is taken up which reprotonates Asp-96 in the N to O transition (Gerwert et al., 1990). In total a net proton is transferred from the cytoplasma to the extracellular medium. Besides the localized proton binding sites, the Schiff base, Asp-85 and Asp-96 internal water molecules seem to provide delocalized proton binding sites and thereby a proton conduction wire in a Grotthus-like mechanism. Protonated H-bonded networks of water molecules cause broad infrared (IR) continuum bands (Zundel, 1992). Absorbance changes of such IR continuum bands are identified during bacteriorhodopsin's photocycle, indicating the deprotonation of protonated water clusters (LeCoutre et al., 1995; Rammelsberg et al., 1998). A continuum absorbance change that disappears during the L to M reaction could be correlated to the proton release kinetics. Anytime the proton release is disturbed by mutation also the continuum band vanishes (Rammelsberg et al., 1998). It was concluded that the proton release group consists of an H5O2+ complex stabilized by Glu-204 and Glu-194 (Spassov et al., 2001). Also the proton transfer across the 11-Å distance from Asp-96 to the Schiff base seems to take place via internal water molecules (Gerwert et al., 1990; LeCoutre et al., 1995). High-resolution x-ray structural models support these proposals by resolving several internal water molecules (Belrhali et al., 1999; Luecke et al., 1999; Sass et al., 2000). Besides the mean water positions within bR crystals at 100 K, only limited information on the dynamics of the water molecules is obtained in the form of isotropic B-factors. However, proteins fluctuate considerably at room temperature (above the glass transition) and the question arises as to how the internal waters behave within such a dynamic system. At present only a computer simulation can help to transform the available structural models into a dynamic model for the protein at 300 K and in an adequate membrane water environment.
The study of membrane proteins by means of computer simulation is a fast developing field. First, calculations of the light-driven proton pump bacteriorhodopsin (bR) were carried out under vacuum conditions and covered a time range of a few hundred picoseconds. As computing power increased, bR was considered in a more native environment of explicit lipid and water molecules: simulations range from single helices in a membrane context (Woolf, 1997) over isolated bR monomers (Humphrey et al., 1995; Xu et al., 1995) to full trimers in a complete lipid/water environment (Edholm and Jahnig, 1992; Edholm et al., 1995). The latter covered simulation times of 0.325 ns of unrestrained molecular dynamics (MD) and a system of 18,384 atoms. Structural fluctuations were analyzed and water exchange was observed to take place. The most recent publication deals with a bR trimer in a crystal unit cell, a system size of 23,783 atoms and a total amount of 1.06 ns simulation time (Baudry et al., 2001). After heating, two MD simulations were performed: 0.65 ns at constant box volume and 0.35 ns at constant pressure. A connection between bulk and internal water and key side chains was mentioned. Technically, the relaxation of the membrane turned out to be problematic. The most complex MD investigation on a membrane protein system published so far was carried out by de Groot and Grubmuller (2001), where a system of ∼100,100 atoms was simulated for 10 ns.
The classical MD simulations were extended in quantum mechanical/molecular mechanical (QM/MM) calculations, in which recently the hydrogen-bonded network in the retinal binding pocket of a single bacteriorhodopsin monomer was treated quantum mechanically. The QM section consisted of the protonated Schiff base retinal, Lys-216, Asp-85, Asp-212, and waters 401, 402, and 406 (Hayashi and Ohmine, 2000). This region has attracted special attention as it is involved in early events of proton transfer. For water 402 the QM treatment turned out to be important since electronic interactions such as charge transfer and polarization appeared to be essential properties of the bR ground state considered here (Hayashi and Ohmine, 2000; Hayashi et al., 2002). It has also become clear that a satisfactory QM treatment will be restricted to short times and a small part of the protein as long the computer power forbids treating the whole system over nanoseconds.
This work focuses on distribution and dynamics of all water molecules within and on the surface of the entire fluctuating protein determined on grounds of long-time MD simulations. As the classical nonpolarizable SPC water model is used, some details of the water dynamics may be less accurate due to inappropriate charge representation as compared to quantum chemical calculations, especially the interactions of water 402 with the charged Schiff base and Asp-85. However, the water dynamics are studied in a model for bR at 300 K in which the complete bR-trimer is embedded in an explicit 1-palmitoyl-2-oleoyl-sn-glycero-3-phosphocholine (POPC) lipid/water environment. The system will comprise a total of 84,000 atoms and 5 ns of unrestrained classical MD were performed using the GROMACS package and force field (Berendsen et al., 1995; Lindahl et al., 2001). The equilibration of the complete ternary protein/lipid/water systems reveals a new dynamic structural model, of which the dynamics of the water molecules are analyzed in detail. Regions of the protein are identified that can be reached from bulk water by diffusion and clusters of water are determined that are isolated from the bulk inside the protein. The anisotropic distribution of water molecules inside the protein is described by computing water densities (Lounnas and Pettitt, 1994; Makarov et al., 2000; Henchman and McCammon, 2002). In a quantitative analysis the contribution of residues to internal hydrogen-bonded water networks is assessed. This proposal can be validated by comparison with experimental data. The influence of mutations of H-bonded residues on the Grotthus-like proton transfer as indicated by the continuum absorbance is predicted.
MATERIALS AND METHODS
Simulation system
Since the development of the lipidic cubic phases concept (Landau and Rosenbusch, 1996) high-resolution x-ray structures of bR have become available, presently to a maximum resolution of 1.55 Å of the protein's ground state (Luecke et al., 1999; Protein Data Bank entry 1c3w), which unfortunately does not contain data for the upper cytoplasmic part of helix E and the E/F loop region, respectively; amino acids 157–161 remain unresolved. We have used, instead, the 1.9-Å structure 1qhj (Belrhali et al., 1999), which provides a more convenient starting point for building the simulation model as the whole transmembrane region has been resolved and only terminal groups are missing. The root mean square (RMS) deviation of the Cα atoms from the 1c3w structure is low (0.93 Å). The main difference lies in residue 33 in the AB loop (Cα deviation of 2.3 Å) and residues 162 and 156 framing the problematic EF region (Cα deviations of 2.2 and 2.1 Å, respectively). Furthermore there is one internal water in each model that has no correspondence in the other, namely water 502 in the 1c3w and water 409 in the 1qhj structure.
Using the 1.9-Å structure of a single monomer a cavity analysis via SURFNET (Laskowski, 1995) was performed and two further water molecules were added where space for additional water was found. One resembles the position of water 502 of the 1c3w structure, which is not present in the 1qhj entry; the other is next to water 501L (1c3w)/404B (1qhj). Water molecules in internal cavities without connection to the environment are considered as internal waters.
The bacteriorhodopsin trimer was reconstructed and all missing amino acids (4 N-terminal, 16 C-terminal, 3 incomplete interim) were modeled using Insight II. Under GROMACS the protein was energy-minimized and short in vacuo MD runs were performed to achieve first adequate relaxation of the termini toward the main protein so the protein could be inserted into the membrane. With restraints applied to all atoms except the modeled termini, this was achieved after 16 ps for monomers B and C (which subsequently were completely restrained) and after a further 50 ps for monomer A. The protein data set was then inserted into a fully solvated 16 × 16 POPC bilayer (1-palmitoyl-2-oleoyl-phosphatidylcholine). In case of bR one could think of reconstructing the entire 2D-crystal using the archaeal lipids identified in the x-ray structural models as done by Baudry and co-workers (Baudry et al., 2001). Unfortunately there are no appropriate molecular descriptions available for these lipids and extensive testing studies of each the three lipid species would be necessary. Thus we decided to make an approximation by resorting to POPC, for which, next to DPPC and DMPC, the best and most extensively tested (and approved) topologies are available. And since it is known that bR can be reconstituted in POPC and still remains fully functional, this is a valid approach. The 16 × 16 lipid patch we used had been built from an equilibrated and fully solvated original 8 × 8 lipid patch provided by Peter Tieleman (Tieleman et al., 1999). To combine both scenes, box sizes had to be adapted, the protein oriented in the membrane (using main-chain inertial tensors of residues 5–232), and overlapping lipids and waters removed. This resulted in a simulation system of 744 amino acids, 391 lipids, and 18,782 water molecules, comprising an overall size of 83,941 atoms. Combined with the simulation time of 5 ns this is the largest and longest bR MD system published so far.
Simulation details
For all calculations the GROMACS standard ffgmx force field and the SPC water model were used. The runs were performed on a 10-node PIII-450 Linux cluster and a dual-CPU Athlon 1600+, with an effective calculation time of ∼6–10 days per nanosecond.
Apart from Asp-96 and Asp-115 that were protonated (Gerwert et al., 1989, 1990), standard protonation states were assumed for all amino acids. To maintain the side-chain conformation of Glu-204 and Glu-194 in the x-ray structural models, Glu-204 was also protonated. Thereby a not explicitly modeled H5O2+ complex is regarded as the proton release group (Rammelsberg et al., 1998; Spassov et al., 2001).
The retinal was modeled as an additional artificial amino acid that starts as a lysine and ends as a retinal. For bonded and van der Waals interactions GROMACS/GROMOS standard parameters were used. Electrostatic interactions were modeled on grounds of QM/MM calculations (BLYP ESP charges) of protonated Schiff base retinal (QM) in the 1c3w bR structural model (MM). These results were kindly provided by Gerald Mathias and Paul Tavan at the Ludwig-Maximilians-Universität Munich (personal communication). Compared to the HF RESP charges used by Hayashi and Ohmine (2000) the polarity of the methyl groups is more emphasized here. This is also the case with the partial charges published in Spassov et al. (2001), which are very similar to the ones we used. The Schiff base region itself is treated almost identically in all three cases. According to the concept of GROMACS, all hydrogens except the Schiff base hydrogen were included in united atoms CHn. We decided to split the total charge, which adds up to one, into charge groups carrying smaller or vanishing partial charges. That way a better description of the delocalized charge is achieved and jumps in electrostatic force are suppressed when a new pair list is generated. Table 1 summarizes the original QM charges (including hydrogens), partial charges we derived, GROMACS atom types, and the charge groups used. The compatibility of the charges with the GROMACS force field was checked by energy minimization of the bR monomer, which induced only minimal deviations of the retinal chain and a tolerable deformation of the beta-ionone ring conformation.
TABLE 1.
QM charges, derived partial charges, atom types, and charge groups used in the combined Lys 216/retinal topology
| Atom | GROMACS atom type | QM charge | Partial charge | Charge group |
|---|---|---|---|---|
| N | N | — | −0.280 | 0 |
| H | H | — | 0.280 | 0 |
| CA | CH1 | — | 0.000 | 1 |
| CB | CH2 | — | 0.000 | 2 |
| CG | CH2 | — | 0.000 | 3 |
| CD | CH2 | — | 0.000 | 4 |
| CE | CH2 | −0.14066 (0.14320, 0.17021) | 0.173 | 5 |
| NZ | N | −0.11940 | −0.119 | 5 |
| HZ | H | 0.35301 | 0.353 | 5 |
| C15 | CR61 | 0.23001 (0.13351) | 0.363 | 6 |
| C14 | CR61 | −0.56680 (0.21532) | −0.352 | 6 |
| C20 | CH3 | −0.63928 (0.14988,0.19034, 0.1675) | −0.131 | 6 |
| C13 | CB | 0.65933 | 0.659 | 6 |
| C12 | CR61 | −0.51748 (0.22184) | −0.296 | 6 |
| C11 | CR61 | 0.14919 (0.14173) | 0.291 | 7 |
| C10 | CR61 | −0.43730 (0.17673) | −0.261 | 7 |
| C19 | CH3 | −0.57749 (0.14773, 0.13315, 0.17406) | −0.122 | 7 |
| C9 | CB | 0.46505 | 0.465 | 7 |
| C8 | CR61 | −0.50080 (0.17593) | −0.325 | 8 |
| C7 | CR61 | 0.15452 (0.14672) | 0.301 | 8 |
| C6 | CB | −0.30740 | −0.307 | 9 |
| C18 | CH3 | −0.64084 (0.13540, 0.16500, 0.18994) | −0.151 | 9 |
| C5 | CB | 0.45790 | 0.458 | 9 |
| C4 | CH2 | — | 0.000 | 10 |
| C3 | CH2 | — | 0.000 | 11 |
| C2 | CH2 | — | 0.000 | 12 |
| C1 | CB | — | 0.000 | 13 |
| C16 | CH3 | — | 0.000 | 14 |
| C17 | CH3 | — | 0.000 | 15 |
| C | C | — | 0.380 | 16 |
| O | O | — | −0.380 | 16 |
QM charges in parentheses represent hydrogens.
In a test simulation we also used a second retinal topology with neutral Schiff base and vanishing total charge as shown in Table 2. This somewhat artificial arrangement was introduced to study the charge sensitivity of the conformation of Arg-82.
TABLE 2.
Partial charges, atom types, and charge group used in the combined Lys-216/retinal topology
| Atom | GROMACS Atom type | Partial charge | Charge group |
|---|---|---|---|
| N | N | −0.280 | 0 |
| H | H | 0.280 | 0 |
| CA | CH1 | 0.000 | 1 |
| CB | CH2 | 0.000 | 2 |
| CG | CH2 | 0.000 | 3 |
| CD | CH2 | 0.000 | 4 |
| CE | CH2 | 0.000 | 5 |
| NZ | N | −0.415 | 5 |
| HZ | H | 0.415 | 5 |
| C15 | CR61 | 0.000 | 5 |
| C14 | CR61 | 0.000 | 6 |
| C20 | CH3 | 0.000 | 7 |
| C13 | CB | 0.000 | 8 |
| C12 | CR61 | 0.000 | 9 |
| C11 | CR61 | 0.000 | 10 |
| C10 | CR61 | 0.000 | 11 |
| C19 | CH3 | 0.000 | 12 |
| C9 | CB | 0.000 | 13 |
| C8 | CR61 | 0.000 | 14 |
| C7 | CR61 | 0.000 | 15 |
| C6 | CB | 0.000 | 16 |
| C18 | CH3 | 0.000 | 17 |
| C5 | CB | 0.000 | 18 |
| C4 | CH2 | 0.000 | 19 |
| C3 | CH2 | 0.000 | 20 |
| C2 | CH2 | 0.000 | 21 |
| C1 | CB | 0.000 | 22 |
| C16 | CH3 | 0.000 | 23 |
| C17 | CH3 | 0.000 | 24 |
| C | C | 0.380 | 25 |
| O | O | −0.380 | 25 |
Schiff base charge was neutralized.
When protein and lipid/water sets were combined successfully, 1 ns of membrane equilibration was performed. With all protein atoms restrained, membrane and water were given sufficient time to adapt to the inserted bR. Temperature coupling of 300 K with τt = 0.1 ps and 1 bar anisotropic pressure coupling on the z axis (i.e., membrane normal) with τp = 1.0 ps were applied. For the calculation of nonbonded interactions twin range cutoffs were used: rvdw = 1.0 nm, rcoulomb = 1.8 nm. The neighbor list cutoff distance was set to 1.0 nm whereas the neighbor list itself was updated every 10 steps. All bond lengths were constrained so a time step of 2 fs could be chosen. After membrane equilibration, 5 ns of unrestrained molecular dynamics followed. The run parameters were the same as above, only this time with 1 bar isotropic pressure coupling. Every 1000 steps, i.e., every second ps, the system's structure was saved. In all calculations periodic boundary conditions were applied to every side of the simulation box. The combination of anisotropic (membrane equilibration) and isotropic pressure coupling (production run) has turned out to deliver reliable results in our lab. No artifacts of lateral pressure have been observed.
Water densities
The expected irregular distribution of water in the protein's interior is most easily represented as the distribution in a space-filling rectangular grid (Makarov et al., 2000; Henchman and McCammon, 2002). Our method is essentially analogous to the point frame method used in the latter work. The transient structures of all monomers including water molecules are superimposed onto a monomer reference structure. A cubic spatial grid with an edge length of 1 Å connected with the reference structure was used to count the number of water oxygens per subcube and to calculate the mean density as the time-averaged number per Å3. The evaluation was done for 3 ns after the 2-ns equilibration phase. Note that the mean density is averaged over the three monomers. Except on the protein surface, rather isolated regions of measurable water occupancy were found. For visual representation we considered only voxels exceeding a cutoff density of 0.015 H2O/Å3, which is ∼50% of the value for bulk water under standard conditions. Lower cutoff values result in large and rather undifferentiated distributions, covering regions of low residence probability, whereas higher cutoff levels do not fully regard the water's mobility anymore. Clustering of density voxels was achieved by computing Connolly surfaces for the cells exceeding the cutoff. A probe radius of 1.4 Å was used. Higher cutoff values were used analogously to find the most probable water positions in a density.
The close analogy to the evaluation of crystallographic electron densities also suggests the determination that the temperature factors B of the N waters confined to a particular cavity. This was done for one example by fitting N three-dimensional Gauss distributions to the density data. Each resulting B-factor or the standard deviation of a position, σ = sqrt(B/8π2), belongs to a water site and is not to be confused with the fluctuation amplitude or mobility of a water molecule, which can be much larger, e.g., by diffusion.
Hydrogen-bond analysis
Hydrogen bonds are determined using the GROMACS tool g_hbond with restrictions for the donor-hydrogen-acceptor angle (cutoff = 60°) and the hydrogen-acceptor distance (cutoff = 2.5 Å). OH and NH groups are regarded as donors, O and N as acceptors. The output has the form of time-resolved H-bond trajectories (values 1 or 0) for each pair that at least once is found to form an H-bond.
The large number of possible partners among 744 amino acids and 18,782 water molecules requires restriction to a selection of interesting groups. As some functionally important residues for bacteriorhodopsin are already known, an initial group of key residues was selected. The residues are Thr-46, Tyr-57, Arg-82, Asp-85, Asp-96, Trp-182, Trp-189, Ser-193, Glu-194, Glu-204, Ala-215, and Lys-216. Among them an influence on proton transfer has been proved experimentally for Arg-82, Asp-85, Asp-96, Glu-194, and Glu-204 (Gerwert et al., 1989, 1990; Lanyi, 1999). The other residues had been proposed to form H-bonds with water, which is clearly internal in the x-ray models. By a first H-bond analysis where all waters, but only the key residues are considered, we identify the subset of “essential” water that interacts with them.
In a second analysis we monitor the fate of these waters to identify further residues forming H-bonds with the water subset. Eventually this yields a complete list of residues that are, at least temporarily, in contact with essential water molecules. For each such residue the average frequency of H-bond contacts (in percent of simulation time) is determined.
The relatively small number of essential waters allows a classification by visual inspection of trajectories. It was possible to differentiate rather local fluctuations from large-scale, diffusive motions that always mean exchange with the bulk phase. Accordingly we distinguish between permanently internal and temporarily associated water molecules.
Contact index
For relevant residues a second parameter was calculated which is called the contact index (CI). It measures the involvement of the side chain in H-bonded networks of essential water. Together with the contact frequency defined before it helps to predict if site-specific mutagenesis would induce a measurable effect on the IR-continuum band. Each residue located in proximity to densities IV and VI was investigated. For each residue we differentiate four cases of H-bonding to water: via backbone only >B< (c = 0), side chain and backbone >SB< (c = 0.5), side chain only >S< (c = 1), and missing H-bonding (c = 0) in the evaluation period. The behavior was investigated separately in each monomer, and each case is assigned a certain numeric value which, added up for all monomers, results in CI = c1 + c2 + c3. The contact index is characteristic of a particular residue and varies from 0 to 3.
RESULTS AND DISCUSSION
System stability
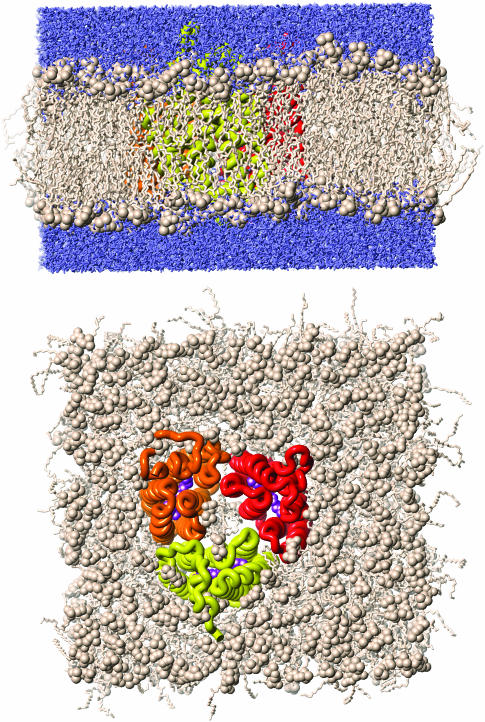
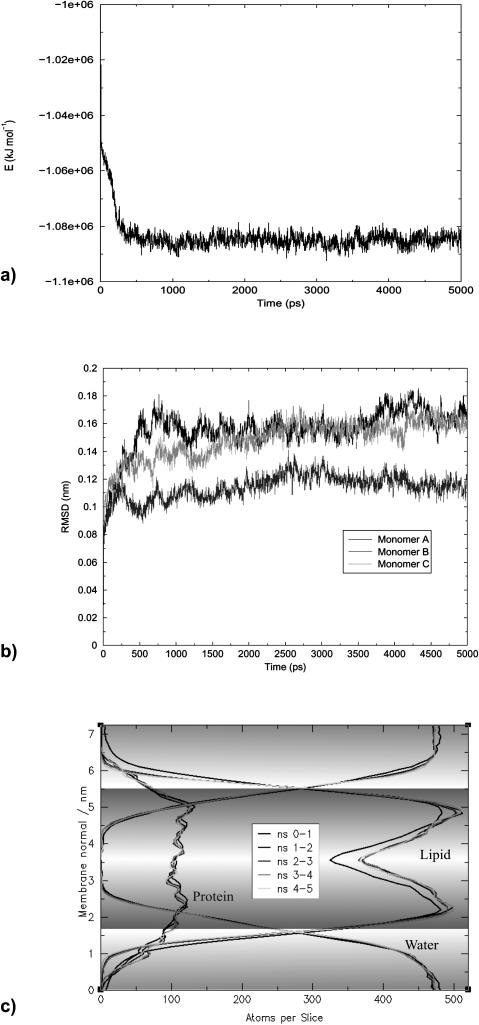
In Fig. 1 the complete simulation system is displayed in a side and top view after 5 ns simulation time. Relaxation of equilibrium-relevant parameters is shown in Fig. 2: the system's total energy reaches a stable plateau level after 1 ns of unrestrained MD (Fig. 2 a). As monitored by RMS displacements of the Cα atoms the protein structures behave similarly: the individual monomers move away from the crystal structure converging to two stable plateaus after 1 and 2 ns, respectively (Fig. 2 b), with RMS distances of ∼1.1 Å (monomer B) and 1.6 Å (monomers A and C) from the x-ray Cα atoms. The displacements were calculated from transient structures superimposed on the x-ray structure as reference. Apparently the dynamic model can be considered stable and in good agreement with the x-ray data. After 2 ns the system has reached equilibrium. The next 3 ns were used for analysis.
FIGURE 1.
The complete bR trimer embedded in a POPC-lipid/water environment. The simulation system comprises 744 amino acids, 391 lipids, and 18,782 water molecules. The total number of atoms is 83,941 at a simulation time of 5 ns of unrestrained MD.
FIGURE 2.
System stability as monitored by the total energy (a); Cα RMS distances Ds of single monomers with respect to the starting structure (b); and partial densities' evolution of the system's main components: lipid, protein, and water (c). The system reaches an equilibrium after 2 ns.
In the simulation of membrane systems the stability of the bilayer is a critical parameter. Any large-scale deformations must be avoided. For this purpose we monitored the overall stability of the system and its three main components (i.e., lipid, water, and protein) by measuring partial densities and their evolution over the simulation time. The simulation box was divided into slices parallel to the xy (membrane) plane and the atoms within these voxels were counted. An average for each nanosecond was recorded to analyze the partial densities' development. As shown in Fig. 2 c none of the three components exhibits any significant changes.
Single molecules and ensemble average
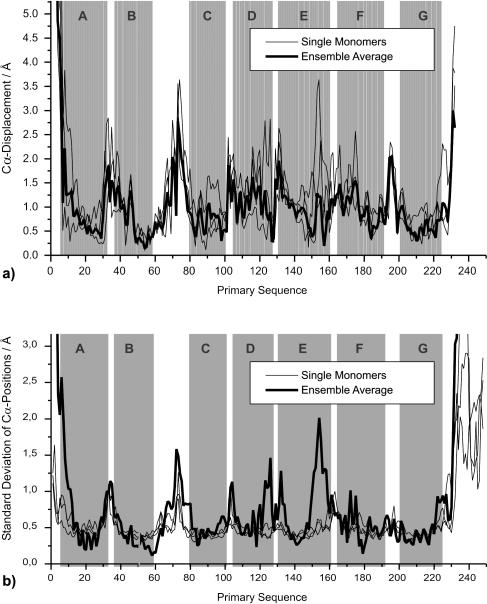
The three monomers' trajectories were averaged and three mean structures were calculated: meanA, meanB, and meanC. These were averaged again to obtain the ensemble average meanall. For superposition on the x-ray model the Cα atoms of residues 5 to 232 were used for reference. The root mean square deviations of the four mean structures from the x-ray model are 1.54 Å (meanA), 1.09 Å (meanB), 1.46 Å (meanC), and 1.12 Å (meanall). Monomer B stays relatively close to the initial structure whereas A and C move away further by ∼50%. The Cα displacement plots in Fig. 3 a quantify the structural differences of the mean structures to the x-ray model: the single monomers display greater displacements (average 1.03 Å in helices and 1.44 Å in loops) than the ensemble average (average 0.86 Å in helices and 1.24 Å in loops). With their centers of mass remaining unchanged the monomers shift away from the starting structure into different directions in conformational space. Nevertheless their ensemble average is surprisingly close to the x-ray model despite the 200-K temperature difference. This conforms with results reported by Edholm et al. (1995), indicating that there is a wider variety in the ground state conformations of bR monomers than was assumed on the grounds of the x-ray data alone.
FIGURE 3.
Single monomers and ensemble average. Mean structures were computed for each monomer and the ensemble average. The mean structures' conformational differences compared to the x-ray model are quantified by Cα displacement plots. Despite the 200-K temperature difference the ensemble average is still compatible with the x-ray data (a). The monomers take new conformations in the course of the simulation whose stability is reflected by the standard deviation of their Cα positions (b): Since only small structural fluctuations are observed for the single monomers (thin lines) and only small deviations from the ensemble average (bold line) the new conformations can be considered stable. Considerable differences compared to the ensemble mean occur only in two regions where either no unique structure could be assigned to the x-ray scattering signal or large B-factors were given. The initial position of helical elements is underlined with gray rectangles.
Single monomers undergo conformational changes in the course of the simulation. The stability of the new mean conformations is investigated as reflected by the standard deviation of their Cα positions (Fig. 3 b) Almost everywhere the monomers show relatively small (∼0.5 Å) structural fluctuations (thin lines) and deviate hardly at all from their ensemble average (bold line). Apparently the new conformations of the monomers can be considered stable under the simulated conditions. Only in two regions, around the DE-loop and in the upper part of helix E, a different behavior is observed: The thin lines of the monomers indicate stability at low fluctuations, but the bold line of the ensemble average increases to 1.5 Å at Cα 126, 1.3 Å at Cα 132, and 2 Å at Cα 154. This points to large differences among the monomers' mean structures. Interestingly, this structural inhomogeneity arises in a section where either no unique structure could be assigned to the x-ray scattering signal (1c3w) or large B-factors (1qhj) were given. This result is now explained by the different individual behavior of the monomers.
Water dynamics and water densities
Based on the hydrogen-bond analysis described below, individual water molecules were identified as internal waters when they were found to be in contact with certain key residues anytime in the 3-ns observation period. Their fluctuations or diffusion movements were investigated at 300 K under noncrystal conditions within the fluctuating protein. Two general types of internal waters are distinguished: permanently internal and temporarily associated waters.
Temporarily associated waters intrude from the bulk phase and diffuse in and out during the observation time. Permanently internal waters are either intrusive water molecules that have entered the protein during the equilibration period and remained inside or they have been inside the protein from the beginning. Such waters were either already present in the x-ray structure or they have been additionally inserted into the bR.
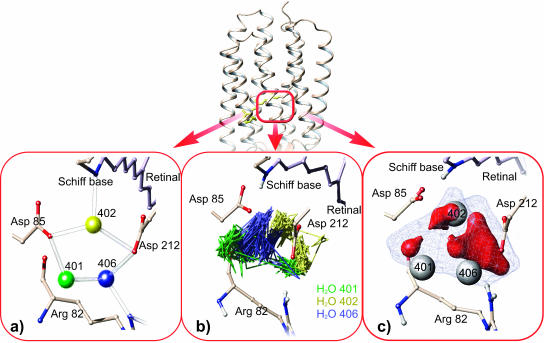
In the following we shall essentially confine ourselves to the results found in the equilibrium phase of the simulations, i.e., the last 3 ns. The MD simulation at 300 K, of course, exhibits a higher degree of dynamics than the 100 K x-ray structure and gives more insight into the underlying behavior. In Fig. 4 this is illustrated on the triple water cluster 401BL, 402BL, and 406BL near the Schiff base. In the x-ray structural models the water molecules seem to be held by hydrogen bonds at fixed positions (Fig. 4 a). The MD simulation shows highly mobile waters with fluctuations of >4 Å per individual water molecule, which are due to vibrations and interchange. No exchange with other cavities was observed. Water 402BL, for example, establishes H-bonds either to Asp-85, the Schiff base, Asp-212 and Trp-86, or to Asp-212 and Arg-82, thereby moving by 4.35 Å. Obviously at room temperature the waters are highly dynamic and interact with mobile side chains.
FIGURE 4.
Triple water cluster 402, 401, and 406 near the Schiff base. In the x-ray structural model the waters seem to be held by hydrogen bonds at fixed positions (a), whereas the MD simulation reveals highly mobile water molecules with trajectories displayed in (b). In (c) this is described by a mean water density of the triple water cluster. A mesh resolution of 1 Å was used and water-type Connolly surfaces were computed for all cells with a density exceeding 0.015 H2O/Å3 (blue) and 0.1 H2O/Å3 (red). The three red areas indicate maximum residence probability and are compatible with the water positions in the x-ray structural models (white spheres). The size of the density maxima correlates with the crystallographic B-factors determined for the respective waters. The density displayed is lettered “IV” in the following figures. Note that for a correct modeling of the Asp-85 side-chain conformation QM treatment is necessary.
One should be aware, however, that because of the computational amount this long-time behavior could be observed only for a relatively simple water model, and possibly lacks accuracy in certain details. The limitation is most on water 402. In accordance with the x-ray structural models, Asp-85 and the Schiff base are sometimes found to be bridged by water 402. However, this occurs only to 7% and is not the prevailing arrangement in the simulation, which was also found recently by others (Hayashi et al., 2002) and apparently is due to missing polarization and charge transfer contributions in the classical treatment (Hayashi and Ohmine, 2000). Interestingly, the position of water 402 itself seems to be stabilized near the known crystal position by sufficient interactions with other waters and the Schiff base (see Fig. 4 b and next paragraph). Instead, the inadequate electrostatic interaction moves the carboxylic group of Asp-85 to directly contact the Schiff base. The x-ray position of water 402 between the Schiff base and Asp-85 could only be reproduced in a QM treatment or alternatively by the application of a fluctuating charge model for water together with an ad hoc modified force field (Hayashi et al., 2002).
Internal waters display anisotropic fluctuations during the MD, which suggests that a suitable description of the internal water requires a study of water density (Lounnas and Pettitt, 1994; Makarov et al., 2000; Henchman and McCammon, 2002). The density was defined in Materials and Methods as a mean quantity averaged over time and all monomers. Wherever isolated clusters of nonvanishing density occur they are referred to as numbered local densities. For the triple water cluster the water density determined from MD trajectories is illustrated in Fig. 4 b. The Connolly surfaces shown cover all voxels with a density exceeding 0.015 H2O/Å3 (blue) and 0.1 H2O/Å3 (red), respectively. The mean water densities are compared to the water positions given in the x-ray structural models, which are identical here. The waters 401BL, 402BL, and 406BL (white spheres) are found within the blue region (with half the bulk water density). They are even contained in or at least close to the three red areas of maximum residence probability (three times the bulk water density). It seems reasonable to speak of a very similar, although distinguishable, mean water distribution.
The three discernible sites are characterized by anisotropic and different distributions. The preferred “red” volume at each site increases from 401BL to 406BL in agreement with the increasing 100-K B-factor that varies from 23.3 to 36.8 (1qhj), the corresponding mean standard deviation per site being 0.6 Å. The analogy between water density and electron density suggests an analogous evaluation to obtain positions and standard deviations, which are of course temperature-dependent. We therefore fitted three normalized anisotropic Gaussian functions to the density of the water triple, and obtained standard deviations of (0.6 ± 0.4) Å. They reflect the enhanced fluctuations at 300 K compared to 100 K where the fluctuation part of the total standard deviation is in any case smaller than the 0.6 Å calculated from the crystallographic B-factor.
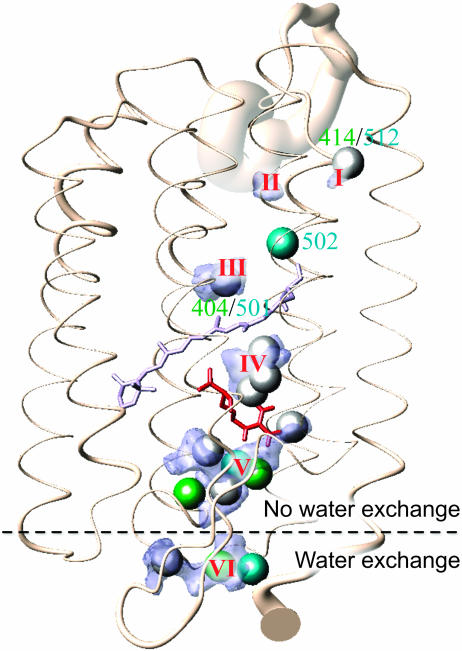
For the whole protein the mean water densities in comparison to the waters found in the x-ray models 1c3w and 1qhj are presented in Fig. 5. Matching water positions are colored white, whereas other 1c3w waters are shown in cyan and 1qhj waters are green. Six water-density regions are found that exceed 0.015 H2O/Å3. Three are located in the cytoplasmic and three in the extracellular half of the protein. The density distributions found on the intracellular side above the retinal are notably smaller, reflecting the rather hydrophobic nature of the proton uptake channel as compared to the proton release side below the retinal. The density distributions include or at least touch the x-ray water positions except for density II that has no direct counterpart in the x-ray structural models but traces back to water 502L that has left its initial position during equilibration.
FIGURE 5.
Overview of the whole protein showing the mean water densities in comparison with the internal waters in the x-ray structures 1qhj and 1c3w (as spheres with a radius of 1.4 Å). Matching positions are colored white; other 1qhj waters appear green and 1c3w waters cyan. Water densities are represented by Connolly surfaces enveloping cells with a density >0.015 H2O/Å3 (blue). Six water densities were found. The protein conformation shown is the ensemble average structure. The thickness of the ribbon indicates the standard deviation of the Cα positions originating. essentially from fluctuations.
The size of a density reflects the amount of space available for diffusion (i.e., total size of a water cavity with consideration of side-chain flexibility). The mean number of water molecules contained in a definite volume is obtained by summing up the local density over all contributing voxels. The density distributions I–V do not exchange water with the bulk phase and contain a total of 11 internal water molecules. Density VI is caused by intruding bulk water.
As a preliminary result it can be stated that the simulated dynamics results in clearly anisotropic water-density distributions. The space where the density is at least half the bulk water density is always much larger than the van der Waals volume of the contributing water molecules. The waters found by low-temperature x-ray studies lie within the computed water densities, and the areas of high density either coincide with x-ray water positions or are situated in close proximity. The smeared-out distributions are a consequence of both the movements of water and side chains.
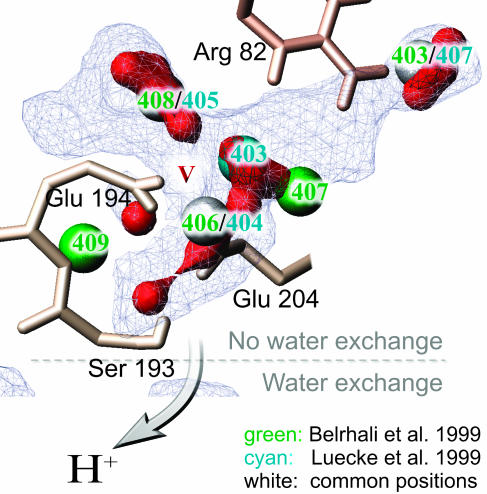
Most remarkable are densities IV and V as they contain the waters with the highest dynamics. Density IV consists of the triple water cluster discussed above and density V is due to water 408B/405L, 403B/407L, 407B, 406B/404L, and 409B. This is the largest water compound identified. It is displayed in a more detailed view in Fig. 6. All x-ray waters are situated in high-density areas. The density maximum between Glu-204 and Glu-194 roughly marks the position the H5O2+-complex by Glu-194, Glu-205, and Arg-82 representing the proton release group (Rammelsberg et al., 1998; Spassov et al., 2001).
FIGURE 6.
Close-up view of density V in the proton release channel. Roughly described by the x-ray waters 408B/405L, 406B/404L, 407B, 409B, and 403B/407L it turns out to be not only considerably larger but also the largest of all water densities determined. As in the previous figure red surfaces indicate maximum densities exceeding 0.1 H2O/Å3 and thus maximum residence probability.
Side chains surrounding the water densities
The diffusion movement of the internal waters is governed by the surrounding amino acids and their individual fluctuations. Therefore we will now focus on the protein context the water densities are embedded in and investigate the question as to how the flanking groups participate in the formation of hydrogen bonds with internal water.
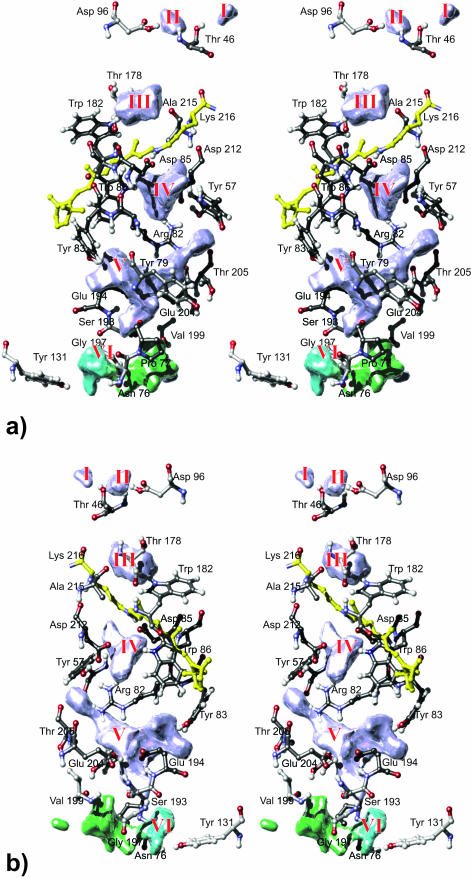
Fig. 7 gives a close-up stereo view of the mean water densities and H-bonding residues. Densities formed by permanently internal H2O appear blue; those based upon temporarily associated water molecules are colored green. Cyan indicates a contribution from two species of water, temporarily associated and other water molecules that due to their restricted fluctuations must be considered as bound waters. The residues shown are colored according to their frequency of hydrogen-bond contact; black represents high frequency (i.e., 100% of simulation time), white low frequency (i.e., 0% of simulation time). The determination of the H-bond contact frequencies will be discussed below.
FIGURE 7.
Front (a) and back (b) stereo views of the mean water densities embedded in the context of H-bonding residues. The higher a residue's frequency of H-bond contact, the darker the color of its carbon atoms. Densities are colored according to the types of internal waters they are due to: blue indicates permanently internal water molecules, green temporarily associated waters. The cyan section of density VI indicates that here temporarily associated and bound water molecules are involved.
On the cytoplasmic side three densities were detected. Density III is found between Ala-215, Thr-178, and Trp-182 where water 404B/501L is localized. According to the x-ray structural models, this water forms an interhelical hydrogen bond. The density distribution supports this proposal. However, there might be one more water molecule involved, since an additional water could successfully be modeled and shown to be stable in this position. Density II was detected near Asp-96 where hydrogen-bond contact is established to both the aspartate carboxyl group and the backbone of Thr-46. At 300 K this position seems to be more favorable than the one close to the backbone of Lys-216 (i.e., water 502L). Density I resembles the position of water 414B/512L and is situated in a compatible H-bond distance to Thr-46 on the outer protein surface. Nevertheless this density is caused by an internal water (counterpart to water 502L) in monomer B, which migrated outside via density II. To a small degree water exchange seems to be possible even in the protein's ground state, but its functional relevance is unclear since the immediate environment here is dominated by lipid. Nevertheless this water shifts from one known x-ray position to another.
Density IV is surrounded by Lys-216, Asp-85, backbone Tyr-83, Trp-86, Asp-212, Tyr-57, and Arg-82. Tyr-57 and Arg-82 also form the lower boundary of density IV and also the upper boundary of density V. Further flanking residues of density V are Tyr-83, Tyr-79, Thr-205, Glu-204, Glu-194, Ser-193, and Pro-77. Density VI is the only density with direct access to bulk water. Situated at the bottom of a cleft in the extracellular surface it is surrounded by Tyr-131, Gly-72, Gly-73, Glu-74, Ile-4, Gln-3, Pro-200, Ile-198, and Gly-197 (see Fig. 10). Density VI is mainly due to temporarily associated water except for its cyan-colored section near Asn-76, Tyr-131, and Gly-197 where also bound water molecules are involved. The number of bound waters is one in monomer A, two in B, and none in C.
FIGURE 10.
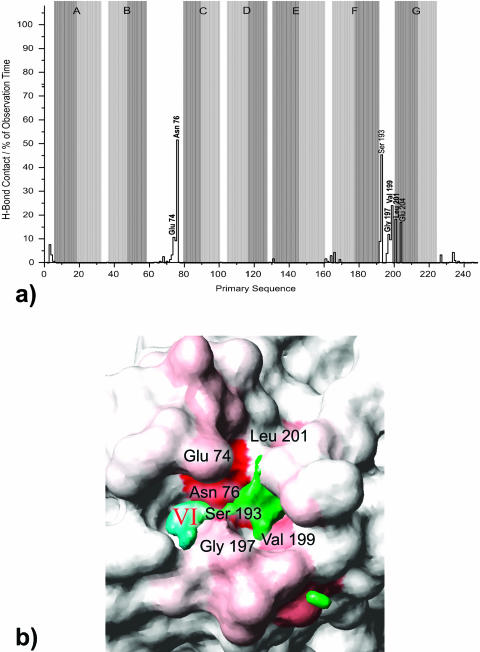
(a) Frequencies of H-bond contact per residue in percent of observation time. Results are given for temporarily associated water. New-found residues are printed in bold and helical regions in the x-ray model are underlined with gray rectangles. (b) It appears that for intruding waters there is one diffusion pathway connecting the extracellular bulk phase with the proton release site. Illustrated in a view on the extracellular bR surface residual contact frequency is represented by different shades of red: white, 0%; red, 50%.
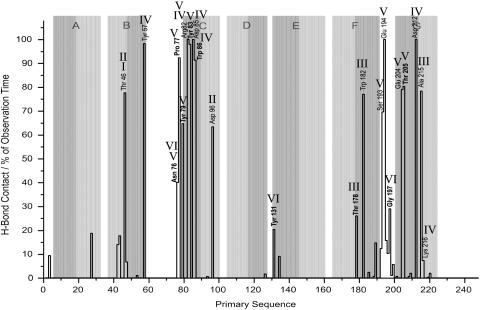
Fig. 8 shows the residues forming hydrogen bonds to internal water. Highest contact frequency is observed for Arg-82, Asp-85, Glu-194, and Asp-212 with 100% each, Tyr-57 and Tyr-83 with 98%, Pro-77 (92%), Trp-86 (91%), Thr-205 and Glu-204 with 80% and 79%, respectively, Thr-46 and Ala-215 (78%), Trp-182 (77%), and Ser-193 with 70%.
FIGURE 8.
Frequencies of H-bond contact per residue in percent of observation time. Results are given for permanently internal water. New-found residues are printed in bold. Roman numerals mark the corresponding water densities and helical regions in the x-ray model are underlined with gray rectangles: light gray for the cytoplasmic and dark gray for the extracellular half of a helix.
Conformational change of Arg-82
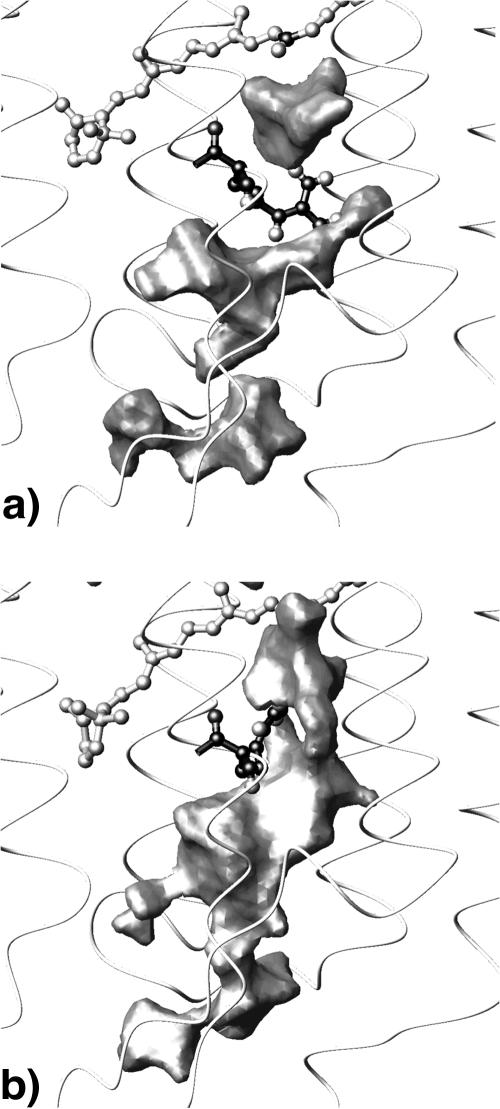
Intersected by Arg-82, densities IV and V could not provide a proton pathway in a Grotthus-like mechanism from the Schiff base to the proton release site at Glu-204/Glu-194 in the ground state. This contradicts the H-bonded network shown in Lanyi (1999) ranging from the Schiff base to Glu-204. Remarkably the arrangement of these two water densities appears to be highly sensitive to the conformation of arginine 82. Arg-82 is proposed to be functionally important: pK-calculations show that the protonation state of Asp-85 determines the orientation of the Arg-82 side chain (Bashford and Gerwert, 1992; Scharnagl and Fischer, 1996; Spassov et al., 2001). X-ray structural models of the M-intermediate (e.g., Luecke et al., 1999; Sass et al., 2000) indicate actually an arginine movement concomitant with protonation of Asp-85. IR-investigations also find different orientations during the photocycle (Hutson et al., 2000). As a test we removed the Schiff base charge, which induces an almost immediate upward movement of the arginine (in <1 ns). This strongly affects the diffusion properties of the internal water molecules: the formerly intersected water densities in the proton release channel merge into one (see Fig. 9). The movement of Arg-82 thus establishes a direct and continuous Grotthus-like proton pathway from the Schiff base region to the extracellular bulk phase.
FIGURE 9.
The arrangement of the internal water molecules depends on the side-chain conformation of Arg-82. In the ground-state orientation toward the extracellular exit Arg-82 separates density IV from density V and there is no connection to density VI (a). When an upward flip of Arg-82 is induced by removing the Schiff base charge it now faces Asp-212 and the formerly separated mean water densities merge into one, thus forming a continuous connection from the Schiff base to the bulk phase (b).
Continuum bands
Long-time simulations deliver a good statistical description of a system's behavior. This is particularly true in the case of oligomeric proteins like bacteriorhodopsin. Good preconditions are provided to develop new prediction methods on the grounds of these data.
We introduce a new parameter called “contact index” which is based on the results of the hydrogen-bond analysis. The CI is a numerical expression of one residue's particular type of hydrogen bonds to internal water. If these are prevailingly formed to the side chain the CI becomes maximal. In combination with the H-bond contact frequency predictions can be made if site-directed mutagenesis of that specific residue would have a measurable effect on the proton release. Several mutations affect the proton release although the mutated residues are not directly involved in proton conduction.
Protonated networks of internal water molecules cause so-called continuum bands as shown for numerous model compounds (Zundel, 1992). Rammelsberg et al. (1998) identified a continuum absorbance change during the L to M transition in the bR photocycle and correlated this absorbance change to the proton release group H5O2+ surrounded by Arg-82, Glu-204, and Glu-194.
Table 3 lists 12 residues for each of which the contact index was calculated. Any of these groups exceeds an H-bond frequency of 20% with permanently internal and 10% with temporarily associated water, respectively. Experimental data is available for four residues. Mutation of Arg-82, Glu-194, and Glu-204 is known to influence the continuum band. In silico contact frequencies of 100% and 79% were observed for these groups and contact indices of 1.5 and 3.0 were calculated. On the other hand the replacement of Thr-205 was shown to leave the continuum band unchanged (Garczarek and Gerwert, unpublished). At a contact frequency of 80% we determined a CI of only 0.5. One residue's mutational influence on the continuum band seems to be correlated with the occurrence of a high contact index of at least 1.5 and a high contact frequency of at least 50% at the same time. Based on this heuristic rule predictions are made for the eight remaining residues listed in the table. As stated above there is experimental data for four of these groups, but none for the remaining eight residues.
TABLE 3.
Residues that H-bond with the main densities' internal waters and predictions on how residue replacements influence continuum bands
| Residue | Contact frequency (%) | Contact inmonomers via* | Contact index (CI) | Measurable effect when replaced |
|---|---|---|---|---|
| Residues surrounding density IV (2nd continuum band) | ||||
| Tyr-57 | 98 | S | SB | S | 2.5 | Yes |
| Asp-85 | 100 | S | S | S | 3.0 | Yes |
| Asp-212 | 100 | S | S | S | 3.0 | Yes |
| Trp-86 | 91 | S | S | S | 3.0 | Yes |
| Arg-82 | 100 | S | S | S | 3.0 | Yes |
| Residues surrounding density V (1st continuum band) | ||||
| Pro-77 | 92 | B | B | B | 0 | No |
| Tyr-79 | 65 | B | SB | B | 0.5 | No |
| Thr-205 | 80 | B | SB | B | 0.5 | No†‡ |
| Ser-193 | 70 | SB | SB | SB | 1.5 | Yes |
| Glu-194 | 100 | SB | SB | SB | 1.5 | Yes† |
| Glu-204 | 79 | S | S | S | 3.0 | Yes† |
| Tyr-83 | 98 | S | S | S | 3.0 | Yes |
| Arg-82 | 100 | S | S | S | 3.0 | Yes† |
S, side chain only; SB, side chain and backbone; B, backbone only.
These residues have already been investigated experimentally and the prediction by MD was confirmed.
Unpublished data.
The side chains enlisted are adjacent to water densities IV and V. Density V coincides with the region where Rammelsberg et al. (1998) proposed the origin of the continuum band. It seems that large localized clusters of highly mobile water molecules detected in the simulation can be correlated with the occurrence of water continuum bands in the IR. As density IV exhibits similar characteristics we predict a second continuum band here. Generated by the triple water cluster of 401LB, 402LB, and 406LB it could be measurably influenced by site directed mutagenesis of Tyr-57, Asp-85, Asp-212, Trp-86, and Arg-82.
Water exchange on the extracellular surface
Fig. 5 gives an overview of the bR monomer with water densities and crystallographically determined water sites. Exchange of water molecules takes place only on the extracellular side between the bulk and density VI containing temporarily associated waters. Density V, consisting of permanently internal waters, begins widely shaped at Arg-82 and narrows down to a bottleneck near Ser-193. This region can be considered as a diffusion barrier or at least a diffusion threshold. None of the temporarily associated waters has been observed to intrude further into the protein from below than to Ser-193, and Glu-204 (see H-bond analysis below); these residues are the only ones making H-bond contacts to waters of densities V and VI for a significantly long time. If, however, water exchange took place between densities V and VI even to a small degree, one would expect a connection between the densities becoming visible at a smaller cutoff level. This is not the case: though densities V and VI approach each other they always remain separated. On a nanosecond timescale no exchange of water molecules is possible, although hydrogen bonds between the permanently internal and temporarily associated waters can be formed. The release channel appears to be sealed in the bR ground state.
The contact frequencies of residues with temporarily associated water are shown in Fig. 10 a. The highest rate of H-bond contact is determined for Asn-76 (52%), Ser-193 (45%), Val-199 (19%), Leu-201 (18%), and Glu-204 (17%). From these, Asn-76, Glu-204, and Ser-193 are the only residues significantly forming hydrogen bonds to both permanently internal and temporarily associated water molecules. Note that Asn-76 establishes H-bonds to the bound waters of density VI whereas Glu-204 and Ser-193 hydrogen-bond to density V.
The relatively high contact frequency of a limited number of the residues shown in Fig. 10 b prove that they are prevailing interstations for waters diffusing between bulk and protein interior. There seems to be only one pathway for the water. The residues are likely to be involved in the proton conduction from the proton release site to the extracellular bulk phase. The finding agrees with the proposal of Rammelsberg et al. (1998) that the H5O2+ complex stabilized by Glu-194 and Glu-204 does not represent the proton release site on the protein surface but other groups being involved.
Water exchange on the cytoplasmic surface
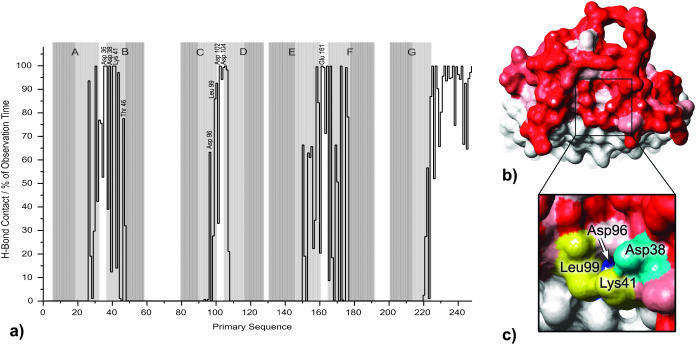
On the cytoplasmic surface Riesle et al. (1996) determined Asp-38 to be an essential part of the proton translocation pathway. Furthermore Asp-36, Asp-102, Asp-104, and Glu-161 were proposed to function as proton collectors. On this background we computed the frequencies of hydrogen bond contact to water for the cytoplasmic part of bR. All residues exposed to bulk phase (i.e., 25–48, 92–112, 148–178, and 220–248) and all water molecules were considered for the analysis. Results are summarized in Fig. 11. Note that for this side no definition of essential waters is available to further restrict the number of residues involved.
FIGURE 11.
(a) Frequencies of H-bond contact per residue in percent of observation time. Results are given for the cytoplasmic bR section and water. Helical regions in the x-ray model are underlined with gray rectangles. (b) High contact frequency turns out to be a common feature as seen in a view on the cytoplasmic Connolly surface of the ensemble average structure (probe radius 1.4 Å). H-bond frequencies are represented by different shades of red: white, 0%; red, 100%. (c) At a smaller probe radius (1.0 Å) a funnel opens next to Asp-38, Leu-99, and Lys-41, by which Asp-96 becomes accessible for a hypothetical particle smaller than a water molecule.
Almost any residue exposed to water is strongly involved in the formation of hydrogen bonds as indicated quantitatively in Fig. 11 a and in a view on the cytoplasmic Connolly surface in Fig. 11 b. Although Asp-38 and the other residues mentioned above participate in H-bonding for 100% of the simulation time they do not attract special attention as high contact frequency turns out to be a common feature in the water-exposed parts of bR. The lack of water exchange on the cytoplasmic half prevents identifying an entry funnel as done in Fig. 10 for the extracellular side, and the specialty of Asp-38 is not easily explained.
In Fig. 11 c the same view on the cytoplasmic Connolly surface is shown as before, but this time with a smaller probe radius of only 1.0 Å (instead of 1.4 Å). Remarkably now a funnel opens next to Asp-38 (and only here) by which Asp-96 becomes accessible for a hypothetical particle smaller than a water molecule. This might be an indication for a pathway by which Asp-96 could be reprotonated by intruding water, when later in the photocycle conformational changes may open this channel.
Leu-99 and Lys-41 also flank the putative funnel with likewise high H-bond frequencies of 86% and 100%, respectively. The hydrogen bonds formed by Leu-99 are backbone-based, so a detectable influence of mutation seems improbable. But Lys-41 H-bonds are mediated via side chain, so it is a promising candidate for further mutagenesis studies. The identified channel matches with the “shaft” reported very recently in Schaetzler et al. (2003) after our manuscript was submitted.
CONCLUSION
The complete bacteriorhodopsin trimer was simulated over 5 ns in an explicit membrane/water environment. Equilibrium was reached after 2 ns which exceeds the length of all simulations of bR performed so far. Single monomers display structural heterogeneity. They shift away from the x-ray structure into different directions in conformational space, but their average remains close to the x-ray structure. The monomers undergo different conformational changes in the course of the simulation just in protein regions where in the x-ray models either no clear electron scattering signal was detected or high B-factors were assigned.
The internal water was studied and analyzed by mean water densities. Four separate water clusters of high density were fond inside the protein. The x-ray positions of the internal waters generally coincide with the computed density distributions. The waters exhibit a high degree of mobility, especially in the extracellular half of the protein where, intersected by Arg-82, the two largest density distributions were detected.
The influence of residues involved in the formation of hydrogen bonds with internal water was quantified and predictions were made about which mutation affects the proton release and thereby the continuum absorbance. This now explains why several mutations affect the proton release even though the residues are not directly involved in proton conduction via protonation changes. Up to now for four bR mutants the effect on the H2O continuum band was determined experimentally. The results were used to validate the predictions.
On the extracellular side water exchange and the existence of bound water were observed. The intruding water molecules follow one discrete path into and out of the protein at Glu-74, Asn-76, Gly-197, Val-199, and Leu-201. Glu-204 and Ser-193 form a diffusion threshold.
For the cytoplasmic surface H-bond frequencies to bulk water were computed. High contact frequency turned out to be a common feature here and no access to the interior of the protein was found, unless a decreased probe radius was used for Connolly surface calculation. Then a funnel opens next to Asp-38, Leu-99, and Lys-41, by which Asp-96 becomes accessible for a particle smaller than a water molecule.
Most of the results could only be obtained on the grounds of a long-time simulation. The use of a classical simulation may affect the validity of simulation details, which require a QM treatment. However, the good agreement with different experimental findings proves the classical simulation to be a valuable tool here.
Acknowledgments
We thank Prof. Peter Tieleman, Prof. Paul Tavan, and Gerald Mathias for their support.
This work was financially supported by the Deutsche Forschungsgemeinschaft (SFB 480-C3).
References
- Bashford, D., and K. Gerwert. 1992. Electrostatic calculations of the pKa values of ionizable groups in bacteriorhodopsin. J. Mol. Biol. 224:473–486. [DOI] [PubMed] [Google Scholar]
- Baudry, J., E. Tajkhorshid, F. Molnar, J. Phillips, and K. Schulten. 2001. Molecular dynamics study of bacteriorhodopsin and the purple membrane. J. Phys. Chem. B. 105:905–918. [Google Scholar]
- Belrhali, H., P. Nollert, A. Royant, C. Menzel, J. P. Rosenbusch, E. M. Landau, and E. Pebay-Peyroula. 1999. Protein, lipid and water organization in bacteriorhodopsin crystals: a molecular view of the purple membrane at 1.9 angstrom resolution. Structure. 7:909–917. [DOI] [PubMed] [Google Scholar]
- Berendsen, H. J. C., D. Vanderspoel, and R. Vandrunen. 1995. Gromacs: a message-passing parallel molecular dynamics implementation. Comp. Phys. Commun. 91:43–56. [Google Scholar]
- de Groot, B. L., and H. Grubmuller. 2001. Water permeation across biological membranes: mechanism and dynamics of aquaporin-1 and GlpF. Science. 294:2353–2357. [DOI] [PubMed] [Google Scholar]
- Edholm, O., and F. Jähnig. 1992. Molecular dynamics simulation of bacteriorhodopsin. In Membrane Proteins: Structures, Interactions and Models. A. Pullman, J. Jortner, and B. Pullman, editors. Kluwer Academic, Dordrecht, The Netherlands. 47–60.
- Edholm, O., O. Berger, and F. Jahnig. 1995. Structure and fluctuations of bacteriorhodopsin in the purple membrane—a molecular dynamics study. J. Mol. Biol. 250:94–111. [DOI] [PubMed] [Google Scholar]
- Gerwert, K., B. Hess, J. Soppa, and D. Oesterhelt. 1989. Role of aspartate-96 in proton translocation by bacteriorhodopsin. Proc. Natl. Acad. Sci. USA. 86:4943–4947. [DOI] [PMC free article] [PubMed] [Google Scholar]
- Gerwert, K., G. Souvignier, and B. Hess. 1990. Simultaneous monitoring of light-induced changes in protein side-group protonation, chromophore isomerization, and backbone motion of bacteriorhodopsin by time-resolved Fourier-transform infrared spectroscopy. Proc. Natl. Acad. Sci. USA. 87:9774–9778. [DOI] [PMC free article] [PubMed] [Google Scholar]
- Hayashi, S., and I. Ohmine. 2000. Proton transfer in bacteriorhodopsin: structure, excitation, IR spectra, and potential energy surface analyses by an ab initio QM/MM method. J. Phys. Chem. B. 104:10678–10691. [Google Scholar]
- Hayashi, S., E. Tajkhorshid, and K. Schulten. 2002. Structural changes during the formation of early intermediates in the bacteriorhodopsin photocycle. Biophys. J. 83:1281–1297. [DOI] [PMC free article] [PubMed] [Google Scholar]
- Henchman, R., and J. A. McCammon. 2002. Extracting hydration sites around proteins from explicit water simulations. J. Comput. Chem. 23:861–869. [DOI] [PubMed] [Google Scholar]
- Humphrey, W., D. Xu, M. Sheves, and K. Schulten. 1995. Molecular dynamics study of the early intermediates in the bacteriorhodopsin photocycle. J. Phys. Chem. 99:14549–14560. [Google Scholar]
- Hutson, M. S., U. Alexiev, S. V. Shilov, K. J. Wise, and M. S. Brainman. 2000. Evidence for a perturbation of arginine-82 in the bacteriorhodopsin photocycle from time-resolved infrared spectra. Biochemistry. 39:13189–13200. [DOI] [PubMed] [Google Scholar]
- Makarov, V. A., B. K. Andrews, P. E. Smith, and B. M. Pettitt. 2000. Residence times of water molecules in the hydration sites of myoglobin. Biophys. J. 79:2966–2974. [DOI] [PMC free article] [PubMed] [Google Scholar]
- Landau, E. M., and J. P. Rosenbusch. 1996. Lipidic cubic phases: a novel concept for the crystallization of membrane proteins. Proc. Natl. Acad. Sci. USA. 93:14532–14535. [DOI] [PMC free article] [PubMed] [Google Scholar]
- Lanyi, J. K. 1999. Progress toward an explicit mechanistic model for the light-driven pump, bacteriorhodopsin. FEBS Lett. 464:103–107 (Review.) [DOI] [PubMed] [Google Scholar]
- Laskowski, R. A. 1995. Surfnet: a program for visualizing molecular surfaces, cavities, and intermolecular interactions. J. Mol. Graph. 13:323–330. [DOI] [PubMed] [Google Scholar]
- LeCoutre, J., J. Tittor, D. Oesterhelt, and K. Gerwert. 1995. Experimental evidence for hydrogen-bonded network proton transfer in bacteriorhodopsin shown by FTIR spectroscopy using azide as catalyst. Proc. Natl. Acad. Sci. USA. 92:4962–4966. [DOI] [PMC free article] [PubMed] [Google Scholar]
- Lindahl, E., B. Hess, and D. van der Spoel. 2001. GROMACS 3.0: a package for molecular simulation and trajectory analysis. J. Mol. Mod. 7:306–317. [Google Scholar]
- Lounnas, V., and B. M. Pettitt. 1994. A connected-cluster of hydration around myoglobin: correlation between molecular dynamics simulations and experiment. Proteins. 18:133–147. [DOI] [PubMed] [Google Scholar]
- Lozier, R. H., R. A. Bogomolni, and W. Stoeckenius. 1975. Bacteriorhodopsin: a light-driven proton pump in Halobacterium halobium. Biophys. J. 15:955–963. [DOI] [PMC free article] [PubMed] [Google Scholar]
- Luecke, H., B. Schobert, H. T. Richter, J. P. Cartailler, and J. K. Lanyi. 1999. Structure of bacteriorhodopsin at 1.55 angstrom resolution. J. Mol. Biol. 291:899–911. [DOI] [PubMed] [Google Scholar]
- Okamura, M. Y., M. L. Paddock, M. S. Graige, and G. Feher. 2000. Proton and electron transfer in bacterial reaction centers. Biochim. Biophys. Acta. 1458:148–163 (Review). [DOI] [PubMed] [Google Scholar]
- Ostermeier, C., A. Harrenga, U. Ermler, and H. Michel. 1997. Structure at 2.7 angstrom resolution of the Paracoccus denitrificans two-subunit cytochrome c oxidase complexed with an antibody FV fragment. Proc. Natl. Acad. Sci. USA. 94:10547–10553. [DOI] [PMC free article] [PubMed] [Google Scholar]
- Rammelsberg, R., G. Huhn, M. Lubben, and K. Gerwert. 1998. Bacteriorhodopsin's intramolecular proton-release pathway consists of a hydrogen-bonded network. Biochemistry. 37:5001–5009. [DOI] [PubMed] [Google Scholar]
- Richter, H.-T., L. S. Brown, R. Needleman, and J. K. Lanyi. 1996. A linkage of the pKa's of Asp-85 and Glu-204 forms part of the reprotonation switch of bacteriorhodopsin. Biochemistry. 35:4054–4062. [DOI] [PubMed] [Google Scholar]
- Riesle, J., D. Oesterhelt, N. A. Dencher, and J. Heberle. 1996. D38 is an essential part of the proton translocation pathway in bacteriorhodopsin. Biochemistry. 35:6635–6643. [DOI] [PubMed] [Google Scholar]
- Sass, H. J., G. Buldt, R. Gessenich, D. Hehn, D. Neff, R. Schlesinger, J. Berendzen, and P. Ormos. 2000. Structural alterations for proton translocation in the M state of wild-type bacteriorhodopsin. Nature. 406:649–653. [DOI] [PubMed] [Google Scholar]
- Schaetzler, B., N. A. Dencher, J. Tittor, D. Oesterhelt, S. Yaniv-Checover, E. Nachliel, and M. Gutman. 2003. Subsecond proton-hole propagation in bacteriorhodopsin. Biophys. J. 84:671–686. [DOI] [PMC free article] [PubMed] [Google Scholar]
- Scharnagl, C., and S. F. Fischer. 1996. Conformational flexibility of arginine-82 as source for the heterogeneous and pH-dependent kinetics of the primary progon transfer step in the bacteriorhodopsin photocycle: an electrostatic model. Chem. Phys. 212:231–246. [Google Scholar]
- Spassov, V. Z., H. Luecke, K. Gerwert, and D. Bashford. 2001. pK(a) calculations suggest storage of an excess proton in a hydrogen-bonded water network in bacteriorhodopsin. J. Mol. Biol. 312:203–219. [DOI] [PubMed] [Google Scholar]
- Tieleman, D. P., M. S. P. Sansom, and H. J. C. Berendsen. 1999. Alamethicin helices in a bilayer and in solution: molecular dynamics simulations. Biophys. J. 76:40–49. [DOI] [PMC free article] [PubMed] [Google Scholar]
- Woolf, T. B. 1997. Molecular dynamics of individual α-helices of bacteriorhodopsin in dimyristol phosphatidylcholine. I. Structure and dynamics. Biophys. J. 73:2376–2392. [DOI] [PMC free article] [PubMed] [Google Scholar]
- Xu, D., M. Sheves, and K. Schulten. 1995. Molecular dynamics study of the M412 intermediate bacteriorhodopsin. Biophys. J. 69:2745–2760. [DOI] [PMC free article] [PubMed] [Google Scholar]
- Zundel, G. 1992. Proton polarizability and proton transfer processes in hydrogen bonds and cation polarizabilities of other cation bonds: their importance to understand molecular processes in electrochemistry and biology. Trends Phys. Chem. 3:129–156. [Google Scholar]


