Abstract
We have studied the low-resolution solution conformation of a Holliday (or four-way) DNA junction by using small-angle x-ray scattering, sedimentation velocity, and computational modeling techniques. The scattering data were analyzed in two independent ways: firstly, by rigid-body modeling of the scattering data using previously suggested models for the Holliday junction (HJ), and secondly, by ab initio reconstruction methods. The models found by both methods agree with experimentally determined sedimentation coefficients and are compatible with the results of previous studies using different techniques, but provide a more direct and accurate determination of the solution conformation of the HJ. Our results show that addition of Mg2+ alters the conformation of the HJ from an extended to a stacked arrangement.
INTRODUCTION
DNA recombination was originally thought of as a means for creating genetic diversity. However, more recently, its fundamental importance in the repair of double-strand breaks and for replication through DNA lesions has been established (Haber, 2000; Cox et al., 2000). Holliday (1964) first proposed that a four-way junction (the so-called Holliday junction, HJ) is generated as an intermediate in recombination when DNA strands cross over between homologous duplexes. HJs are substrates for proteins that induce structure-specific cleavage (White et al., 1997) or branch migration (Rafferty et al., 1996) and are also intermediates in site-specific recombination by the integrase family of recombinases (Kitts and Nash, 1987; McCulloch et al., 1994). Proteins involved in homologous and site-specific recombination bind specifically to their substrate HJs (Schwacha and Kleckner, 1995; Kitts and Nash, 1987; McCulloch et al., 1994) in a manner dependent not only on the HJ sequence but also on its tertiary structure. This makes the study of the three-dimensional structure of HJs essential to pave the way toward a deeper insight into these fundamental biological processes.
The first four-way junctions studied were cruciform structures formed by inverted repeats in supercoiled DNA (Gellert et al., 1979; Lilley, 1980; Panayotatos and Wells, 1981). These are, however, impractical for most structural studies since the cruciforms are only stable when within topologically constrained circular DNA. Cloned or synthesized short DNA segments were later used to build more stable four-way junctions by hybridizing sequences that are incapable of extensive branch migration (Bell and Byers, 1979; Bianchi et al., 1989; Kallenbach et al., 1983). Chemical probing (Furlong and Lilley, 1986; Gough et al., 1986) and nuclear magnetic resonance (Wemmer et al., 1985) showed that these four-way junctions were stable, and that full basepairing was preserved.
Early attempts to model the structure of the HJ involved pairwise coaxial stacking of pairs of helical arms (Sigal and Alberts, 1972; Sobell, 1972; Calascibetta et al., 1984), and most placed the double-stranded helices side by side, with parallel alignment of the continuous strands. In the mid-eighties, it was noted (Gough and Lilley, 1985; Kosak and Kemper, 1990) that an HJ had an anomalously low mobility in polyacrylamide gel shift assays, suggesting the existence of a sharp kink or bend at the junction. The mobility was also shown to depend on the added counterion concentration, leading to the conclusion that, in the presence of counterions (e.g., Mg2+), the HJ has an X shape; the helical arms are stacked in coaxial pairs which are rotated with respect to each other. This arrangement maximizes basepair stacking interactions, and reduces steric and electrostatic interactions between the stacked arms. In the model, the continuous strands show an almost antiparallel arrangement (Duckett et al., 1988; Lilley and Clegg, 1993). In contrast, in the absence of metal ions, data from gel electrophoresis and other techniques (Duckett et al., 1988) clearly suggest an extended square planar configuration of the arms. Chamberlain et al. (1998) used small-angle neutron scattering (SANS) to study the structure of a synthetic HJ sandwiched between two tetrameric Mycobacterium leprae RuvA complexes. The authors reported no change in the radius of gyration of the HJ with Mg2+ concentration.
In this article, we determine the low-resolution structure of a HJ in solution in the presence and absence of Mg2+, by using small-angle x-ray scattering (SAXS) and sedimentation velocity (SV). Two independent methods were implemented to analyze the scattering data, and hydrodynamic modeling was used to validate the models on the basis of their sedimentation coefficients. This study supports an extended square planar conformation in the absence of Mg2+, but a stacked structure in the presence of Mg2+.
MATERIALS AND METHODS
Sample preparation
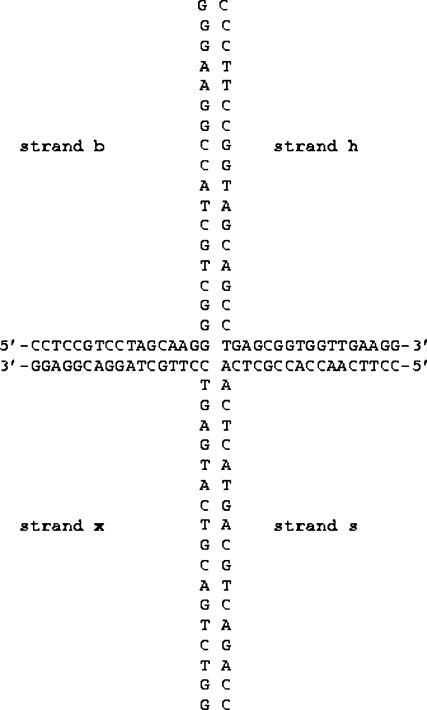
Oligonucleotides (purchased from MWG-Biotechnology, Ebersberg, Germany, HPLC-purified) were resuspended in TE buffer (10-mM Tris-HCl, pH 8.4; 0.1 mM EDTA) and concentrated using a 10-kDa cut-off microconcentrator (Millipore, Watford, UK) to remove smaller species. Their final concentrations were estimated by absorbance measurements, from which the appropriate molar mixing ratios were calculated. The four-way DNA junction was constructed by mixing four 34-bp oligonucleotides in TE buffer and incubating the mixture at 90°C for 5 min, followed by slow cooling at room temperature. The sequences of the oligonucleotides (the same as those used by Fogg et al., 2001, in their FRET studies) are shown in Fig. 1.
FIGURE 1.
Sequence of the synthetic HJ oligonucleotides used in this study.
The four-way junction was purified by size exclusion chromatography using a Sepharose-12 column (Amersham Biosciences, Bucks, UK), then further purified and concentrated using a 30-kDa cut-off microconcentrator (Millipore). Monodispersity of the sample was monitored by polyacrylamide gel electrophoresis and analytical ultracentrifugation (see Results and Analysis, Sedimentation Velocity).
Sedimentation velocity and hydrodynamic modeling
Sedimentation velocity experiments were performed using a Beckman Coulter (Palo Alto, CA) Optima XL-I analytical ultracentrifuge and an AN-60 Ti rotor. The experiments were carried out at 10°C in TE buffer at a rotor speed of 60,000 rpm. Both absorbance and interference optics were used in separate experiments. For the experiments performed with absorbance optics a series of 40 scans, 6 min apart, was obtained for each sample, in continuous mode with a 0.003-cm radial step size and three averages. For the experiments carried out with interference optics, a series of 600 scans, 1 min apart, were obtained with the same radial step size as before. All experiments were carried out with an HJ concentration of 800 nM (unless stated otherwise). The samples (380 μl) were loaded into double-sector centerpieces. Sedimentation profiles were analyzed with the computer program SEDFIT (Schuck, 2000; also http://www.analyticalultracentrifugation.com), which allows the user to subtract radial and time-independent noise, and to directly model boundary profiles as a continuous distribution of discrete non-interacting species (c(s) analysis). The sedimentation coefficients were also evaluated by using the finite element method to find the sedimentation coefficient that best fitted the Lamm equations (also using SEDFIT).
The program HYDROPRO (García de la Torre et al., 2000) was employed to calculate the hydrodynamic parameters of high-resolution models constructed with the program NAMOT (Tung and Carter, 1994). HYDROPRO computes the hydrodynamic properties of rigid particles from their atomic structure (specified in a Protein Data Bank format file). Similarly, HYDRO (García de la Torre et al., 1994) calculates the hydrodynamic parameters and other solution properties of rigid macromolecules from their bead models given the coordinates and radii of the beads comprising the model. HYDRO does not hydrate the model, and thus a properly hydrated model has to be built before using this program.
Small-angle x-ray scattering
Small-angle x-ray scattering (SAXS) experiments were performed on the X33 camera of the EMBL Hamburg outstation at the storage ring DORIS III of the Deutsches Elektronen Synchrotron, employing commonly used procedures (Koch and Bordas, 1983; Boulin et al., 1988). The scattering curves were measured at two sample concentrations, 25 and 100 μM, using a sample-to-detector distance of 2.2 m, at which the momentum transfer range was 0.02 < s < 0.35 nm−1 ( where 2θ is the scattering angle and λ is the x-ray wavelength, 0.15 nm). The data were then normalized to the intensity of the incident beam, and corrected for the detector response. The scattering of the buffer was subtracted, and the difference curves were then scaled for concentration using PRIMUS (Konarev et al., 2003). The final scattering curve was obtained by merging the low angle region of the low concentration curve with the high angle region of the high concentration data (using PRIMUS), to eliminate interparticle interaction effects in the low angle region of the high concentration data. The particle maximum dimension (DMAX) and the particle distance distribution function (p(d)) were obtained by using the indirect Fourier transform program GNOM (Svergun, 1992). The radius of gyration (Rg) was determined by using both the Guinier approximation and GNOM.
Ab initio shape determination was initially proposed by Stuhrmann (1970) and more recently developed by Chacón et al. (1998, 2000), who developed the program DALAI_GA based on a genetic algorithm, and by Svergun (1999; Svergun et al., 2001), who employed simulated annealing methods in the computer programs DAMMIN and GASBOR. In this article, the methods of Svergun were employed. The program DAMMIN (Svergun, 1999) restores the structure as a collection of densely packed beads in a dummy atom model inside a search volume (a sphere of diameter DMAX); the beads have radii ri ≪ DMAX. The program is started from a random configuration using the simulated annealing method, allowing the user to impose symmetry conditions on the models (such as particle point symmetry) and other parameters (such as the dummy atom model packing radius). On the other hand, the program GASBOR (Svergun et al., 2001) represents the particle as a collection of dummy residues. Unlike DAMMIN, GASBOR starts with randomly positioned residues, and uses simulated annealing to find a chain-compatible spatial distribution of dummy residues inside the search volume. However, the number of residues must be known beforehand. The HJ investigated in this study contains 17 bases in each arm, or 68 Watson-Crick bases in the whole particle. Each nucleotide pair was represented as three components: one bead representing the basepair itself; and a separate bead for the sugar-phosphate groups of each of the bases. This adds up to a total of 204 beads for the GASBOR model.
RESULTS AND ANALYSIS
Sedimentation velocity
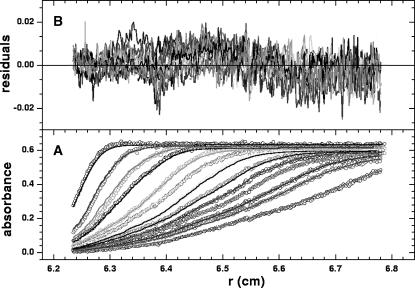
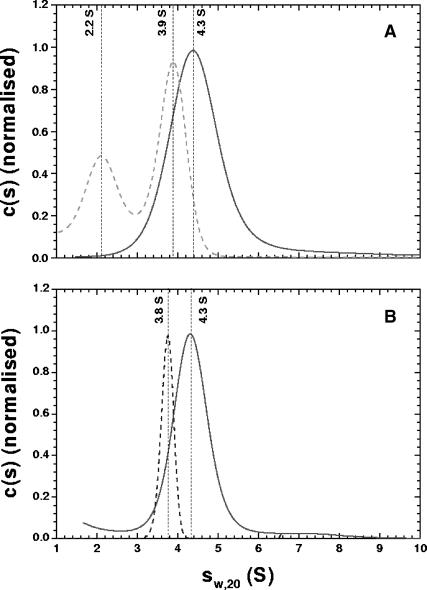
We employed SV to assess the monodispersity of the purified sample and to complement the low-resolution SAXS-based modeling with an independent technique. Solutions of HJs over a range of concentrations (800 nM to 8 μM) in a variety of buffers were examined with SV. Absorbance versus radius distributions at different times of the sedimentation at 60,000 rpm for the 0 mM Mg2+ HJ sample, fits to the experimental data produced by using c(s) analysis and residuals of the fits are shown in Fig. 2. When studied at low concentration (800 nM), the HJ displays a qualitatively different behavior depending on the presence or absence of Mg2+ (see Fig. 3 A). At 0 mM Mg2+, the c(s) analysis clearly shows two peaks, corresponding to two distinct species, with apparent sedimentation coefficients of 2.2 and 3.9 S. In contrast, the same sample behaves as a single species when 50 mM NaCl is added to the solution, or when the sample concentration is increased by 10-fold (Fig. 3 B). We conclude from these observations that in the absence of any metal ions from the buffer, and at low concentrations, the HJ structure is not stable and partially dissociates into secondary species comprising only two oligonucleotides (consistent with the lower sedimentation coefficient). The HJ structure is stabilized by the addition of either Mg2+ or Na+ to the buffer, as shown in Fig. 3, A and B. An increase in HJ concentration, without counterions, also produces a single peak in the size distribution analysis (Fig. 3 A, dashed curve), by shifting the equilibrium between the different species toward that with higher sedimentation coefficient (and thus probably higher mass, presumed to be the HJ). In the presence of 10 mM Mg2+ at 800 nM HJ concentration, a single species (presumed to be the stacked form of the HJ; see below) is observed. At this Mg2+ concentration, c(s) analysis yields identical results to the measurements at low or high sample concentrations, in the presence or absence of NaCl (data not shown).
FIGURE 2.
Absorbance profiles of the sedimentation of the HJ at 10 mM Mg2+. The absorbance distributions were scanned at 260 nm, at time intervals of 6 min, for a total time of 300 min. (A) Experimental (circles) and best-fit (solid lines) distributions constraining the sedimentation coefficient to sW, 20(1) = 3.9 S and sW, 20(2) = 2.2 S, with relative concentrations 0.7 and 0.3, respectively. (B) Residuals of the fit with a root mean-square deviation of 0.005.
FIGURE 3.
(A) Size distribution (c(s)) analysis obtained with SEDFIT (Schuck, 2000) for the HJ (800 nM) in the absence of Mg2+ (dashed curve) and in 10 mM Mg2+ (solid curve); (B) The c(s) analysis for the HJ (8 μM) in the absence of Mg2+ or Na+ ions (dashed curve) or HJ (800 nM) in 50 mM NaCl (solid curve).
The apparent sedimentation coefficients for the 0 mM and 10 mM Mg2+ samples are 3.9 S and 4.3 S (the centers of the peaks in Fig. 3 A). Fits using finite element analysis yield true sedimentation coefficients of 3.9 and 4.4 S, and masses of 41 and 40 kDa, respectively (the mass of the HJ calculated from its composition is 41.5 kDa, without taking counterions into account), for the same samples (fits not shown). These experiments confirm that the method employed for sample purification produces a highly homogeneous HJ sample at concentrations >8 μM (for SAXS experiments, the sample concentration was 100 μM). In addition, these results confirm that the HJ undergoes a conformational change to a less extended structure (i.e., with a larger sedimentation coefficient) upon addition of Mg2+.
These results also show the applicability of SV measurements to the study of DNA stability under different experimental conditions. The relative mass concentrations of the fully and partially assembled HJ can be quantified at different temperatures and buffer conditions, allowing for the investigation of the thermodynamic stability of these molecules in solution.
Small-angle x-ray scattering
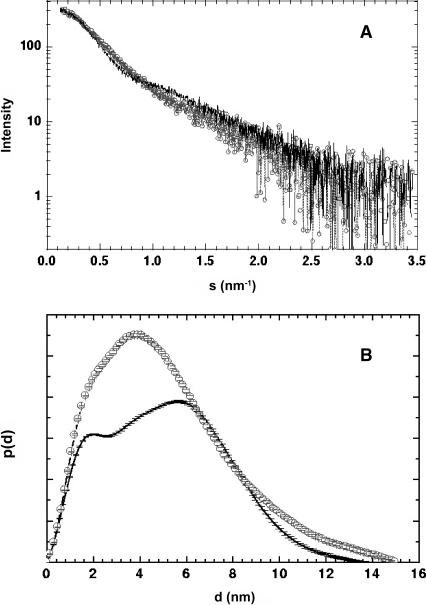
Scattering curves for the HJs were obtained in TE buffer supplemented with different concentrations of Mg2+ (0, 10, 40, and 100 mM). All the analyses in the presence of Mg2+ yielded identical results. Hence, we show here only the measurements at 0 and 10 mM MgCl2. Additionally, scattering curves were acquired at three different HJ concentrations for each buffer to account for effects of interparticle interactions. At each Mg2+ concentration, the scattering curves at the two lowest HJ concentrations (25 and 50 μM) were indistinguishable, indicating that at these concentrations the interparticle interactions are negligible. The processed curves are shown in Fig. 4 A.
FIGURE 4.
(A) X-ray scattering data from the HJs at 0 (solid line) and 10 (circles) mM Mg2+. (B) Particle distance distribution functions from the scattering of the HJs at 0 (solid line) and 10 (circles) mM Mg2+ calculated using the program GNOM (Svergun, 1992).
The radius of gyration (Rg) of the HJs was firstly estimated by using the Guinier approximation to be 39 ± 1 and 38 ± 1 Å for the 0 mM and the 10 mM MgCl2 samples, respectively. The values of I(0)/c (where I(0) is the scattering intensity at zero angle and c is the sample concentration) for these samples were indistinguishable within experimental error, as expected for two species with identical molecular mass. The particle distance distribution functions (p(d)) for these samples are shown in Fig. 4 B. The DMAX for the 0 mM MgCl2 sample is 142 ± 7 Å and that for the 10 mM MgCl2 sample is 148 ± 5 Å, indistinguishable within experimental error. The Rg obtained from the p(d) functions are 40 ± 1 and 41 ± 2 Å, in agreement with those from the Guinier analysis. In the following sections, analysis of these data both by direct modeling and by ab initio reconstruction methods will be presented.
Rigid-body modeling of scattering data
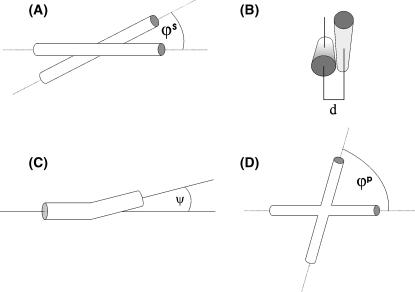
Distinct structures have previously been proposed for the conformation of the HJ in solution at low and high Mg2+ concentration (Duckett et al., 1988; Clegg et al., 1994). In the absence of metal ions, the HJ has an extended conformation presenting an open central region (the square planar model). Upon addition of Mg2+ (or other metal ions), the junction changes its structure into a pairwise stacking of helices (Lilley and Clegg, 1993; Seeman and Kallenbach, 1994; the stacked model). We employed these models as a starting point to find the structure that best fitted the experimental solution scattering data. The models were parameterized as shown in Fig. 5. We used the following variables to parameterize the stacked model: angle between arms, as seen from the axis that passes through the points of strand exchange and which is perpendicular to the C2 symmetry axis (ϕs); distance between the centers of the two stacked helices at the point of strand exchange (d); and the kink angle of the helices (ψs). Variation of these three variables within reasonable ranges allowed for the mapping of the stacked model parameter space. In this model, the angle between arms 1 and 2 (see Fig. 5 A) is the same as that between arms 3 and 4. In addition, when introducing a kink, both stacked arms are symmetrically deviated from the helical axis by the same amount. As a convention, when ψ is positive, the arms are kinked away from each other, whereas they get closer when ψ is negative.
FIGURE 5.
Parametrization of HJ models. (A) Angle between arms (ϕs) in the stacked model; (B) distance between centers (d) of strand exchange in the stacked model; (C) kink angle for one arm (ψs and ψp) in either the stacked or the square planar model; and (D) angle between arms (ϕp) in the square planar model.
Similarly, the square planar model was parameterized using the angle between arms as seen from the axis perpendicular to the plane containing the centers of the first four innermost basepairs of each arm (ϕp), and the kink angle between opposite arms (ψp) at the strand exchange point (see Fig. 5, C and D). In this instance, there were only two parameters inasmuch as the out-of-plane distance between the helices at the point of strand exchange in this model is always zero. As for the stacked model, the angle between arms 1 and 2 (see Fig. 5 D) is the same as that between arms 3 and 4. However, in this case, when ψ is positive the two arms 1 and 3 are kinked in the opposite direction to arms 2 and 4. The kink has the same direction in both arms when ψ is negative.
The scripting language of the computer program NAMOT (Tung and Carter, 1994) was used to produce high-resolution models for the HJ. The four individual basepairs at the point of strand exchange were firstly positioned. Their coordinates, twist, roll, and tilt angles were calculated from the parameters of the model to be produced. The four arms were subsequently built from these bases assuming B-form DNA. To speed up the generation of high-resolution models, a computer program was developed (namot2script, available upon request from M.N.). The user defines the model employed, the range of the parameters to be explored, and the number of structures in the chosen parameter range. The program then generates scripts in NAMOT scripting language that are used to produce structural files in Protein Data Bank format. The scattering curves for each of these structures and their fits to the experimental data were then calculated by using the computer program CRYSOL (Svergun et al., 1995). The maximum hydration shell scattering contrast was allowed to vary between 0 and 150 e nm−3, and the maximum excluded volume allowed was increased from 44 nm3 to 65 nm3 to allow for higher hydration of the DNA (compared with protein). Finally, the steric clashes (κ) within each structure were estimated by using the program pdb2overlap (available upon request from M.N.), also developed by us.
With this procedure, we mapped the parameter space defining each possible structure for a given model onto a scalar field representing the goodness of fit, or in other words, each set of given parameters was assigned a corresponding goodness of fit (χ(r0, δρ, ψ, ϕ, d)). In summary, the parameters were mapped onto a scalar field (Ξ) that takes into account how well the structural model generated from those parameters fits the experimental data, and penalizes steric clashes (κ(ψ, ϕ, d)) within each structure,
 |
(1) |
where θ(x) is a step-like function that has a value of 0 when the argument is x < 0 and 1 when x > 0, and τ is a steric-clashes threshold (defined so that the overlap volume is <5% of the total model volume). The introduction of this penalization term did not modify the ultimate results but served to discard the structures containing steric clashes as possible models.
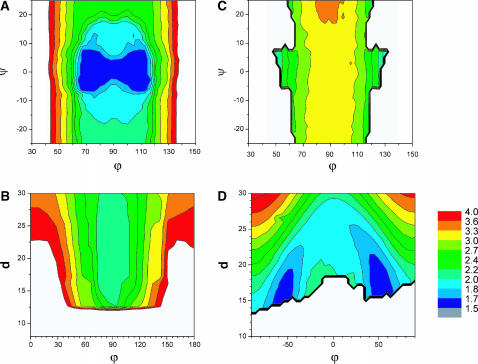
To find the minimum in Ξ with respect to the model parameters, a simple exploration of the parameter space was performed to identify the best fit by visual inspection. Fig. 6 A shows the Ξ field as a function of ϕp and ψp for the 0 mM Mg2+ sample data analyzed with the square planar model. A well-defined unique minimum at 
 defines the best fit to the experimental data (see Fig. 6 A). A criterion to decide how to estimate the uncertainties in the parameters had to be established. By visual inspection of the experimental scattering curves and the fits produced by parameters at the global minimum and nearby, we found that fits with
  (where
  and
and  define the position of the minimum in parameter space) are indistinguishable from the best fit. Accordingly, the contour levels are defined so that the difference between Ξ at the global minimum and Ξ at the second contour level is 0.2, and so the width of the lower contour level in every parameter direction defines its uncertainty. An identical approach was used to determine the uncertainty in the parameters for the stacked model. The values for the parameters in the square planar model that best fit the experimental data for the HJ at 0 mM Mg2+ are in full agreement with all the previous experimental data, which suggests a square planar conformation (ψp = 0) with an angle of 90° between adjacent helical arms (ϕp = 90).
FIGURE 6.
(A) Contour plots of Ξ as a function of the kink angle (ψp) and the angle between arms (ϕp) for the 0 mM Mg2+ HJ sample data fitted with the square planar model. The white areas in the plots specify structures with overlap; (B) contour plots of Ξ as a function of the distance (ds) and the angle between arms (ϕs) for the 0 mM Mg2+ HJ sample data fitted with the stacked model; (C) contour plots of Ξ as a function of the kink angle (ψp) and the angle between arms (ϕp) for the 10 mM Mg2+ HJ sample data analyzed with the square planar model; and (D) contour plots of Ξ as a function of the distance (ds) and the angle between arms (ϕs) for the 10 mM Mg2+ HJ sample data analyzed with the stacked model.
A similar approach was used to find the set of parameters in the stacked model that best fitted the experimental data for the 0 mM Mg2+ sample (see Fig. 6 B). There is also a minimum at  ds = 22 Å, but it is much shallower than that found for the square planar model, representing a poor fit to the data. Similar poor fits were found when the distance between arms was fixed at ds = 22 Å and the parameter space in the directions ϕs and ψs was explored (data not shown). Therefore, the data do not support a stacked structure at 0 mM Mg2+.
In the same fashion, we used the mapping procedure to analyze the 10 mM Mg2+ sample scattering data with the square planar and the stacked models. Firstly, we explored the Ξ-space defined by varying ϕp and ψp and assuming a square planar model (see Fig. 6 C). There is one extended minimum in the overlap-free region at  (almost independent of ψp), but with an absolute value (Ξ = 3.2) that does not represent an acceptable fit to the scattering data, implying that a square planar model cannot correctly represent the data for any reasonable value of ϕp and ψp.
Secondly, we mapped Ξ as a function of ϕs and d using the stacked model (see Fig. 6 D). Now, there are two narrow global minima located at  d0 = 18 ± 3 Å. These minima represent two identical low-resolution structures that are related by a symmetry operation (reflection). Even though there are differences between these alternative structures at high resolution (due to DNA chirality and differences in the arm sequences), this technique is not able to distinguish between them. To find whether changes in the kink angle improve the fit to the experimental data, ψs was varied between −30° and 30°, and ϕs from −90° to 90°, keeping the distance between the arms constant at d0 = 18 Å (the position on the d axis of the global minimum found when varying d and ϕ). In this case, we found (see Supplementary Material) a well-defined narrow minimum at
  and
and  confirming that, in the structure that best fits the experimental data, the arms are not significantly kinked.
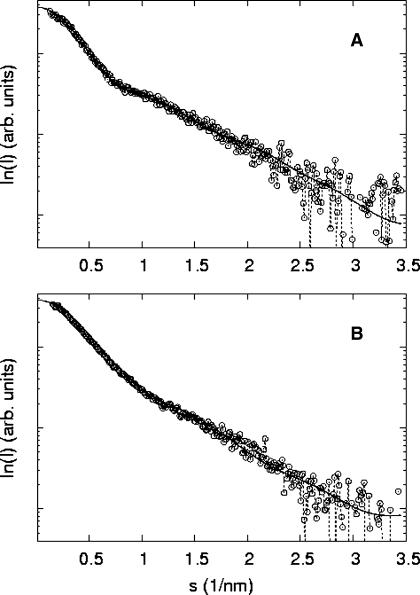
The actual fits produced by the models to the experimental data are presented in Fig. 7 A (for 0 mM Mg2+) and Fig. 7 B (for 10 mM Mg2+). The values for the model coefficients at the minima are in full agreement with those previously measured by Duckett and co-workers. In the absence of Mg2+, the HJ has a square planar conformation with ϕ = 90°; in the presence of at least 100 μM Mg2+, the HJ has a stacked conformation with ϕ = 60° (Duckett et al., 1988; Lilley and Clegg, 1993).
FIGURE 7.
Comparison between best fits for the 0 and 10 mM Mg2+ HJ samples. (A) 0 mM Mg2+ experimental data (circles) and best fit using the square planar model (solid line). (B) 10 mM Mg2+ experimental data (circles) and best fit using the stacked model (solid line).
Ab initio reconstructions
The computer programs GASBOR (Svergun et al., 2001) and DAMMIN (Svergun, 1999) were employed to restore ab initio models of the HJ from the SAXS data; however, only results obtained from GASBOR will be reported here (inasmuch as the results obtained with DAMMIN were virtually identical). Ten independent ab initio reconstructions were generated from the 0 mM Mg2+ scattering data, starting from different random configurations and using different numbers of beads (leading to different packing radii). In all the runs, C4 symmetry was imposed. The average Rg of the generated models was 39.5 ± 0.5 Å. The fits of the models to the experimental data were excellent and almost identical for all the models, yielding in all cases a goodness of fit <1.4 (arbitrary units; data not shown).
Superimposition of the restored models was performed using the computer program SITUS (Wriggers et al., 1998). Once superimposed, the models were averaged using a computer program (pdb2average, available upon request from M.N.) that removes voids in the structure by the combined use of a modified version of the improved cube method introduced by Pavlov and Fedorov (1983) with cycles of expansions and contractions as implemented by Lee and Richards (1971) in their algorithm for calculating the accessible surface area of a protein. The program recursively loads the input structures onto the same cubic lattice, calculates the cumulative Gaussian electron density, performs a series of expansions/contractions to reduce the appearance of voids, and finally samples the protein structure using a Monte Carlo algorithm. This procedure produces the average bead model that contains the structural features that all the individual restored models have in common, and eliminates the traits that are not shared between them. A similar procedure has been used by Petoukhov et al. (2002).
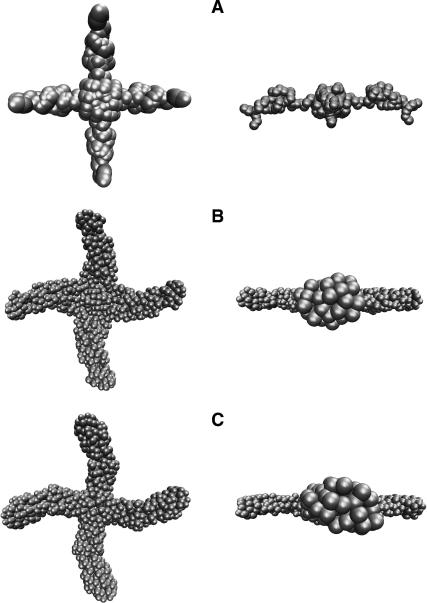
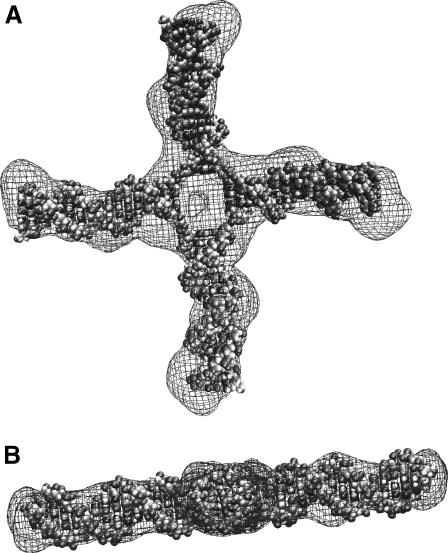
Fig. 8 shows side and front views of three of the reconstructions for the HJ at 0 mM Mg2+ in the same orientations in which they were averaged. The same running parameters were used to generate the second and third structures, whereas a much smaller number of beads was used for the first one. However, the models are remarkably similar. A shell model of the average reconstruction, and the best square planar model (in space-filling mode) for the HJ at 0 mM Mg2+ found in the previous section, are shown in Fig. 9. The two models are clearly in agreement, showing that two independent methods to interpret the experimental SAXS data result in essentially the same model for the HJ at 0 mM Mg2+.
FIGURE 8.
Front and side views of three models restored from SAXS data for the 0 mM Mg2+ HJ using GASBOR (Svergun et al., 2001); 110 beads were used for reconstructing model A and 204 beads for models B and C. The three reconstructions are significantly similar.
FIGURE 9.
(A) Front and (B) side views of a shell model of the average reconstruction superimposed onto the high-resolution NAMOT (Tung and Carter, 1994) model for the HJ at 0 mM Mg2+ found using rigid-body modeling.
In addition to these C4-constrained simulations, we have also generated models with other symmetry constraints, such as C2 and C1. The models made in this way produced fits to the experimental data that were equally as good as those of the reconstructions presented (data not shown), but that in all cases had physically unrealistic conformations. To restrict the number of possible reconstructions and discard unrealistic ones, we defined a series of criteria that the reconstructions had to fulfill to be acceptable: 1), because of the sequence complementarity of the oligonucleotides comprising the junction, the structure is expected to be formed by a combination of four arms representing the B-DNA fragments composing the HJ; 2), the models cannot be disconnected; and finally, 3), the sedimentation coefficients of the models simulated with HYDRO (García de la Torre et al., 2000) have to agree with the experimentally determined sedimentation coefficient. All the reconstructions were tested according to those criteria, and only those generated with specified C4 symmetry were able to satisfy all the requirements.
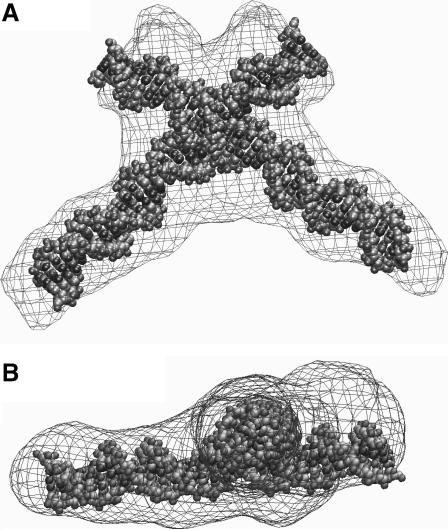
A similar procedure was applied to the ab initio reconstruction of the HJ at 10 mM Mg2+, but in this case C2 symmetry was imposed (other symmetry conditions will be mentioned later). The reconstructions were superimposed and averaged as for the 0 mM Mg2+ scattering data. Fig. 10 shows a shell model of the average reconstructed structure superimposed on a high-resolution model that was generated by finding the best docking of two independent non-overlapping 34-bp straight DNA fragments. The angle between arms in the resulting model is 60° and their center-to-center distance is 17 Å, similar to the model proposed in the rigid-body modeling analysis. However, in this new structure the point of strand exchange appears slightly displaced. Even though the arm lengths are symmetric in some individual reconstructions, the process of averaging independent reconstructions will inevitably accentuate the asymmetry of the arms by docking together reconstructions where the crossover point is displaced from the center. Ultimately, these results emphasize the inherent variability of the reconstruction process. As before, a series of simulations was performed with different symmetry constraints, namely C1 and C4, and the same criteria as before were used to define their acceptability. In this case, only the models with C2 symmetry satisfied these criteria while at the same time fitting the scattering data.
FIGURE 10.
(A) Front and (B) side views of a shell model of the average reconstruction superimposed onto the high-resolution NAMOT (Tung and Carter, 1994) model for the HJ at 10 mM Mg2+ found using rigid modeling.
Hydrodynamic modeling
The computer program HYDROPRO (García de la Torre et al., 2000) was employed to calculate the hydrodynamic parameters of high-resolution models. The calculation for the square planar structure that best fitted the 0 mM Mg2+ sample scattering curve gave a sedimentation coefficient of 3.96 S, which is in full agreement with the sedimentation coefficient determined experimentally (3.9 S). The calculation for the stacked structure that best fitted the 10 mM Mg2+ scattering data yielded a sedimentation coefficient of 4.38 S, which is again in complete accordance with the experimentally determined value (4.4 S). Thus, the hydrodynamic properties of the SAXS-based models are consistent with the hydrodynamic parameters measured experimentally.
DISCUSSION
In this article we have studied the changes in the low-resolution solution conformation of a Holliday junction with Mg2+ concentration, by using small-angle x-ray scattering, sedimentation velocity, and various computational modeling techniques. Two independent analyses of the scattering data were implemented.
The first method was based on previous models for the HJ (Lilley and Clegg, 1993) in the absence and presence of Mg2+, and was therefore model-dependent. The square planar model successfully fitted the scattering data for the 0 mM Mg2+ HJ sample, with ψ = 0 ± 10° (kink angle) and ϕ = 90 ± 20° (angle between arms), whereas the stacked model could not fit the scattering data. In contrast, the stacked model was shown to fit the 10 mM Mg2+ HJ sample scattering data, with a distance between arms of 18 ± 3 Å, a kink angle of 0 ± 5°, and an angle between arms of 55 ± 10°. In this case, a square planar model could not fit the scattering data. This rigid-body modeling approach allows for the determination of the model parameters for each of the conformations adopted by the HJ in solution, providing higher accuracy than other experimental techniques, such as FRET or gel-shift electrophoresis assays (Lilley and Clegg, 1993). However, prior information on the possible conformation of the macromolecule under investigation is required to define the model and its parameters. The SANS study of Chamberlain et al. (1998) on an HJ and its complex with RuvA reported no variation in I(0) or Rg of the HJ sample with Mg2+ concentration. The results presented in this article confirm these findings and show that the difference in scattering between HJ samples in the absence and presence of Mg2+ only appears at scattering angles s > 0.4 nm−1.
The same experimental scattering data were analyzed using model-independent ab initio reconstruction methods. These methods have recently been shown to be able to recreate the low-resolution structures of macromolecules (protein, DNA) in solution (Funari et al., 2000; Ackerman et al., 2003). The resolution of such models is not defined by the radii of the beads used but by the range of the scattering data fitted (in this study 2π/smax ∼ 17 Å). The reconstruction process is ambiguous, in that a variety of models are obtained which fit the experimental data equally well. Some of these models can be ruled out by specifying a set of rules based on predictable properties of the structure and on other experimental measurements (such as the sedimentation coefficient). The models that both fitted the experimental data and satisfied these rules were shown to differ only in fine details. This methodology again showed a striking agreement with both the solutions found by rigid-body modeling and previously reported results using other techniques (Lilley and Clegg, 1993). The models found by both methods not only fitted the scattering data but also agreed with the sedimentation coefficients found experimentally.
Our results provide a direct determination of the low-resolution conformation of Holliday junctions in solution. The methods applied in this article could be used for the study of the low-resolution structures of other biologically significant nucleic acid structures such as DNA hairpins, bulges, bent sequences, tetraplexes, and RNA as well as their complexes with proteins. This methodology combined with small-angle neutron scattering could also be successfully applied to the assignment of the individual DNA and protein components in protein-DNA complexes by using contrast matching.
SUPPLEMENTARY MATERIAL
An online supplement to this article can be found by visiting BJ Online at http://www.biophysj.org.
Supplementary Material
Acknowledgments
We thank Dmitri Svergun for help and guidance in using the SAXS station at the European Molecular Biology Laboratory/Deutsches Elektronen Synchrotron, Hamburg.
We acknowledge support for x-ray beam time from the European Community via the Access to Research Infrastructure Action of the Improving Human Potential Programme to the European Molecular Biology Laboratory Hamburg Outstation. This work was supported by the Wellcome Trust.
References
- Ackerman, C., M. Harnett, W. Harnett, S. Kelly, D. Svergun, and O. Byron. 2003. 19 Å solution structure of the filarial nematode immunomodulatory protein, ES-62. Biophys. J. 84:489–500. [DOI] [PMC free article] [PubMed] [Google Scholar]
- Bell, L., and B. Byers. 1979. Occurrence of crossed strand-exchange forms in yeast DNA during meiosis. Proc. Natl. Acad. Sci. USA. 76:3445–3449. [DOI] [PMC free article] [PubMed] [Google Scholar]
- Bianchi, M., M. Beltrame, and G. Paonessa. 1989. Specific recognition of cruciform DNA by nuclear-protein HMG1. Science. 243:1056–1059. [DOI] [PubMed] [Google Scholar]
- Boulin, C., R. Kempf, A. Gabriel, and M. Koch. 1988. Data acquisition systems for linear and area x-ray detectors using delay-line readout. Nucl. Instr. Meth. Phys. Res. 269:312–320. [Google Scholar]
- Calascibetta, F., P. de Santis, S. Morosetti, A. Palleschi, and M. Savino. 1984. Modelling of the DNA cruciform core. Gazz. Chim. Ital. 114:437–441. [Google Scholar]
- Chacón, P., J. Diaz, F. Moran, and J. Andreu. 2000. Reconstruction of protein form with x-ray solution scattering and a genetic algorithm. J. Mol. Biol. 299:1289–1302. [DOI] [PubMed] [Google Scholar]
- Chacón, P., F. Moran, J. Diaz, E. Pantos, and J. Andreu. 1998. Low-resolution structures of proteins in solution retrieved from x-ray scattering with a genetic algorithm. Biophys. J. 74:2760–2775. [DOI] [PMC free article] [PubMed] [Google Scholar]
- Chamberlain, D., A. Keeley, M. Aslam, J. Arenas-Licea, T. Brown, I. Tsaneva, and S. Perkins. 1998. A synthetic Holliday junction is sandwiched between two tetrameric Mycobacterium leprae RuvA structures in solution: new insights from neutron scattering contrast variation and modelling. J. Mol. Biol. 284:385–400. [DOI] [PubMed] [Google Scholar]
- Clegg, R., A. Murchie, and D. Lilley. 1994. The solution structure of the four-way DNA junction at low-salt conditions: a fluorescence resonance energy transfer analysis. Biophys. J. 66:99–109. [DOI] [PMC free article] [PubMed] [Google Scholar]
- Cox, M., M. Goodman, K. Kreuzer, D. Sherratt, S. Sandler, and K. Marians. 2000. The importance of repairing stalled replication forks. Nature. 404:37–41. [DOI] [PubMed] [Google Scholar]
- Duckett, D., A. Murchie, S. Diekmann, E. von Kitzing, B. Kemper, and D. Lilley. 1988. The structure of the Holliday junction, and its resolution. Cell. 55:79–89. [DOI] [PubMed] [Google Scholar]
- Fogg, J., M. Kvaratskhelia, M. White, and D. Lilley. 2001. Distortion of DNA junctions imposed by the binding of resolving enzymes: a fluorescence study. J. Mol. Biol. 313:751–764. [DOI] [PubMed] [Google Scholar]
- Funari, S., G. Rapp, M. Perbandt, K. Dierks, M. Vallazza, C. Betzel, V. Erdmann, and D. Svergun. 2000. Structure of free Thermus flavus 5 S rRNA at 1.3 nm resolution from synchrotron x-ray solution scattering. J. Biol. Chem. 274:31283–31288. [DOI] [PubMed] [Google Scholar]
- Furlong, J., and D. Lilley. 1986. Highly selective chemical modification of cruciform loops by diethyl pyrocarbonate. Nucleic Acids Res. 14:3995–4007. [DOI] [PMC free article] [PubMed] [Google Scholar]
- García de la Torre, J., M. Huertas, and B. Carrasco. 2000. Calculation of hydrodynamic properties of globular proteins from their atomic-level structure. Biophys. J. 78:719–730. [DOI] [PMC free article] [PubMed] [Google Scholar]
- García de la Torre, J., S. Navarro, M. López Martínez, F. Diaz, and J. López Cascales. 1994. A computer software for the prediction of hydrodynamic properties of macromolecules. Biophys. J. 67:530–531. [DOI] [PMC free article] [PubMed] [Google Scholar]
- Gellert, M., K. Mizuuchi, M. O'Dea, H. Ohmori, and J. Tomizawa. 1979. DNA gyrase and DNA supercoiling. Cold Spring Harb. Symp. Quant. Biol. 43:35–40. [DOI] [PubMed] [Google Scholar]
- Gough, G., and D. Lilley. 1985. DNA bending induced by cruciform formation. Nature. 313:154–156. [DOI] [PubMed] [Google Scholar]
- Gough, G., K. Sullivan, and D. Lilley. 1986. The structure of cruciforms in supercoiled DNA: probing the single-stranded character of nucleotide bases with bisulphite. EMBO J. 5:191–196. [DOI] [PMC free article] [PubMed] [Google Scholar]
- Haber, J. E. 2000. Partners and pathways—repairing a double-strand break. Trends Genet. 16:259–264. [DOI] [PubMed] [Google Scholar]
- Holliday, R. 1964. A mechanism for gene conversion in fungi. Genet. Res. 5:282–304. [DOI] [PubMed] [Google Scholar]
- Kallenbach, N., R. Ma, A. Wand, G. Veeneman, J. van Boom, and N. Seeman. 1983. Fourth rank immobile nucleic acid junctions. J. Biomol. Struct. Dyn. 1:159–168. [DOI] [PubMed] [Google Scholar]
- Kitts, P., and H. Nash. 1987. Homology-dependent interactions in phage-λ site-specific recombination. Nature. 329:346–348. [DOI] [PubMed] [Google Scholar]
- Koch, M., and J. Bordas. 1983. X-ray diffraction and scattering on disordered systems using synchrotron radiation. Nucl. Instrum. Meth. Phys. Res. 208:461–469. [Google Scholar]
- Konarev, P., V. Volkov, A. Sokolova, M. Koch, and D. Svergun. 2003. PRIMUS: a Windows PC-based system for small-angle scattering data analysis. J. Appl. Crystallogr. 36:1277–1282. [Google Scholar]
- Kosak, H., and B. Kemper. 1990. Large-scale preparation of T4 endonuclease VII from over-expressing bacteria. Eur. J. Biochem. 194:779–784. [DOI] [PubMed] [Google Scholar]
- Lee, B., and F. Richards. 1971. The interpretation of protein structures: estimation of static accessibility. J. Mol. Biol. 55:379–400. [DOI] [PubMed] [Google Scholar]
- Lilley, D. 1980. The inverted repeat as a recognizable structural feature in supercoiled DNA molecules. Proc. Natl. Acad. Sci. USA. 77:6468–6472. [DOI] [PMC free article] [PubMed] [Google Scholar]
- Lilley, D., and R. Clegg. 1993. The structure of branched DNA species. Q. Rev. Biophys. 26:131–175. [DOI] [PubMed] [Google Scholar]
- McCulloch, R., L. Coggins, S. Colloms, and D. Sherratt. 1994. Xer-mediated site-specific recombination at cer generates Holliday junctions in vivo. EMBO J. 13:1344–1355. [DOI] [PMC free article] [PubMed] [Google Scholar]
- Panayotatos, N., and R. Wells. 1981. Cruciform structures in supercoiled DNA. Nature. 289:466–470. [DOI] [PubMed] [Google Scholar]
- Pavlov, M., and B. Fedorov. 1983. Improved technique for calculating x-ray scattering intensity of biopolymers in solution—evaluation of the form, volume and surface of a particle. Biopolymers. 22:1507–1522. [Google Scholar]
- Petoukhov, N., M. V. Eady, K. Brown, and D. Svergun. 2002. Addition of missing loops and domains to protein models using x-ray solution scattering. Biophys. J. 83:3113–3125. [DOI] [PMC free article] [PubMed] [Google Scholar]
- Rafferty, J., S. Sedelnikova, D. Hargreaves, P. J. Artymiuk, P. Baker, G. Sharples, A. Mahdi, R. Lloyd, and D. Rice. 1996. Crystal structure of DNA recombination protein RuvA and a model for its binding to the Holliday junction. Science. 274:415–421. [DOI] [PubMed] [Google Scholar]
- Schuck, P. 2000. Size-distribution analysis of macromolecules by sedimentation velocity ultracentrifugation and Lamm equation modeling. Biophys. J. 78:1606–1619. [DOI] [PMC free article] [PubMed] [Google Scholar]
- Schwacha, A., and N. Kleckner. 1995. Identification of double Holliday junctions as intermediates in meiotic recombination. Cell. 83:783–791. [DOI] [PubMed] [Google Scholar]
- Seeman, N., and N. Kallenbach. 1994. DNA branched junctions. Annu. Rev. Biophys. Biomol. Struct. 23:53–86. [DOI] [PubMed] [Google Scholar]
- Sigal, N., and B. Alberts. 1972. Genetic recombination: the nature of a crossed strand-exchange between two homologous DNA molecules. J. Mol. Biol. 71:789–793. [DOI] [PubMed] [Google Scholar]
- Sobell, H. 1972. Molecular mechanism for genetic recombination. Proc. Natl. Acad. Sci. USA. 59:2483–2487. [DOI] [PMC free article] [PubMed] [Google Scholar]
- Stuhrmann, H. B. 1970. Ein neues Verfahren zur Bestimmung der Oberflaechenform und der inneren Struktur von geloesten globularen Proteinen aus Roentggenkleinwinkelmessungen. Zeitschr. Physik. Chem. Neue Folge. 72:177–198. [Google Scholar]
- Svergun, D. 1992. Determination of the regularisation parameter in indirect transform using perceptual criteria. J. Appl. Crystallogr. 25:495–503. [Google Scholar]
- Svergun, D. 1999. Restoring low resolution structure of biological macromolecules from solution scattering using simulated annealing. Biophys. J. 76:2879–2886. [DOI] [PMC free article] [PubMed] [Google Scholar]
- Svergun, D., C. Barberato, and M. Koch. 1995. CRYSOL—a program to evaluate x-ray solution scattering of biological macromolecules from atomic structures. J. Appl. Crystallogr. 28:768–773. [Google Scholar]
- Svergun, D., M. Petoukhov, and M. Koch. 2001. Determination of domain structure of proteins from x-ray solution scattering. Biophys. J. 80:2946–2953. [DOI] [PMC free article] [PubMed] [Google Scholar]
- Tung, C., and E. Carter. 1994. Nucleic acid modeling tool (NAMOT): an interactive graphic tool for modeling nucleic acid structures. Comput. Appl. Biosci. 10:427–433. [DOI] [PubMed] [Google Scholar]
- Wemmer, D., A. Wand, N. Seeman, and N. Kallenbach. 1985. NMR analysis of DNA junctions: amino proton NMR studies of individual arms and intact junction. Biochemistry. 24:5745–5749. [DOI] [PubMed] [Google Scholar]
- White, M., M. Giraud-Panis, J. Pohler, and D. Lilley. 1997. Recognition and manipulation of branched DNA structure by junction-resolving enzymes. J. Mol. Biol. 269:647–664. [DOI] [PubMed] [Google Scholar]
- Wriggers, W., R. Milligan, K. Schulten, and J. McCammon. 1998. Self-organizing neural networks bridge the biomolecular resolution gap. J. Mol. Biol. 284:1247–1254. [DOI] [PubMed] [Google Scholar]
Associated Data
This section collects any data citations, data availability statements, or supplementary materials included in this article.


