

Abstract
Proteins undergo an apparent dynamical transition on temperature variation that has been correlated with the onset of function. The transition in the mean-square displacement, 〈Δr2〉, that is observed using a spectrometer or computer simulation, depends on the relationship between the timescales of the relaxation processes activated and the timescale accessible to the instrument or simulation. Models are described of two extreme situations—an “equilibrium” model, in which the long-time dynamics changes with temperature and all motions are resolved by the instrument used; and a “frequency window” model, in which there is no change in the long-time dynamics but as the temperature increases, the relaxation frequencies move into the instrumental range. Here we demonstrate that the latter, frequency-window model can describe the temperature and timescale dependences of both the intermediate neutron scattering function and 〈Δr2〉 derived from molecular dynamics simulations of a small protein in a cryosolution. The frequency-window model also describes the energy-resolution and temperature-dependences of 〈Δr2〉 obtained from experimental neutron scattering on glutamate dehydrogenase in the same solvent. Although equilibrium effects should also contribute to dynamical transitions in proteins, the present results suggests that frequency-window effects can play a role in the simulations and experiments examined. Finally, misquotations of previous findings are discussed in the context of solvent activation of protein dynamics and the possible relationship of this to activity.
INTRODUCTION
A range of experiments and computer simulations have detected a qualitative change with temperature in the nature of internal motions of proteins at 180–220 K (Keller and Debrunner, 1980; Doster et al., 1989; Rasmussen et al., 1992; Cohen et al., 1981; Knapp et al., 1982). At temperatures below this transition the average atomic mean-square displacement is linear with temperature, consistent with harmonic dynamics, whereas above it additional fluctuations occur and, at physiological temperatures, dominate the atomic mean-square displacement. The additional fluctuations may involve atoms undergoing confined continuous diffusion (Kneller and Smith, 1994) and/or jump diffusion between potential energy wells associated with “conformational substates” (Frauenfelder et al., 1979, 1991; Elber and Karplus, 1987; Lamy et al., 1996; Tournier and Smith, 2003).
Correlations have been made between the function of some proteins, such as ligand binding or proton pumping, and the presence of the increased fluctuations (Rasmussen et al., 1992; Ferrand et al., 1993; Fitter et al., 1997; Lehnert et al., 1998; Ding et al., 1994). Flexibility is indeed required for proteins to rearrange their structures so as to reach functional configurations. However, the forms and timescales of the motions required for function are, in general, unknown. Moreover, it has been shown using neutron scattering that, in the case of enzyme activity in a cryosolvent, the rate-limiting step is independent of the ps-timescale ∼220 K dynamical transition in this solution (Daniel et al., 1998; Dunn et al., 2000).
Whether a dynamical transition is detected experimentally depends on the relationship between the timescale of the characteristic relaxation processes leading to the increased mean-square displacement and the time resolution of the experimental technique employed. Two contrasting scenarios for the dynamical transition can be envisaged. In the first, “equilibrium” scenario, all motions in the system are resolved by the instrument at all temperatures examined. In other words, the characteristic relaxation frequencies of the dynamics are all within the energy resolution of the instrument used. In this case, an observed dynamical transition results from a change with temperature of the long-time probability distribution of the single atom displacements, and analysis of the dynamical transition can, in principle, lead to a characterization of energy levels occupied by different conformational substates (Doster et al., 1989; Doster and Settles, 1999).
In the alternative, “frequency window” scenario, there is no change in the time-converged atomic probability distribution with temperature. This would be the case, for example, in a system with a double-well potential with no difference in energy between the minima. Apparent dynamical transition behavior can be observed in this scenario if, below the transition, the relaxation frequencies of the dynamics determining the mean-square displacement are too slow to be detected by the finite energy-resolution instrument, and if the frequencies increase with temperature such that they pass into the frequency window of the instrument. This description of the dynamical transition has recently been suggested to explain the timescale dependence of the mean-square displacement observed for an enzyme solution (Daniel et al., 2003). For systems in which the frequency-window scenario dominates, the dynamical transition reveals information about the timescales of motions crossing the resolution window of the instrument. If these motions involve activated dynamics then the barriers concerned can be determined.
The frequency windows of neutron scattering experiments are in the same range as characteristic frequencies of molecular motions, i.e., ∼1–100 μeV. Therefore, the frequency-window scenario is likely to play a role in determining the dynamics observed using this technique. In a complex energy landscape, such as that explored by a solvated protein, the transition observed by neutron scattering is likely to involve a combination of both the frequency-window and equilibrium scenarios. In the present work, however, we concentrate on the latter, frequency-window effect, as this has not been considered in most previous analyses. We demonstrate that the frequency-window model can describe the dynamical transition data obtained from a molecular dynamics simulation of a small protein in a CD3OD/D2O cryosolvent. We also analyze here neutron scattering experiments that demonstrated that the dynamical transition behavior of an enzyme in the above solvent depends strongly on the timescale of motions observed: the temperature at which the transition is observed shifts from ∼220 K to ∼150 K when improving the instrumental energy resolution from 50 μeV to 1 μeV (Daniel et al., 1999; Dunn et al., 2000). It is shown that the basic features of the timescale-dependence of the mean-square displacements obtained in these experiments are also well reproduced with the frequency-window model.
METHODS AND THEORY
In this section outlines are given of the theoretical frequency-window model as applied to the analysis of neutron scattering data, and of the molecular dynamics calculations. Details of the theory can be found in Becker and Smith (2003) and details of the simulations in Hayward et al. (2003).
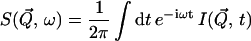
The dynamic structure factor, S(Q, ω)
The experimentally measured quantity is the incoherent dynamic structure factor,  which is the time Fourier-transform of the intermediate scattering function,
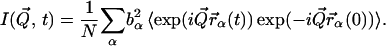
  (Lovesey, 1987),
 |
(1) |
with
 |
(2) |
where  is the scattering vector, ℏω the energy transfer, N is the number of atoms in the system, bα is the incoherent scattering length of atom α, and
  denotes the corresponding position vector at time t. In what follows isotropic averaging is performed, thereby discarding the vector notation for the position and wave vectors. This is appropriate for powder and solution samples.
The dynamical transition is characterized by the scattering at very low energy transfer in the elastic and quasielastic regions. In the quasielastic regime the scattering function, Sqel(Q, ω) can be approximated as (Bee, 1988)
 |
(3) |
Here W(Q) is the Debye-Waller factor and e−2W(Q) is the reduction of the elastic peak height due to vibrational motions of the protein. Within the Gaussian approximation the Debye-Waller factor can be related to a mean-square displacement via 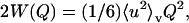 where 〈u2〉v is the vibrational mean-square displacement (Rahman, 1963).
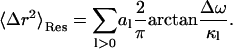
A0(Q) is the elastic incoherent scattering function. SD(Q, ω) is approximated by a sum of Lorentzian functions representing the slow, diffusive motions of the sample as
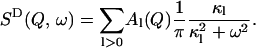 |
(4) |
Here the κl define characteristic timescales of relaxation processes ( ) and the Al(Q) are defined by the spatial characteristics of these processes (jumps, diffusion, etc.). Fourier-transforming Eq. 3 gives the expression
 |
(5) |
where 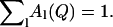
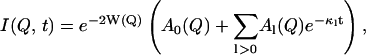
To understand the temperature-dependence of I(Q, t), it is instructive to look at the two limiting situations, t → 0 and t → ∞. The situation t → 0 here means times that are short compared to the lowest characteristic relaxation time, 1/κ, but still long enough for vibrational motions to be resolved. In this case, the vibrational motions determine the intermediate scattering function, and I(Q, t) is given by the Debye-Waller factor, e−2W(Q). For times long enough to sample all relaxation processes of the system (t → ∞), I(Q, t) is given by
 |
(6) |
i.e., the product of the Debye-Waller factor and the elastic incoherent scattering function, and hence this product also determines the temperature-dependence of the elastic scattering at t → ∞. According to Eq. 5 the time-dependence of I(Q, t) can be described by a sum of exponentials of amplitude, Al(Q), each representing a decay of the scattering function on a certain timescale, 1/κl. The amplitudes Al(Q) and the frequencies κl may depend on the temperature. Thus, for intermediate times, in which all of the vibrational motions are fully sampled but not all of the relaxation processes, whether a process l contributes to I(Q, t) will depend on the relationship between t and κl.
The timescale accessible to an instrument depends on its energy resolution. The energy resolution can be incorporated into the analysis as follows. An expression for the experimentally determined mean-square displacement, 〈Δr2〉exp, can be derived from Eqs. 3 and 4. The measured elastic scattering, Sexp(Q, ω ≈ 0), is
 |
(7) |
 |
(8) |
where R(ω) is the energy resolution function of the instrument.
At low Q the elastic scattering is Gaussian in Q, allowing 〈Δr2〉exp to be extracted by taking the slope of the natural logarithm of the elastic scattering as a function of Q2 (Rahman, 1963), as
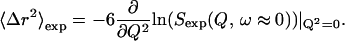 |
(9) |
As described in Becker and Smith (2003), the combination of Eqs. 8 and 9 yields
 |
(10) |
where
 |
(11) |
and, assuming R(ω) is rectangular,
 |
(12) |
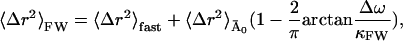
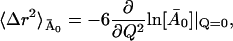
In Eq. 10 〈Δr2〉Conv is the long-time converged mean-square displacement (which is finite for a spatially confined system). 〈Δr2〉Res arises from quasielastic scattering not resolved by the instrument and is therefore due to motions too slow to be detected. In Eq. 11, two additional mean-square displacements have been defined: 〈Δr2〉2W, arising from the fast vibrational motions; and 〈Δr2〉A0, arising from the slow, diffusive motions. 〈Δr2〉Conv is the sum of these two. In Eq. 12, Δω is the width of the resolution function (half-width at full maximum), and al is the maximal contribution of relaxation process l to the mean-square displacement.
Variation with temperature of either of the two terms on the right-hand side of Eq. 10 can produce a dynamical transition in 〈Δr2〉exp. A change in 〈Δr2〉Conv, while keeping 〈Δr2〉Res constant, corresponds to the equilibrium model, in which there is a change in the time-converged properties of the protein. This could arise, for example, from the presence of multiple minima in the energy landscape which can lead to changes in 〈Δr2〉A0. However, if these minima have the same free energy, their relative populations will not change with temperature and 〈Δr2〉A0 will remain constant. Rather, the free energies of the minima must be different, in which case the increased relative occupation of the higher-energy state with increasing temperature leads to an increase in 〈Δr2〉A0. Since changes in 〈Δr2〉Conv are in time-converged properties of the protein, the transition will be independent of instrumental resolution, provided that all associated motions are resolved. An example of a model based on a change in 〈Δr2〉A0 is that of Doster et al. (1989), in which a two-state potential with a free-energy difference ΔU between the states was examined.
In this article we explore the alternative, frequency-window scenario, in which the transition arises entirely from the temperature-dependence of 〈Δr2〉Res, which is itself given by the temperature-dependence of κl(T) in Eq. 12.
Molecular dynamics simulations
The model system consists of one molecule of BPTI with 658 CD3OD and 661 D2O molecules in an orthorhombic box with periodic boundary conditions, providing at least three solvent shells around the protein. This is adequate for simulating a protein in a bulk-solvent environment. As in typical neutron scattering experiments, the exchangeable BPTI hydrogen atoms were replaced by deuterium. This system models a solution of a protein in 70% v/v CD3OD/D2O cryosolvent, as was used in several neutron experiments (Daniel et al., 1999, 1998; Réat et al., 2000) including those analyzed in Results, below. The concentration of BPTI in the simulation is 156 mg/ml, which again is in the range commonly used in solution experiments.
The system was simulated using CHARMM (Brooks et al., 1983), Ver. 27, with All-Atom Parameter Set 22 (Mackerell et al., 1998). The simulations were performed in the NPT ensemble at 1 atm pressure. The system was simulated at a range of temperatures from 80 K through to 300 K. Equilibration at each temperature was for 150 ps and data was collected every 0.1 ps for 520 ps.
The protein trajectories were decomposed into external (whole-molecule diffusion) and internal components. The external motions were removed by superimposing every frame from the atomic trajectory with a root mean-square fit onto the first frame. In this article only the internal protein motions are considered. The intermediate scattering function I(Q, t) was calculated from the molecular dynamics trajectory using the nMOLDYN package (Kneller et al., 1995). Subsequent analysis was performed using the theory outlined above. In additional analysis the mean-square displacement was calculated directly from the simulation, 〈Δr2〉Sim, and compared with the mean-square displacement calculated using the theoretical model in The Dynamic Structure Factor, S(Q, ω), above.
Analysis of experimentally derived mean-square displacements
In the frequency-window model the experimentally determined mean-square displacement depends on the resolution of the spectrometer. Resolution dependence of 〈Δr2〉exp has indeed been observed in experiments on glutamate dehydrogenase in a 70% v/v CD3OD/D2O cryosolvent. Details of sample preparation and data acquisition and reduction for these experiments can be found in Daniel et al. (1999). Spectra were taken at the Institut Laue-Langevin (Grenoble, France) with two different instruments, IN6 and IN16, having energy resolutions of 50 μeV and 1 μeV, respectively. Both instruments cover the same Q-range (0 < Q < 2 Å−1), thereby enabling direct comparison of the resultant mean-square displacements. The transition temperature in this system was found to shift from ∼220 K (50 μeV) to ∼150 K (1 μeV). Here, the resolution dependence is analyzed using the theory in The Dynamic Structure Factor, S(Q, ω), above.
RESULTS
Molecular dynamics simulation
The temperature-dependence of the intermediate scattering function, I(Q, t), calculated from the molecular dynamics simulations is shown in Fig. 1. Below 180 K there is virtually no decay of I(Q, t) in the time span accessed (1 ≤ t ≤ 200 ps). In the temperature range 180–300 K, a decay at long times (t > 20 ps) is observed, indicating the presence of slow relaxation processes.
FIGURE 1.

Intermediate scattering function I(Q, t) calculated from nine molecular dynamics simulations at different temperatures at 1.2 Å−1 (symbols). The result of the fit of Eq. 13 to I(Q, t) is also shown (lines).
We now examine whether the frequency-window scenario, in which Al(Q) is independent of temperature but κl dependent on temperature, can describe the simulation-derived I(Q, t) and 〈Δr2〉Sim. I(Q, t) in Fig. 1 was found to decay approximately exponentially for t ≥ 10 ps and T ≥ 180 K. Fitting with more than one exponential leads to better agreement in the short time regime (t ≤ 10 ps). However, the parameters of the two exponentials are strongly interdependent, complicating their interpretation. Moreover, the main focus of this article is not to derive a detailed description of short-time protein dynamics, but rather to investigate the slow relaxation processes that dominate the dynamical transition behavior. Therefore, it was decided to model I(Q, t) with a single exponential that reproduces the long-time behavior. Consequently, the equation fitted to the simulation-derived I(Q, t) is
 |
(13) |
Here, the Debye-Waller factor representing vibrational motions in Eq. 5 has been replaced by the term 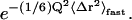 〈Δr2〉fast includes all dynamics of the system faster than ∼10 ps, comprising not only vibrational motions but also fast diffusive motions. This again reflects the fact that the time-dependence in I(Q, t) represents the long-time behavior via the temperature-dependent relaxation frequency, κFW.
The extraction of the parameters of Eq. 13 was performed in two steps. First, the equation was fitted to the simulation-derived I(Q, t) with all parameters allowed to vary freely with temperature, including the amplitudes, A0. The decay of the intermediate scattering function is more pronounced at high temperatures than at low temperatures, allowing a better extraction of A0(Q) (see Fig. 2) at high temperatures.  was obtained by averaging A0(Q) over the temperatures above 250 K.
  represents an estimate of the long-time, converged elastic incoherent scattering function, and was kept invariant with temperature in all further analyses, as required by to the frequency-window hypothesis. In a second fitting step, then, Eq. 13 was fitted to the simulation-derived I(Q, t) with
  kept fixed. Fig. 1 shows a comparison of the frequency-window fit with the simulation-derived I(Q, t). The model clearly reproduces the temperature-dependent decay of I(Q, t) over the range 10 ≤ t ≤ 300 ps.
FIGURE 2.

Elastic incoherent scattering factor (A0(Q)) determined for T ≥ 250 K by fitting Eq. 13 to I(Q, t) obtained from molecular dynamics simulations. Also shown is the average, 
In the equilibrium model the temperature-dependence of the t → ∞ values of I(Q, t) are determined by the decrease of A0(Q) with temperature, due to the onset of new dynamical processes in the system. In contrast, in the frequency-window model, for all temperatures I(Q, t) will finally decay to the plateau value 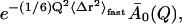 with
with  now being independent of temperature. The higher measured values of I(Q, t) at low temperatures then reflect the fact that the motions determining
  occur on timescales too slow to be seen in the simulations at these temperatures.
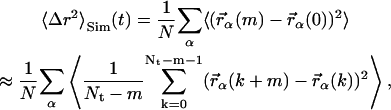
The temperature-dependence of the mean-square displacement was determined directly from the set of molecular dynamics simulations, using the equation
 |
(14) |
where m, k, and Nt are integer numbers with t = m Δt, Δt being the timestep of the simulation of total length Nt Δt. 〈Δr2〉Sim was calculated for four different values of t: 20, 50, 100, and 200 ps. Fig. 3 shows the resulting mean-square displacements, 〈Δr2〉Sim. Below T ≈ 180 K, 〈Δr2〉Sim(t) is the same on all timescales, indicating that no processes are activated with timescales between 20 and 200 ps at these temperatures. Raising the temperature further, a dynamical transition, i.e., a deviation from linearity of 〈Δr2〉Sim, is observed on all timescales. However, the transitions on different timescales differ in two aspects.
FIGURE 3.

Energy resolution and timescale-dependence of 〈Δr2〉. (Solid lines) 〈Δr2〉Sim calculated from molecular dynamics trajectories using Eq. 14 with t = 20, 50, 100, and 200 ps. (Symbols) 〈Δr2〉FW calculated using Eq. 15 with the instrumental energy resolution, Δω, set to 1/20, 1/50, 1/100, and 1/200 ps−1. (Inset) The fast component, 〈Δr2〉fast of 〈Δr2〉FW (dots) and 〈Δr2〉A0 (diamonds). The dashed line represents a linear fit to the temperature range 100–180 K.
First, T0, the temperature at which 〈Δr2〉Sim deviates from the straight line, shows a timescale-dependence. This is illustrated in Fig. 4, in which 〈Δr2〉Sim is plotted for 20 ps and 200 ps together with a linear fit over the temperature range 100 ≤ T ≤ 180 K. Although 〈Δr2〉Sim deviates from linearity at ∼180 K for the 200-ps data, a deviation appears only at ∼220 K on the 20-ps timescale. This reflects the fact that for temperatures between 170 and 220 K the intermediate scattering function in Fig. 1 exhibits an additional decrease on the 200-ps, but not on the 20-ps, timescale. The presence of a timescale-dependence of the transition temperature is a characteristic feature of the frequency-window scenario. Since in the frequency-window picture no new motions are activated at T0, but rather existing motions become faster and drift into the timescale accessible to an instrument, T0 depends on the instrumental resolution.
FIGURE 4.

〈Δr2〉Sim calculated from the molecular dynamics trajectories for two values of t, 20 ps, and 200 ps. Also shown is a linear fit to the temperature range 100–180 K.
A second difference between 〈Δr2〉Sim on different timescales is in the magnitude of 〈Δr2〉Sim for T > T0. This magnitude increases with timescale such that 〈Δr2〉Sim(200 ps) ≈ 2〈Δr2〉Sim(20 ps) at 300 K. Again, this reflects the presence of motions on the 20–200-ps timescale.
Assuming the presence of a single relaxation frequency, the mean-square displacement from the frequency-window model in Eq. 13, 〈Δr2〉FW, is given by
 |
(15) |
where 〈Δr2〉fast and  are the fast and slow contributions to the mean-square displacement, respectively. 〈Δr2〉fast and
  can be determined as described in Methods and Theory, above, and Becker and Smith (2003). For example,
  is given by
 |
(16) |
and can be obtained by a straight line fit to the low Q2-regime of  versus Q2.
The mean-square displacement, 〈Δr2〉FW, at different values of the resolution, Δω(1/20 ps), 1/50 ps, 1/100 ps, and 1/200 ps, was calculated using Eq. 15. The results thus obtained are compared with 〈Δr2〉Sim in Fig. 3. The only difference between the four 〈Δr2〉FW values shown is the factor Δω representing different instrumental resolutions. Nevertheless, 〈Δr2〉FW reproduces the simulation data on all timescales (resolutions). As expected, the agreement for the lowest resolution (20-ps timescale) is slightly worse than at other resolutions, since the frequency-window model used here (Eq. 13) was parameterized to reproduce the simulation-derived I(Q, t) only for longer times.
The inset to Fig. 3 depicts 〈Δr2〉fast, the fast contribution to 〈Δr2〉 together with the time-converged slow contribution due to diffusive motions,  Also shown is a linear fit to 〈Δr2〉fast over the temperature range 100 < T < 180 K. Below T ≈ 220 K the linearity of 〈Δr2〉fast is consistent with the motions being harmonic, given by the Debye-Waller factor Ifast(Q, t) ≈ e−2W. The linear fit suggests that there is a small transition in 〈Δr2〉fast at T ≈ 200–220 K. This might indicate the onset of fast anharmonic motions on timescales faster than 10 ps.
〈Δr2〉Conv is given by the sum of 〈Δr2〉fast and  (see Eqs. 10 and 11), where
  is constant with temperature. The high value of
  at low temperature in the inset to Fig. 3 might be surprising at first but can be understood if one recalls that in the frequency-window model motions do not cease to exist at a given temperature, but simply shift to longer timescales. Given enough time, these motions still occur, leading to a constant mean-square displacement even at low temperatures. Taking the symmetric two-state model as an example again, this reflects that barrier crossings do occur at very low temperatures, with the timescale of these crossings tending to infinity.
In Fig. 5 the relaxation frequency, κFW, obtained by the fit shown in Fig. 1 is plotted. For T ≤ 180 K the relaxation time, 1/κFW, is indeed much longer than the 200-ps timescale, i.e., κFW is sufficiently small not to lead to substantial decrease in I(Q, t) for t ≤ 200 ps. At the onset of the measured transition, at T ≈ 220 K, it is ∼200 ps, and becomes faster with increasing temperature, reaching a timescale of ∼50 ps at 300 K.
FIGURE 5.

(Symbols) Long-time relaxation frequency κ as obtained by fitting Eq. 13 to I(Q, t). (Solid line) The result of fitting an Arrhenius function to λ.
The frequency-window model does not suppose any particular form of the dynamics associated with the relaxation time, κFW. For example, a priori, the dynamics could be continuous or jump-diffusion. Distinguishing between these types of dynamics is beyond the remit of the present analysis method. Further analysis can involve fitting an Arrhenius function, 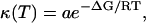 to κFW. κ(T) in Fig. 5 indeed follows approximately Arrhenius behavior. The resulting parameters determining the slow dynamics in 〈Δr2〉FW are 〈Δr2〉A0, the pre-exponential a; and ΔG, the activation free energy. 〈Δr2〉A0 is 0.96 Å, ΔG is 3.0 kcal/mol, and the pre-exponential factor is a ∼ 1012 s−1. These values are typical for barrier crossing in condensed-phase molecular systems (Bee, 1988). It must be stressed, however, that over-interpretation of κFW is dangerous and that attribution of the dynamics to any single process is unwarranted. Indeed for a heterogeneous system such as a protein in solution it is unlikely that a simple type of motion determines the scattering profile of the system. Further analysis of the simulations and quasielastic scattering would be necessary to disentangle these different contributions and to obtain a detailed picture of the underlying dynamics at atomic resolution (Tournier and Smith, 2003).
Experimental neutron scattering data
The frequency-window model is now used to analyze experimentally derived mean-square displacements obtained from glutamate dehydrogenase in a cryosolution (Daniel et al., 1999). The analysis again uses Eq. 15 as the fitting function. The fast component, 〈Δr2〉fast, was assumed to depend linearly on temperature, 〈Δr2〉fast = αT. Eq. 15 was fitted simultaneously to the mean-square displacements determined using the instruments IN6 and IN16 with ΔωIN6 = 50 μeV = 50 ΔωIN16, reflecting the 50-times-higher energy resolution of IN16.
Fig. 6 shows the result of the least-squares fit of Eq. 15 to the experimental data sets. The model is able to reproduce the most prominent features of the experimental data, namely the pronounced shift of the transition temperature, T0, from 150 K to 220 K between the two instruments, and the leveling off of 〈Δr2〉exp at higher temperatures seen on the higher-resolution instrument. The shift in T0 with resolution is in harmony with the shift seen in the simulation data, 〈Δr2〉Sim, in Fig. 4. Motions being fast enough to be detected at 150 K with the instrument IN16 become fast enough to be seen on IN6 only at 220 K. The fact that the shift in the simulation data in Fig. 4 is smaller than that seen experimentally in Fig. 6 is consistent with the fact that the difference in timescale between the two simulation data sets is smaller than that between the two experimental data sets.
FIGURE 6.

〈Δr2〉exp determined by two different instruments (IN6, IN16) fitted using Eq. 15. Experimental data were taken from Daniel et al. (1999). (Inset) Characteristic relaxation time as a function of temperature. 1/κ(T) was determined by fitting Eq. 10 to 〈Δr2〉exp.
The leveling off of 〈Δr2〉exp with T at high resolution is a consequence of the finite amount that the relaxation process contributes to 〈Δr2〉Conv. According to Eq. 10 each process l contributes at most al to the converged mean-square displacement. This can be illustrated with the two-state model again. Jumping between the minima makes a contribution to 〈Δr2〉Conv. This contribution will not be seen in 〈Δr2〉exp at low temperature since the timescale of these jumps is too slow. At higher temperatures the jumps contribute more and more, thereby leading to a transition in 〈Δr2〉exp. If the timescale of these jumps is much faster than the timescale accessible to the instrument (i.e., τjump ≪ τres), all of the jumps are seen leading to no further increase in the observed mean-square displacement with temperature.
The frequency-window model fails to obtain quantitative agreement with experiment in Fig. 6 at higher temperatures. In particular, the continued increase in 〈Δr2〉exp above 270 K determined using the lower-resolution instrument is not reproduced. However, experimental errors may be significantly higher than estimated at high 〈Δr2〉, due to the correspondingly low elastic peak intensities. Furthermore, additional solvent-driven processes are likely to be activated at ∼270 K due to solvent melting. The assumption of a single relaxation process is unlikely to be valid at T ≥ 270 K.
The temperature-dependence of the relaxation frequency, κ, is shown in the inset of Fig. 6. In the temperature range 150 K–280 K, the relaxation time changes from ∼100 ns to ∼10 ps. Thus the motion passes through the approximate time resolution windows of the two instruments, which are 5 ns for IN16 and 100 ps for IN6. 〈Δr2〉A0 is 0.81 Å2, similar to the value obtained in the molecular dynamics analysis.
DISCUSSION
The present theoretical analysis shows that the dynamical transition as observed by molecular dynamics simulation and neutron experiment can be described without needing to invoke a change with temperature in the long-time, equilibrium atomic dynamics. In the “frequency window” model used to analyze the data the temperature-dependence of dynamical relaxation processes leads to the appearance of dynamical transition behavior in the measured signal as, with increasing temperature, the processes become fast enough to be resolved by the instrument used. The frequency-window model is a true dynamical model insofar as the change in slope of the observed 〈Δr2〉 at the dynamical transition is due to the temperature-dependence of the motional timescales. Assuming activated dynamics, the transition would thus be determined by the barriers between energy minima rather than by differences in energies between the minima.
The frequency-window model reproduces the broad features of the experimental mean-square displacement results for a protein in a cryosolution and is also in good quantitative agreement with molecular dynamics simulation data on a smaller protein in the same solvent. The observed timescale-dependence of the mean-square displacement rules out an interpretation of the present molecular dynamics or neutron experimental results based solely on the “equilibrium” model. However, the analysis does not rule out a combination of the frequency-window and equilibrium models in which the transition involves both barrier crossing and populating of higher energy states. Indeed, it is highly unlikely that the minima of a protein free energy landscape are equienergetic, as is required for a pure frequency-window scenario. Allowing the equilibrium dynamics to vary (by allowing A0 to vary as in Fig. 2) led to a fit to the simulation-derived I(Q, t) (not shown) that is as good as, but not better, than that achieved with the frequency-window model. Moreover, some experimental work on proteins has not produced clear evidence for resolution-dependent transition temperatures, although the difference in resolution of the instruments used may not have been sufficient to detect an effect (Réat et al., 1997; Doster and Settles, 1999).
Work remains to be done to tease apart the equilibrium and frequency-window contributions to the temperature-dependence of atomic fluctuations in proteins and their surrounding solvent, as observed using neutron scattering. One way of doing this is to use single instruments with variable elastic resolution that can then effectively access I(Q, t) at different times (Doster et al., 2001). Alternatively, different instruments with different elastic resolutions can be used, as in Fig. 6. Varying the elastic resolution is a procedure akin to examining molecular dynamics simulations on different timescales. Extending molecular dynamics timescales and improving instrumental energy resolutions (by, for example, using the spin-echo technique; Bellissent-Funel et al., 1998; Dellerue et al., 2000) will also be important in this regard, as will be experiments with techniques sensitive to longer timescales, such as Mössbauer absorption and nuclear magnetic resonance relaxation (Parak, 2003).
Although spectroscopic techniques are time-resolved, x-ray scattering, in principle, accesses the converged mean-square displacement, 〈Δr2〉Conv. If the frequency-window model holds, there should be no transition due to internal protein dynamics observable in x-ray B-factors. Extraction of protein mean-square displacements via x-ray scattering is hampered by the fact that crystallographic B-factors cannot distinguish between dynamic and static contributions to 〈Δr2〉 (Frauenfelder et al., 1979). Notwithstanding, there is presently an enthralling debate as to whether x-ray crystal diffraction does indeed detect a temperature-dependent transition in internal protein dynamics (Teeter et al., 2001; Chong et al., 2001; Joti et al., 2002; Halle, 2004). A transition in crystalline crambin has been reported (Teeter et al., 2001), although x-ray crystallographic evidence for the absence of a dynamical transition in internal displacements in myoglobin has also been presented (Chong et al., 2001; Joti et al., 2002).
Finally, we wish to comment on the relationship of the temperature-dependence of protein dynamics to solvation and activity. In Daniel et al. (1998) and Dunn et al. (2000) it was found that enzyme activity does not show deviation from Arrhenius behavior down to 180 K, although a transition of the dynamics on the picosecond timescale was seen at ∼220 K. A publication by Fenimore et al. (2002) states that “the correct conclusion from the work in Daniel et al. (1998) and Dunn et al. (2000) is the opposite to what is claimed, namely that solvent fluctuations activate substate transitions and thus enzymatic reactions to <180 K.”
In Daniel et al. (1998) and Dunn et al. (2000) it is neither stated nor implied that solvent fluctuations do not activate substate transitions nor that solvent fluctuations do not activate enzymatic reactions. However, two interesting questions may be asked in this context: 1), whether the dynamical transitions are solvent-activated; and 2), whether dynamical transitions exist in the protein solution that are not activity-related.
Although the role of solvent was not investigated in Daniel et al. (1999, 1998) and Dunn et al. (2000), this role has been investigated recently by several groups. In neutron experiments on xylanase in different cryosolvents it was found that the solvent has a strong effect on the measured transition temperature, i.e., the protein dynamics indeed follows closely that of the pure solvent (Réat et al., 2000). Furthermore, recent simulation work has indicated that the transition is driven by the onset of translational diffusion of the hydration water (Tarek and Tobias, 2002; Tournier et al., 2003), and that the dynamics activated on the ∼10−11 s timescale can be described using a small number of principal components describing collective motions in the protein (Tournier and Smith, 2003).
In the experimental data in Fig. 6 several transitions can be observed. The mean-square displacement as measured by the instrument IN6 shows a transition at ∼220 K. For the IN16 data at least two transitions are seen—a nonlinear increase in 〈Δr2〉exp at ∼150 K and a leveling-off at ∼220 K. The absence of a measurable deviation of activity from Arrhenius behavior down to 180 K suggests that neither the increase of 〈Δr2〉exp as seen with the instrument IN6 nor the leveling-off seen with IN16 are related to enzyme activity. Since the enzyme activity can be measured down to only 180 K the relationship of the ∼150 K transition to enzyme activity cannot be addressed. However, it is interesting to consider this relationship in the framework of the frequency-window model. In the equilibrium scenario new, possibly functionally required, types of motions are activated at the transition temperature. In the frequency-window scenario, however, there are no new types of motions activated; i.e., the dynamics does not change qualitatively, but just becomes faster with temperature. As all motions are always present at all temperatures, it is not possible to use temperature to eliminate or activate functionally important dynamics from the system concerned. In the frequency-window scenario, since the transition temperature, T0, is instrument-dependent, no correlation between T0 and activity should be expected. However, the absence of a correlation between T0 and activity cannot be used to conclude that the displacements moving into the resolution window of any given instrument are not required for function. A challenge for the future is to understand the temperature-dependence of protein dynamics in the framework of the equilibrium and frequency-window descriptions, and in the context of typical timescales for protein activity.
References
- Becker, T., and J. C. Smith. 2003. Energy resolution and dynamical heterogeneity effects on elastic neutron scattering from molecular systems. Phys. Rev. E. 67:021904. [DOI] [PubMed] [Google Scholar]
- Bee, M. 1988. Quasielastic Neutron Scattering: Principles and Applications in Solid-State Chemistry, Biology and Materials Science. Hilger, Bristol, UK.
- Bellissent-Funel, M.-C., R. Daniel, D. Durand, M. Ferrand, J. Finney, S. Pouget, V. Réat, and J. C. Smith. 1998. Nanosecond protein dynamics: first detection of a neutron incoherent spin-echo signal. J. Am. Chem. Soc. 120:7347–7348. [Google Scholar]
- Brooks, B. R., R. E. Bruccoleri, B. D. Olafson, D. J. States, S. Swaminathan, and M. Karplus. 1983. CHARMM. J. Comput. Chem. 4:187–217. [Google Scholar]
- Chong, S.-H., Y. Joti, A. Kidera, N. Go, A. Ostermann, A. Gassmann, and F. Parak. 2001. Dynamical transition of myoglobin in a crystal: comparative studies of x-ray crystallography and Mössbauer spectroscopy. Eur. Biophys. J. 30:319–329. [DOI] [PubMed] [Google Scholar]
- Cohen, S., E. Bauminger, I. Nowik, S. Ofer, and J. Yariv. 1981. Dynamics of the iron-containing core in crystals of the iron-storage protein, ferritin, through Mössbauer spectroscopy. Phys. Rev. Lett. 46:1244–1248. [Google Scholar]
- Daniel, R., J. Finney, V. Réat, R. Dunn, M. Ferrand, and J. C. Smith. 1999. Enzyme dynamics and activity: timescale dependence of dynamical transitions in glutamate dehydrogenase solution. Biophys. J. 77:2184–2190. [DOI] [PMC free article] [PubMed] [Google Scholar]
- Daniel, R., J. Finney, and J. C. Smith. 2003. The dynamical transition in proteins may have a simple explanation. Faraday Discuss. 122:163–169. [DOI] [PubMed] [Google Scholar]
- Daniel, R., J. C. Smith, M. Ferrand, S. Hery, R. Dunn, and J. Finney. 1998. Enzyme activity below the dynamical transition at 220 K. Biophys. J. 75:2504–2507. [DOI] [PMC free article] [PubMed] [Google Scholar]
- Dellerue, S., A. Petrescu, J. C. Smith, S. Longeville, and M.-C. Bellisent-Funel. 2000. Collective dynamics of a photosynthetic protein probed by neutron spin-echo spectroscopy and molecular dynamics simulation. Phys. B. 276–278:514–515. [Google Scholar]
- Ding, X., B. Rasmussen, G. A. Petesko, and D. Ringe. 1994. Direct structural observation of an acyl-enzyme intermediate in the hydrolysis of an ester substrate by elastase. Biochemistry. 33:9285–9293. [PubMed] [Google Scholar]
- Doster, W., S. Cusack, and W. Petry. 1989. Dynamical transition of myoglobin revealed by inelastic neutron scattering. Nature. 337:754–756. [DOI] [PubMed] [Google Scholar]
- Doster, W., M. Diehl, W. Petry, and M. Ferrand. 2001. Elastic resolution spectroscopy: a method to study molecular motions in small biological samples. Phys. B. 301:65–68. [Google Scholar]
- Doster, W., and M. Settles. 1999. The dynamical transition in proteins: the role of hydrogen bonds. In Hydration Processes in Biology, NATO Science Series: Life Sciences, Vol. 305. M. C. Bellisent-Funel and J. Teixera, editors. IOS Press, Amsterdam, The Netherlands.
- Dunn, R. V., V. Réat, J. Finney, M. Ferrand, J. C. Smith, and R. Daniel. 2000. Enzyme activity and dynamics: xylanase activity in the absence of fast anharmonic dynamics. Biochem. J. 346:355–358. [PMC free article] [PubMed] [Google Scholar]
- Elber, R., and M. Karplus. 1987. Multiple conformational states of proteins: a molecular dynamics analysis of myoglobin. Science. 235:318–321. [DOI] [PubMed] [Google Scholar]
- Fenimore, P. W., H. Frauenfelder, B. H. McMahon, and F. Parak. 2002. Slaving: solvent fluctuations dominate protein dynamics and functions. Proc. Natl. Acad. Sci. USA. 99:16047–16051. [DOI] [PMC free article] [PubMed] [Google Scholar]
- Ferrand, M., A. J. Dianoux, W. Petry, and G. Zaccai. 1993. Thermal motions and function of bacteriorhodopsin in purple membranes: effects of temperature and hydration studied by neutron scattering. Proc. Natl. Acad. Sci. USA. 90:9668–9672. [DOI] [PMC free article] [PubMed] [Google Scholar]
- Fitter, J., R. E. Lechner, and N. A. Dencher. 1997. Picosecond molecular motions in bacteriorhodopsin from neutron scattering. Biophys. J. 73:2126–2137. [DOI] [PMC free article] [PubMed] [Google Scholar]
- Frauenfelder, H., G. Petsko, and D. Tsernoglou. 1979. Temperature-dependent x-ray diffraction as a probe of protein structural dynamics. Nature. 280:558–563. [DOI] [PubMed] [Google Scholar]
- Frauenfelder, H., S. Sligar, and P. Wolynes. 1991. The energy landscapes and motions of proteins. Science. 254:1598–1603. [DOI] [PubMed] [Google Scholar]
- Halle, B. 2004. Biomolecular cryocrystallography: structural changes during flash-cooling. Proc. Natl. Acad. Sci. USA. 101:4793–4798. [DOI] [PMC free article] [PubMed] [Google Scholar]
- Hayward, J. A., J. L. Finney, R. M. Daniel, and J. C. Smith. 2003. Molecular dynamics decomposition of temperature-dependent elastic neutron scattering by a protein solution. Biophys. J. 85:679–685. [DOI] [PMC free article] [PubMed] [Google Scholar]
- Joti, Y., M. Nakasako, A. Kidera, and N. Go. 2002. Nonlinear temperature dependence of the crystal structure of lysozyme: correlation between coordinate shifts and thermal factors. Acta Crystallogr. D. 58:1421–1432. [DOI] [PubMed] [Google Scholar]
- Keller, H., and P. Debrunner. 1980. Evidence for conformational and diffusional mean-square displacements in frozen aqueous solution of oxymyoglobin. Phys. Rev. Lett. 45:68–71. [Google Scholar]
- Knapp, E., S. Fischer, and F. Parak. 1982. Protein dynamics from Mössbauer spectra: the temperature dependence. J. Phys. Chem. 86:5042–5047. [Google Scholar]
- Kneller, G., and J. C. Smith. 1994. Liquid-like side-chain dynamics in myoglobin. J. Mol. Biol. 242:181–185. [DOI] [PubMed] [Google Scholar]
- Kneller, G. R., V. Keiner, M. Kneller, and M. Schiller. 1995. nMOLDYN: a program package for a neutron scattering oriented analysis of molecular dynamics simulations. Comp. Phys. Com. 91:191–214. [DOI] [PubMed] [Google Scholar]
- Lamy, A. V., M. Souaille, and J. C. Smith. 1996. Simulation evidence for experimentally detectable low-temperature vibrational inhomogeneity in a globular protein. Biopolymers. 39:471–478. [Google Scholar]
- Lehnert, U., V. Réat, M. Weik, G. Zaccai, and C. Pfister. 1998. Thermal motions in bacteriorhodopsin at different hydration levels studied by neutron scattering: correlation with kinetics and light-induced conformational changes. Biophys. J. 75:1945–1952. [DOI] [PMC free article] [PubMed] [Google Scholar]
- Lovesey, S. 1987. Theory of Neutron Scattering from Condensed Matter, Vol. 1. Oxford University Press, Oxford, UK.
- Mackerell, A. D., D. Bashford, M. Bellot, J. R. Dunbrack, R. L. Evenseck, M. J. Field, S. Fischer, J. Gao, H. Guo, S. Ha, D. Joseph, L. Kuchnir, K. Kuczera, F. T. K. Lau, C. Mattos, S. Michnick, T. Ngo, D. T. Nguyen, B. Prodhom, I. W. E. Reiher, B. Roux, M. Schlenkrich, J. C. Smith, R. Stote, J. Straub, M. Watanabe, J. Wiorkiewicz-Kuczera, J. Yin, and M. Karplus. 1998. All-atom empirical potential for molecular modelling and dynamics studies of proteins. J. Phys. Chem. B. 102:3586–3616. [DOI] [PubMed] [Google Scholar]
- Parak, F. 2003. Physical aspects of protein dynamics. Rep. Prog. Phys. 66:103–129. [Google Scholar]
- Rahman, A. 1963. Intermediate scattering function in slow neutron scattering. Phys. Rev. 130:1334–1336. [Google Scholar]
- Rasmussen, B., A. Stock, D. Ringe, and G. A. Petsko. 1992. Crystalline ribonuclease-a loses function below the dynamical transition at 220K. Nature. 357:423–424. [DOI] [PubMed] [Google Scholar]
- Réat, V., R. Dunn, M. Ferrand, J. Finney, R. Daniel, and J. C. Smith. 2000. Solvent dependence of dynamic transitions in protein solutions. Proc. Natl. Acad. Sci. USA. 97:9961–9966. [DOI] [PMC free article] [PubMed] [Google Scholar]
- Réat, V., G. Zaccai, M. Ferrand, and C. Pfister. 1997. Functional dynamics in purple membrane. In Biological Macromolecular Dynamics. Adenine Press, Schenectady, NY. 117–122.
- Tarek, M., and D. J. Tobias. 2002. Role of protein-water hydrogen bond dynamics in the protein dynamical transition. Phys. Rev. Lett. 88:138101. [DOI] [PubMed] [Google Scholar]
- Teeter, M., A. Yamano, B. Stec, and U. Mohanty. 2001. On the nature of a glassy state of matter in a hydrated protein: relation to protein function. Proc. Natl. Acad. Sci. USA. 98:11242–11247. [DOI] [PMC free article] [PubMed] [Google Scholar]
- Tournier, A., J. Xu, and J. C. Smith. 2003. Translational hydration water dynamics drives the protein glass transition. Biophys. J. 85:1871–1875. [DOI] [PMC free article] [PubMed] [Google Scholar]
- Tournier, A. L., and J. C. Smith. 2003. Principal components of the protein dynamical transition. Phys. Rev. Lett. 91:208106. [DOI] [PubMed] [Google Scholar]