Abstract
Proton exchange and nuclear magnetic resonance spectroscopy are being used to characterize the energetics of opening of AT/TA basepairs in the DNA dodecamer 5′-d(GCTATAAAAGGG)-3′/5′-d(CCCTTTTATAGC)-3′. The dodecamer contains the TATA box of the adenovirus major late promoter. The equilibrium constants for opening of each basepair are measured from the dependence of the exchange rates of imino protons on ammonia concentration. The enthalpy, entropy, and free energy changes in the opening reaction of each basepair are determined from the temperature dependence of the exchange rates. The results reveal that the opening enthalpy changes encompass a wide range of values, namely, from 17 to 29 kcal/mol. The largest values are observed for the AT basepairs in 7th and 8th positions. These values, and the exchange rates of the corresponding imino protons, suggest that these two basepairs open in a single concerted reaction. The enthalpy changes for opening of the central six basepairs are correlated to the opening entropy changes. This enthalpy-entropy compensation minimizes the variations in the opening free energies among these central basepairs. Deviations from the enthalpy-entropy compensation pattern are observed for basepairs located close to the ends of the duplex structure, suggesting a different mode of opening for these basepairs.
INTRODUCTION
The sequence of bases in DNA contains the chemical signature necessary for storing and expressing genetic information. In turn, the base sequence induces specific structural, energetic, and dynamic features that enhance the identity of a DNA site. Proteins and other ligands sample these features and use them to select the site for their binding. The correlates between base sequence and the flexibility of DNA have been the object of investigations by a multitude of approaches, including structural analysis of DNA and DNA-protein complexes (Gorin et al., 1995; Olson et al., 1998), molecular dynamics simulations (Beveridge and McConnell, 2000; Giudice and Lavery, 2002), and cyclization kinetics (Kahn et al., 1994). This work addresses this question by an investigation of the opening of DNA basepairs using proton exchange and nuclear magnetic resonance (NMR) spectroscopy. The opening of basepairs in DNA double helices is a prerequisite for propagation and expression of genetic information. Moreover, DNA basepairs often open to allow their chemical modification by enzymes, or to adjust to structural perturbations induced by binding of proteins. The combined use of proton exchange and NMR spectroscopy allows characterization of these processes at the level of individual basepairs (Gueron and Leroy, 1995; Russu, 2004).
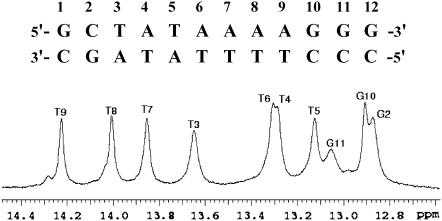
The DNA molecule investigated is shown in Fig. 1. The sequence of the central eight bases is the same as that of the TATA box in the adenovirus major late promoter (Kim and Burley, 1994). The sequence contains a juxtaposition of two distinct tracts of adenines and thymines, namely, a (TATA) tract in the 5′-half and a (AAAA) tract in the 3′-half. Thus, the dodecamer allows examination of opening of AT basepairs in various base-step configurations, within the same DNA molecule.
FIGURE 1.
The DNA dodecamer investigated and the NMR resonances of its imino protons (N1-H in guanine and N3-H in thymine) in 0.1 M NaCl, with 2 mM EDTA and 2 mM triethanolamine, in 90%H2O/10%D2O at pH 8.3 and at 15°C.
MATERIALS AND METHODS
DNA samples
The two strands of the DNA dodecamer were synthesized separately on a DNA synthesizer (Applied Biosystems, Foster City, CA) using solid-support phosphoramidite chemistry. They were purified by reverse-phase HPLC on a PRP-1 column (Hamilton, Reno, NV) in 50 mM triethylamine acetate buffer at pH 7 (with a gradient of 5–30% acetonitrile in 44 min). The counterions were replaced with Na+ ions by repeated centrifugation through Centricon YM-3 tubes (Amicon, Bedford, MA) using 0.5 M NaCl. This was followed by repeated centrifugation in the solvent used in NMR experiments, namely, 0.1 M NaCl with 2 mM EDTA at pH 8.0 (at 25°C). The DNA duplex was annealed by equilibrating the two oligonucleotides in a water bath at 80°C for 30 min, followed by slow cooling down. The DNA concentration in the sample used for NMR was 1.5 mM (duplex). The sample also contained 2 mM triethanolamine, which was used to determine the pH of the sample directly inside the NMR tube. This was done by measuring first the difference between the chemical shifts of the resonances of the two methylene groups of triethanolamine as a function of pH for a sample of 2 mM triethanolamine in 0.1 M NaCl with 2 mM EDTA. The measurements were carried out at each temperature of interest. These chemical shift versus pH calibration curves were then used to measure the pH of the DNA sample in each NMR experiment. For proton exchange measurements, increasing concentrations of ammonia were obtained by adding to the DNA sample small aliquots of stock ammonia solutions (0.5–5 M) in 0.1 M NaCl with 2 mM EDTA at pH 8.0. The final concentration of ammonia in the sample was measured by 14N NMR using a Varian VXR-400 NMR spectrometer operating at 9.4 T. The intensity of the 14N NMR resonance of ammonia was calibrated separately for a range of ammonia concentrations from 0.175 to 3 M (the highest ammonia concentration used in the NMR experiments). The concentration of the acceptor in imino proton exchange (i.e., ammonia base) was calculated at each temperature from the total ammonia concentration (C0) and the pH as:
 |
(1) |
where the pK value of ammonia at each temperature was used (Weast, 1987).
NMR experiments
The NMR experiments were performed on a Varian INOVA 500 spectrometer operating at 11.75 T. One-dimensional (1-D) NMR spectra were obtained using the Jump-and-Return pulse sequence (Plateau and Gueron, 1982). 1H-1H NOESY spectra were obtained at a mixing time of 100 ms using the WATERGATE-NOESY pulse sequence (Lippens et al., 1995). The proton exchange rates were measured by transfer of magnetization from water. The water proton resonance was selectively inverted using a Gaussian 180° pulse (5.8–8.1 ms). This was followed by a variable delay in which the transfer of magnetization occurs from water protons to DNA imino protons. To prevent the effects of radiation damping upon the recovery of water magnetization to equilibrium a weak gradient (0.21 G/cm) was applied during this exchange delay. At the end of the exchange delay, a second Gaussian pulse (1.7–2.7 ms) was applied to bring the water magnetization back to the oZ axis. The observation was with the Jump-and-Return pulse sequence. Twenty-five values of the exchange delay in the range from 2 to 900 ms were used in each experiment. The exchange rates were calculated from the dependence of the intensity of the imino proton resonance of interest on the exchange delay as we have described (Mihailescu and Russu, 2001; Powell et al., 2001).
Imino proton exchange in DNA
The exchange of DNA imino protons with solvent protons occurs via a structural opening reaction that brings the imino proton into an open state. In this state, the hydrogen bond holding the imino proton is transiently broken such that the proton can be transferred to proton acceptors present in solution (Englander and Kallenbach, 1984; Gueron et al., 1990). The exchange rate observed experimentally depends upon the kinetic parameters of the opening reaction as (Englander and Kallenbach, 1984):
 |
(2) |
where kop and kcl are the opening and the closing rate, respectively, and kex,open is the rate of exchange from the open state. The rate of exchange from the open state is proportional to the concentration of proton acceptor B (namely, ammonia base in this work):
 |
(3) |
where kB is the rate constant for proton transfer in isolated nucleotides, and α is a factor that accounts for differences in the rate of proton transfer between isolated nucleotides and open DNA basepairs, e. g., restricted accessibility of the proton acceptor to the imino proton in the open base. Previous investigations have shown that α is generally close to unity (Gueron et al., 1990). The rate constants kB for ammonia have been calculated previously and, for the temperatures studied in this work, they range from 3.9 × 10⁸ to 4.2 × 10⁸ M−1 s−1 for thymine, and from 9.6 × 10⁸ to 1.1 × 10⁹ M−1 s−1 for guanine (Moe and Russu, 1992).
Two kinetic regimes can be distinguished depending on how the rate of exchange from the open state compares with the rate of closing. The EX2 regime occurs when kex,open ≪ kcl. In this case, the observed rate of exchange is proportional to the concentration of proton acceptor B:
 |
(4) |
where Kop = kop/kcl is the equilibrium constant for opening of the base that contains the imino proton. When kex,open ≫ kcl (EX1 regime), the exchange occurs in each opening event and
 |
(5) |
RESULTS
The resonances of imino protons (N1-H in guanine and N3-H in thymine) of the DNA dodecamer investigated are shown in Fig. 1. The assignments of the resonances to individual protons in the structure were obtained by 1H-1H NOESY experiments, as illustrated in Fig. 2.
FIGURE 2.
Expanded region of the 1H-1H NOESY spectrum of the DNA dodecamer showing connectivities between imino protons. The experimental conditions are the same as in Figure 1.
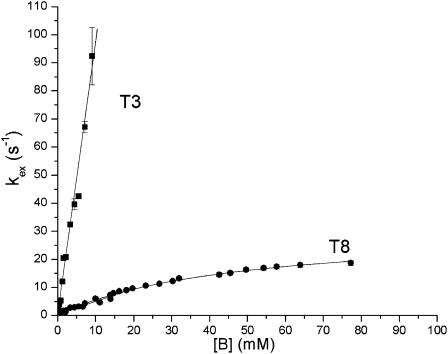
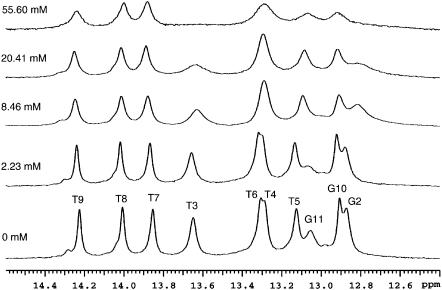
To characterize the processes of base-pair opening in the DNA dodecamer we have measured the exchange rate of each imino proton as a function of the concentration of ammonia base. The results are illustrated in Figs. 3 and 4. For several imino protons, such as that in T8 (Fig. 3), the dependence of the exchange rate on ammonia base concentration exhibits the hyperbolic form predicted by Eqs. 2 and 3 and, at high ammonia concentrations, the exchange approaches the EX1 regime. For other imino protons, the EX1 regime of exchange could not be reached for two reasons. First, for several imino protons the exchange rates increase rapidly with ammonia concentration. An example is the imino proton in T3 (Fig. 3). Due to the high exchange rate, the resonance of this proton is greatly broadened even at relatively low ammonia concentrations (e.g., 20 mM; Fig. 4), thus preventing exchange measurements in the EX1 regime. Second, several imino proton resonances shift slightly and overlap other resonances upon increasing ammonia concentration. Examples of these resonances are those from T4 and T6 in Fig. 4.
FIGURE 3.
Dependence of the exchange rate of imino protons in T8 and T3 on ammonia base concentration, [B], at 15°C. The exchange rates for T8 were fitted to Eq. 2 (with kex,open expressed as in Eq. 3) and those for T3 to Eq. 4. For most of the experimental points shown the errors are smaller than the symbols.
FIGURE 4.
Imino proton resonances of the DNA dodecamer at various ammonia concentrations at 15°C. The concentration of ammonia base for each spectrum is indicated on the left.
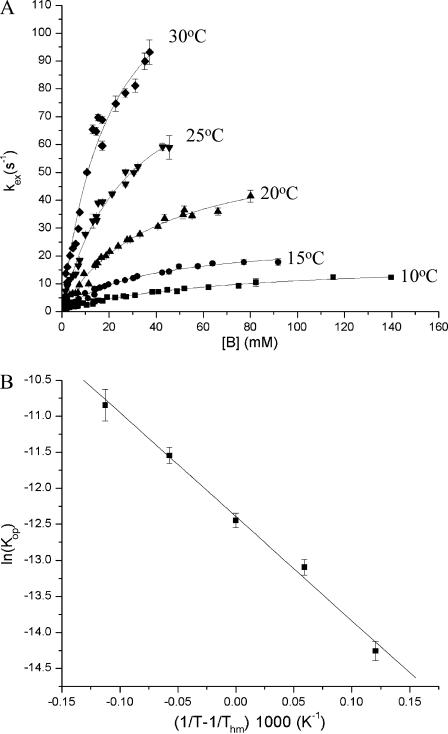
The exchange rate measurements were carried out at five temperatures in the range from 10 to 30°C. An illustration of the dependence of the exchange curves on temperature is shown in Fig. 5 A for the imino proton in T7.
FIGURE 5.
Illustration of the dependence of the exchange rates and opening equilibrium constants on temperature. (A) The exchange rate of T7 imino proton as a function of ammonia base concentration at all temperatures investigated. The curves represent nonlinear least-squares fits to Eq. 2 (with kex,open expressed as in Eq. 3). (B) Temperature dependence of the equilibrium constant for opening of AT7 basepair. The line represents a fit to Eq. 6.
The equilibrium constant for the opening reaction of each basepair, Kop, was obtained by fitting the exchange rate as a function of ammonia base concentration to Eq. 2 (with kex,open expressed as in Eq. 3) or to Eq. 4. The rate constant kB for transfer of the imino proton from thymine or guanine to ammonia base at each temperature was used (Moe and Russu, 1992), and the factor α was assumed to be independent of temperature (α = 1). Representative Kop values are shown in Fig. 6 A. Only the central eight basepairs of the dodecamer are included in the figure. For the other four basepairs, the exchange of imino protons is very fast due to fraying at the ends of the structure, and the Kop values could not be measured accurately.
FIGURE 6.
Opening equilibrium constants at 15°C (panel A) and opening enthalpy changes (panel B) for the central basepairs in the DNA dodecamer.
The energetic parameters of the opening reaction for each basepair were obtained from the dependence of the equilibrium constant on temperature using the M-linear regression algorithm introduced by Krug and co-workers (Krug et al., 1976). The experimental data were fitted to the following modified van't Hoff equation (Fig. 5 B):
 |
(6) |
where Thm is the harmonic mean of the experimental temperatures (293 K), ΔHop and ΔGop are the enthalpy and free energy changes in the opening reaction, and R is the universal gas constant. The use of this equation ensures that the obtained values of the thermodynamic parameters ΔHop and ΔGop (Thm) are free of statistical compensation effects (Krug et al., 1976). The values of the opening enthalpy changes for the central eight basepairs in the dodecamer are summarized in Fig. 6 B and are compared to the values of the free energy changes in Fig. 8.
FIGURE 8.
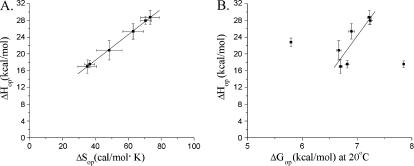
(A) Correlation between enthalpy and entropy changes for opening of the central basepairs in the DNA dodecamer. The slope of the fitted line corresponds to a compensation temperature Tc = (306 ± 4) K. (B) Correlation between opening free energy changes at Thm (20°C) and opening enthalpy changes. The fitted line corresponds to the equation ΔHop= −(100 ± 34) + (18 ± 5) × ΔGop with a correlation coefficient of 0.87.
DISCUSSION
The results obtained in this work reveal that the energetic parameters of the opening reaction vary among different AT/TA basepairs in the dodecamer. For the opening equilibrium constants the largest value is observed for TA3, e.g., Kop = (2.4 ± 0.1) × 10−5 at 15°C (Fig. 6 A). This large value explains the high exchange rates observed for the T3 imino proton (Fig. 3). For the other basepairs in the TATA half of the dodecamer the opening equilibrium constants are ∼5-fold smaller, e.g., (4.4 ± 0.2) × 10−6 for TA5. A further decrease (two- to threefold) is observed for the remaining basepairs (AT7 through GC10).
Insight into the energetic origin of these differences is provided by the opening enthalpy changes measured for each basepair. As shown in Fig. 6 B, the ΔHop values vary by more than 10 kcal/mol among different AT/TA basepairs. For the basepairs in the center of the TATA box, AT4 and TA5, the values are the lowest, i.e., 17 ± 2 and 17.5 ± 0.9 kcal/mol, respectively. The highest enthalpy changes for opening are observed for AT7 and AT8, i.e., 29 ± 2 and 28 ± 1 kcal/mol, respectively. For comparison, the enthalpy changes for opening of AT/TA basepairs in various DNA duplexes, which have been reported to date, range from 14 to 21 kcal/mol (Moe and Russu, 1992; Folta-Stogniew and Russu, 1994; Moe et al., 1995). These previous determinations encompass a variety of sequence contexts for AT/TA basepairs such as those in the duplexes d(CGCGAATTCGCG)2, d(CGCAGATCTGCG)2, d(CGCAAATTTGCG)2, and d(CGCACATGTGCG)2. Hence, compared to these and previous results, the enthalpy changes for opening of AT7 and AT8 basepairs are anomalously high.
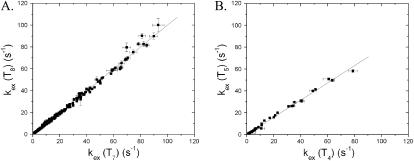
An explanation for the increased ΔHop values of AT7 and AT8 is suggested by the observation that the exchange rate of the imino proton in T7 is the same as that of the proton in T8. This observation is presented in Fig. 7 A which includes the exchange rates of the two protons measured in this work at all ammonia concentrations and at all temperatures. It is clear that, under these wide ranges of experimental conditions, the exchange rates of the two protons remain the same. This observation differs from the general observation that, in double-helical DNA, the exchange of imino protons in adjacent basepairs occurs at different rates (Leroy et al., 1988; Gueron et al., 1990; Moe and Russu, 1990; Folta-Stogniew and Russu, 1994; Moe et al., 1995). Different exchange rates have been observed even when the 5′- and 3′-neighbors of each base are the same. This fact is illustrated in Fig. 7 B by a comparison of the exchange rates of the imino protons in T4 and T5. One notes that, although the 5′- and 3′-neighbors of T4 are the same as those of T5, the exchange rates of the two protons are different over the entire range of experimental conditions investigated.
FIGURE 7.
Comparison of the exchange rates of imino protons in AT7 and AT8 (panel A), and in AT4 and TA5 (panel B), at all ammonia concentrations and all temperatures investigated. In panel A, the slope of the fitted line is 1.004 ± 0.005, and the correlation coefficient of the linear fit is 0.99. In panel B, the slope of the fitted line is 0.78 ± 0.01 and correlation coefficient of the linear fit is 0.99.
The current model for imino proton exchange in DNA duplexes postulates that basepairs open one at a time, independently of the opening of their neighbors (Gueron and Leroy, 1995). This postulate has been made on the basis of the general observation that imino protons in adjacent basepairs exchange with different rates. The identity of the exchange rates observed here for AT7 and AT8 suggests that, in this case, the exchange occurs in a single opening event, possibly by the concerted opening of the two basepairs. Such concerted opening should have a higher enthalpic cost, thus explaining the high enthalpy values observed for AT7 and AT8. This suggestion is supported by recent molecular dynamics simulations in which energetic coupling between opening of neighboring basepairs has been observed (Giudice et al., 2003). The molecular basis for this special behavior of AT7 and AT8 basepairs is not clear. In the dodecamer investigated the two basepairs belong to a tract of four AT basepairs (henceforth labeled A4). Previous investigations have shown that the rates of opening of AT basepairs in An and AnTm tracts are slow when n or n + m ≥ 4 (Leroy et al., 1988; Moe and Russu, 1990). However, different rates of exchange have been observed for imino protons of neighboring AT basepairs within the tract, at ammonia concentrations comparable to those investigated here. Moreover, the ΔHop values for opening of basepairs within the tract are in the range observed for other base sequence contexts in DNA. For example, in the DNA duplex d(CGCAAATTTGCG)2, which contains a A3T3 tract, the ΔHop values for opening of the AT basepairs are all around 20 kcal/mol (Moe et al., 1995). These observations suggest that the unique exchange properties and opening enthalpy changes that we observed for AT7 and AT8 in the dodecamer investigated do not result from the participation of these basepairs in the A4 tract. Instead, they probably represent a special dynamic feature, which is induced in the tract by the juxtaposition of the TATA sequence next to it. The influence of the TATA sequence on the A4 tract has been observed in molecular dynamics simulations of TATA-box DNA (Flatters et al., 1997; Pastor et al., 1997). The simulations show that the tract assumes a structure similar to that of canonical A-form. The first adenines in the tract exhibit an enhanced tendency toward C3′-endo sugar puckering, and the helix axis is strongly bent. Such conformational changes may alter the opening pathways of basepairs in the tract, as suggested here for AT7 and AT8.
Another interesting aspect of our results is the relationship between the equilibrium constants for base-pair opening and the enthalpic costs in the opening reactions. The opening enthalpy changes vary among different basepairs by more than 10 kcal/mol (Fig. 6 B). In contrast, the equilibrium constants for opening (Fig. 6 A) are distributed within a much narrower range of values; their variations are <15-fold, corresponding to variations in the free energy of opening of <1.5 kcal/mol (at 15°C). Such behavior is indicative of the presence of enthalpy-entropy compensation in these opening processes (Lumry and Rajender, 1970).
Enthalpy-entropy compensation is generally expressed by the linear relationship between entropy and enthalpy changes (Lumry and Rajender, 1970). We have calculated the entropy changes in the opening of each basepair as:
 |
(7) |
where the ΔHop and ΔGop(Thm) values were obtained as described above (Eq. 6). The plot of the ΔHop values versus the obtained ΔSop values (Fig. 8 A) is linear with a slope corresponding to a compensation temperature Tc = (306 ± 4) K (Lumry and Rajender, 1970). An alternative way to express enthalpy-entropy compensation is the relationship between ΔHop and ΔGop(Thm) (Fig. 8 B). As demonstrated by other groups, this kind of analysis is free of statistical effects and provides strong evidence for the existence of chemical/structural compensation effects (Krug et al., 1976; Sharp, 2001). The linear correlation between ΔHop and ΔGop(Thm) is observed for the majority of the basepairs in the dodecamer (Fig. 8 B). The two points that deviate from the predicted linear dependence correspond to basepairs TA3 and GC10. Both basepairs are situated two positions away from the ends of the structure. In these locations, fraying at the ends of the duplex may influence the exchange of the T3 and G10 imino protons. As shown by other laboratories, fraying affects the parameters of the opening reactions, e.g., the accessibility factor α in Eq. 3 (Nonin et al., 1995). The results in Fig. 8 B support these previous findings, and suggest that the pathways and/or the energetics of opening of the TA3 and GC10 basepairs differ from those of the central basepairs in the dodecamer.
Enthalpy-entropy compensation in nucleic acids has been previously observed in the melting of double- and single-helical structures (Searle and Williams, 1993; Petruska and Goodman, 1995) and in the binding of drugs to DNA (Marky and Breslauer, 1987; Qu et al., 2003). Our results show that the same compensation exists in the conformational fluctuations of each basepair that yield the open state responsible for imino proton exchange. The compensation could reflect the involvement of water in the opening reactions (Marky and Kupke, 2000). Recent molecular dynamics simulations (Giudice et al., 2003) support participation of water in base-pair opening. The simulations show that the conformational rearrangements of the DNA that occur in the opening reaction perturb the hydration water and several new water-binding sites form between the open bases. The observed enthalpy-entropy compensation could also result from properties that are intrinsic to the structure and structural stability of DNA double helices. For example, molecular dynamics simulations reveal that, upon opening of a basepair, the conformational freedom of the phosphate-sugar backbone increases (Giudice et al., 2003). The entropy changes associated with this increase could be compensated by the endothermic cost of removing a base from its helical stack. A similar mechanism has been proposed for the compensation observed in the melting of DNA and RNA helices (Searle and Williams, 1993). Regardless of its exact origins, the enthalpy-entropy compensation in base-pair opening has an important consequence for the structural integrity of the DNA molecule. As a result of the compensation, the variations of the free energies of opening among different basepairs are minimized. This ensures that no basepair in the DNA double helix, regardless of its sequence context, acquires a very high thermodynamic propensity for opening.
The DNA dodecamer investigated contains the TATA box of the adenovirus major late promoter (i.e., 5′-TATAAAAG-3′). The structure of this DNA in complex with TATA-box binding protein (TBP) from Arabidopsis thaliana has been solved at 1.9 Å resolution by Burley and co-workers (Kim and Burley, 1994). The protein consists of two pseudosymmetrical domains of nearly identical amino acid sequence and structure. In spite of the high similarities between the domains, the binding of the protein to DNA is directional, namely, the C-terminal domain binds to the 5′-half of the TATA box and the N-terminal domain to the other half. Binding of the protein induces large conformational changes in DNA. Two kinks (45°) are introduced by insertion of pairs of phenylalanine residues at the first TpA step and at the ApG step. Throughout the box, the DNA unwinds by a total of 105°. The reduced twist is coupled with base-pair roll at each step yielding an overall 80° bend of the helix axis. Due to these large protein-induced deformations in the DNA, the TBP protein has been a paradigm for the indirect read-out mechanism in protein-DNA recognition (Kim and Burley, 1994; Juo et al., 1996).
The TBP-induced deformations of the DNA are clearly much more complex than the base-pair opening reactions investigated here. Nevertheless, one expects the enthalpy changes for base-pair opening to be related to the enthalpic costs of those protein-induced conformational changes that involve perturbations of inter-base hydrogen bonds and/or helical base-stacking interactions. Along these lines, our results show that the TATA box DNA has an intrinsic energetic asymmetry: the enthalpy changes for opening basepairs in the TATA half of the box are much lower than those in the other half (Fig. 6 B). This asymmetry may contribute to the binding directionality of TBP by making the C-terminal domain of the protein interact first with the TATA sequence (Kim and Burley, 1994).
In summary, the results presented in this work demonstrate that the opening reactions of AT/TA basepairs in TATA-box DNA strongly depend on the location and the sequence context of each basepair. This dependence affects the enthalpy and entropy changes that occur in base-pair opening, while maintaining the opening free energy changes at fairly constant values. The location of the AT/TA basepair in the structure may also affect the nature of the molecular fluctuations that yield the open state. A complete description of these sequence- and position-induced dependencies awaits future investigations of AT/TA basepairs in other DNA molecules, alone or in complexes with ligands. These investigations are in progress in our laboratory.
Acknowledgments
This work was supported by a grant from the National Institutes of Health (GM65159).
References
- Beveridge, D. L., and K. J. McConnell. 2000. Nucleic acids: theory and computer simulations, Y2K. Curr. Opin. Struct. Biol. 10:182–196. [DOI] [PubMed] [Google Scholar]
- Englander, S. W., and N. R. Kallenbach. 1984. Hydrogen exchange and structural dynamics of proteins and nucleic acids. Q. Rev. Biophys. 16:521–655. [DOI] [PubMed] [Google Scholar]
- Flatters, D., M. Young, D. L. Beveridge, and R. Lavery. 1997. Conformational properties of the TATA-box binding sequence of DNA. J. Biomol. Struct. Dyn. 14:757–765. [DOI] [PubMed] [Google Scholar]
- Folta-Stogniew, E. J., and I. M. Russu. 1994. Sequence dependence of base-pair opening in a DNA dodecamer containing the CACA/GTGT sequence motif. Biochemistry. 33:11016–11024. [DOI] [PubMed] [Google Scholar]
- Giudice, E., and R. Lavery. 2002. Simulations of nucleic acids and their complexes. Acc. Chem. Res. 35:350–357. [DOI] [PubMed] [Google Scholar]
- Giudice, E., P. Varnai, and R. Lavery. 2003. Basepair opening within B-DNA: free energy pathways for GC and AT pairs from umbrella sampling simulations. Nucleic Acids Res. 31:1434–1443. [DOI] [PMC free article] [PubMed] [Google Scholar]
- Gorin, A. A., V. B. Zhurkin, and W. K. Olson. 1995. B-DNA twisting correlates with base-pair morphology. J. Mol. Biol. 247:34–48. [DOI] [PubMed] [Google Scholar]
- Gueron, M., E. Charretier, J. Hagerhorst, M. Kochoyan, J. L. Leroy, and A. Moraillon. 1990. Applications of Imino Proton Exchange to Nucleic Acid Kinetics and Structures. In Structure & Methods. R.H. Sarma and M. H. Sarma, editors. Adenine Press, Schenectady, NY. 113–137.
- Gueron, M., and J. L. Leroy. 1995. Studies of base pair kinetics by NMR measurement of proton exchange. Methods Enzymol. 261:383–413. [DOI] [PubMed] [Google Scholar]
- Juo, Z., T. K. Chiu, P. M. Leiberman, I. Baikalov, A. J. Berk, and R. E. Dickerson. 1996. How do proteins recognize the TATA box? J. Mol. Biol. 261:239–254. [DOI] [PubMed] [Google Scholar]
- Kahn, J. D., E. Yun, and D. M. Crothers. 1994. Detection of localized DNA flexibility. Nature. 368:163–166. [DOI] [PubMed] [Google Scholar]
- Kim, J. L., and S. K. Burley. 1994. 1.9 Å resolution refined structure of TBP recognizing the minor groove of TATAAAAG. Nat. Struct. Biol. 1:638–653. [DOI] [PubMed] [Google Scholar]
- Krug, R. R., W. G. Hunter, and R. A. Grieger. 1976. Enthalpy-entropy compensation. 2. separation of the chemical from the statistical effect. J. Phys. Chem. 80:2341–2351. [Google Scholar]
- Leroy, J. L., E. Charretier, M. Kochoyan, and M. Gueron. 1988. Evidence from base-pair kinetics for two types of adenine tract structures in solution: their relation to DNA curvature. Biochemistry. 27:8894–8898. [DOI] [PubMed] [Google Scholar]
- Lippens, G., C. Dhalluin, and J.-M. Wieruszeski. 1995. Use of a water flip-back pulse in the homonuclear NOESY experiment. J. Biomol. NMR. 5:327–331. [DOI] [PubMed] [Google Scholar]
- Lumry, R., and S. Rajender. 1970. Enthalpy-entropy compensation phenomena in water solutions of proteins and small molecules: A ubiquitous property of water. Biopolymers. 9:1125–1227. [DOI] [PubMed] [Google Scholar]
- Marky, L. A., and K. J. Breslauer. 1987. Origins of netropsin binding affinity and specificity: Correlations of thermodynamic and structural data. Proc. Natl. Acad. Sci. USA. 84:4359–4363. [DOI] [PMC free article] [PubMed] [Google Scholar]
- Marky, L. A., and D. W. Kupke. 2000. Enthalpy-entropy compensations in nucleic acids: Contribution of electrostriction and structural hydration. Methods Enzymol. 323:419–441. [DOI] [PubMed] [Google Scholar]
- Mihailescu, M. R., and I. M. Russu. 2001. A signature of the T→R transition in human hemoglobin. Proc. Natl. Acad. Sci. USA. 98:3773–3777. [DOI] [PMC free article] [PubMed] [Google Scholar]
- Moe, J. G., E. Folta-Stogniew, and I. M. Russu. 1995. Energetics of base-pair opening in a DNA dodecamer containing an A3T3 tract. Nucleic Acids Res. 23:1984–1989. [DOI] [PMC free article] [PubMed] [Google Scholar]
- Moe, J. G., and I. M. Russu. 1990. Proton exchange and base pair opening kinetics in 5′- d (CGCAAATTTGCG)-3′ and related dodecamers. Nucleic Acids Res. 18:821–827. [DOI] [PMC free article] [PubMed] [Google Scholar]
- Moe, J. G., and I. M. Russu. 1992. Kinetics and energetics of base-pair opening in 5′- d(CGCGAATTCGCG)-3′ and a substituted dodecamer containing G·T mismatches. Biochemistry. 31:8421–8428. [DOI] [PubMed] [Google Scholar]
- Nonin, S., J.-L. Leroy, and M. Gueron. 1995. Terminal base pairs of oligodeoxynucleotides: Imino proton exchange and fraying. Biochemistry. 34:10652–10659. [DOI] [PubMed] [Google Scholar]
- Olson, W. K., A. A. Gorin, X. J. Lu, L. M. Hock, and V. B. Zhurkin. 1998. DNA sequence-dependent deformability deduced from protein-DNA crystal complexes. Proc. Natl. Acad. Sci. USA. 95:11163–11168. [DOI] [PMC free article] [PubMed] [Google Scholar]
- Pastor, N., L. Pardo, and H. Weinstein. 1997. Does TATA matter? A structural exploration of the selectivity determinants in its complexes with TATA box-binding protein. Biophys. J. 73:640–652. [DOI] [PMC free article] [PubMed] [Google Scholar]
- Petruska, J., and M. F. Goodman. 1995. Enthalpy-entropy compensation in DNA melting thermodynamics. J. Biol. Chem. 270:746–750. [DOI] [PubMed] [Google Scholar]
- Plateau, P., and M. Gueron. 1982. Exchangeable proton NMR without base-line distortion, using new strong-pulse sequences. J. Am. Chem. Soc. 104:7310–7311. [Google Scholar]
- Powell, S. W., L. Jiang, and I. M. Russu. 2001. Proton exchange and base-pair opening in a DNA triple helix. Biochemistry. 40:11065–11072. [DOI] [PubMed] [Google Scholar]
- Qu, X., J. Ren, P. V. Riccelli, A. S. Benight, and J. B. Chaires. 2003. Enthalpy/entropy compensation: Influence of DNA flanking sequence on the binding of 7-amino actinomycin D to its primary binding site in short DNA duplexes. Biochemistry. 42:11960–11967. [DOI] [PubMed] [Google Scholar]
- Russu, I. M. 2004. Probing site-specific energetics in proteins and nucleic acids by hydrogen exchange and NMR spectroscopy. Methods Enzymol. 379:152–175. [DOI] [PubMed] [Google Scholar]
- Searle, M. S., and D. H. Williams. 1993. On the stability of nucleic acid structures in solution: enthalpy-entropy compensations, internal rotations and reversibility. Nucleic Acids Res. 21:2051–2056. [DOI] [PMC free article] [PubMed] [Google Scholar]
- Sharp, K. 2001. Entropy-enthalpy compensation: Fact or artifact? Protein Sci. 10:661–667. [DOI] [PMC free article] [PubMed] [Google Scholar]
- Weast, R. C., editor. 1987. CRC Handbook of Chemistry and Physics, 67th ed. CRC Press, Boca Raton, FL.


