

Abstract
Sphingomyelin, one of the main lipid components of biological membranes, is actively involved in various cellular processes such as protein trafficking and signal transduction. In particular, specific lateral domains enriched in sphingomyelin and cholesterol have been proposed to play an important functional role in biomembranes, although their precise characteristics have remained unclear. A thorough understanding of the functional role of membranes requires detailed knowledge of their individual lipid components. Here, we employ molecular dynamics simulations to conduct a systematic comparison of a palmitoylsphingomyelin (PSM, 16:0-SM) bilayer with a membrane that comprises dipalmitoylphosphatidylcholine (DPPC) above the main phase transition temperature. We clarify atomic-scale properties that are specific to sphingomyelin due to its sphingosine moiety, and further discuss their implications for SM-rich membranes. We find that PSM bilayers, and in particular the dynamics of PSM systems, are distinctly different from those of a DPPC bilayer. When compared with DPPC, the strong hydrogen bonding properties characteristic to PSM are observed to lead to considerable structural changes in the polar headgroup and interface regions. The strong ordering of PSM acyl chains and specific ordering effects in the vicinity of a PSM-water interface reflect this issue clearly. The sphingosine moiety and related hydrogen bonding further play a crucial role in the dynamics of PSM bilayers, as most dynamic properties, such as lateral and rotational diffusion, are strongly suppressed. This is most evident in the rotational motion characterized by spin-lattice relaxation times and the decay of hydrogen bond autocorrelation functions that are expected to be important in complexation of SM with other lipids in many-component bilayers. A thorough understanding of SM bilayers would greatly benefit from nuclear magnetic resonance experiments for acyl chain ordering and dynamics, allowing full comparison of these simulations to experiments.
INTRODUCTION
One of the great challenges in membrane research is to understand the exceptionally complex functionality of biological membranes (Bloom et al., 1991; Katsaras and Gutberlet, 2001). In part, this is due to the rich composition of lipid membranes characterized by hundreds of distinct lipid species that have been found to serve as structural components of cellular membranes, unevenly distributed over the outer and inner leaflets (Zachowski, 1993) and also within the leaflets (Maxfield, 2002). Sphingomyelins (SM), together with phosphatidylcholines (PC), form one of the major classes of eukaryotic membrane lipids, constituting >50% of the total phospholipid content. Both SMs and PCs are mostly located in the outer leaflet of plasma membranes (Barenholz and Thompson, 1999), although they are also encountered in various other biological structures such as lipoproteins (Hevonoja et al., 2000). Although SM and PC resemble each other in molecular structure, there are certain differences such as the higher average saturation state of SM's acyl chains and the greater capacity of SM to form inter- and intramolecular hydrogen bonds that lead to significant deviations in the macroscopic properties of SM and PC bilayers (Ramstedt and Slotte, 2002). Importantly, together with cholesterol, both SM and saturated PC molecules have been observed to be enriched in ordered, dynamic lateral domains in biomembranes, called “lipid rafts” (Brown and London, 2000; Mayor and Rao, 2004, Pike, 2004; Simons and Ikonen, 1997). Rafts have been suggested to play an important role in a wide range of cellular processes including membrane trafficking and sorting of proteins, thus highlighting the importance of understanding the role and atomic-scale properties of SM in cell membranes.
The concept of raft formation is still under controversy. This is mostly due to limitations associated with experimental techniques, which render interpretation of experimental findings very difficult. Consequently, the nature of molecular interactions between many of the key components of lipid rafts has remained unclear, the interaction between SM and cholesterol providing a relevant and topical example (Brown, 1998; Holopainen et al., 2004). The difficulties related to experimental studies imply that there is a great need for atomistic simulation studies that can provide novel insight into the properties of membrane systems in full atomic detail (Feller, 2000; Saiz and Klein, 2002; Scott, 2002; Tieleman et al., 1997). Yet, so far only a few molecular dynamics simulations have been carried out for SM systems. Most of them have concentrated on hydrogen-bonding analysis and structural properties of pure SM bilayers either in a liquid disordered phase (Chiu et al., 2003; Mombelli et al., 2003) or in a mixed gel/liquid phase (Hyvönen and Kovanen, 2003), besides which one work has been conducted on a binary sphingomyelin-cholesterol system (Khelashvili and Scott, 2004).
Although the activities in this field have been limited, the above simulation studies of SM bilayers have laid a sound basis for future research in the atomic regime to understand the role of SM in cell membranes. This is not a simple feat, however, because the variety of different SMs is considerable. Sphingomyelin molecules present in living systems usually constitute a mixed population of different amide linked acyl chains, their length ranging from 16 to 24 carbons, and the degree of unsaturation varying on average up to 0.35 cis-double bonds per molecule (Ramstedt and Slotte, 2002). Thus, to thoroughly understand the atomic-level properties of SM in cell membranes, and further to comprehend the properties of many-component bilayers and lipid domains such as rafts including SM, one first has to understand the properties of well-defined model membranes comprised of SM molecules. On one hand, this quest should aim for a clear view of both structural as well as dynamic features characteristic to SM. On the other hand, once solved, this challenge would reveal the specific properties of SM compared to other key molecules such as PC and cholesterol. The main objective here is to follow this idea and to clarify these two issues to an extent that is appropriate based on this approach.
We employ atomistic molecular dynamics simulations to gain insight into the structural as well as dynamic properties of SM bilayers. We concentrate on a lipid bilayer composed of palmitoylsphingomyelin (PSM), which has a saturated 16:0 acyl chain as the amide linked chain. This choice is based on two points. First, PSM is an important SM component for example in egg, human skin fibroblasts, and hamster kidney cells (Ramstedt et al., 1999), besides which it is becoming a standard in the field of SM simulations (Hyvönen and Kovanen, 2003; Mombelli et al., 2003). Secondly, because the palmitoyl chain of PSM is similar to the hydrocarbon chains (16:0) of dipalmitoylphosphatidylcholine (DPPC), which in turn has become a standard benchmark system for both experimental and simulation studies (Falck et al., 2004; Katsaras and Gutberlet, 2001; Tieleman et al., 1997), a study of PSM allows us to conduct a systematic comparison of its properties with those of DPPC (Falck et al., 2004; Patra et al., 2003, 2004) in full atomic detail. Additionally, the extensive treatment used here enables us to carefully discuss the properties of a given PSM bilayer hand-in-hand with the available experimental data.
In particular, this study provides a comprehensive view for SM bilayers with an emphasis on the interplay between their structural and dynamical properties. This is largely dictated by the strong hydrogen bonding of SM in the interface region, which has pronounced implications in the dynamics of the system. In all, the approach used here allows us to clarify properties that are specific to SM due to its sphingosine moiety, and further to discuss their implications in membranes rich in SM. The need for novel experiments is also addressed, because there are several key quantities such as acyl chain order parameters and spin-lattice relaxation times that (to our knowledge) have not been determined experimentally for SM bilayers.
SIMULATION DETAILS
We have simulated a lipid bilayer system comprised of 128 palmitoylsphingomyelin (PSM) molecules in explicit water using the GROMACS package (Berendsen et al., 1995; Lindahl et al., 2001) for the simulations. The studied molecule, introduced in Fig. 1, consists of 18:1 sphingosine (SPH) as the long-chain base and 16:0 palmitic acid (PA) as the fatty acid. Sphingosine, the most common base in mammalian SM, contains one trans-double bond between the 4th and 5th carbons. Its enantiomeric configuration is d-erythro, as always encountered in nature (Ramstedt and Slotte, 2002).
FIGURE 1.
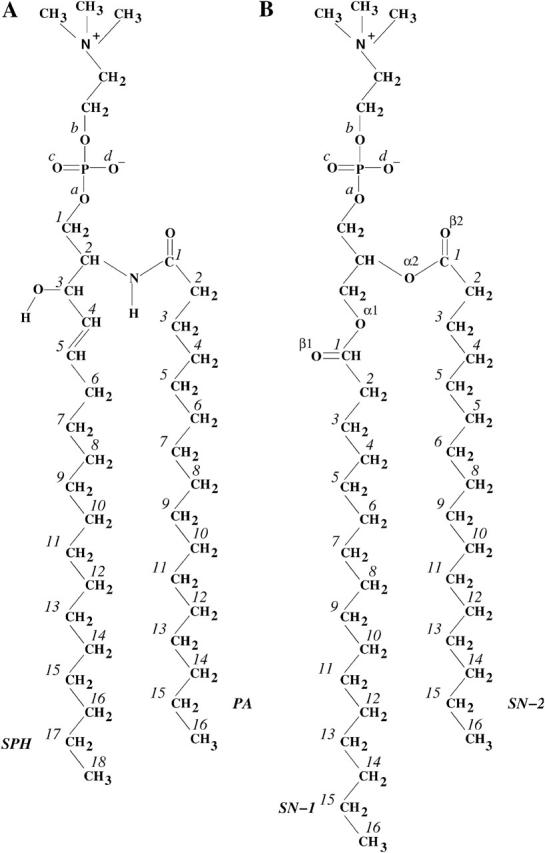
Structure of (A) palmitoylsphingomyelin (PSM) and (B) dipalmitoylphosphatidylcholine (DPPC) molecules with atom numbering. The PSM molecule consists of sphingosine chain (SPH; 18 carbons) and palmitoyl chain (PA; 16 carbons), whereas both acyl chains of DPPC (sn–1 and sn–2) consist of 16 carbons. The phosphate oxygens will be referred to as  in the text.
Initially, the force-field parameters were adapted from a previously validated united-atom description for DPPC (Tieleman and Berendsen, 1996), available at http://moose.bio.ucalgary.ca/files/dppc.itp, whose bonded and nonbonded interaction parameters are from a recent molecular dynamics simulation study (Berger et al., 1997). Partial charges are taken from ab initio calculations (Chiu et al., 1995). Explicit hydrogens were used for the two functional groups of PSM: the peptide bond and the hydroxyl group. The bonded and nonbonded parameters for these groups are from the GROMOS force field (van Gunsteren et al., 1996), and the partial charges in turn from standard GROMACS building blocks (Berendsen et al., 1995). The C=C double bond parameters are from the GROMOS force field and were actually obtained from a previously published simulation of a palmitoyloleoylphosphatidylcholine (POPC) bilayer (Tieleman and Berendsen, 1998). The corresponding dihedral potential function was shifted by 180° to ensure the trans configuration of the double bond between SPH carbons C4 and C5. For water, we used the simple point charge (SPC) model (Berendsen et al., 1981).
The treatment of long-range interactions is a delicate matter in lipid bilayer simulations. It has been shown recently that an abrupt truncation of electrostatics may lead to major artifacts in phase behavior, complemented by significant changes in both structural and dynamic properties of lipid membranes (Patra et al., 2003, 2004). Here, long-range electrostatic interactions were handled using the particle-mesh Ewald (PME) technique (Essmann et al., 1995b), which has been shown to be a reliable method to account for long-range interactions in lipid bilayer systems (Patra et al., 2003, 2004). The details of the implementation of PME have been discussed elsewhere (Patra et al., 2004). A single 1.0-nm cut-off distance was used for Lennard-Jones interactions without shift or switch functions. All bond lengths of lipids were constrained with the LINCS algorithm (Hess et al., 1997), whereas the SETTLE algorithm (Miyamoto and Kollman, 1992) was used for water.
As a starting structure, we used the coordinates of a fully hydrated DPPC bilayer from a previously published simulation study (Patra et al., 2003), into which the corresponding atoms were replaced or added after which the structure was stabilized by energy minimization. The system was hydrated with 3655 water molecules (42 wt % H2O), which is well above the experimentally shown limit of full hydration: 35 wt % H2O for 18:0-SM in 328 K (Maulik et al., 1991). Finally, the energy of the whole system was minimized again and the water was equilibrated in a short 20-ps simulation with restrained lipid positions.
The simulations were performed in the NPT ensemble. In the beginning, the system was equilibrated for 4.0 ns by the Berendsen thermostat with a time constant τ = 0.1 ps and by the Berendsen barostat with τ = 1.0 ps (Berendsen et al., 1984). After that, we switched to the Nosé-Hoover thermostat (Nosé, 1984; Hoover, 1985) with τ = 0.1 ps and Parrinello-Rahman barostat (Parrinello and Rahman, 1981; Nosé and Klein, 1983) with a time constant τ = 1.0 ps to reproduce the correct ensemble. In each case, the lipid bilayer and water were separately coupled to the heat bath and the semiisotropic pressure coupling was applied separately in the xy-direction (bilayer plane) and the z-direction (bilayer normal). The reference temperature was T = 323 K, which is above the main phase transition temperature Tm = 314 K of this particular lipid (Bar et al., 1997; Koynova and Caffrey, 1995; Maulik and Shipley, 1996; Ramstedt et al., 1999). For the time step, we used a value of 2.0 fs. In total, the system was simulated for 50.0 ns, of which 8.0 ns was regarded as an equilibration period and was not included in any of the analysis steps described later. A snapshot of the simulated bilayer is shown in Fig. 2.
FIGURE 2.
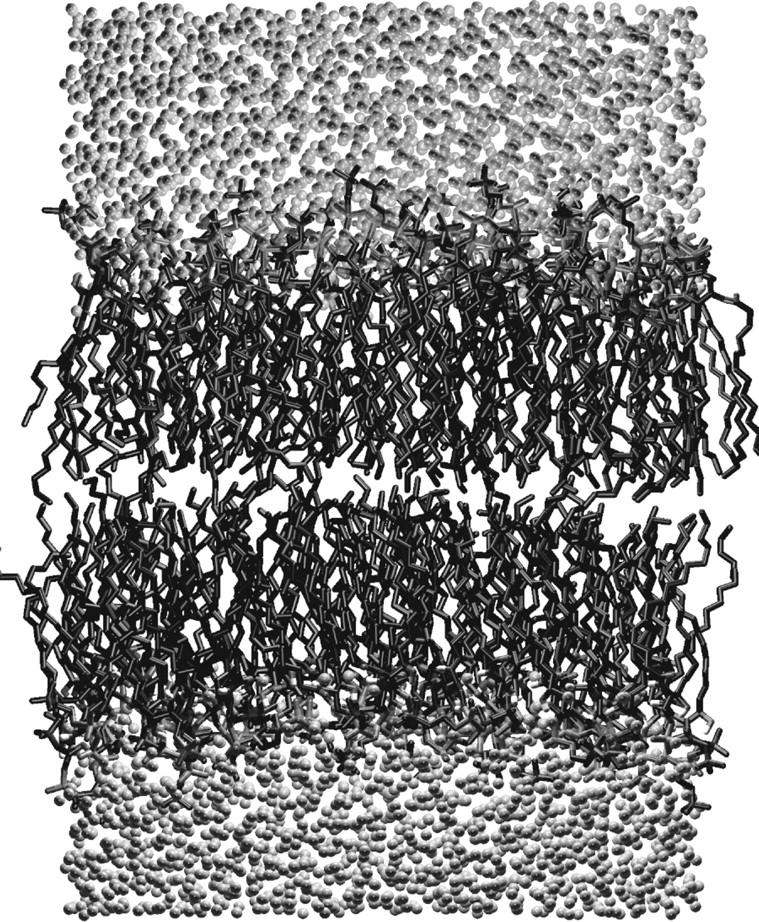
A snapshot of the simulated bilayer system consisting of 128 PSM molecules and 3655 water molecules.
Below, we discuss the results of our PSM bilayer simulations hand-in-hand with the results of a previous DPPC simulation study carried out in our group. The simulation details, analysis methods, and some of the results of the DPPC simulation study have been described elsewhere (Falck et al., 2004; Patra et al., 2003, 2004). For this work, we have extended the analysis of the DPPC system substantially thereby allowing us to carry out an extensive comparison between DPPC and PSM results in all cases where it is appropriate. In this respect, we wish to stress that the comparison made here is first of the kind and aims to overcome one of the main limitations related to MD simulations: the validity of atomistic simulation studies is largely based on the accuracy of force fields developed for a given system, and subtle differences in different force fields may render comparison highly difficult. This is a nontrivial problem in the case of SM bilayers, because the amount of accurate experimental data (such as order parameters for hydrocarbon tails and the area per molecule in the plane of the bilayer) available for comparison with simulation results is surprisingly limited. Consequently, chances for validating the force field, or fine-tuning interaction parameters, if that is needed, are equally limited. Also, the previous simulation studies of SM bilayers are not fully comparable: all of them (Hyvönen and Kovanen, 2003; Mombelli et al., 2003; Chiu et al., 2003) are based on different force fields, the systems are not identical (18:0-SM, 16:0-SM), and the long-range electrostatic interactions have been treated differently, among other matters.
In this work, we aim to resolve this issue as follows. The description used here for PSM is largely based on the established description for DPPC (Tieleman and Berendsen, 1996), whose properties are in very good overall agreement with experimental findings (Patra et al., 2003, 2004). Because the only difference of our PSM model system compared to the established DPPC model is due to the sphingosine moiety in PSM, we can compare the two systems and directly identify the properties that are specific to PSM only. Also, because electrostatics is fully described, our analysis for both structural as well as dynamical features including hydrogen bonding effects is expected to be on a solid ground.
RESULTS AND DISCUSSION
Area and volume per molecule
One of the most important quantities used to describe lipid bilayer structures is the average area per molecule, 〈A〉. Fig. 3 shows the time-dependent area per PSM and DPPC molecules versus time, A(t), determined by the simulation box dimensions in xy-direction. The PSM bilayer structure reaches equilibrium within a few nanoseconds, during which the area per molecule drops from its initial value of A(0) = 0.65 nm2 down to a value of 〈A〉 = (0.52 ± 0.01) nm2. This justifies the choice of 8.0 ns for equilibration. For comparison, the average area per molecule in a DPPC simulation was found to be 〈A〉 = (0.65 ± 0.01) nm2 in excellent agreement with experiments (Nagle and Tristram-Nagle, 2000).
FIGURE 3.

Area per molecule versus time in PSM and DPPC bilayers.
For sphingomyelin, the experimental reports for the average area per molecule are few and varying: an x-ray diffraction experiment of a PSM bilayer reported a value of 〈A〉 = 0.47 nm2 at 328 K (Maulik and Shipley, 1996), whereas a different study yielded a considerably higher value of 〈A〉 = 0.52 nm2 at 303 K based on Langmuir film balance measurements at a surface pressure of 30 mN/m (Li et al., 2000). For 18:0-SM, a value of 0.55 nm2 at 328 K has been reported. Keeping in mind that there are experimental difficulties of finding accurate estimates for 〈A〉 (Nagle and Tristram-Nagle, 2000), and that results for bilayer and Langmuir monolayers are not fully comparable, the agreement is reasonably good.
To estimate the area occupied by each individual lipid, we have projected the center of mass (CM) positions of the lipids onto the xy-plane and applied the two-dimensional Voronoi tessellation (Shinoda and Okazaki, 1998) on each of the monolayers separately. This allowed calculation of the area occupied by each individual lipid throughout the simulation trajectory and also to extract area distributions P(A), as well as time-autocorrelation functions CA(t) for the area per molecule fluctuations:
 |
(1) |
where Ai(t) is the area of molecule i at time t, and 〈 〉 denotes a time average over a large number of configurations. The results of the Voronoi analysis are shown in Fig. 4. The peak value of the PSM distribution is ∼0.52 nm2, which is equal to the average value obtained from the simulation box size. When compared with the P(A) obtained from the DPPC simulation, one can find that SM is characterized by a considerably narrower distribution and a smaller area per molecule. The inset of Fig. 4 depicts the autocorrelation functions CA(t) for the two systems, indicating slower decay for the PSM system. On the basis of CA(t) and the P(A) distributions one can conclude that PSM molecules are more tightly packed than DPPC molecules, and that the area fluctuations in a PSM bilayer are slower and smaller in amplitude. Based on these observations, one would expect the permeability of small molecules across SM bilayers to be reduced significantly as compared to DPPC systems. This has, indeed, been seen in experiments (Hill and Zeidel, 2000).
FIGURE 4.

Distribution of the area per molecule and the time autocorrelation function (inset), obtained from two-dimensional Voronoi analysis. In the inset for DPPC, the tail of the autocorrelation function becomes negative. This is a common feature in systems where the number of independent samples is small.
To calculate the volume occupied by lipid molecules, we first estimated water volume and subtracted that from the volume of the whole box. To this end, we first performed short simulations of pure water systems with four different SPC water molecule numbers: 993, 2685, 6540, and 12,426. The box size was allowed to fluctuate in constant pressure in each case and the average box volume was plotted as a function of water molecule number. The slope of the graph, (0.03156 ± 0.00005) nm3/H2O, is in reasonable agreement with a previously determined value of 0.0304 nm3 for SPC water (Armen et al., 1998). Now, by measuring the simulation box volume at each instant, calculating the average box volume, and subtracting the estimated water volume, one obtains a value for the average volume per lipid: 〈V〉 = (1.18 ± 0.01) nm3 for PSM and 〈V〉 = (1.23 ± 0.01) nm3 for DPPC. As the average volume of a CH2 group in PC bilayers has been estimated to be ∼0.028 nm3 (Armen et al., 1998), this implies that all of the excess molecular volume of DPPC would be due to its two extra CH2 groups as compared to PSM.
Acyl chain ordering
The orientational ordering of lipid acyl chains is described by the deuterium order parameter,
 |
(2) |
where θ is the angle between a selected C–H vector and the reference direction (bilayer normal). In a united-atom simulation, one can reconstruct the missing apolar hydrogens at their equilibrium positions on the basis of the backbone chain configuration. In this work, we have reconstructed the C–H vectors and calculated the order parameters for each of them.
Fig. 5 shows the order parameter profile along the acyl chains, averaged for each carbon separately. Except for the double-bonded carbons in a sphingosine chain, the acyl chains of PSM are significantly more ordered than those of DPPC. This is consistent with the observation of lower area per molecule for the PSM bilayer.
FIGURE 5.

Deuterium order parameters along the acyl chains.
A significant drop in SCD at the double-bond location has been observed for cis-bonds of unsaturated PC bilayers and has been explained to be caused by the average bond orientation, which lies almost in parallel to the bilayer plane. This kind of behavior has been proposed to be possible also for trans double bonds (Seelig and Waespe-Sarcevic, 1978). The average orientation of trans double bonds in PSM were found to be 26 ± 18° from the bilayer plane toward the interior. This significant alignment along the bilayer plane explains the drop in order parameter values at the bond location.
As far as other simulation studies are concerned, the SCD profiles from our simulations are in agreement with previous simulations carried out on similar systems (Chiu et al., 2003; Hyvönen and Kovanen, 2003; Mombelli et al., 2003), although not every one of them has produced a significant reduction of SCD at the double-bond location of the sphingosine chain.
The chain ordering of DPPC in bilayers has been measured by deuterium NMR with great accuracy and the experimental results (Douliez et al., 1995; Petrache et al., 2000) are fully consistent with the simulation data. For PSM bilayers in a fluid phase, however, to the best of our knowledge, there is only one reported experimental 2H NMR study that limits the number of conclusions. Using selective 2H labeling, one can measure the quadrupole splitting νQ, which is related to the order parameter SCD (Seelig and Seelig, 1974). Neuringer et al. used this technique for the palmitoyl carbon C10 of PSM (Neuringer et al., 1979) and found a value of SCD = 0.20 at T = 323 K. In the same study, the measurement of the corresponding carbon in DPPC gave an order parameter value of SCD = 0.17. Our study predicts greater relative ordering of chains at this specific location of PSM chains with respect to DPPC.
Despite the lack of NMR experiments for deuterium-labeled SM bilayers, further comparison to other experiments suggests that the acyl chains in SM bilayers are more ordered than those in DPPC (Guo et al., 2002; Steinbauer et al., 2003). Guo et al. considered bilayer mixtures of DPPC and bovine brain SM around 320 K and found that deuterium-labeled DPPC molecules (used as probe molecules) in SM membranes were more ordered than similar deuterium-labeled DPPCs in DPPC membranes (Guo et al., 2002). Steinbauer et al. used the same approach in SM-POPC mixtures using egg yolk and bovine brain SM. They found that the order parameters of deuterated POPC molecules along their hydrocarbon chains increased by 7–17% when pure POPC bilayers were replaced with POPC-SM membranes at T = 315 K with SM concentrations between 33 mol% and 66 mol% (Guo et al., 2002; Steinbauer et al., 2003).
Considering the importance of SM, the surprising lack of experimental data for acyl chain ordering is urging complementary experimental studies. Besides providing a more direct coupling between experimental and simulation studies, it would yield important insight into the SM properties in the interface and hydrocarbon regions.
Profiles across bilayer
In Fig. 6, we have plotted the total electron density ρe(z) of the PSM and DPPC systems across the bilayer, together with the partial densities of different components. The plots show clearly that water penetrates down to the hydrophobic acyl chain region in both systems. Despite the slight imbalance of the two PSM acyl chain lengths, the low density in the PSM bilayer center indicates no significant interdigitation, which is in accordance with the view of Fig. 2. It is likely that interdigitation (Barenholz and Thompson, 1999) is characteristic to SMs where the mismatch between chain lengths is more pronounced. The peak-to-peak distances from the total electron density profile are used to estimate the bilayer thickness. For the PSM bilayer, this value is dpp = (4.34 ± 0.05) nm, which is in excellent agreement with the experimentally obtained value of dpp = 4.44 nm by x-ray diffraction for PSM at 323 K (Maulik and Shipley, 1996). The PSM bilayer is significantly thicker than the DPPC bilayer, as dpp = (3.58 ± 0.05) nm for DPPC. A commonly applied method to multiply the average area per molecule (〈A〉) with the bilayer thickness (dpp) to estimate the molecular volume results in 〈V〉 = 1.13 nm3 for SM and 〈V〉 = 1.18 nm3 for DPPC, which are qualitatively consistent with the estimates discussed in the “Area and volume per molecule” section.
FIGURE 6.
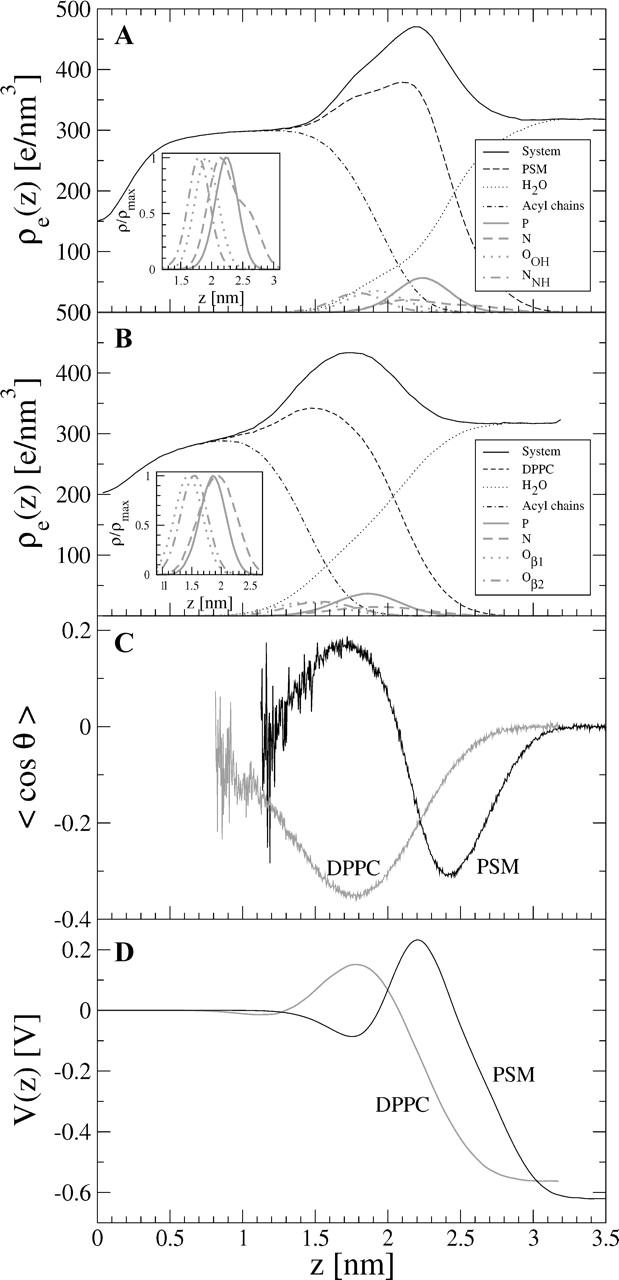
Partial electron densities of selected components in (A) PSM and (B) DPPC systems, together with (C) a plot of average orientation of water with respect to bilayer normal, and (D) the electrostatic potential across the bilayer.
To describe the orientational ordering of water near the lipid interface, the average angle between the outward-pointing normal vector of the bilayer (along z axis) and the water dipole moment vector was calculated for each water molecule in the system. Fig. 6 C shows the average orientation of water versus the distance from the bilayer center, 〈cosθ(z)〉, for both PSM and DPPC bilayers. At the membrane-water interface of DPPC the water dipoles tend to point toward the bilayer center, the orientation persisting up to the height where the lipid density levels off to zero. This orientational behavior has been explained to be dominantly driven by the headgroup phosphoryl region (Hyvönen et al., 1997; Patra et al., 2003), which agrees with the fact that the location of the maximum water orientation, z = 1.8 nm, coincides with the peak position of the phosphorous partial electron density. At the PSM-water interface, a similar effect can be observed as water approaches the phosphate group. However, in this case the orientation of water is also affected by the sphingosine moiety that is competing with the P–N headgroup. The average orientation of water thus reverses at about z = 2.1 nm and has a peak at z ≈ 1.7 nm, close to the maxima of the partial densities of the OH and NH groups. In all, the different composition of PSM and DPPC polar groups at the interfacial region leads to a qualitatively different ordering of water.
The electrostatic potential V(z) along the bilayer normal was calculated by the Poisson equation:
 |
(3) |
where the charge density ρq(z) has been calculated in a similar fashion as the electron density ρe(z) previously. The potential at the bilayer center was chosen as V(0) = 0. No significant difference in the electrostatic potential can be observed across the PSM bilayer as compared to DPPC (see Fig. 6 D). The lipid molecules contribute with a positive potential of ∼3 V, which is slightly overcompensated by the negative potential caused by water ordering discussed above (data not shown). The resulting total potential difference between the bilayer center and bulk water is about ΔV = 0.62 V for a PSM bilayer, which is almost equal to the value of ΔV = 0.57 V for a DPPC bilayer. The experimental values of ΔV for different phospholipid/water interfaces range from 0.20 V to 0.58 V (Flewelling and Hubbel, 1986; Gawrisch et al., 1992; McIntosh et al., 1992; Simon and McIntosh, 1989), whereas simulated ΔV values between 0.54 V and 0.63 V have been reported for a PSM/water interface (Chiu et al., 2003; Hyvönen and Kovanen, 2003).
Headgroup orientation and radial distribution functions
To study the orientational behavior of the headgroups, the angular distribution of the P–N vector with respect to the outward normal of the bilayer has been plotted in Fig. 7. The main peak of the PSM distribution is ∼105° and the full width at half-maximum is about Δθ = 82°, whereas the DPPC distribution peaks at 90° and has a width of Δθ = 70°.
FIGURE 7.

Angular distribution of the P–N vector with respect to bilayer normal.
The peak value of the DPPC bilayer indicates that the headgroups are on average lying almost exactly along the surface of the bilayer. The situation is distinctly different in the case of PSM. Surprisingly, the distribution of PSM headgroups has two peaks, the main peak ∼105° indicating P–N orientation that is tilted 15° toward the interior of the bilayer and a smaller peak at 55°, which is pointing toward the water phase. The headgroup angular distribution has been recently reproduced for the 18:0-SM bilayer by simulation (Chiu et al., 2003), but it was clearly monomodal, peaking at 90°. Signs of bimodal P–N vector distributions have been previously observed for example in simulations of PCs in the gel phase (Essmann et al., 1995a; Sun, 2002; Tu et al., 1996). This might imply that the bimodality of the P–N distribution is simply caused by the lower area per molecule in a gel phase. To check this, we examined the headgroup behavior in the previous simulations of DPPC bilayers under different conditions (Patra et al., 2003). The lowest area per molecule (0.56 nm2) occurred when the long-range electrostatics were described by truncation at 1.8-nm cutoff, but resulted in a clear monomodal distribution (data not shown). The bimodal headgroup behavior in the PSM simulation is thus caused by the interactions of headgroup atoms with the polar atoms in the interfacial region.
To further investigate the headgroup behavior, we have plotted the radial distribution functions g(r) between the N–P, N–N, and P–P atom pairs, as well as between N and negatively charged interfacial atoms (see Fig. 8). We find greater ordering in the PSM bilayer compared to that in the DPPC bilayer. Although this conclusion is general, the effect is most pronounced in the interface region. First, by comparing the distribution between the PSM headgroup nitrogen N and the peptide bond nitrogen NNH with the structurally corresponding DPPC distribution between N and Oα2, a clear peak can be observed for PSM in contrast to a broad distribution in DPPC. Also for PSM, the distribution between headgroup nitrogen N and hydroxyl oxygen OOH shows an especially high peak. Hence, based on the above, it is likely that there is no single bond giving rise to the peak at 55° in the P–N vector distribution of the PSM bilayer. Rather, there are several bonds where the headgroup nitrogen interacts with atoms in the interface region, and the peak is due to a delicate balance between them.
FIGURE 8.
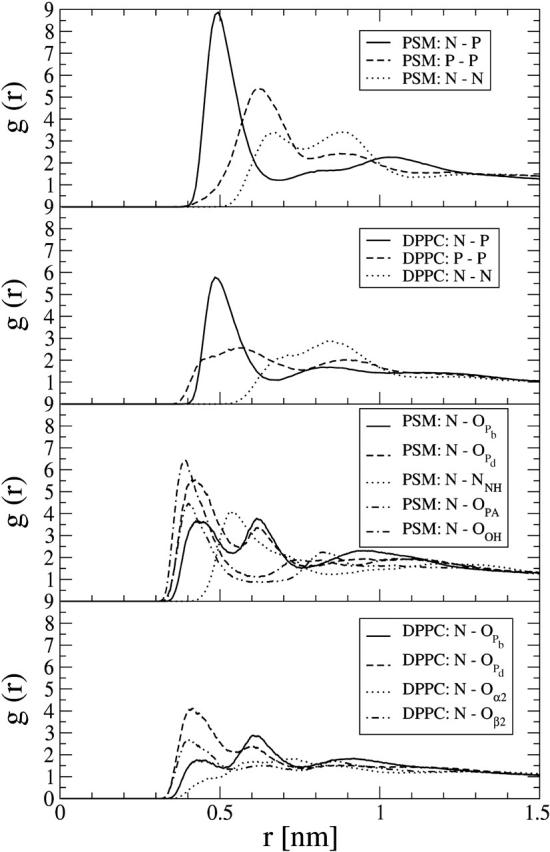
Intermolecular three-dimensional radial distribution functions between headgroup phosphorous P and nitrogen N (top two panels) and headgroup nitrogen and other atoms (bottom two panels).
The two-dimensional radial distribution function gCM(r) of the lipid center of mass positions (data not shown) revealed a small and broad peak for the PSM bilayer around r = 0.7 nm, which is lacking for DPPC. Given that this indicates slightly more local structure in the two-dimensional organization of lipids in PSM bilayer plane, there is no indication of long-range order that would be characteristic for a gel phase.
Hydrogen bonding
Perhaps the most interesting of sphingomyelin's characteristic features among other lipids is its capacity to form intra- and intermolecular hydrogen bonds. Computationally, to properly simulate hydrogen-bond dynamics, it would be necessary to include quantum effects that lead to proton sharing between the bonded atoms. Although classical MD simulations fail to include these effects entirely, numerous MD simulations with classical two-body potentials have been able to predict the correct qualitative static and dynamic features of water and other hydrogen-bonding liquids (Ladanyi and Skaf, 1993).
As generally utilized in the analysis of classical water simulations, two types of cutoffs are used to track the formation and breaking of hydrogen bonds: either energy-based cutoffs (Sciortino et al., 1990) or geometry-based cutoffs (Luzar and Chandler, 1996). In this work, we have used the following geometrical criteria: the acceptor-hydrogen distance dAH ≤ 0.25 nm and the donor-hydrogen-acceptor angle θDHA ≤ 90° (Mombelli et al., 2003). It is now straightforward, after identifying all the possible hydrogen-bond donors and acceptors in the system, to go through the trajectory to find the configurations that meet the criterion of a hydrogen bond. To analyze the dynamics of the hydrogen-bond formation and breaking, we have extracted an “on-off”-type binary existence function Ej(t) for each bond j and calculated its time autocorrelation function:
 |
(4) |
Finally, autocorrelation functions of the most abundant bond types were grouped together, normalized, and averaged.
On average, we found that one PSM molecule forms 1.1 intramolecular bonds within itself, it is involved in 0.8 intermolecular bonds with its neighbors, and it forms intermolecular bonds with 5.6 water molecules. As DPPC molecules can only act as hydrogen-bond acceptors, they are not able to form intra- or intermolecular hydrogen bonds with each other, but on average they form 6.7 bonds with water. A more detailed characterization of the hydrogen-bond types and their relative occurrences are shown in Tables 1 and 2 (and in Supplemental Material).
TABLE 1.
Intramolecular hydrogen bonds within PSM molecules
| Bond | N | % | t1/2 [ns] |
|---|---|---|---|
| All | 138.6 ± 3.0 | 100.0 | – |
 |
125.7 ± 1.1 | 90.7 | ≫20 |
 |
11.2 ± 2.8 | 8.1 | 0.057 |
 |
1.1 ± 0.5 | 0.8 | ≫20 |
TABLE 2.
Intermolecular hydrogen bonds: PSM⋯PSM
| Bond | N | % | t1/2 [ns] |
|---|---|---|---|
| All | 53.5 ± 5.4 | 100.0 | – |
 |
33.6 ± 5.1 | 62.7 | 6.622 |
 |
11.2 ± 3.0 | 20.9 | 1.051 |
 |
5.3 ± 2.0 | 9.9 | 0.551 |
 |
1.4 ± 1.1 | 2.6 | 0.049 |
Fig. 9 shows by few examples the variation of hydrogen-bonding timescales between different groups: PSM intramolecular, PSM–PSM, PSM–H20, and DPPC–H20 bonds. The decay half times, t1/2, of all averaged autocorrelation functions were calculated and they are represented together with the average bond abundances in Tables 1 and 2 (and in Supplemental Material).
FIGURE 9.

Examples of hydrogen-bond autocorrelation functions between different hydrogen bonding pairs.
It is now possible to draw some conclusions on the basis of the presented analysis. First of all, the OH group of PSM is almost solely responsible for intramolecular hydrogen bonding with a very stable bond to phosphoryl oxygen  (
( ; see Fig. 9). A finite probability seems to exist for an intramolecular bond to form also between the NH group and phosphate oxygen
  This bond is very stable, too, but there is only one molecule out of 128 where it exists. Secondly, the NH group is the only group to act as hydrogen donor in intermolecular hydrogen bonding between PSM molecules. The most stable and abundant one is the bond between the NH group and the hydroxyl oxygen OOH. Also the other oxygens (OPA,
  and
and  ) were observed to serve as acceptors in intermolecular hydrogen bonds with the NH group.
Thirdly, water makes hydrogen bonds mostly with the two PSM phosphate oxygens  and
and  which are left free from other bonds (see Supplemental Material for more detailed data). However, the most stable hydrogen bond between PSM and H2O is the one where the PSM-NH group serves as hydrogen donor and, in fact, plays a crucial role in orienting water molecules (Fig. 6 C). The most abundant hydrogen bonds between DPPC and water involve phosphate oxygens
  and
and  too, but in contrast to PSM, the ester oxygens increase the total number of hydrogen bonds formed with water (see Supplemental Material).
In qualitative manner, all our observations for the nature of intra- and intermolecular hydrogen bonding in PSM bilayer agree with previously published NMR experiments (Bruzik et al., 1990; Schmidt et al., 1977; Talbott et al., 2000), which have proposed a stable intramolecular hydrogen bond between the OH group and the phosphate oxygen  as well as the intermolecular nature of the hydrogen bonds formed by the NH group. The possibility of water-bridged hydrogen bonds between sphingomyelins was also suggested by experiments (Talbott et al., 2000) and was studied in detail through MD simulations (Mombelli et al., 2003). Our observations for water bonding mostly to
  and
and  atoms of the phosphate group are in accordance with these studies. Other computational works have also been able to predict the intra- and intermolecular nature of hydrogen bonding in sphingomyelin bilayers, either by utilizing radial distribution functions (Chiu et al., 2003; Hyvönen and Kovanen, 2003) or geometry-based cutoffs (Mombelli et al., 2003). Our simulation, however, is the first that is long enough in duration to enable a careful analysis of the dynamics of the hydrogen bonds in terms of autocorrelation functions in addition to structural analysis. The comparison to the DPPC bilayer has not only shown that the excess hydrogen bonding of PSM is caused by the amide and hydroxyl groups, but it also revealed the relative stabilities and life times of different bond types.
Lateral diffusion
To quantify the dynamic behavior of the lipids, we have calculated the lateral diffusion coefficient DT, which describes the motion of lipids in the bilayer plane:
 |
(5) |
where d = 2 is the dimensionality of the system and  is the mean-squared displacement (MSD) of the CM positions, averaged over all the molecules in the bilayer. Although the center of mass position of the whole system is constrained during the simulation, the random relative motions of the two lipid layers can lead to apparent artificial superdiffusive motion of the individual molecules (Anézo et al., 2003). To prevent this, the lateral diffusion coefficients were calculated in such a way that the motion of the CM of each monolayer was first taken into account; see Patra et al. (2004) for details.
For the lateral diffusion coefficient at long times we find DT = (0.38 ± 0.03) × 10−7 cm2/s in a PSM bilayer, and DT = (1.27 ± 0.05) × 10−7 cm2/s in DPPC. In practice, respectively, these values correspond to 0.87 nm and 1.59 nm root-mean-squared lateral displacements of the lipids during the 50-ns simulation.
The DPPC result is in accord with experimental findings that range typically from 1.0 × 10⁻⁷ cm2/s to 1.5 × 10⁻⁷ cm2/s (König et al., 1992; Vaz et al., 1985; Sackmann, 1995). In the case of PSM, Filippov et al. (2003) studied lateral diffusion in PSM (egg yolk SM)—cholesterol mixtures using pulsed field gradient NMR measurements at 323 K. In the limit of zero cholesterol concentration they found a value of 0.6 × 10⁻⁷ cm2/s (Filippov et al., 2003). In the same study, using a similar approach, the authors found 2.0 × 10⁻⁷ cm2/s for lateral diffusion of DMPC and DOPC. The trend of the simulation results is consistent with these measurements, and even the quantitative agreement of PSM and DPPC diffusion data is reasonably good.
Rotational motions
For the sake of a more detailed comparison between the dynamics of the two systems, the rotational motions of different parts of lipids have been examined. For this, the second rank reorientational autocorrelation functions C2(t) were calculated:
 |
(6) |
where  is a unit vector that defines the chosen rotational mode. Three different rotational modes were analyzed: the headgroup, the interfacial region, and the C–H bond vectors along the acyl chains.
For the interfacial region, we defined a vector from sphingosine C3 to C1 for PSM and a vector from sn–1 to sn–3 carbon for DPPC. Fig. 10 shows the reorientational C2(t) functions for these vectors. For PSM, the decay half-time of the interfacial vector is t1/2 = 6.9 ns, whereas for DPPC it is t1/2 = 1.0 ns. This indicates that the decay of PSM at short times is almost an order of magnitude slower than that of DPPC. The same trend can be observed for headgroup rotation, defined by the reorientational autocorrelation function of P–N vectors. In the PSM bilayer this function decays with t1/2 = 1.5 ns, whereas in DPPC it is t1/2 = 0.3 ns.
FIGURE 10.

Rotational autocorrelation functions of different molecular parts (selected vectors) in DPPC and PSM systems: the interfacial vector points from sphingosine carbon C3 to C1 in PSM and from sn–1 carbon to sn–3 carbon in DPPC, whereas the P–N vector points from headgroup phosphorous to headgroup nitrogen in both systems.
To characterize the rotational motion along the acyl chains, we have calculated the average C2(t) functions separately for each of the previously constructed C–H vectors in the system. For the short-time behavior, we consider the half-time t1/2 of given C2(t). For the long-time behavior, we consider the characteristic time τ in which the different C2(t) functions reach their plateau values:
 |
(7) |
Here C2(∞) is the plateau value of the autocorrelation function at long times and C2(0) ≡ 1 due to normalization. The decay time constant τ of the C–H bond rotational C2(t) function can be related to NMR spin-lattice relaxation times, T1, which are experimentally determinable (Brown, 1984a,b; Nevzorov and Brown, 1997).
The fastest rotational modes in lipids, related to the gauche/trans isomerization in acyl chains, are typically of the order of 50–100 ps, whereas the molecular rotations and wobble are in the range of nanoseconds (Pastor and Feller, 1996). The NMR relaxation time constants have been determined from atomistic simulations of different lipid systems and they agree with experimental values to a reasonable extent (Lindahl and Edholm, 2001; Mashl et al., 2001; Pastor et al., 2002). However, as spin-lattice relaxation measurements are lacking for PSM, we only compare the DPPC results (for C2(t)) with experimental data.
Fig. 11 shows the time constant τ values for PSM and DPPC bilayers. For both systems, similar behavior can be observed: the rotational motions are fastest in the bilayer center (τ ∼ 10–20 ps) and they get slower in a roughly exponential fashion toward the lipid/water interface, where τ is on a scale of nanoseconds. Along the entire chains, τ indicates slower rotation in the PSM bilayer than in DPPC. There is also greater difference between the two chains of PSM than in the two chains of DPPC.
FIGURE 11.

Reorientational autocorrelation functions of the acyl chain C–H vector: the time constant τ obtained by integration (top four curves), and the half-time t1/2 of the autocorrelation decay (bottom four curves). The black curves refer to the PSM system and the shaded curves to the DPPC system.
The T1 profile measurement along the DPPC chain segments (Brown et al., 1979) indicated fastest decay of τ ∼ 19 ps at carbon C15 of the sn–1 chain, a plateau of τ ∼ 73 ps between C3 and C9 and the slowest decay of τ ∼ 180 ps at the sn–3 carbon of DPPC. The simulated τ values in Fig. 11 are roughly in the same regime with the experimental values, although there is no clear indication of a plateau in the profile near the chain centers. Also the slowest rotational mode of the sn–1 chain, determined by τ ∼ 600 ps, is significantly slower than in the experiment.
The decay at short times, characterized by t1/2 in Fig. 11, shows similar behavior in both systems toward the chain ends, where t1/2 ∼ 10 ps. The most notable difference is found close to the double bond at small carbon numbers. For PSM, t1/2 increases by an order of magnitude at the double-bond region of the sphingosine chain (carbons 4–5) and by many orders of magnitude at the very beginning of the sphingosine chain (carbons 1–3). Here t1/2 is on a scale of several nanoseconds, which was observed above to be a characteristic timescale of rotational motion in the interfacial region. The palmitoyl chain of PSM shows very similar behavior with both DPPC acyl chains, except for the second carbon, which is an order of magnitude slower.
CONCLUDING REMARKS
A wide range of experimental studies have shown that sphingomyelin is one of the most relevant lipids in cellular membranes. On one hand, this is due to its capacity to enhance and be involved in domain formation, which in turn is one of the main issues in lipid rafts, i.e., lateral domains characterized by their dynamic and ordered nature that leads certain classes of proteins to associate with rafts. Consequently, rafts have been suggested to play a major role in various cellular processes such as protein trafficking and signal transduction (Anderson and Jacobson, 2002; Helms and Zurzolo, 2004; Simons and Toomre, 2000). On the other hand, besides its structural and dynamic role in membrane domains, sphingomyelin actively participates, e.g., in cellular signaling. Also, a major product of SM metabolism, ceramide, serves as a messenger in cell apoptosis.
Based on the above, it is rather surprising how little experimental attention many of the key structural and dynamic properties of SM bilayers have received. For example, considering the influence of the area per molecule on essentially all structural as well as dynamic properties of SM bilayers, the lack of detailed studies is striking. Despite experimental difficulties associated with these measurements, more precise estimates for this quantity would certainly be acknowledged. Further, the ordering of hydrocarbon chains in SM bilayers has received very little attention by far, and basically the overall understanding of this issue is lacking altogether. As for dynamic quantities, a similar situation holds, in part, and issues such as spin-lattice relaxation times remain to be explored.
These gaps in our understanding of SM bilayers can be contrasted to bilayers of phosphatidylcholines, which are perhaps the most-studied model membranes (Falck et al., 2004; Katsaras and Gutberlet, 2001; Tieleman et al., 1997). Consequently, in this work, we have followed a guiding principle to conduct a full comparison between PSM and DPPC bilayers through atomic-scale simulations. The extensive study employed here has further enabled us to carefully discuss the properties of the PSM bilayer hand-in-hand with the available experimental data. In this manner, we are able to clarify properties that are specific to SM.
We have found significant differences between PSM and DPPC systems. Importantly, the hydrogen-bonding network in a PSM bilayer was observed to have an exceptional effect on both its structural and dynamic properties. The PSM–PSM intermolecular bonds were dominated solely by the amide group as hydrogen-bonding donor, forming bonds with several polar oxygens of the interfacial region, the most stable one being characteristically a few nanoseconds in duration. A clear majority of the PSM intramolecular bonds (∼91%) were formed between the hydroxyl group and phosphate oxygen  the bonds being very stable throughout the simulation. Especially the hydrogen-donating capability of the NH group was observed to result in distinctly different ordering behavior near the PSM-water interface as compared to DPPC. As for dynamics, the effects are even more notable. We found prominent changes in essentially all the dynamic quantities: the fluctuations in the area per molecule were slowed down, the rotational motions of the acyl chains were suppressed, and the lateral diffusion of PSM molecules was significantly slower compared to that in the DPPC bilayer. Although these changes are related to the strong ordering of PSM acyl chains, in contrast to weaker ordering in DPPC, the main reason for finding this behavior lies in the extensive hydrogen-bonding network within PSM molecules that can be related to the overall stiffness and reduced flexibility in the PSM bilayer as compared to DPPC.
Considering the importance of SM and its characteristic hydrogen-bonding properties, it is natural to ask how that might be manifested in many-component systems such as rafts including SM. In this regard, atomic-scale simulations can provide valuable insight into the related phenomena. Very recently, first attempts in this direction have been made. Khelashvili and Scott (2004) studied hydrogen-bonding networks in binary mixtures of SM and cholesterol, and Pandit et al. (2004) explored the complexation in DPPC-cholesterol and DLPC-cholesterol systems. Because the formation of ordered domains is likely to involve cooperative interactions in terms of complexes, which in turn may form networks through hydrogen-bonding pathways, it is likely that the role of SM in this entire picture is significant. The current state is therefore very encouraging, because atomic-level studies such as this one have reached sufficient maturity to describe the key properties of pure SM systems in agreement with experiments, and also to go beyond that by providing deep insight into the nature of atomic-scale phenomena with a level of detail missing in any experimental technique. As a consequence, there are now various fascinating issues to be resolved. The issue of domains in multicomponent bilayers including SM and ceramide is one of them, and the related effects due to interdigitation another. Work in this direction is underway.
SUPPLEMENTARY MATERIAL
An online supplement to this article can be found by visiting BJ Online at http://www.biophysj.org.
Supplementary Material
Acknowledgments
The authors thank A. A. Gurtovenko for fruitful discussions. We also acknowledge the Finnish IT Center for Science and the HorseShoe (DCSC) supercluster computing facility at the University of Southern Denmark for computer resources.
This work has, in part, been supported by the Academy of Finland through its Center of Excellence Program (P.N. and I.V.), the Academy of Finland grant nos. 202598 (P.N), 80246 (I.V.), and 80851 (M.T.H.), the Jenny and Antti Wihuri Foundation (M.T.H.), and the Finnish Academy of Science and Letters (P.N.).
References
- Anderson, R. G. W., and K. Jacobson. 2002. A role for lipid shells in targeting proteins to caveolae, rafts and other lipid domains. Science. 296:1821–1825. [DOI] [PubMed] [Google Scholar]
- Anézo, C., A. H. de Vries, H.-D. Höltje, D. P. Tieleman, and S.-J. Marrink. 2003. Methodological issues in lipid bilayer simulations. J. Phys. Chem. B. 107:9424–9433. [Google Scholar]
- Armen, R. S., O. D. Uitto, and S. E. Feller. 1998. Phospholipid component volumes: determination and application to bilayer structure calculations. Biophys. J. 74:734–744. [DOI] [PMC free article] [PubMed] [Google Scholar]
- Bar, L. K., Y. Barenholz, and T. E. Thompson. 1997. Effect of sphingomyelin composition on the phase structure of phosphatidylcholine-sphingomyelin bilayers. Biochemistry. 1997:2507–2516. [DOI] [PubMed] [Google Scholar]
- Barenholz, Y., and T. E. Thompson. 1999. Sphingomyelin: biophysical aspects. Chem. Phys. Lipids. 102:29–34. [DOI] [PubMed] [Google Scholar]
- Berendsen, H. J. C., J. P. M. Postma, W. F. van Gunsteren, A. DiNola, and J. R. Haak. 1984. Molecular dynamics with coupling to an external bath. J. Chem. Phys. 81:3684–3690. [Google Scholar]
- Berendsen, H. J. C., J. P. M. Postma, W. F. van Gunsteren, and J. Hermans. 1981. Interaction models for water in relation to protein hydration. In Intermolecular Forces. B. Pullman, editor. Reidel, Dordrecht, The Netherlands. 331–342.
- Berendsen, H. J. C., D. van der Spoel, and R. van Drunen. 1995. Gromacs: a message-passing parallel molecular dynamics implementation. Comput. Phys. Commun. 91:43–56. [Google Scholar]
- Berger, O., O. Edholm, and F. Jähnig. 1997. Molecular dynamics simulations of a fluid bilayer of dipalmitoylphosphatidylcholine at full hydration, constant pressure, and constant temperature. Biophys. J. 72:2002–2013. [DOI] [PMC free article] [PubMed] [Google Scholar]
- Brown, M. F. 1984a. Theory of spin-lattice relaxation in lipid bilayers and biological membranes: dipolar relaxation. J. Chem. Phys. 80:2808–2831. [Google Scholar]
- Brown, M. F. 1984b. Unified picture for spin-lattice relaxation of lipid bilayers and biomembranes. J. Chem. Phys. 80:2832–2836. [Google Scholar]
- Brown, R. E. 1998. Sphingolipid organization in biomembranes: what physical studies of model membranes reveal. J. Cell Sci. 111:1–9. [DOI] [PMC free article] [PubMed] [Google Scholar]
- Bloom, M., E. Evans, and O. G. Mouritsen. 1991. Physical properties of the fluid lipid-bilayer component of cell membranes: a perspective. Q. Rev. Biophys. 24:293–397. [DOI] [PubMed] [Google Scholar]
- Brown, D. A., and E. London. 2000. Structure and function of sphingolipid- and cholesterol-rich membrane rafts. J. Biol. Chem. 275:17221–17224. [DOI] [PubMed] [Google Scholar]
- Brown, M. F., J. Seelig, and U. Häberlen. 1979. Structural dynamics in phospholipid bilayers from deuterium spin-lattice relaxation time measurements. J. Chem. Phys. 70:5045–5053. [Google Scholar]
- Bruzik, K. S., B. Sobon, and G. M. Salamonczyk. 1990. Nuclear magnetic resonance study of sphingomyelin bilayers. Biochemistry. 29:4017–4021. [DOI] [PubMed] [Google Scholar]
- Chiu, S.-W., M. Clark, V. Balaji, S. Subramaniam, H. L. Scott, and E. Jakobsson. 1995. Incorporation of surface tension into molecular dynamics simulation of an interface: a fluid phase lipid bilayer membrane. Biophys. J. 69:1230–1245. [DOI] [PMC free article] [PubMed] [Google Scholar]
- Chiu, S. W., S. Vasudevan, E. Jakobsson, R. J. Mashl, and H. L. Scott. 2003. Structure of sphingomyelin bilayers: a simulation study. Biophys. J. 85:3624–3635. [DOI] [PMC free article] [PubMed] [Google Scholar]
- Douliez, J.-P., A. Léonard, and E. J. Dufourc. 1995. Restatement of order parameters in biomembranes: calculation of C–C bond order parameters from C–D quadrupolar splittings. Biophys. J. 68:1727–1739. [DOI] [PMC free article] [PubMed] [Google Scholar]
- Essmann, U., L. Perera, and M. L. Berkowitz. 1995a. The origin of the hydration interaction of lipid bilayers from MD simulation of dipalmitoylphosphatidylcholine membranes in gel and crystalline phases. Langmuir. 11:4519–4531. [Google Scholar]
- Essmann, U., L. Perera, M. L. Berkowitz, T. Darden, H. Lee, and L. G. Pedersen. 1995b. A smooth particle mesh Ewald potential. J. Chem. Phys. 103:8577–8592. [Google Scholar]
- Falck, E., M. Patra, M. Karttunen, M. T. Hyvönen, and I. Vattulainen. 2004. Lessons of slicing membranes: interplay of packing, free area, and lateral diffusion in phospholipid/cholesterol bilayers. Biophys. J. 87:1076–1091. [DOI] [PMC free article] [PubMed] [Google Scholar]
- Feller, S. E. 2000. Molecular dynamics simulations of lipid bilayers. Curr. Opin. Coll. Interface Sci. 5:217–223. [Google Scholar]
- Filippov, A., G. Orädd, and G. Lindblom. 2003. The effect of cholesterol on the lateral diffusion of phospholipids in oriented bilayers. Biophys. J. 84:3079–3086. [DOI] [PMC free article] [PubMed] [Google Scholar]
- Flewelling, R. F., and W. L. Hubbel. 1986. The membrane dipole potential in a total membrane potential model. Biophys. J. 49:541–552. [DOI] [PMC free article] [PubMed] [Google Scholar]
- Gawrisch, K., D. Ruston, J. Zimmerberg, V. A. Parsegian, R. P. Rand, and N. Fuller. 1992. Membrane dipole potentials, hydration forces, and the ordering of water at membrane surface. Biophys. J. 61:1213–1223. [DOI] [PMC free article] [PubMed] [Google Scholar]
- Guo, W., V. Kurze, T. Huber, N. H. Afdhal, K. Beyer, and J. A. Hamilton. 2002. A solid-state NMR study of phospholipid-cholesterol interactions: sphingomyelin-cholesterol binary systems. Biophys. J. 83:1465–1478. [DOI] [PMC free article] [PubMed] [Google Scholar]
- Helms, J. B., and C. Zurzolo. 2004. Lipids as targeting signals: lipid rafts and intracellular traffiking. Traffic. 5:247–254. [DOI] [PubMed] [Google Scholar]
- Hess, B., H. Bekker, H. J. C. Berendsen, and J. G. E. M. Fraaije. 1997. LINCS: a linear constraint solver for molecular simulations. J. Comput. Chem. 18:1463–1472. [Google Scholar]
- Hevonoja, T., M. O. Pentikäinen, M. T. Hyvönen, P. T. Kovanen, and M. Ala-Korpela. 2000. Structure of low density lipoprotein (LDL) particles: basis for understanding molecular changes in modified LDL. Biochim. Biophys. Acta. 1488:189–210. [DOI] [PubMed] [Google Scholar]
- Hill, W. G., and M. L. Zeidel. 2000. Reconstructing the barrier properties of a water-tight membrane by design of leaflet-specific liposomes. J. Biol. Chem. 275:30176–30185. [DOI] [PubMed] [Google Scholar]
- Holopainen, J. M., A. J. Metso, J.-P. Mattila, A. Jutila, and P. K. J. Kinnunen. 2004. Evidence for the lack of a specific interaction between cholesterol and sphingomyelin. Biophys. J. 86:1510–1520. [DOI] [PMC free article] [PubMed] [Google Scholar]
- Hoover, W. G. 1985. Canonical dynamics: equilibrium phase-space distributions. Phys. Rev. A. 31:1695–1697. [DOI] [PubMed] [Google Scholar]
- Hyvönen, M. T., and P. T. Kovanen. 2003. Molecular dynamics simulation of sphingomyelin bilayer. J. Phys. Chem. B. 107:9102–9108. [Google Scholar]
- Hyvönen, M. T., T. T. Rantala, and M. Ala-Korpela. 1997. Structure and dynamic properties of diunsaturated 1-palmitoyl-2-linoleoyl-sn-glycero-3-phosphatidylcholine lipid bilayer from molecular dynamics simulation. Biophys. J. 73:2907–2923. [DOI] [PMC free article] [PubMed] [Google Scholar]
- Katsaras, J., and T. Gutberlet. editors, 2001. Lipid Bilayers: Structure and Interactions. Springer-Verlag, Berlin, Germany.
- Khelashvili, G. A., and H. L. Scott. 2004. Combined Monte Carlo and molecular dynamics simulation of hydrated 18:0 sphingomyelin-cholesterol lipid bilayers. J. Chem. Phys. 120:9841–9847. [DOI] [PubMed] [Google Scholar]
- König, S., W. Pfeiffer, T. Bayerl, D. Richter, and E. Sackmann. 1992. Molecular dynamics of lipid bilayers studied by incoherent quasi-elastic neutron scattering. J. Phys. II France. 2:1589–1615. [Google Scholar]
- Koynova, R., and M. Caffrey. 1995. Phases and phase transitions of the sphingolipids. Biochim. Biophys. Acta. 1255:213–236. [DOI] [PubMed] [Google Scholar]
- Ladanyi, B. M., and M. S. Skaf. 1993. Computer simulation of hydrogen-bonding liquids. Annu. Rev. Phys. Chem. 44:335–368. [Google Scholar]
- Li, X.-M., J. M. Smaby, M. M. Momsen, H. L. Brockman, and R. E. Brown. 2000. Sphingomyelin interfacial behavior: the impact of changing acyl chain composition. Biophys. J. 78:1921–1931. [DOI] [PMC free article] [PubMed] [Google Scholar]
- Lindahl, E., and O. Edholm. 2001. Molecular dynamics simulation of NMR relaxation rates and slow dynamics in lipid bilayers. J. Chem. Phys. 115:4938–4950. [Google Scholar]
- Lindahl, E., B. Hess, and D. van der Spoel. 2001. Gromacs 3.0: a package for molecular simulation and trajectory analysis. J. Mol. Mod. 7:306–317. [Google Scholar]
- Luzar, A., and D. Chandler. 1996. Effect of environment on hydrogen bond dynamics in liquid water. Phys. Rev. Lett. 76:928–931. [DOI] [PubMed] [Google Scholar]
- Mashl, R. J., H. L. Scott, S. Subramaniam, and E. Jakobsson. 2001. Molecular simulation of dioleoylphosphatidylcholine lipid bilayers at differing levels of hydration. Biophys. J. 81:3005–3015. [DOI] [PMC free article] [PubMed] [Google Scholar]
- Maulik, P. R., and G. G. Shipley. 1996. N-palmitoyl sphingomyelin bilayers: structure and interactions with cholesterol and dipalmitoylphosphatidylcholine. Biochemistry. 35:8025–8034. [DOI] [PubMed] [Google Scholar]
- Maulik, P. R., P. K. Sripada, and G. G. Shipley. 1991. Structure and thermotropic properties of hydrated N-stearoyl sphingomyelin bilayer membranes. Biochim. Biophys. Acta. 1062:211–219. [DOI] [PubMed] [Google Scholar]
- Maxfield, F. R. 2002. Plasma membrane microdomains. Curr. Opin. Cell Biol. 14:483–487. [DOI] [PubMed] [Google Scholar]
- Mayor, S., and M. Rao. 2004. Rafts: scale-dependent, active lipid organization at the cell surface. Traffic. 5:231–240. [DOI] [PubMed] [Google Scholar]
- McIntosh, T. J., S. A. Simon, D. Needham, and C.-H. Huang. 1992. Interbilayer interactions between sphingomyelin and sphingomyelin/cholesterol bilayers. Biochemistry. 31:2020–2024. [DOI] [PubMed] [Google Scholar]
- Miyamoto, S., and P. A. Kollman. 1992. SETTLE: an analytical version of the SHAKE and RATTLE algorithms for rigid water models. J. Comput. Chem. 13:952–962. [Google Scholar]
- Mombelli, E., R. Morris, W. Taylor, and F. Fraternali. 2003. Hydrogen-bonding propensities of sphingomyelin in solution and in a bilayer assembly: a molecular dynamics study. Biophys. J. 84:1507–1517. [DOI] [PMC free article] [PubMed] [Google Scholar]
- Nagle, J. F., and S. Tristram-Nagle. 2000. Structure of lipid bilayers. Biochim. Biophys. Acta. 1469:159–195. [DOI] [PMC free article] [PubMed] [Google Scholar]
- Neuringer, L. J., B. Sears, F. B. Jungalwala, and E. K. Shriver. 1979. Difference in orientational order in phospholipid and sphingomyelin bilayers. FEBS Lett. 104:173–175. [DOI] [PubMed] [Google Scholar]
- Nevzorov, A. A., and M. F. Brown. 1997. Dynamics of lipid bilayers from comparative analysis of 2H and 13C nuclear magnetic resonance relaxation data as a function of frequency and temperature. J. Chem. Phys. 107:10288–10310. [Google Scholar]
- Nosé, S. 1984. A molecular dynamics method for simulations in the canonical ensemble. Mol. Phys. 52:255–268. [Google Scholar]
- Nosé, S., and M. L. Klein. 1983. Constant pressure molecular dynamics for molecular systems. Mol. Phys. 50:1055–1076. [Google Scholar]
- Pandit, S. A., D. Bostick, and M. L. Berkowitz. 2004. Complexation of phosphatidylcholine lipids with cholesterol. Biophys. J. 86:1345–1356. [DOI] [PMC free article] [PubMed] [Google Scholar]
- Parrinello, M., and A. Rahman. 1981. Polymorphic transitions in single crystals: a new molecular dynamics method. J. Appl. Phys. 52:7182–7190. [Google Scholar]
- Pastor, R. W., and S. E. Feller. 1996. Time scales of lipid dynamics and molecular dynamics. In Biological Membranes: A Molecular Perspective from Computation and Experiment. K. M. Merz and B. Roux, editors. Birkhauser, Boston, MA. 3–30.
- Pastor, R. W., R. M. Venable, and S. E. Feller. 2002. Lipid bilayers, NMR relaxation and computer simulations. Acc. Chem. Res. 35:438–446. [DOI] [PubMed] [Google Scholar]
- Patra, M., M. Karttunen, M. T. Hyvönen, E. Falck, P. Lindqvist, and I. Vattulainen. 2003. Molecular dynamics simulations of lipid bilayers: major artifacts due to truncating electrostatic interactions. Biophys. J. 84:3636–3645. [DOI] [PMC free article] [PubMed] [Google Scholar]
- Patra, M., M. Karttunen, M. T. Hyvönen, E. Falck, and I. Vattulainen. 2004. Lipid bilayers driven to a wrong lane in molecular dynamics simulations by subtle changes in long-range electrostatic interactions. J. Phys. Chem. B. 108:4485–4494. [Google Scholar]
- Petrache, H. I., S. W. Dodd, and M. F. Brown. 2000. Area per lipid and acyl length distributions in fluid phosphatidylcholines determined by 2H NMR spectroscopy. Biophys. J. 79:3172–3192. [DOI] [PMC free article] [PubMed] [Google Scholar]
- Pike, L. J. 2004. Lipid rafts: heterogeneity on the high seas. Biochem. J. 378:281–292. [DOI] [PMC free article] [PubMed] [Google Scholar]
- Ramstedt, B., P. Leppiäki, M. Axberg, and J. P. Slotte. 1999. Analysis of natural and synthetic sphingomyelins using high-performance thin-layer chromatography. Eur. J. Biochem. 266:997–1002. [DOI] [PubMed] [Google Scholar]
- Ramstedt, B., and P. Slotte. 2002. Membrane properties of sphingomyelin. FEBS Lett. 531:33–37. [DOI] [PubMed] [Google Scholar]
- Sackmann, E. 1995. Physical basis of self-organization and function of membranes: physics of vesicles. In Structure and Dynamics of Membranes: From Cells to Vesicles. R. Lipowsky and E. Sackmann, editors. Elsevier, Amsterdam, The Netherlands. 213–304.
- Saiz, L., and M. L. Klein. 2002. Computer simulation studies of model biological membranes. Acc. Chem. Res. 35:482–489. [DOI] [PubMed] [Google Scholar]
- Schmidt, C. F., Y. Barenholz, and T. E. Thompson. 1977. A nuclear magnetic resonance study of sphingomyelin in bilayer systems. Biochemistry. 16:2649–2656. [DOI] [PubMed] [Google Scholar]
- Sciortino, F., P. H. Poole, H. E. Stanley, and S. Havlin. 1990. Lifetime of the bond network and gel-like anomalies in supercooled water. Phys. Rev. Lett. 64:1686–1689. [DOI] [PubMed] [Google Scholar]
- Scott, H. L. 2002. Modeling the lipid component of membranes. Curr. Opin. Struct. Biol. 12:495–502. [DOI] [PubMed] [Google Scholar]
- Seelig, A., and J. Seelig. 1974. The dynamic structure of fatty acyl chains in a phospholipid bilayer measured by deuterium magnetic resonance. Biochemistry. 13:4839–4845. [DOI] [PubMed] [Google Scholar]
- Seelig, J., and N. Waespe-Sarcevic. 1978. Molecular order in cis and trans unsaturated phospholipid bilayers. Biochemistry. 17:3310–3315. [DOI] [PubMed] [Google Scholar]
- Shinoda, W., and S. Okazaki. 1998. A Voronoi analysis of lipid area fluctuation in a bilayer. J. Chem. Phys. 109:1517–1521. [Google Scholar]
- Simon, S. A., and T. J. McIntosh. 1989. Magnitude of the solvation pressure depends on dipole potential. Proc. Natl. Acad. Sci. USA. 86:9263–9267. [DOI] [PMC free article] [PubMed] [Google Scholar]
- Simons, K., and E. Ikonen. 1997. Functional rafts in cell membranes. Nature. 387:569–571. [DOI] [PubMed] [Google Scholar]
- Simons, K., and D. Toomre. 2000. Lipid rafts and signal transduction. Nat. Rev. Mol. Cell Biol. 1:31–41. [DOI] [PubMed] [Google Scholar]
- Steinbauer, B., T. Mehnert, and K. Beyer. 2003. Hydration and lateral organization in phospholipid bilayers containing sphingomyelin: a 2H-NMR study. Biophys. J. 85:1013–1024. [DOI] [PMC free article] [PubMed] [Google Scholar]
- Sun, F. 2002. Constant normal pressure, constant surface tension, and constant temperature molecular dynamics simulation of hydrated 1,2-dilignoceroylphosphatidylcholine monolayer. Biophys. J. 82:2511–2519. [DOI] [PMC free article] [PubMed] [Google Scholar]
- Talbott, C. M., I. Vorobyov, D. Borchman, K. G. Taylor, D. B. DuPré, and M. C. Yappert. 2000. Conformational studies of sphingolipids by NMR spectroscopy. II. Sphingomyelin. Biochim. Biophys. Acta. 1467:326–337. [DOI] [PubMed] [Google Scholar]
- Tieleman, D. P., and H. J. C. Berendsen. 1996. Molecular dynamics simulations of a fully hydrated dipalmitoylphosphatidylcholine bilayer with different macroscopic boundary conditions and parameters. J. Chem. Phys. 105:4871–4880. [Google Scholar]
- Tieleman, D. P., and H. J. C. Berendsen. 1998. A molecular dynamics study of the pores formed by Escherichia coli OmpF porin in a fully hydrated palmitoyloleoylphosphatidylcholine bilayer. Biophys. J. 74:2786–2801. [DOI] [PMC free article] [PubMed] [Google Scholar]
- Tieleman, D. P., S. J. Marrink, and H. J. C. Berendsen. 1997. A computer perspective of membranes: molecular dynamics studies of lipid bilayer systems. Biochim. Biophys. Acta. 1331:235–270. [DOI] [PubMed] [Google Scholar]
- Tu, K., D. J. Tobias, K. Blasie, and M. L. Klein. 1996. Molecular dynamics investigation of the structure of a fully hydrated gel-phase dipalmitoylphosphatidylcholine bilayer. Biophys. J. 70:595–608. [DOI] [PMC free article] [PubMed] [Google Scholar]
- van Gunsteren, W. F., P. Krüger, S. R. Billeter, A. E. Mark, A. A. Eising, W. R. P. Scott, P. H. Hüneberg, and I. G. Tironi. 1996. Biomolecular simulation: the GROMOS96 manual and user guide. Biomos, Groningen and Hochsuchulverlag AG, Germany and er ETH Zürich, Zurich, Switzerland.
- Vaz, W. L. C., R. M. Clegg, and D. Hallmann. 1985. Translational diffusion of lipids in liquid crystalline phase phosphatidylcholine multibilayers: a comparison of experiment with theory. Biochemistry. 24:781–786. [DOI] [PubMed] [Google Scholar]
- Zachowski, A. 1993. Phospholipids in animal eukaryotic membranes: transverse asymmetry and movement. Biochem. J. 294:1–14. [DOI] [PMC free article] [PubMed] [Google Scholar]
Associated Data
This section collects any data citations, data availability statements, or supplementary materials included in this article.