Abstract
Closing linear poly(ethylene glycol) (PEG) into a circular “crown” dramatically changes its dynamics in the α-hemolysin channel. In the electrically neutral crown ether (C2H4O)6, six ethylene oxide monomers are linked into a circle that gives the molecule ion-complexing capacity and increases its rigidity. As with linear PEG, addition of the crown to the membrane-bathing solution decreases the ionic conductance of the channel and generates additional conductance noise. However, in contrast to linear PEG, both the conductance reduction (reporting on crown partitioning into the channel pore) and the noise (reporting on crown dynamics in the pore) now depend on voltage strongly and nonmonotonically. Within the whole frequency range accessible in channel reconstitution experiments, the noise power spectrum is “white”, showing that crown exchange between the channel and the bulk solution is fast. Analyzing these data in the framework of a Markovian two-state model, we are able to characterize the process quantitatively. We show that the lifetime of the crown in the channel reaches its maximum (a few microseconds) at about the same voltage (∼100 mV, negative from the side of protein addition) where the crown's reduction of the channel conductance is most pronounced. Our interpretation is that, because of its rigidity, the crown feels an effective steric barrier in the narrowest part of the channel pore. This barrier together with crown-ion complexing and resultant interaction with the applied field leads to behavior usually associated with voltage-dependent binding in the channel pore.
INTRODUCTION
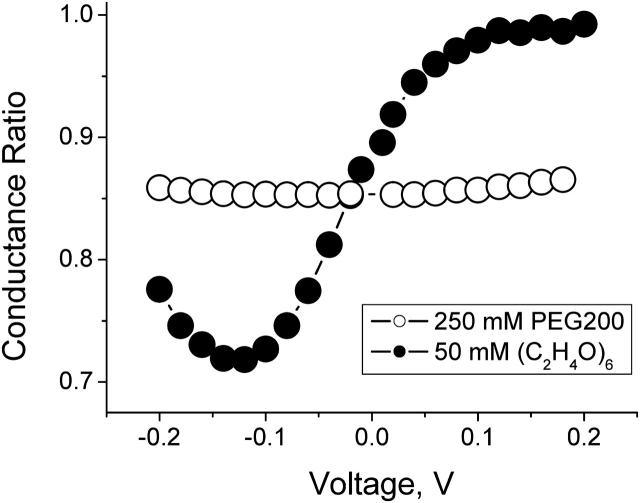
Crown ether molecules can be thought of as cyclic versions of linear poly-(ethylene glycol) (PEG) molecules. Disregarding end groups, crown ether (C2H4O)6 differs from its linear counterpart only in its topology. Our experiments with single α-hemolysin channels reconstituted in planar lipid bilayers reveal dramatic differences between the crown and PEG effects on the channel conductance. Fig. 1 compares effects of the two compounds on the channel conductance in 1 M KCl aqueous solutions at their symmetrical addition on both sides of the bilayer. The crown effect on the small-ion current through the channel is highly voltage dependent and asymmetric, whereas the PEG-induced conductance reduction is only slightly sensitive to the voltage. The effect of the crown increases >10-fold with the decreasing positive voltage and shows a characteristic turnover behavior at high negative voltages. Thus, changing topology of the molecule by closing linear PEG into a circle leads to dramatic changes in the effect of the molecule on the channel conductance.
FIGURE 1.
Comparison of the effects of the crown ether (C2H4O)6 (•) and poly(ethylene glycol) (PEG) with molecular weight of 200 (○) on the conductance of a single α-hemolysin channel reconstituted in a planar bilayer. Both the crown and PEG were added symmetrically to 1 M KCl solutions on both sides of the membrane. In both cases conductance is normalized to its value in pure salt solution. To facilitate the comparison, PEG was applied in a fivefold higher concentration than the crown.
The focus of this article is on the voltage-dependent exchange of the crown between the channel pore and the bulk solution, the process underlying the crown effect on conductance. Using experimentally measured current-voltage dependences and the power spectral densities of the current fluctuations, we are able to extract parameters of the exchange kinetic. We find that the crown residence time in the channel shows a turnover behavior as a function of the applied voltage. An explanation of the turnover behavior in the framework of a voltage-biased diffusion model is suggested whereas the complete theory will be published separately.
Large ion channels are key structural elements of metabolite exchange between different cellular compartments and between cells (Nikaido, 2003). Understanding of the main physical principles and structural aspects involved in large-channel permeability and selectivity is still far from being satisfactory, and our progress relies on the detailed knowledge of the transport phenomenology. This knowledge can be obtained in experiments with single channels reconstituted into planar bilayers by studying the effect of penetrating molecules on the ionic current through the channel. High-resolution conductance recording and appropriate statistical analyses allow one to quantitatively evaluate solute partitioning into, and dynamics within, the confines of ion channel aqueous pores (Bayley and Martin, 2000; Bezrukov, 2000).
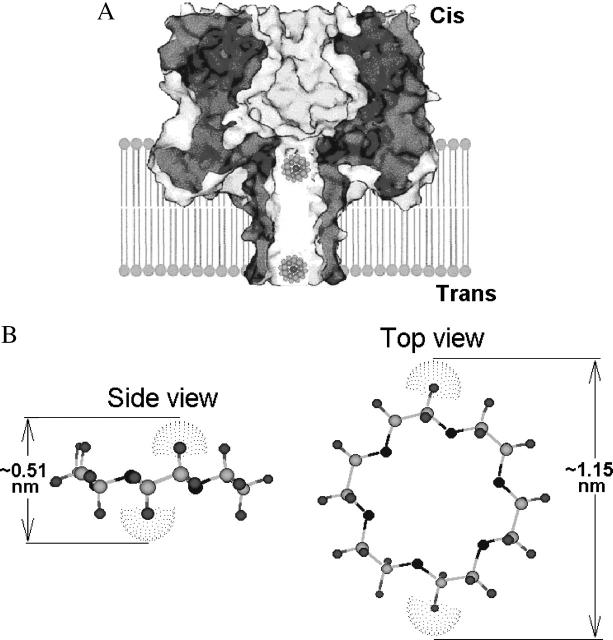
α-Hemolysin is one of the toxins produced by Staphylococcus aureus. The ability of this 33.2-kDa protein to form channels in planar lipid bilayers was discovered more than 20 years ago (Krasilnikov et al., 1980, 1981). The three-dimensional crystal structure of the channel is now known with high resolution (Gouaux et al., 1994; Song et al., 1996). According to the crystal structure, the channel is comprised of seven monomers – a result recently confirmed in electrophysiological experiments with single α-hemolysin channels reconstructed into planar lipid bilayers (Krasilnikov et al., 2000). The geometry of the water-filled lumen of such reconstituted channels and their asymmetrical position with respect to the membrane plane were also studied (Krasilnikov et al., 1988; Merzlyak et al., 1999). There are two distinct regions of the lumen of the channel (Fig. 2 A). On the cis-side (which is the side of the protein addition) the channel has a large cavity, which measures ∼4.6 nm in the internal diameter and is mainly located outside the membrane. In the transmembrane domain, the channel lumen narrows to form a 14-stranded β-barrel with an average internal diameter of ∼2.0 nm. These two domains are separated by a constriction zone whose diameter is ∼1.4 nm. α-Hemolysin channel is recognized as a highly promising tool for biotechnology (Bayley, 1995; Kasianowicz, et al., 1996; Braha et al., 1997; Gu et al., 1999, 2000; Bayley and Martin, 2000; Howorka et al., 2001; Cheley et al., 2002; Nakane et al., 2003; Meller, 2003).
FIGURE 2.
Schematic illustrations of the channel and crown. (A) α-Hemolysin channel in the presence of the crown ether. The stem region of the channel is a cylindrical β-sheet barrel. Cartoon shows the relative sizes of the open channel and crown/K+ complexes. Adapted from Gu et al. (2000). (B) Ball-and-stick model of the crown ether. CS Chem3D Pro (CambridgeSoft, Cambridge, MA) was used to build the model and to draw the figure. The atoms are represented with the following color scheme: O (black), H (gray), and C (light gray). Van der Waals spheres (dotted) are shown for two opposite H atoms. The largest and smallest sizes of the crown molecule are 1.15 nm and 0.51 nm, correspondingly. The structure is in agreement with crystallographic data (Steed and Atwood, 2000).
Here we investigate interactions between the α-hemolysin channel and the crown ether 1,4,7,10,13,16-hexaoxacyclooctane (18-crown-6) whose structure is shown in Fig. 2 B. Studies of the crown ethers' effects on the conductance of ion channels are important because the crown ether superfamily was shown to exhibit a range of pharmacological effects (Pressman, 1976; Brown and Foubister, 1983; Kolbeck et al., 1992; Gurbanov et al., 1993; Borrel et al., 1995). The 18-crown-6 consists of six ethylene oxide -O-CH2-CH2- units joined covalently in a macrocyclic ring. Neglecting the end groups of linear poly(ethylene glycol) (PEG), the only difference between the two molecules is in their topology.
The crown does not possess ionizable groups and, therefore, belongs to nonelectrolytes. However, it has a ring of oxygen atoms surrounded by an external hydrophobic ring. These structural features enable the crown to form stable complexes with alkaline metal ions (Pedersen, 1968, 1988; Ozutsumi and Ishiguro, 1992) in which the metal ion binds near the center of the oxygen ring.
In our previous studies of the PEG effects on the α-hemolysin channel conductance it was shown that polymer partitioning is size (Krasilnikov et al., 1988, 1992; Bezrukov at al., 1996) and concentration (Krasilnikov and Bezrukov, 2004) dependent. Polymer partition coefficient was deduced from the effect of polymers on channel conductance. Added at the same weight concentration, differently sized polymers reduce the bulk solution conductivity to a similar extent (e.g., Krasilnikov, 2002; Stojilkovic et al., 2003). However, they act on channel conductance in a size-dependent manner. When polymer concentrations are not too high, polymer coils that are much larger than the diameter of the channel pore are excluded from the pore. They influence channel conductance only at access areas, producing relatively small effects (Bezrukov and Vodyanoy, 1993). Polymers that are significantly smaller than the pore diameter are able to partition into the pore freely. Small PEG with molecular weights of 200–300 reduce channel conductance approximately to the same extent as they reduce bulk solution conductivity. Their effect on the channel conductance is only weakly voltage dependent as shown in Fig. 1.
In contrast, we find that addition of the crown (molecular weight of 264) influences ion current through the α-hemolysin channel in a pronounced voltage-dependent manner (Fig. 1). As the applied voltage is changed from −200 mV to +200 mV, the effect of the crown on channel conductance varies >10-fold. Importantly, this channel-imposed asymmetry is seen at otherwise symmetrical conditions when the crown is added on both sides of the membrane in equal concentrations. The effect on the conductance is not monotonic in the applied voltage: for 1 M KCl it has a maximum at potentials close to −120 mV.
From the current-voltage dependences and current fluctuations around the steady-state value (open channel noise) we learn about the kinetics of crown partitioning in the channel. The exchange of the crown between the channel pore and the bulk is so fast that the power spectrum of the crown-induced noise is “white”, that is, frequency independent, over the whole frequency range accessible in reconstitution experiments. Analyzing the low-frequency part of the spectrum together with the crown effect on the average conductance we are able to determine the lifetime of the crown in the channel. This time increases from hundreds of nanoseconds at positive (from the cis-side) voltages to several microseconds at ∼−100 mV where the crown effect on the channel conductance is maximal. Further increase in magnitude of the negative voltage decreases the lifetime to ∼0.5 μs at −200 mV. This suggests that the crown translocation through the channel is field dependent (Woodhull, 1973; Hille, 1992; Tikhonov and Magazanik, 1998).
The strong voltage dependence of the crown effects and its marked asymmetry indicate that it is the charged crown/K+ complex that is responsible for the blockage. We hypothesize that closing a linear polymer molecule into a circle affects its translocation because the complex of the cyclic molecule with a potassium ion sees an effective barrier in the channel. This barrier together with the applied voltage distribution along the channel axis is responsible for the observed asymmetric voltage dependence.
MATERIALS AND METHODS
Diphytanoyl phosphatidylcholine (DPhPC) was purchased from Avanti Polar Lipids (Alabaster, AL). The wild type of S. aureus α-hemolysin was a generous gift of Dr. Hagan Bayley (Texas A&M University). Crown ether 1,4,7,10,13,16-hexaoxacyclooctane (18-crown-6) was purchased from Sigma-Aldrich (Allentown, PA). Other chemicals were of analytical grade.
Bilayer lipid membranes were formed at room temperature of 23 ± 2°C using the lipid monolayer opposition technique from 10 mg/ml solutions of DPhPC in pentane on a 70-μm diameter aperture in the 15-μm-thick Teflon partition as previously described (e.g., Krasilnikov and Bezrukov, 2004 after Montal and Mueller, 1972). The total capacitance was 90–100 pF, the film capacitance was close to 50 pF. The membrane potential was maintained using Ag/AgCl electrodes in 3 M KCl, 2% agarose bridges assembled within standard 200-μl pipette tips.
Experiments were done using an Axopatch 200B amplifier (Axon Instruments, Foster City, CA) in the voltage clamp mode. Currents were filtered by a low-pass eight-pole Butterworth filter (Model 9002, Frequency Devices, Haverhill, MA) at 15 kHz and recorded simultaneously by a video cassette recorder operated in a digital mode and directly saved into the computer memory with a sampling frequency of 50 kHz. Amplitude and power spectrum noise analyses were performed using software developed in house.
Small amounts of α-hemolysin from a diluted stock solution of 50 μg/ml were added to the cis-side of the chamber. The final concentration of the protein in the membrane-bathing solution was ∼100 pM. Unless stated otherwise, the standard membrane-bathing solution used in the bilayer experiments contained 1 M KCl and 5 mM Tris with pH adjusted to 7.5 by citric acid. Potential is defined as positive when it is greater at the side of the protein addition.
EXPERIMENTAL RESULTS
Conductances of single α-hemolysin channels show certain dispersion from channel to channel (e.g., Krasilnikov et al., 1988; Krasilnikov and Bezrukov, 2004). For example, at 23°C in 1 M KCl solutions at −40 mV and neutral pH it is 960 ± 70 pS. Therefore, to measure the conductance changes with appropriate accuracy, the effect of the crown in each experiment was evaluated by comparing conductance of the same single channel in crown-free and crown-containing solutions.
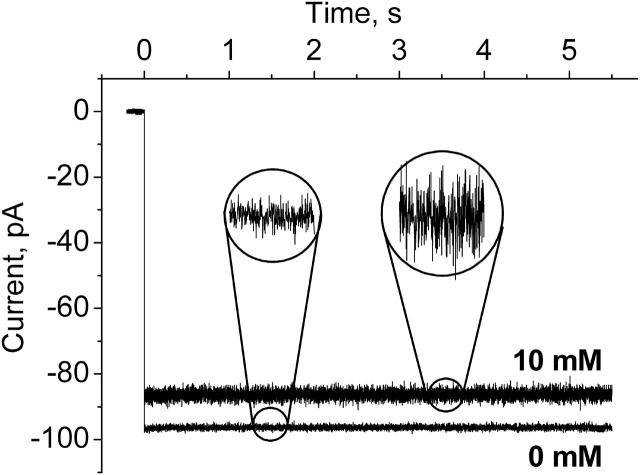
Fig. 3 shows the current through a single channel before and after symmetric addition of the crown to 10-mM concentration in the membrane-bathing solutions on both sides of the membrane. There are two crown-induced effects: a decrease in the mean current and an increase in the current noise. Both effects strongly depend on the applied voltage. They are considerably larger for the negative sign of the applied voltage. In addition, the effects depend on the salt concentration.
FIGURE 3.
Ion currents through a single α-hemolysin channel as altered by the presence of 10 mM of the crown ether. The recordings were taken from the same single channel before and after crown addition to 1 M KCl buffer solution. At time zero potential was switched from 0 to −100 mV. Note that in the presence of the crown the mean current decreases while the current noise grows. Current recordings are filtered by averaging over 0.5-ms intervals. The insets show current recordings at a fourfold finer scale.
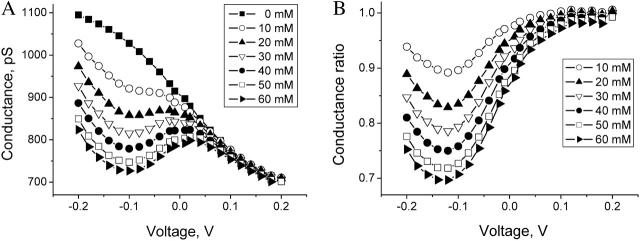
Fig. 4 A demonstrates the voltage dependence of the channel conductance for several crown concentrations. The uppermost curve shows that even in the absence of the crown the channel is not Ohmic—its conductance depends on the applied voltage. To make the effect of crown addition seen more clearly, Fig. 4 B gives the ratio of the channel conductance in the presence of the crown to that in the crown-free solution. The crown-induced conductance reduction is nonmonotonic in the applied voltage. In 1 M KCl solutions the crown effect reaches its maximum around −120 mV.
FIGURE 4.
Effect of the crown on single-channel ionic conductance is strongly voltage dependent. (A) Channel conductance in 1 M KCl solutions at different crown concentrations (see the inset). (B) The same data replotted as a ratio of channel conductance in the presence of the crown to that in the crown-free solution. Application of negative voltages (negative from the cis-side; see Fig. 2 A) favors crown-induced conductance reduction. The effect of the crown saturates with the crown concentration—the increment of conductance reduction is smaller at the 50–60-mM concentration step than at the 0–10-mM step.
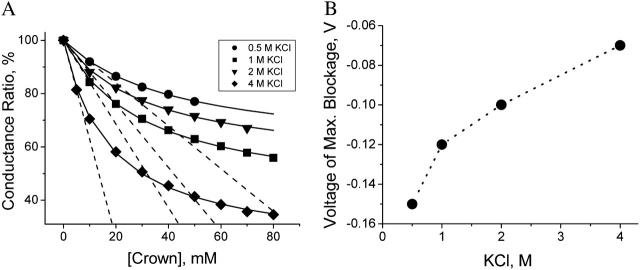
The dependence of the crown-induced conductance reduction on KCl concentration is illustrated by the results shown in Fig. 5. The ratio of the channel conductance to its value in the absence of the crown at voltages corresponding to the maximum of the crown-induced effect in solutions of different KCl concentrations is shown in Fig. 5 A as a function of the crown concentration. It is seen that the crown effect on channel conductance is increased by increasing salt concentration. This result may indicate the strengthening of hydrophobic interaction between the crown and the channel—the phenomenon described earlier for poly(ethylene glycol)s (Bezrukov et al., 1996; Merzlyak et al., 1999).
FIGURE 5.
Crown effects on the channel conductance at different salt concentrations. (A) Ratios of the channel conductance in the presence of the crown (at the voltages corresponding to maximum effect; see Fig. 4) to the conductance in crown-free solutions at different salt concentrations (the data are shown by different symbols as explained in the inset). Dashed lines demonstrate the crown effect on the channel conductance as a linear extrapolation from small crown concentrations. Solid lines illustrate the fitting of the channel conductance data to the first-order binding isotherm. Data points represent averages over at least three experiments for the voltages corresponding to the maximum in the crown-induced effect. (B) The voltage where the maximum in the crown-induced effect on channel conductance is reached (see Fig. 4) in KCl solutions containing 10 mM of the crown as a function of the salt concentration.
Fig. 5 B shows how the optimal maximum effect depends on the salt concentration in 10-mM crown solutions. As the salt concentration increases, the maximum effect of the crown on the channel conductance is reached at smaller (in magnitude) negative voltages. Identical dependences on salt concentration were found at other crown concentrations.
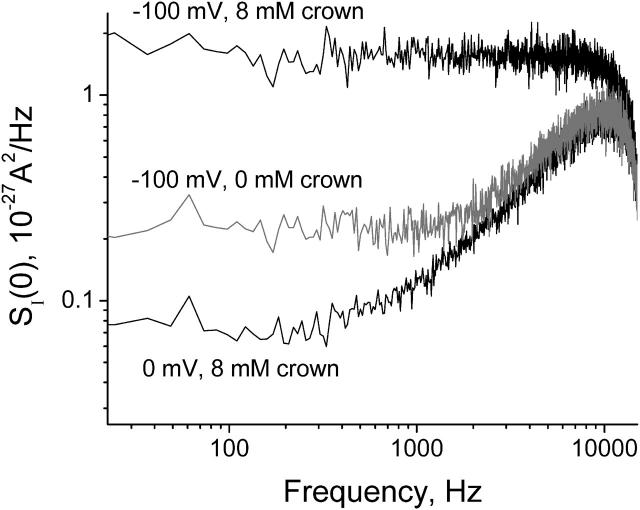
The crown-induced reduction in the average ionic current through the channel is accompanied by generation of excess noise (Fig. 3). Fig. 6 gives the power spectral density of the current in the presence of 10 mM crown at −100 mV applied potential (top trace) versus the background measured at 0 mV (bottom trace). Equilibrium noise of a single channel with the relatively high conductance (∼1 nS in 1 M KCl) contributes significantly to the level of the background noise (Krasilnikov and Bezrukov, 2004). However, in the particular case of the bottom curve, most of the noise comes from the amplifier's feedback resistor. The rising part of the power spectrum is related to finite electrode and electrolyte resistance, amplifier noise, and membrane and film capacitance (Sigworth, 1995). The middle trace shows noise of the channel at −100 mV in the crown-free solution. It exceeds the equilibrium channel noise significantly due to modulation of the channel conductance by fluctuating charges of ionizable residues (Bezrukov and Kasianowicz, 1993; Kasianowicz and Bezrukov, 1995). The sharp decrease seen in all three spectra at frequencies >10,000 Hz is due to anti-aliasing signal filtering (Materials and Methods).
FIGURE 6.
The power spectral density of current noise of a single open α-hemolysin channel in the presence of 10 mM crown at 0 (bottom curve) and at −100 mV (top curve) and in crown-free 1 M KCl solutions at −100 mV (middle curve).
Fig. 6 shows that the spectrum of the crown-induced noise is “white” (frequency independent) up to frequencies of ∼10 kHz. The absence of dispersion at these frequencies means that the process of crown exchange between the channel pore and the bulk is fast in the sense that the characteristic relaxation time is much smaller than the inverse of the highest frequency in the measurement range, 1/2πfmax ≈ 20 μs. For this reason we build our analysis on the low-frequency spectral density,  studied as a function of the applied voltage at different crown concentrations.
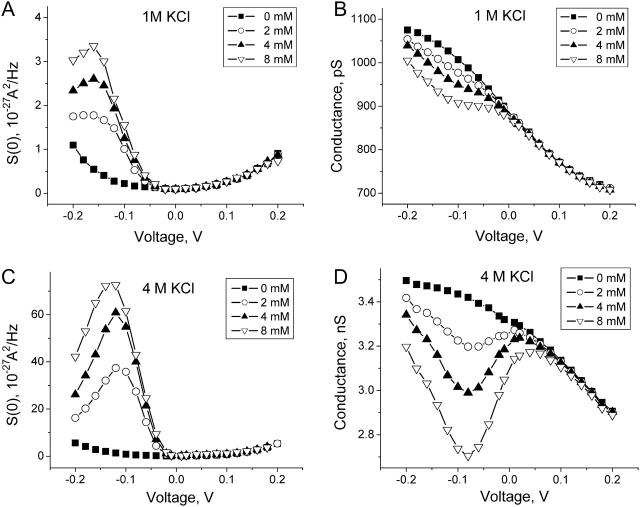
Fig. 7 compares results of the noise and conductance measurements at small crown concentrations obtained in 1 M KCl (A and B) with those in 4 M KCl (C and D). The low-frequency spectral density,  was calculated as the average between frequencies 100 Hz < f < 1000 Hz with the background subtracted. It is seen that both the conductance reduction and the excess noise are much stronger at the higher salt concentration.
FIGURE 7.
The low-frequency power spectral density of the voltage-dependent current noise (A) and the conductance of the channel (B) in 1 M KCl at different crown concentrations as functions of the applied voltage. The crown effects are much stronger in 4 M KCl (C and D).
DISCUSSION
Noise analysis usually involves determination of the “corner frequency” that immediately relates the noise spectrum with the characteristic time of a system (Conti and Wanke, 1975; Neher and Stevens, 1977; DeFelice, 1981). In the case studied here this frequency is out of reach. Fig. 6 shows that within the range of accessible frequencies the spectrum is white. Using an alternative language, the experimental points contributing to the noise track in Fig. 3 are uncorrelated in time (except for the correlations introduced by the anti-aliasing filter). Analysis of such data sets presents a special challenge (e.g., Boguna et al., 2001).
In principle, the white part of the spectrum allows one to estimate mobility of a particle in a channel using a concept of “molecular Coulter counting” (Bezrukov et al., 1994; Rostovtseva and Bezrukov, 1998; Bezrukov, 2000). However, in practically important cases of inhomogeneous pores, as in this study (Fig. 2 A), this approach gives an order of magnitude estimate only. In contrast to ATP molecules in VDAC channel (Rostovtseva and Bezrukov, 1998), formal application of this approach to the results shown in Fig. 7 yields the voltage-dependent values for the crown mobility in the channel. As the applied voltage changes from −200 mV to +200 mV, the calculated effective diffusion coefficient varies ∼10-fold staying from two to one orders of magnitude smaller than its bulk value of 4.8 × 10⁻¹⁰ m2s−1 (Yuldasheva et al., 2003).
Two-state model
In this article the low-frequency part of the noise spectrum is used to determine kinetic parameters of the crown exchange between the channel and the bulk in the framework of a two-state model. This model was used previously to estimate the lifetime of PEG molecules in alamethicin channels (Bezrukov and Vodyanoy, 1993). The model assumes that the blockage effect on the channel conductance can be described as a two-state Markov process. We start with the Machlup's original formula for the power spectral density of such a process (Machlup, 1954). In our case it can be written in the form:
 |
(1) |
where f is frequency,  is the mean lifetime of the channel in the crown-blocked state,
  is the mean time between successive blockages,
  is the change in the current induced by a single-molecule blockage event, and
  is the relaxation time. Blockage probability in this model is given by
 |
(2) |
According to Eqs. 1 and 2 time  can be written as
 |
(3) |
where  stands for the low-frequency limit of the power spectral density. In the framework of the model the decrease in the average ionic current through the channel,
  is related to the blockage probability by
  so that
 |
(4) |
Therefore, the mean lifetime of the crown-blocked state is given by
 |
(5) |
 and
and  are directly measured in experiment. The only uncertain parameter required to find
  is the amplitude of the current drop in an elementary blockage event,
  In principle, one can find this parameter by measuring the average current reduction,
  in the limit of high crown concentrations, where
  tends to zero and the probability of blockage given in Eq. 2 approaches unity. For example, extrapolation of the 1 M KCl curve in Fig. 5 A to infinite crown concentrations yields a value of ∼0.4 for the relative current reduction,
  where I is the ionic current through the channel in crown-free solution. In 4 M KCl solutions this number is close to 0.65.
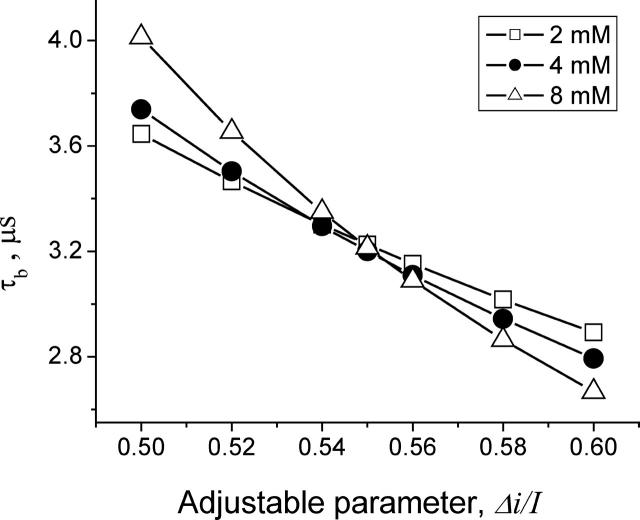
However, one might expect that at high crown concentrations, more than one crown molecule is involved in the blockage process. If so, our two-state model fails. With this in mind, we chose to keep  as an adjustable parameter. For 4 M KCl we calculated lifetimes of the crown in the channel by means of Eq. 5 using the results of the noise and conductance measurements obtained from the same single channel at small crown concentrations of 2, 4, and 8 mM (Fig. 7, C and D). The lifetimes for the data set at −80 mV calculated for different values of parameter
  are presented in Fig. 8. It is seen that they are indeed sensitive to the choice of this parameter. At the same time, within the framework of the accepted model, the lifetime of the crown in the channel should be independent of the crown concentration. Guided by this criterion we find that the best choice for the value of the ratio
  is 0.55 (Fig. 8). This analysis was repeated at several negative voltages from the range of −200 mV < V < − 40 mV. The ratio
  was found to be voltage independent within the accuracy of the measurements,
FIGURE 8.
Crown lifetime from the 4 M KCl data at −80 mV for 2 mM, 4 mM, and 8 mM crown concentrations calculated according to Eq. 5 for different values of the adjustable parameter
Using this procedure the adjustable parameter  was also found for other salt concentrations. The results are:
  at 1 M KCl and
  at 2 M KCl. Together with 0.55 found for 4 M KCl, these values are in fair agreement with
  values determined from the conductance versus crown concentration data (Fig. 5 A), though they are systematically smaller. Fitting data in Fig. 5 A to a simple binding isotherm and extrapolating to the infinite crown concentration we find ∼20% higher estimates for
 This systematic deviation suggests that at the high crown concentrations a second crown molecule is involved in channel blockage. However, at the relatively small crown concentrations (≤8 mM) used in our noise analysis, the blockage is well described by our simple two-state Markov model.
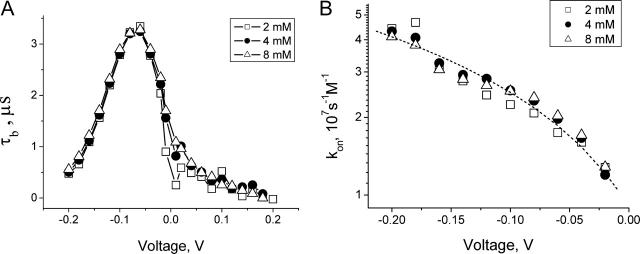
Knowing parameter  we can now calculate the crown residence time in the channel by Eq. 5 and analyze its dependence on the applied voltage. The results for 2-, 4-, and 8-mM crown concentrations in 4 M KCl are shown in Fig. 9 A. One can see that the three curves are close to one another. The deviations between the points are within the expected combined errors of noise and conductance measurements. Good agreement between the three curves indicates self-consistency of our analysis of the experimental data based on the two-state model.
FIGURE 9.
Kinetic parameters of the crown blockage of the α-hemolysin pore as functions of applied voltage. (A) Lifetimes of the crown in the channel in 4 M KCl solutions at different concentrations of the crown as functions of applied transmembrane voltage. Adjustable parameter in Eq. 5 is chosen as  = 0.55. (B) On-rate constant of crown binding (kon) calculated for 2, 4, and 8 mM of the crown in 4 M KCl membrane-bathing solution. The dashed curve is a first-order regression for the data.
The most interesting feature of the voltage dependence of the residence time shown in Fig. 9 A is the turnover behavior. The lifetime of the crown in the channel reaches its maximum of 3.3 μs at from −60 to −80 mV. Similar behavior was found in 1 and 2 M KCl solutions (data not shown). It turns out that the maximum residence time decreases at lower salt concentrations. The voltages corresponding to the maxima shift to more negative values. The maximum residence time in 1 M KCl is about twofold smaller than this time in 4 M KCl solution.
Crown-induced noise and conductance reduction allow us to determine another important parameter: the average time between successive crown bindings,  From Eq. 2 it follows that
 |
(6) |
where the blockage probability p, given in Eq. 4, can be readily determined if the parameter  is known. The on-rate constant,
  can then be calculated as
  Its dependence on voltage in 4 M KCl solutions is shown in Fig. 9 B. It is seen that the on-rate constant increases with the negative voltage magnitude. Thus, our analysis of the low-frequency, white part of the noise spectrum makes it possible to determine both kinetic parameters of the two-state model.
Turnover of the residence time
One of the most interesting results of our analysis is the turnover behavior of the average residence time of the crown in the channel, considered as a function of the applied voltage (Fig. 9 A). To rationalize this behavior we have to make a step beyond the scope of our two-state model and to consider detailed dynamics of the crown in the channel in the presence of the external voltage. Realistic analysis of such dynamics requires not only the fine structural information about the channel pore but also the knowledge of electric field distribution in the channel, including fields from the charges on the pore-forming protein molecules. Instead, we put forward a one-dimensional diffusion model that grasps the most important qualitative features of the phenomenon. The model predicts the turnover behavior of the average lifetime of the crown in the channel.
When evaluating the average lifetime we take into account the fact that the crown forms a positively charged complex with a K+ ion. Based on the channel geometry (Fig. 2 A) it is reasonable to assume that the complex reduces channel conductance mainly when it is located in the narrow part of the pore. The time spent by the complex in this part is very sensitive to the sign of the applied voltage. Negative voltages drag the complex into the channel from the trans-side. To traverse the channel, the complex has to pass through the constriction zone that forms an almost impermeable barrier for the complex at moderate voltages. To escape from the same side from which the complex entered, it has to diffuse against the driving force produced by the applied voltage. Thus, the complex is effectively trapped at the constriction zone. However, at high enough voltages complexes pass through the constriction zone and translocate. The turnover of the average lifetime is determined by the competition between the two scenarios.
The situation is quite different at positive voltages. Because the cis-side vestibule of the pore is wide, the complex-induced conductance reduction is small. In addition, the voltage mainly drops in the narrow part of the channel. As a consequence, the voltage-induced potential well for the complex in the cis-side vestibule is relatively shallow so that the complex lifetime in such a well is short. These arguments are supported by the results obtained at asymmetrical crown addition (data not shown). At negative voltages, within the accuracy of our measurements, the effect of crown addition only to the trans-side of the membrane was the same as for symmetrical addition. At positive voltages the effect of the cis-side addition was measurable but small. At +200 mV, 50 mM of the crown in 1 M KCl solutions decreased channel conductance by ∼5%.
We have developed a theory that describes the dynamics of the complex in the narrow part of the channel in the framework of a one-dimensional diffusion model. For impermeable barriers our theory predicts only monotonic decrease of the complex lifetime in the channel with voltage, whereas for permeable barriers, the theory predicts a turnover behavior. In the case of impermeable barriers and high negative voltages,  where e is the charge of the complex and k and T are the Boltzmann constant and the absolute temperature, the average lifetime is given by
 |
(7) |
Here l is the distance between the channel opening and the constriction zone and V is the voltage drop at this distance. Substituting l = 5 nm (half the channel length; Fig. 2 A), D = 4.8 × 10⁻¹⁰ m2s−1 (Yuldasheva et al., 2003), and V ≈ −100 mV we arrive at  , which is only an order of magnitude smaller than the experimental value at this voltage that is close to the critical one. In this estimate we have used the bulk value of the complex diffusion coefficient. However, in reality, a particle whose size is comparable to the pore aperture can be greatly slowed down by interactions with the pore walls. If we account for this “restricted diffusion” (Bean, 1972; Bezrukov, 2000) by using a smaller value of the diffusion coefficient, the estimation in Eq. 7 gets close to the experimental value. Increase of the residence time with the salt concentration may be due to the increasing interaction of the crown with the pore-lining residues of the protein, analogously to the salt-dependent PEG-protein interactions (Timasheff, 1993).
In several recent studies with the α-hemolysin channel (Sanchez-Quesada et al., 2000; Cheley et al., 2002; Gu et al., 2003) it has been suggested that different molecules, both neutral and charged, can bind in the channel pore near the constriction zone. Our theory suggests an alternative. In our model of voltage-biased diffusion, a “binding site” is effectively created by the steric constriction and the external electric field that forces the complex against the constriction.
CONCLUDING REMARKS
This article is focused on the effect of the crown ether (C2H4O)6 on ionic conductance of single α-hemolysin channels reconstituted into planar lipid bilayers. By measuring the reduction of the channel conductance and the power spectral density of current fluctuations induced by the crown, we analyze how the effect depends on the applied voltage and the crown and salt concentrations. We find that the blockage efficiency of the crown exhibits a strong dependence on both the sign and magnitude of the applied voltage and increases at higher salt concentrations.
To rationalize our experimental results we assume that the channel has two conductance states: open state and partially blocked state in which the current through the channel is reduced because of the presence of the crown. We additionally assume that transitions between the two states are Markovian. With these assumptions we have determined all parameters of the model from the experimental data and analyzed their dependence on the voltage. One of the most interesting results of our analysis is the dependence of the average crown residence time in the channel on the applied voltage, which is nonmonotonic and has a maximum around 100 mV.
We suggest that this behavior can be explained by a model that treats the complex dynamics in the pore in terms of one-dimensional voltage-biased diffusion. The turnover of the residence time is a consequence of a competition between two tendencies: voltage-induced trapping of the crown in the constriction zone and voltage-dependent passage of the crown through this. Indeed, the crown forms a complex with positive ions. Negative voltages drive the complex from the trans-side into the narrow part of the channel pore. The complex reaches the constriction zone (Fig. 2 A) where it gets stuck because this part of the pore is almost impermeable for it. Being at the constriction zone, the complex partially blocks the channel. At not-too-high negative voltages the complex does not pass through the constriction and mostly escapes from the channel moving against the electric field. This is why its lifetime in the channel increases when the negative voltage grows in magnitude. However, high-enough voltages drive the complex through the constriction zone and the complex lifetime in the channel starts to decrease with the voltage magnitude. The diffusion model of voltage-dependent blockage will be discussed in detail elsewhere.
Crown ethers appear to be a promising tool for investigating channel-facilitated membrane transport. At the same time, many aspects of the crown dynamics in the channel remain unclear. The list includes interaction of the crown complex with the pore-forming protein, electric field distribution along the channel, hydration of the complex inside the channel, and the effect of the hydration variation at the channel entrance. Further studies of these aspects will help us to get better understanding of the phenomenon and might prove useful for explaining pharmacological effects of the crown ether superfamily at the molecular level.
Acknowledgments
We thank Adrian Parsegian and Daniel Harries for fruitful discussions.
This study was partially supported by Conselho National de Desenvolvimento Cientifico e Tecnologico (Brazil).
References
- Bayley, H. 1995. Pore-forming proteins with built-in triggers and switches. Bioorg. Chem. 23:340–354. [Google Scholar]
- Bayley, H., and C. R. Martin. 2000. Resistive-pulse sensing: from microbes to molecules. Chem. Rev. 100:2575–2594. [DOI] [PubMed] [Google Scholar]
- Bean, C. P. 1972. The physics of porous membranes—neutral pores. In Membranes. G. Eisenman, editor. Marcel Dekker, New York, NY. 1–54. [PubMed]
- Bezrukov, S. M. 2000. Ion channels as molecular Coulter counters to probe metabolite transport. J. Membr. Biol. 174:1–13. [DOI] [PubMed] [Google Scholar]
- Bezrukov, S. M., and J. J. Kasianowicz. 1993. Current noise reveals protonation kinetics and number of ionizable sites in an open protein ion channel. Phys. Rev. Lett. 70:2352–2355. [DOI] [PubMed] [Google Scholar]
- Bezrukov, S. M., and I. Vodyanoy. 1993. Probing alamethicin channels with water-soluble polymers. Effect on conductance of channel states. Biophys. J. 64:16–25. [DOI] [PMC free article] [PubMed] [Google Scholar]
- Bezrukov, S. M., I. Vodyanoy, R. A. Brutyan, and J. J. Kasianowicz. 1996. Dynamics and free energy of polymers partitioning into a nanoscale pore. Macromolecules. 29:8517–8522. [Google Scholar]
- Bezrukov, S. M., I. Vodyanoy, and V. A. Parsegian. 1994. Counting polymers moving through a single ion channel. Nature. 370:279–281. [DOI] [PubMed] [Google Scholar]
- Boguna, M., L. Kullman, S. M. Bezrukov, A. M. Berezhkovskii, and G. H. Weiss. 2001. Rate constants from uncorrelated single-molecule data. J. Phys. Chem. 105:6246–6250. [Google Scholar]
- Borrel, M. N., M. Fiallo, I. Veress, and A. Garniear-Suillerot. 1995. The effect of crown ethers, tetraalkylammonium salts, and polyoxyethylene amphiphiles on pirarubicin incorporation in K526 resistant cells. Biochem. Pharmacol. 50:2069–2076. [DOI] [PubMed] [Google Scholar]
- Braha, O., B. Walker, S. Cheley, J. J. Kasianowicz, L. Song, J. E. Gouaux, and H. Bayley. 1997. Designed protein pores as components for biosensors. Chem. Biol. 4:497–505. [DOI] [PubMed] [Google Scholar]
- Brown, G. R., and A. J. Foubister. 1983. Anticoccidial activity of crown polyethers. J. Med. Chem. 26:590–592. [DOI] [PubMed] [Google Scholar]
- Cheley, S., L. Q. Gu, and H. Bayley. 2002. Stochastic sensing of nanomolar inositol 1,4,5-trisphosphate with an engineered pore. Chem. Biol. 9:829–838. [DOI] [PubMed] [Google Scholar]
- Conti, F., and E. Wanke. 1975. Channel noise in nerve membranes and lipid bilayers. Quart. Rev. Biophys. 8:451–506. [DOI] [PubMed] [Google Scholar]
- DeFelice, L. J. 1981. Introduction to Membrane Noise. Plenum Press, New York, NY.
- Gouaux, J. E., O. Braha, M. R. Hobaugh, L. Song, S. Cheley, C. Shustak, and H. Bayley. 1994. Subunit stoichiometry of staphylococcal alpha-hemolysin in crystals and on membranes: a heptameric transmembrane pore. Proc. Natl. Acad. Sci. USA. 91:12828–12831. [DOI] [PMC free article] [PubMed] [Google Scholar]
- Gu, L. Q., O. Braha, S. Conlan, S. Cheley, and H. Bayley. 1999. Stochastic sensing of organic analytes by a pore-forming protein containing a molecular adapter. Nature. 398:686–690. [DOI] [PubMed] [Google Scholar]
- Gu, L. Q., S. Cheley, and H. Bayley. 2003. Electroosmotic enhancement of the binding of a neutral molecule to a transmembrane pore. Proc. Natl. Acad. Sci. USA. 100:15498–15503. [DOI] [PMC free article] [PubMed] [Google Scholar]
- Gu, L. Q., M. Dalla Serra, J. B. Vincent, G. Vigh, S. Cheley, O. Braha, and H. Bayley. 2000. Reversal of charge selectivity in transmembrane protein pores by using noncovalent molecular adapters. Proc. Natl. Acad. Sci. USA. 97:3959–3964. [DOI] [PMC free article] [PubMed] [Google Scholar]
- Gurbanov, K. G., A. A. Paperno, N. G. Luk'yanenko, and S. S. Basok. 1993. Anti-ischemic properties of crown ether derivatives. Eksp. Klin. Farmakol. 56:18–21 [in Russian]. [PubMed] [Google Scholar]
- Hille, B. 1992. Ionic Channels of Excitable Membranes, 2nd Ed. Sinauer Associates, Sunderland, UK.
- Howorka, S., S. Cheley, and H. Bayley. 2001. Sequence-specific detection of individual DNA strands using engineered nanopores. Nature Biotechnol. 19:636–639. [DOI] [PubMed] [Google Scholar]
- Kasianowicz, J. J., and S. M. Bezrukov. 1995. Protonation dynamics of the α-toxin ion channel from spectral analysis of pH-dependent current fluctuations. Biophys. J. 69:94–105. [DOI] [PMC free article] [PubMed] [Google Scholar]
- Kasianowicz, J. J., E. Brandin, D. Branton, and D. W. Deamer. 1996. Characterization of individual polynucleotide molecules using a membrane channel. Proc. Natl. Acad. Sci. USA. 93:13770–13773. [DOI] [PMC free article] [PubMed] [Google Scholar]
- Kolbeck, R. C., C. La Neave, A. Aquirre, T. M. Nosek, and K. H. Pannell. 1992. Inotrophic influence of macrocyclic polyethers on tracheal smooth muscle. Pharmacol. Biochem. Behav. 42:645–650. [DOI] [PubMed] [Google Scholar]
- Krasilnikov, O. V. 2002. Sizing channels with polymers. In Structure and Dynamics of Confined Polymers. J. J. Kasianowicz, M. S. Z. Kellermayer, and D. W. Deamer, editors. Kluwer Publishers, Dordrecht, The Netherlands. 97–115.
- Krasilnikov, O. V., and S. M. Bezrukov. 2004. Polymer partitioning from non-ideal solutions into protein voids. Macromolecules. 37:2650–2657. [Google Scholar]
- Krasilnikov, O. V., P. G. Merzlyak, L. N. Yuldasheva, C. G. Rodrigues, S. Bhakdi, and A. Valeva. 2000. Electrophysiological evidence for heptameric stoichiometry of ion channels formed by Staphylococcus aureus alpha-toxin in planar lipid bilayers. Mol. Microbiol. 37:1372–1378. [DOI] [PubMed] [Google Scholar]
- Krasilnikov, O. V., R. Z. Sabirov, V. I. Ternovsky, P. G. Merzliak, and J. N. Muratkhodjaev. 1992. A simple method for the determination of the pore radius of ion channels in planar lipid bilayer membranes. FEMS Microbiol. Immunol. 5:93–100. [DOI] [PubMed] [Google Scholar]
- Krasilnikov, O. V., R. Z. Sabirov, V. I. Ternovsky, P. G. Merzliak, and B. A. Tashmukhamedov. 1988. The structure of Staphylococcus aureus alpha-toxin-induced ionic channel. Gen. Physiol. Biophys. 7:467–473. [PubMed] [Google Scholar]
- Krasilnikov, O. V., V. I. Ternovsky, Yu. M. Musaev, and B. A. Tashmukhamedov. 1980. Influence of staphylotoxin on conductance of bilayer phospholipid membranes. Dokl. Akad. Nauk UzSSR. N7:66–68 [in Russian]. [Google Scholar]
- Krasilnikov, O. V., V. I. Ternovsky, and B. A. Tashmukhamedov. 1981. Properties of conductivity channels induced in phospholipid bilayer membranes by alpha-staphylotoxin. Biofizika. 26:271–276 [in Russian]. [PubMed] [Google Scholar]
- Machlup, S. 1954. Noise in semiconductors: spectrum of a two-parameter random signal. J. Appl. Phys. 25:341–343. [Google Scholar]
- Meller, A. 2003. Dynamics of polynucleotide transport through nanometre-scale pore. J. Phys. Condens. Matter. 15:R581–R607. [Google Scholar]
- Merzlyak, P. G., L. N. Yuldasheva, C. G. Rodrigues, C. M. M. Carneiro, O. V. Krasilnikov, and S. M. Bezrukov. 1999. Polymeric nonelectrolytes to probe pore geometry: application to the alpha-toxin transmembrane channel. Biophys. J. 77:3023–3033. [DOI] [PMC free article] [PubMed] [Google Scholar]
- Montal, M., and P. Mueller. 1972. Formation of bimolecular membranes from lipid monolayers and study of their electrical properties. Proc. Natl. Acad. Sci. USA. 69:3561–3566. [DOI] [PMC free article] [PubMed] [Google Scholar]
- Nakane, J. J., M. Akeson, and A. Marziali. 2003. Nanopore sensors for nucleic acid analysis. J. Phys. Condens. Matter. 15:R1365–R1393. [Google Scholar]
- Neher, E., and C. F. Stevens. 1977. Conductance fluctuations and ionic pores in membranes. Annu. Rev. Biophys. Bioeng. 6:345–381. [DOI] [PubMed] [Google Scholar]
- Nikaido, H. 2003. Molecular basis of bacterial outer membrane permeability revisited. Microbiol. Mol. Biol. Rev. 67:593–656. [DOI] [PMC free article] [PubMed] [Google Scholar]
- Ozutsumi, K., and S. I. Ishiguro. 1992. A precise calorimetric study of 18-crown-6 complexes with sodium, potassium, rubidium, cesium, and ammonium ions in aqueous solution. Bull. Chem. Soc. Jpn. 65:1173–1175. [Google Scholar]
- Pedersen, C. J. 1968. Ionic complexes of macrocyclic polyethers. Fed. Proc. 27:1305–1309. [PubMed] [Google Scholar]
- Pedersen, C. J. 1988. The discovery of crown ethers. Science. 241:536–540. [DOI] [PubMed] [Google Scholar]
- Pressman, B. C. 1976. Biological applications of ionophores. Annu. Rev. Biochem. 45:501–530. [DOI] [PubMed] [Google Scholar]
- Rostovtseva, T. K., and S. M. Bezrukov. 1998. ATP transport through a single mitochondrial channel, VDAC, studied by current fluctuation analysis. Biophys. J. 74:2365–2373. [DOI] [PMC free article] [PubMed] [Google Scholar]
- Sanchez-Quesada, J., M. R. Ghadiri, H. Bayley, and O. Braha. 2000. Cyclic peptides as molecular adapters for a pore-forming protein. J. Am. Chem. Soc. 122:11757–11766. [Google Scholar]
- Sigworth, F. J. 1995. Electronic design of the patch clamp. In Single-Channel Recording, 2nd Ed. B. Sakmann, and E. Neher, editors. Plenum Press, New York, NY. 95–127.
- Song, L., M. R. Hobaugh, C. Shustak, S. Cheley, H. Bayley, and J. E. Gouaux. 1996. Structure of staphylococcal α-hemolysin, a heptameric transmembrane pore. Science. 274:1859–1866. [DOI] [PubMed] [Google Scholar]
- Steed, J. W., and J. L. Atwood. 2000. Supramolecular Chemistry: An Introduction. John Wiley, New York, NY.
- Stojilkovic, K. S., A. M. Berezhkovskii, V. Yu. Zitserman, and S. M. Bezrukov. 2003. Conductivity and microviscosity of electrolyte solutions containing polyethylene glycols. J. Chem. Phys. 119:6973–6978. [Google Scholar]
- Tikhonov, D. B., and L. G. Magazanik. 1998. Voltage dependence of open channel blockage: onset and offset rates. J. Membr. Biol. 161:1–8. [DOI] [PubMed] [Google Scholar]
- Timasheff, S. N. 1993. The control of protein stability and association by weak interactions with water: how do solvents affect these processes? Annu. Rev. Biophys. Biomol. Struct. 22:67–97. [DOI] [PubMed] [Google Scholar]
- Woodhull, A. M. 1973. Ionic blockage of sodium channels in nerve. J. Gen. Physiol. 61:687–708. [DOI] [PMC free article] [PubMed] [Google Scholar]
- Yuldasheva, L. N., F. Hallwass, S. M. da Cruz Gonçalves, A. M. Simas, and O. V. Krasilnikov. 2003. Anion influence on complex formation between 18-crown-6 and sodium ion in aqueous solutions. J. Mol. Liq. 106:31–41. [Google Scholar]


