

Abstract
T cells form intriguing patterns during adhesion to antigen-presenting cells. The patterns are composed of two types of domains, which either contain short TCR/MHCp receptor-ligand complexes or the longer LFA-1/ICAM-1 complexes. The final pattern consists of a central TCR/MHCp domain surrounded by a ring-shaped LFA-1/ICAM-1 domain, whereas the characteristic pattern formed at intermediate times is inverted with TCR/MHCp complexes at the periphery of the contact zone and LFA-1/ICAM-1 complexes in the center. Several mechanisms have been proposed to explain the T-cell pattern formation. Whereas biologists have emphasized the role of active cytoskeletal processes, previous theoretical studies suggest that the pattern evolution may be caused by spontaneous self-assembly processes alone. Some of these studies focus on circularly symmetric patterns and propose a pivot mechanism for the formation of the intermediate inverted pattern. Here, we present a statistical-mechanical model which includes thermal fluctuations and the full range of spatial patterns. We confirm the observation that the intermediate inverted pattern may be formed by spontaneous self-assembly. However, we find a different self-assembly mechanism in which numerous TCR/MHCp microdomains initially nucleate throughout the contact zone. The diffusion of free receptors and ligands into the contact zone subsequently leads to faster growth of peripheral TCR/MHCp microdomains and to a closed ring for sufficiently large TCR/MHCp concentrations. At smaller TCR/MHCp concentrations, we observe a second regime of pattern formation with characteristic multifocal intermediates, which resemble patterns observed during adhesion of immature T cells or thymozytes. In contrast to other theoretical models, we find that the final T-cell pattern with a central TCR/MHCp domain is only obtained in the presence of active cytoskeletal transport processes.
INTRODUCTION
Helper T cells mediate immune responses by adhering to antigen-presenting cells (APCs) that display foreign peptide fragments on their surface. These peptide fragments are presented by MHC molecules on the APC surfaces, and recognized by the highly specific T-cell receptors (TCRs). At the cell-cell contact zone, the bound receptor-ligand pairs are arranged in characteristic supramolecular patterns, termed the “immunological synapse” (Monks et al., 1998; Grakoui et al., 1999; Krummel et al., 2000; Potter et al., 2001; K.-H. Lee et al., 2002; for reviews, see van der Merwe et al., 2000; Dustin and Cooper, 2000; Delon and Germain, 2000; Bromley et al., 2001; Dustin et al., 2001a; Wülfing et al., 2002). The final, mature pattern of an adhering T cell consists of a central domain in which the TCRs are bound to the MHC-peptides (MHCp), surrounded by a ring-shaped domain in which the integrin receptors LFA-1 of the T cell are bound to their ligands ICAM-1 of the APC. Intriguingly, the characteristic intermediate pattern formed earlier during T-cell adhesion is inverted, with a TCR/MHCp ring surrounding a central LFA-1/ICAM-1 domain in the contact zone (Grakoui et al., 1999; Johnson et al., 2000; K.-H. Lee et al., 2002). This pattern inversion has been first observed for T cells adhering to a supported lipid bilayer with embedded MHCp and ICAM-1 (Grakoui et al., 1999; Johnson et al., 2000), more recently also in a cell-cell system (K.-H. Lee et al., 2002). A significantly different type of pattern evolution has been found for immature T cells or thymozytes, which form multifocal synapses with several nearly circular clusters of TCR/MHC-peptide complexes in the contact zone (Hailman et al., 2002; Richie et al., 2002).
To understand the T-cell patterns, we have to explain 1), the lateral phase separation, i.e., the segregation of receptor-ligand complexes into distinct domains, and 2), the time sequence of patterns formed by these domains. Several groups agree that the lateral phase separation probably is caused by the length difference between receptor/ligand complexes (Davis and van der Merwe, 1996; Shaw and Dustin, 1997; van der Merwe et al., 2000; Qi et al., 2001; S.-J. Lee et al., 2002; Weikl et al., 2002; Burroughs and Wülfing, 2002; Chen, 2003; Coombs et al., 2004). Bound TCR/MHCp complexes induce a membrane separation of ∼15 nm, whereas LFA-1/ICAM-1 complexes have a length of 40 nm (Dustin and Cooper, 2000). The length difference leads to a membrane-mediated repulsion between the two types of complexes, simply because the lipid membranes have to be curved to compensate the length mismatch, which costs bending energy. In general, the lateral phase behavior should depend on the concentrations of the complexes (Weikl et al., 2002). Lateral phase separation can only occur if the complex concentrations exceed a critical threshold. An additional driving force for phase separation comes from large glycoproteins such as CD43 and CD45. These glycoproteins have a length of 40 nm and more (Shaw and Dustin, 1997) and thus form a steric barrier for TCR/MHCp binding.
However, there is less agreement on the mechanisms underlying the time-dependent pattern formation during T-cell adhesion. Whereas the mechanisms first proposed emphasize active cytoskeletal transport processes (Grakoui et al., 1999; Dustin and Cooper, 2000; Wülfing and Davis, 1998; Burroughs and Wülfing, 2002), Qi et al. (2001) more recently suggested that the full pattern evolution may be caused by spontaneous self-assembly processes alone. Qi et al. (2001) consider a theoretical model which is based on a Landau-Ginzburg free energy and a set of coupled reaction-diffusion equations. The model neglects thermal membrane fluctuations and leads to a time series of circularly symmetric adhesion patterns which exhibits the characteristic domain inversion. Since the model does not include active cytoskeletal transport processes, the patterns are caused by self-assembly. Qi et al. (2001) suggest that the intermediate inverted T-cell synapse is formed in a pivot mechanism. According to this mechanism, an LFA-1/ICAM-1 domain formed early in the center of the cell contact zone acts as a pivot and brings the membranes in the contact zone periphery into close enough apposition for TCR/MHCp binding.
Here, we present a statistical-mechanical model for the T-cell adhesion dynamics which differs from the model of Qi et al. (2001) in several respects. First, the membranes are discretized into small patches. Since the configurational energy depends on the numbers of receptors and ligands in each membrane patch, the receptors and ligands are modeled as single molecules, not by continuous concentration fields. Second, the adhesion dynamics is studied with Monte Carlo simulations, which naturally include thermal shape fluctuations of the membranes. The fluctuations lead to more realistic, not necessarily symmetric patterns. Third, the active cytoskeletal transport of TCRs is modeled as a force field which biases the diffusion of the receptors toward the contact zone center where the T-cell cytoskeleton develops a focal point during adhesion (Alberts et al., 1994; Dustin et al., 1998). The active actin/myosin-based transport of receptors into the contact zone has been observed by Wülfing and Davis (1998), whereas glycoproteins such as CD43 are known to be actively moved out of the contact zone (Allenspach et al., 2001; Delon et al., 2001).
Based on the patterns observed in the Monte Carlo simulations, we propose a novel nucleation-diffusion mechanism for the formation of the intermediate inverted synapse. We observe an initial nucleation of many small TCR/MHCp microclusters throughout the contact zone. Subsequently, TCR/MHCp clusters at the periphery of the contact zone grow faster due to the diffusion of free receptors and ligands into this zone. For sufficiently large TCR/MHCp concentrations, these peripheral clusters coalesce into a closed ring, surrounding a central domain of LFA-1/ICAM-1 complexes. At smaller TCR/MHCp concentrations, we observe a different dynamic regime with characteristic multifocal intermediate patterns consisting of several circular TCR/MHCp domains, which resemble patterns observed during thymozyte adhesion.
The mechanism we propose for the formation of the intermediate inverted T-cell synapse is a self-assembly mechanism based on TCR/MHCp microcluster nucleation and the diffusion of free receptors and ligands into the contact zone. In our model, the characteristic intermediate patterns are also formed in the absence of active TCR transport. However, in contrast to Qi et al. (2001) we find that the final mature T-cell synapse with a central TCR/MHCp domain only arises in the presence of active transport of TCRs to the contact zone center. This seems to be in agreement with experimental findings, since cytochalasin D, an inhibitor of actin-based transport, has been observed to inhibit also the central TCR/MHCp movement (Grakoui et al., 1999). In our simulations without active TCR transport, we obtain final patterns where a single TCR/MHCp domain is adjacent to the contact zone rim, and not in the contact zone center. Qi et al. (2001) obtain a final central TCR/MHCp domain since they consider only circularly symmetric patterns. The circular symmetry excludes patterns with a single TCR/MHCp domain at the contact zone rim.
More recently, S.-J. Lee et al. (2003) have extended the model of Qi et al. (2001) by considering also thermal fluctuations. The extended model does not reproduce the characteristic pattern inversion during T-cell adhesion, since an intermediate peripheral ring of TCR/MHCp complexes is no longer formed (see Movie 1 in the supporting information of S.-J. Lee et al., 2003). However, the model of S.-J. Lee et al. (2003), and the related model of Raychaudhuri et al. (2003) still lead to a final central TCR/MHCp domain without active transport. In these models, the central TCR/MHCp domain seems to result from the boundary condition that the membrane separation at the contact zone rim is close to the LFA-1/ICAM-1 length. LFA-1/ICAM-1 domains then are preferred at the rim, whereas TCR/MHCp domains are repelled from the rim. In our model, we choose as boundary condition a separation at the contact rim which is much larger than the length of LFA-1/ICAM-1 and TCR/MHCp complexes. We think that this boundary condition is more realistic for cell adhesion.
Similar to us, Burroughs and Wülfing (2002) include cytoskeletal transport in a theoretical model of T-cell adhesion and propose that the central TCR/MHCp aggregation requires active transport. This model is related to the model of Qi et al. (2001) but differs in the adhesion geometry. Burroughs and Wülfing (2002) consider a quadratic membrane region with periodic boundary conditions and obtain general, isotropic domain coarsening patterns in the absence of active transport processes.
The pattern evolution in our Monte Carlo simulations with active transport is in good agreement with the most detailed experimental observations on T cells presented in Fig. 1 of Grakoui et al. (1999). We find that the intermediate inverted pattern with a peripheral TCR/MHCp ring is formed on a timescale of 30 s as in these experiments (see Fig. 7 below), and the final pattern with a central TCR/MHCp domain within 5–30 min, depending on the strength of the active transport forces. The nucleation-diffusion mechanism, which we propose for the formation of the intermediate inverted pattern, is rather evident from our patterns obtained within the first 30 s after T-cell adhesion (see also Fig. 3 below). Experimentally, T-cell patterns earlier than 30 s after adhesion have not been resolved to date. Observations of these early patterns would be a crucial step toward the experimental identification of the mechanism leading to the intermediate inverted synapse.
FIGURE 1.

Cartoon of a T-cell membrane (top) adhering to an APC membrane (bottom). The T-cell membrane contains the T-cell receptor TCR (green) and the receptor LFA-1 (red). The APC membrane contains the corresponding ligands MHCp (green) and ICAM-1 (red). Both membranes contain repulsive glycoproteins (gray). Because of the different lengths of bound TCR/MHCp complexes, LFA-1/ICAM-1 complexes, and glycoproteins, the membrane phase separates into domains.
FIGURE 7.
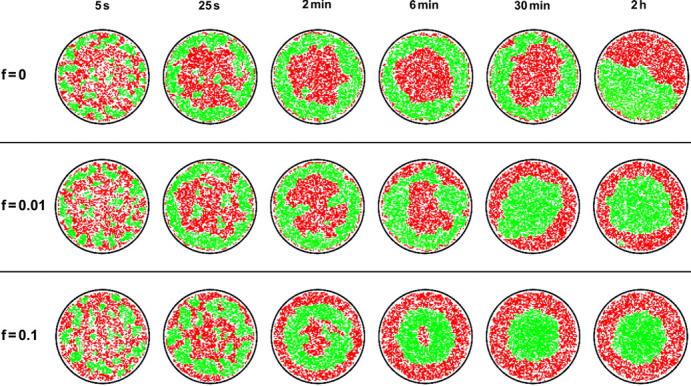
Pattern evolution with active transport of TCRs toward the center of the contact zone. Membrane patches with bound TCR/MHCp complexes are shown in green, patches with LFA-1/ICAM-1 complexes in red. Molecular concentrations and binding energies are the same as in Fig. 3 (ring regime). (Top) At zero force, the intermediate TCR/MHCp pattern is stable for 30 min and more. In the final equilibrium pattern, both types of domains are in contact with the rim of the adhesion region (see Adhesion Dynamics in the Absence of Cytoskeletal Transport Processes). (Middle) At the force F = 0.01 kBT/a, the final equilibrium state is the target-shaped mature synapse of T cells. This state is already established within 30 min. (Bottom) At the 10-fold stronger force F = 0.1 kBT/a, the final target-shaped pattern already forms within 5–10 min. An intermediate pattern with a TCR/MHCp ring appears ∼30 s after initial contact.
FIGURE 3.

Typical pattern evolution without active TCR transport for the effective binding energies UTM = 6.5 kBT of TCR/MHCp complexes and ULI = 3 kBT of LFA-1/ICAM-1 complexes. The overall concentrations of TCR, ICAM-1, LFA-1, and glycoproteins in each of the membranes is 0.4/a2 ≃ 80 molecules/μm2 for a linear patch size of a ≃ 70 nm, and the concentration of MHCp is 0.1/a2 ≃ 20 molecules/μm2. Membrane patches with bound TCR/MHCp complexes are shown in green, patches with bound LFA-1/ICAM-1 complexes in red. The black circle represents the contact zone rim.
In our Monte Carlo simulations without active transport, we observe that the intermediate TCR/MHCp ring seems to be metastable and persists for an hour and more. The metastability might explain the inverted synapse of natural killer (NK) cells which consists of a peripheral ring of short HLA-C/KIR complexes surrounding a central domain containing the longer LFA-1/ICAM-1 complexes. The formation of the inverted NK synapse is not inhibited by ATP depletion or disruption of the cytoskeleton and thus appears to be caused by self-assembly (Davis et al., 1999; Fassett et al., 2001).
MODEL
In this section, we describe our theoretical model for the interaction of a T cell with an antigen-presenting cell (APC). We consider two apposing membranes. The first membrane represents the T cell and contains the receptors TCR and LFA-1. The second membrane represents the APC and contains the ligands MHCp and ICAM-1. We use the terms receptors and ligands here with respect to the T cell: Adhesion molecules anchored in the T-cell membrane are called receptors, and those in the APC membrane are ligands. Protruding glycoproteins are embedded in both membranes, forming a steric barrier for the formation of the short TCR/MHCp complexes (see Fig. 1).
To mimic the adhesion geometry of the cells, we divide the membranes into a contact zone and a surrounding region in which the membranes do not interact. The receptors can diffuse in the whole T-cell membrane, but interact with the ligands of the APC membrane only within the contact zone of the two membranes. For simplicity, we avoid the problem of modeling the full cell shape, and assume here that the contact zone has an essentially circular shape and a constant area on the timescales considered here (see Fig. 2). This contact zone is thought to be established in fast initial adhesion events after first cell contact. Experimental pictures of adhering T cells show that the contact zone fully develops in <30 s (Grakoui et al., 1999).
FIGURE 2.

Cell adhesion geometry. The circular contact zone is surrounded by a nonadhering membrane ring. Receptors, ligands, and glycoprotein diffuse around in the whole membrane, but interact with the apposing membrane only within the contact zone.
To characterize the membrane conformations, we partition both membranes into quadratic patches with linear extension a. (More precisely, we are discretizing the reference plane shown in Fig. 2 into a square lattice with lattice constant a, which results in partitioning both membranes into quadratic patches.) The local composition of the T-cell membrane is then described by the numbers  of TCRs,
  of LFA-1, and
  of glycoproteins in each membrane patch i. Correspondingly, the composition of the APC membrane is given by the numbers
  of MHCp,
  of ICAM-1, and
  of glycoproteins in all patches. Within the contact zone, the local separation between two apposing membrane patches of the two cells is denoted by li.
The elastic energy of the membranes in the contact zone is dominated by the bending energy and by lateral tension and can be written as
 |
(1) |
Here, κ = κ1κ2/(κ1 + κ2) denotes the effective bending rigidity of the two membranes with rigidities κ1 and κ2, and σ is a lateral tension. For simplicity, the effective bending rigidity is taken to be independent of the local membrane composition. The term Δdli = Δdlx,y = lx+a,y + lx–a,y + lx,y+a + lx,y–a–4lx,y is the total curvature of the membrane separation field li at site i, and (∇dli)2 = (∇dlx,y)2 = (lx+a,y–lx,y)2 + (lx,y+a–lx,y)2 describes the local area increase of the curved membranes with respect to the reference x, y plane given by li = lx,y = 0. The elastic energy (Eq. 1) dominates the fluctuations of the membrane separation in the contact zone, whereas the overall cell shape is also affected by the elasticity of the cytoskeleton which is coupled to the membranes. In the simulations, we use the dimensionless separation field  and choose the value z = 1 to correspond to a length of 20 nm, which results in the relation
  nm for the linear patch size. For the typical bending rigidities κ1 = κ2 = 25 kBT of the two biomembranes (Seifert and Lipowsky, 1995), the effective rigidity κ has the value 12.5 kBT, and the linear patch size is a ≃ 70 nm. Monte Carlo simulations with smaller patch sizes should lead to comparable results, but require significantly longer computation times. For the lateral tension, we choose the value σ = 0.1 κ/a2 ≃ 2 × 10⁻⁶ N/m , which is within the range of values measured for Dictyostelium discoideum cells (Simson et al., 1998).
The overall configurational energy of the membranes in the contact zone is the sum of the elastic energy (Eq. 1) and the interaction energies of receptors, ligands, and glycoproteins:
 |
(2) |
Here, VTM(li) and VLI(li) are the attractive interaction potentials of TCR/MHCp and LFA-1/ICAM-1 complexes, VG(li) is the repulsive interaction potential of the glycoproteins, and Vhw(li) is the hard-wall interaction which prevents membrane separations li smaller than zero. The term min( ) denotes the minimum of the numbers of TCR and MHCp molecules at site i. This minimum is equivalent to the number of interacting TCR/MHCp pairs in the apposing patches at site i.
The receptor-complexes can only form if the membrane separation is in an appropriate range. The length of the TCR/MHCp complexes is ∼15 nm, whereas the LFA-1/ICAM-1 complexes have a length of ∼40 nm (Dustin and Cooper, 2000). Since the membrane within a patch is “rough” due to the thermal fluctuations on length scales smaller than the linear extension a ≃ 70 nm of the patches, we assume that the complexes can form if the separation of two apposing patches does not deviate >5 nm from the lengths zTM and zLI. The interaction potential of TCR and MHCp is then given by
 |
(3) |
and the interaction potential of ICAM-1 and LFA-1 is
 |
(4) |
where UTM > 0 is the binding energy of a TCR/MHCp complex, and ULI > 0 the binding energy of LFA-1/ICAM-1. As noted above, the potential width of 10 nm effectively takes into account small-scale fluctuations within patches. Thus, this width does not result from the atomic interaction potentials of receptor and ligand molecules, which should have a significantly smaller range. Similarly, the binding energies of the receptor/ligand complexes should be seen as effective binding energies which can be used to adjust the two-dimensional equilibrium constants of the TCR/MHCp and LFA-1/ICAM-1 complexes. The two-dimensional equilibrium constants are approximately given by  and
and  provided the membrane separation is within the binding range of the complexes (see Appendix).
In the following, we characterize the pattern evolution as a function of the effective binding energies of the receptor/ligand complexes. We do not consider fixed values for these binding energies but vary them in a systematic way. There are two reasons for this procedure. First, the equilibrium constants of TCR/MHCp complexes depend on the specific peptide and T-cell receptor (Grakoui et al., 1999). Second, reliable experimental data of two-dimensional equilibrium constants for TCR/MHCp and LFA-1/ICAM-1 complexes are not yet available (Dustin et al., 2001a; Orsello et al., 2001). Although three-dimensional equilibrium constants for soluble variants of the receptors and ligands can be measured rather precisely, two-dimensional equilibrium constants by definition depend on the membrane state and separation. Different experimental methods to estimate two-dimensional equilibrium constants can lead to differences by orders of magnitude (Dustin et al., 2001a). In the case of the LFA-1/ICAM-1 complexes, a further complication is that LFA-1 has two or three different affinity states (Lollo et al., 1993; Zhang et al., 2002; Dustin et al., 2004). In the immunological synapse, LFA-1 has been suggested to be in a medium-affinity state (Dustin et al., 2004). From fluorescence imaging, the two-dimensional constants of complexes involving the receptor CD2 have been found to be in the range 0.02–1 μm2 (Dustin et al., 2001a). For a ≃ 70 nm, this range of values corresponds to effective binding energies between 2 and 5 kBT as considered here. For TCR/MHCp and ICAM-1/LFA-1, values of two-dimensional constants in this range are obtained from estimates based on three-dimensional equilibrium constants (Burroughs and Wülfing, 2002).
The repulsive glycoproteins protruding from both membranes vary in size. However, many of these proteins have a length comparable to the length of the LFA-1/ICAM-1 complexes. These glycoproteins do not inhibit the binding of ICAM-1 and LFA-1, but impose a steric barrier for the formation of TCR/MHCp complexes. They are characterized here by the potential
 |
(5) |
with UG = 10κ/a2 and lG = 40 nm. This potential results from the fact that a membrane patch of size a containing a glycoprotein has to bend around this protein to achieve an overall patch separation smaller than the length of the glycoprotein.
In the following, the radius of the circular contact zone is chosen to be 45a, and the nonadhering membrane surrounding the contact zone is a ring of width 55a. As boundary condition at the rim of the contact zone, the membrane separation is fixed at a value of 100 nm, which is significantly larger than the length of the TCR-MHCp and LFA-1/ICAM-1 complexes and the glycoproteins.
ADHESION DYNAMICS IN THE ABSENCE OF CYTOSKELETAL TRANSPORT PROCESSES
We first consider the pattern formation in the absence of active forces that transport molecules in or out of the contact zone. The lateral motion of receptors, ligands, and glycoproteins within the membranes is then purely diffusive. In our discretized membranes, the diffusive motion of the macromolecules is modeled as a hopping process between neighboring membrane patches. Each receptor, ligand, or glycoprotein in a certain membrane patch can hop to one of the four nearest neighbor patches during a single time step. The hopping processes of macromolecules located in the nonadhering membrane region do not change the cell interaction energy, Eq. 2. However, within the contact zone, the attempted hopping of a macromolecule may change the free energy. According to the standard Metropolis criterion, the hopping attempt is always accepted if it does not increase the free energy, but is only accepted with probability exp(−ΔF/(kBT)) if it leads to a free energy increase ΔF. (We reject moves in which bound ligands or receptors hop from one binding partner to another in a single time step. For these moves, the free energy difference would be zero. Thus, the actual free energy barrier for the unbinding process of the ligand/receptor complex would not be captured.) During a time step, we also attempt to shift the separation li between apposing membrane patches in the contact zone by d × ζ[−1, 1] where d is the step width 10 nm, and ζ[−1, 1] is a random number between −1 and 1.
A single Monte Carlo step roughly corresponds to 1 ms of real time. This time estimate can be derived from the two-dimensional diffusion law 〈x2〉 = 4Dt and the typical diffusion constant D ≃ 1 μm2/s for membrane-anchored macromolecules (Almeida and Vaz, 1995). In a single Monte Carlo step, a free receptor, free ligand, or a glycoprotein moves a distance a to a neighboring membrane patch, which corresponds to a diffusion time t = a2/(4D) ≃ 1 ms for a = 70 nm. On the length scale of our patches, the diffusive motion of the macromolecules is slower than the relaxation of the membrane separation (Brochard and Lennon, 1975) and hence defines the timescale.
These dynamic rules and the free energy given in Eq. 2 specify a stochastic adhesion process. Here, we study the adhesion process with Monte Carlo simulations. Taking averages over many independent Monte Carlo runs gives a numerical solution of the corresponding master equation (van Kampen, 1992; Binder and Heermann, 1992). The stochastic process captures the fluctuations in the membrane separation and describes the diffusive motion of the receptors, ligands, and glycoproteins on a single-molecule level, which is essential for the mechanisms of pattern formation considered in this article. As initial conformation, we choose the separation profile l = lo + cr4 where r is the distance from the center of the contact zone, lo is 45 nm, and c > 0 is chosen so that the separation at the rim of the contact zone with radius r = 45a is 100 nm (boundary condition). This initial separation in the contact zone is larger than 45 nm, and thus beyond the interaction range of receptors, ligands, and glycoproteins. Initially, these molecules are taken to be randomly distributed within the whole membrane.
We systematically study the adhesion dynamics for various concentrations of the receptors, ligands, and glycoproteins and for various effective binding energies, or two-dimensional equilibrium constants, of the TCR/MHCp and LFA-1/ICAM-1 complexes. Since the length difference of the complexes leads to phase separation at the molecular concentrations considered here, the two types of receptor/ligand complexes have to compete for the contact zone. In general, the overall area of TCR/MHCp domains in the contact zone increases with the concentrations of TCR and MHCp molecules and with the effective binding energy UTM. However, if the molecular concentrations or the binding energy are too small, TCR/MHCp domains do not form, and the contact zone contains only bound LFA-1/ICAM-1 complexes. At molecular concentrations and binding energies where TCR/MHCp and LFA-1/ICAM-1 domains coexist, we observe two different regimes for the dynamics with clearly distinct patterns of TCR/MHCp domains at intermediate times. The pattern evolution roughly depends on the overall area of TCR/MHCp domains after initial relaxation.
Dynamic regime 1
If the overall area of TCR/MHCp domains is relatively large, we observe a characteristic ring-shaped TCR/MHCp domain at intermediate times, surrounding a central domain of LFA-1/ICAM-1 complexes. A typical example for the pattern evolution in this regime is presented in Fig. 3. The first Monte Carlo snapshots of the contact zone show the formation of many small TCR/MHCp microclusters. At later times, the clusters close to the rim of the contact zone grow faster, and form an intermediate peripheral TCR/MHCp ring. The faster growth of the clusters close to the rim is caused by the diffusion of unbound TCR and MHCp molecules from the nonadhering membrane into the contact zone. Finally, the ring breaks to form a single large TCR/MHCp domain.
Dynamic regime 2
For smaller TCR or MHCp concentrations, or smaller effective binding energy, we observe characteristic multifocal TCR/MHCp patterns at intermediate times. A typical example is shown in Fig. 4. Initially, we observe again the nucleation of many TCR/MHCp microclusters throughout the contact zone. However, the overall area of TCR/MHCp domains now is not large enough for the formation of a TCR/MHCp ring. Instead, microclusters in the whole contact zone grow and coalesce, which leads to multifocal intermediates and finally again to a single TCR/MHCp domain.
FIGURE 4.

Typical pattern evolution without active TCR transport for the effective binding energies UTM = 5.5 kBT of TCR/MHCp complexes, ULI = 4 kBT of LFA-1/ICAM-1 complexes, and the same molecular concentrations as in Fig. 3. Membrane patches with bound TCR/MHCp complexes are shown in green, patches with bound LFA-1/ICAM-1 complexes in red.
Parameter dependence of dynamic regimes
To distinguish the two dynamic regimes systematically, we consider a peripheral ring of the contact zone with distances r > 35a from the center, and divide this ring into 100 equal segments. For each Monte Carlo pattern obtained during adhesion, we determine the fraction Y of ring segments which contain bound TCR/MHCp complexes. A fully closed peripheral TCR/MHCp ring corresponds to a ring occupation Y = 100%. We find that the crossover between the two dynamic regimes can be appropriately described by a maximum ring occupation of Ymax = 80% attained during adhesion. A pattern evolution with Ymax < 80% typically has multifocal intermediates as in Fig. 4 (Regime 2), whereas pattern evolutions with Ymax > 80% exhibit the inverted synapse of T cells with peripheral TCR/MHCp ring as in Fig. 3 (Regime 1).
The diagram at the top of Fig. 5 shows how the dynamic regimes for pattern formation depend on the effective binding energies UTM and ULI of the TCR/MHCp and LFA-1/ICAM-1 complexes. These binding energies are proportional to the logarithm of the ideal two-dimensional equilibrium constants of the complexes (see Appendix). An increase in UTM in general leads to more TCR/MHCp complexes in the contact zone, whereas an increase in ULI leads to the binding of more LFA-1/ICAM-1 complexes. We observe three different scenarios:
At small values of UTM, TCR/MHCp domains do not form at all in the contact zone, which then is completely occupied by LFA-1/ICAM-1 complexes. TCR/MHCp domains only form above a threshold value for UTM. This threshold value increases with ULI.
At large values of UTM, we observe Regime 1 of pattern formation with the characteristic peripheral ring of TCR/MHCp complexes as in Fig. 3.
At intermediate values UTM, we find the patterns of Regime 2 with characteristic multifocal intermediates as in Fig. 4. The crossover value of UTM separating Regime 1 and Regime 2 increases with ULI. The intermediate TCR/MHCp ring of Regime 1 only forms if sufficiently large numbers of TCR/MHCp complexes are present in the contact zone.
FIGURE 5.

Dynamic regimes for T-cell adhesion. The concentrations of TCR, LFA-1, and ICAM-1 are 0.4/a2 ≃ 80 molecules/μm2 and the concentration of MHCp is 0.1/a2 ≃ 20 molecules/μm2. In the top diagram, the glycoprotein concentration in each of the membranes is XG = 0.4/a2. In the bottom diagram, the binding energy ULI of LFA-1/ICAM-1 complexes has the value 3 kBT. The solid diamonds in the figure represent data points obtained from Monte Carlo simulations. At large values of the binding energy UTM of the TCR/MHCp complexes, we observe a peripheral TCR/MHCp ring at intermediated times as in Fig. 3 (Regime 1). At medium values of UTM, multifocal patterns as in Fig. 4 are obtained at intermediate times (Regime 2). At small values of UTM, TCR/MHCp domains in the contact zone do not form. The threshold for the formation of TCR/MHCp domains and the crossover between the two dynamic regimes depend on the binding energy ULI of LFA-1/ICAM-1 complexes and the glycoprotein concentration XG in both membranes.
Instead of varying the effective binding energies UTM and ULI, the numbers of bound receptor/ligand complexes in the contact zone could also be changed by varying the overall concentrations of the receptors and ligands, with similar effects on the pattern formation.
The diagram at the bottom of Fig. 5 shows the effect of the glycoprotein concentration XG on the adhesion dynamics. The length of the glycoproteins is compatible with the length of the LFA-1/ICAM-1 complexes. Hence, the glycoproteins can enter the red LFA-1/ICAM-1 domains in the contact zone, but are excluded from the green TCR/MHCp domains. The accessible membrane area for the glycoproteins increases with the fraction of LFA-1/ICAM-1 domains in the contact zone, and so does the entropy of the glycoprotein distribution. Therefore, an increase in the overall glycoprotein concentrations leads to a larger fraction of red LFA-1/ICAM-1 domains in the contact zone, and thus has a similar effect as increasing the binding energy ULI of the LFA-1/ICAM-1 complexes.
In both dynamic regimes of pattern formation, the coalescence of clusters finally leads to a single TCR/MHCp domain in our model. In the absence of active transport processes, we always observe that the final TCR/MHCp domain is in contact with the rim of the contact zone (see Figs. 3 and 4). This behavior can be understood from the line tensions at the domain boundaries and at the rim of the contact zone. The line tension between TCR/MHCp and LFA-1/ICAM-1 domains, λ, is the energy-per-unit-length of the domain boundaries, and is mainly caused by the elastic energy of the membranes within the boundary regions between the domains. At the boundary, the membranes are bent to connect a TCR/MHCp domain with a membrane separation of ∼15 nm, and an LFA-1/ICAM-1 domain with a separation of ∼40 nm. Similar line tensions, or energies per length, arise at the rim of the contact zone, both for TCR/MHCp and LFA-1/ICAM-1 domains adjacent to the rim, which we denote here by λTM and λLI. Of special interest here is the difference λr = λTM–λLI, the energy per length for replacing an LFA-1/ICAM-1 boundary at the rim of the contact zone by a TCR/MHCp boundary. Although λ is always positive, reflecting the phase separation, λr (in principle) can have both positive and negative signs. These line tensions determine the contact angle θ of the green lens in the right pattern of Fig. 6 via cos(θ) = (λLI–λTM)/λ.
FIGURE 6.

Two possible patterns with a single TCR/MHCp domain, shown in green. In the left pattern, the TCR/MHCp domain only has boundaries with the red LFA-1/ICAM-1 domain. In the right pattern, the TCR/MHCp domain is in contact with the rim of the contact zone.
Let us assume that the final TCR/MHCp domain has a smaller area than the LFA-1/ICAM-1 domain, which seems to be the case for T cells. If λr is larger than λ, boundaries of TCR/MHCp domains inside the contact zone with the LFA-1/ICAM-1 domain are energetically more favorable than boundaries at the rim. Hence, the final TCR/MHCp domain should be circular and located anywhere inside the contact zone, to minimize the overall line tension (see Fig. 6). In contrast, if λ is larger than λr, TCR/MHCp domain boundaries at the rim of the contact zone are more favorable than interior boundaries, and the final TCR/MHCp domain should be in contact with the rim. In our simulations, λ is clearly larger than λr, although λr is positive since our boundary conditions, a rim separation of 100 nm, favor LFA-1/ICAM-1 domains at the edge of the contact zone. In the case of cells, it is reasonable to assume that λ is much larger than λr, since separation differences between 15 and 40 nm at the edge of the contact zone should not cause large energetic differences in the cell elasticity. In principle, a large line tension λ between the domains may lead to two disjoint contact zones for the two domain types. To our knowledge, such patterns have not been observed, presumably because λ is smaller than λTM and λLI, the line tensions of the two domain types at the contact zone boundary.
ADHESION DYNAMICS WITH ACTIVE TRANSPORT OF TCRs
In T cells, active processes transport receptors into the contact zone (Wülfing and Davis, 1998) and glycoproteins out of this region (Allenspach et al., 2001; Delon et al., 2001). The framework enabling these transport processes is the actin cytoskeleton which polarizes during adhesion around the center of the contact zone (Alberts et al., 1994; Dustin et al., 1998). For TCRs, the transport is mediated by myosin, a molecular motor protein binding to the actin filaments. Here, we model the transport of TCRs as directed diffusion. For simplicity, we assume that each TCR molecule experiences a constant force which is directed toward the center of the contact zone midpoint. This force corresponds to an additional term F · r in the configurational energy of each TCR where F is the magnitude of the force and r the distance of the receptor from the center of the contact zone. Under the influence of this force, diffusive steps bringing TCRs closer to the focal point of the cytoskeleton in the center of the contact are, in general, more likely than diffusive steps in the opposite direction.
Fig. 7 compares the pattern evolution at zero force with patterns at the forces F = 0.01 kBT/a ≃ 6 × 10⁻¹⁶ N and F = 0.1 kBT/a ≃ 6 × 10⁻¹⁵ N. The concentrations and binding energies are the same as in Fig. 3. For these values, the force F = 0.01 kBT/a is close to the force threshold leading to a target-shaped final synapse with central TCR/MHCp cluster (see Fig. 8). Besides leading to a central TCR/MHCp cluster, the active forces speed up the pattern evolution. At the weaker force F = 0.01 kBT/a, the final equilibrium state is reached after ∼30 min, whereas the 10-fold stronger force F = 0.1 kBT/a leads to equilibrium within a few minutes. The absolute times are based on the estimate that one Monte Carlo step roughly corresponds to 1 ms; see above. A TCR/MHCp ring at intermediate times is formed in all three cases shown in Fig. 7.
FIGURE 8.

TCR/MHCp ring occupation Y at various forces F = f · kBT/a as a function of time t for the same molecular concentrations as in Figs. 3 and 7. A ring occupation Y = 100% corresponds to fully closed peripheral ring of TCR/MHCp complexes; smaller percentages of Y correspond to partial occupations of the peripheral ring with distances r > 35a from the center of the contact zone. T-cell like pattern evolution with intermediate values of Y ≳ 80% (inverted synapse) and final values of Y ≃ 0% (mature synapse) are obtained for forces between F = 0.01 kBT/a and F = 0.1 kBT/a (see also Fig. 7). Larger forces prevent the formation of an intermediate peripheral TCR/MHCp ring, whereas smaller forces do not lead to a final central TCR/MHCp cluster. The data points represent averages over 24 independent Monte Carlo runs for each force.
To quantify the impact of the active forces on the pattern evolution, we consider again the peripheral ring occupation Y of the TCR/MHCp complexes (see Fig. 8). Values Y ≳ 80% at intermediate times indicate a peripheral TCR/MHCp ring as in the inverted T-cell synapse, and values Y ≃ 0% at later times correspond to target-shaped patterns with a central TCR/MHCp domain as in the mature T-cell synapse. We consider the same molecular concentrations and binding energies as in Figs. 3 and 7. We obtain a T-cell-like pattern evolution for forces 0.01 kBT/a ≲ F ≲ 0.1 kBT/a with an intermediate inverted synapse and a final mature synapse exhibiting a central TCR/MHCp cluster. For the patch size a ≃ 70 nm and the temperature T ≃ 300 K, this corresponds to a force range 6 · 10−16 N ≲ F ≲ 6 × 10⁻¹⁵ N for which the inversion of T cells is obtained. Smaller forces do not lead to the mature T-cell synapse with the central TCR/MHCp cluster, whereas larger forces disrupt the peripheral TCR/MHCp ring of the intermediate inverted synapse by guiding the TCRs too quickly to the contact zone center. It is important to note that the forces in our model are average forces acting on a single TCR. Since the transport of a TCR molecule over larger distances presumably involves several cytoskeletal binding and unbinding events, these average forces are significantly smaller than the local maximum forces ∼1 pN = 10−12 N which can be exerted by a single molecular motor (Mehta et al., 1999).
Experimentally, the mature synapse of T cells has been observed to form on timescales between 5 and 30 min (Grakoui et al., 1999; K.-H. Lee et al., 2002). These timescales agree with the equilibration times we obtain for the force range 0.01 kBT/a ≲ F ≲ 0.1 kBT/a with T-cell-like pattern evolution (see Figs. 7 and 8). In the absence of active forces (F = 0), the intermediate peripheral TCR/MHCp ring seems to be metastable and appears in our simulations for times up to an hour. This metastability might explain the inverted NK cell synapse, which consists of a peripheral ring of short receptor/ligand complexes, and a central domain containing the longer integrins. The inverted synapse of NK cells seems to be formed by self-assembly, since it is not affected by ATP depletion or cytoskeletal inhibitors (Davis et al., 1999; Fassett et al., 2001).
DISCUSSION AND CONCLUSIONS
In this article, we have considered the pattern formation during T-cell adhesion in a theoretical model. We propose a novel mechanism for the formation of intermediate patterns, which is based on the nucleation of TCR/MHCp microdomains throughout the contact zone and the diffusion of free receptors and ligands into the contact zone. This nucleation-diffusion mechanism is a self-assembly mechanism in the sense that it does not require active, ATP-driven processes. The mechanism leads to the intermediate inverted synapse pattern of T cells if the TCR/MHCp concentration is large enough. For smaller TCR/MHCp concentrations, the mechanism leads to multifocal intermediates which resemble patterns observed during thymozyte adhesion.
According to our model, the final, mature T-cell pattern with a central TCR/MHCp domain is caused by active transport of TCRs toward the center of the contact zone. The coalescence of domains eventually leads to a single TCR/MHCp domain in our model. Without active transport, this domain is located at the rim of the contact zone. We obtain the final T-cell pattern with a central TCR/MHCp domain only in the presence of active TCR transport. This seems to be in agreement with experiments that show that the central TCR/MHCp movement is inhibited by blocking the active cytoskeletal transport with cytochalasin D (Grakoui et al., 1999).
Other theory groups (Qi et al., 2001; S.-J. Lee et al., 2003; Raychaudhuri et al., 2003; Coombs et al., 2004) propose that the final T-cell pattern can be obtained by self-assembly. In the model of Qi et al. (2001), the central TCR/MHCp domain apparently results from the circular symmetry of the considered patterns. This symmetry prevents patterns with a single TCR/MHCp domain at the contact zone rim. Coombs et al. (2004) investigate equilibrium aspects of T-cell adhesion and focus on circularly symmetric patterns similar to Qi et al. (2001). In the models of S.-J. Lee et al. (2003) and Raychaudhuri et al. (2003), the central TCR/MHCp domain seems to arise from the boundary condition that the membrane separation at the contact zone rim is close to the LFA-1/ICAM-1 length of 40 nm. This boundary condition favors LFA-1/ICAM-1 domains at the rim, and repels TCR/MHCp domains from the contact zone rim. However, directly adjacent to the contact zone of two cells, the membrane separation quickly attains values much larger than the lengths of the receptor/ligand complexes. Therefore, we choose a more realistic boundary condition with a membrane separation at the rim which is significantly larger than the lengths of LFA-1/ICAM-1 and TCR/MHCp complexes.
For small TCR/MHCp concentrations, we obtain characteristic intermediate patterns with several distinct TCR/MHCp domains formed in self-assembly. These patterns resemble the multifocal synapse of thymozytes with several nearly circular and mobile TCR/MHCp domains. However, our patterns are only stable on the timescale of minutes. After a few minutes, domain coalescence leads to a single TCR/MHCp domain in our model. In contrast, the multifocal synapse of thymozytes is stable for hours. One reason for the pattern stability might be the thymozyte cytoskeleton. Unlike the cytoskeleton of mature T cells, the cytoskeleton of thymozytes presumably remains in a mobile, nonpolarized state which still allows cell migration (Hailman et al., 2002). The few TCR/MHCp clusters of thymozytes may be coupled to the cytoskeleton, thus following its movements.
An alternative explanation for the multifocal patterns of thymozytes has been given in analogy to near-critical fluctuations of a simple fluid (S.-J. Lee et al., 2003; Raychaudhuri et al., 2003). Fluctuations close to a critical point can lead to the appearance and disappearance of small domains, since the line tension of the domain boundaries then is low. In the case of the thymozyte synapse, however, the few small TCR/MHCp domains observed by Hailman et al. (2002) are rather circular, which seems to indicate a relatively large line tension. In addition, the multifocal patterns were observed over a 100-fold range of antigen concentrations (Hailman et al., 2002), whereas large fluctuations in composition typically can only be observed in a rather narrow concentration range close to a critical point or line.
A central question in immunology concerns the relation between the T-cell pattern formation on the one hand, and T-cell signaling and activation on the other hand (K.-H. Lee et al., 2002, 2003). We have focused here on the T-cell pattern formation. However, our model presupposes two early signaling events:
A stop signal for any active T-cell migration on the APC surface. Active migration would result in contact zone movement during the pattern formation.
A signal that activates cytoskeletal polarization and the transport of TCRs toward the focal point of the cytoskeleton in the contact zone center.
For simplicity, we have assumed that the transport is active right from the beginning of the pattern formation, i.e., from time t = 0 on. It is rather evident from the patterns shown in Fig. 7 that our active transport does not affect the pattern evolution in the first few seconds. Therefore, switching on the active transport mechanism during the first 5–10 s would lead to similar results in our model. Early signals are known to occur during T-cell adhesion. TCR signaling has been recently shown to precede synapse formation (K.-H. Lee et al., 2002), whereas the mature synapse has been postulated to act “as a type of adaptive controller that both boosts T-cell receptor triggering and attenuates strong signals” (K.-H. Lee et al., 2003). The numerous small TCR/MHCp clusters which we observe during the first seconds of pattern evolution may play a role in early signaling events. The TCR/MHCp concentration in these small clusters is comparable to the TCR/MHCp concentrations in the large central cluster of the mature synapse.
Lipid rafts have been suggested to play a central role in T-cell signaling (Janes et al., 1999; Viola and Lanzavecchia, 1999; Janes et al., 2000; Burack et al., 2002). Rafts are defined as nanoscale, ordered membrane domains rich in sphingolipids and cholesterol (Simons and Ikonen, 1997; Brown and London, 1998; Sharma et al., 2004). Lipid rafts are assumed to include or exclude membrane proteins, thus providing a microenvironment for membrane-anchored signaling molecules. In the T-cell membrane, the TCRs are seen to have an affinity for rafts (Janes et al., 2000; Simons and Toomre, 2000). Extracting cholesterol, one of the key components of rafts, from T-cell membranes has been shown to block the formation of the immunological synapse (Burack et al., 2002). However, extracting cholesterol after the synapse has been formed does not change the shape or area of the synapse domains (Burack et al., 2002). These experimental observations seem to indicate 1), that lipid rafts are involved in early signaling events required for the synapse formation, and 2), that the lipid phase separation leading to rafts is not the phase separation mechanism behind the T-cell pattern formation. As we have mentioned above in the Introduction, there is broad agreement that the lateral phase separation in the synapse is caused by the length mismatch between TCR/MHCp and ICAM-1/LFA-1 complexes. In principle, lipid raft formation may increase the tendency for lateral phase separation in the T-cell synapse, since rafts are assumed to be enriched in the central domain of the mature synapse (Burack et al., 2002). Currently, there is no experimental evidence for such an increase.
Lipid rafts may affect the lateral diffusion of receptors and ligands with strong raft affinity (Pralle et al., 2000). Rafts have been characterized as transient confinement zones (Dietrich et al., 2002) and seem to move as entities (Pralle et al., 2000). The lateral diffusion of membrane proteins may also be impaired by steric barriers from cytoskeleton fences (Kusumi and Sako, 1996) or by binding to the cytoskeleton (Dustin and Cooper, 2000). For simplicity, we have modeled the lateral diffusion of receptors, ligands, and glycoproteins as a hopping process with identical frequencies, which implies that these molecules have identical diffusion constants in the model. To relate the Monte Carlo time step of the hopping process to physical timescales, we took the typical diffusion constant D ≃ 1 μm2/s (Almeida and Vaz, 1995) as an estimate. A single Monte Carlo step then corresponds to 1 ms (see Adhesion Dynamics in the Absence of Cytoskeletal Transport Processes, above), which leads to the pattern evolution times shown in Figs. 3, 4, and 7. A twofold smaller diffusion constant would lead to a twofold increase in these evolution time estimates. It is important to note that the relaxation dynamics of the membrane separation field is significantly faster than the diffusion dynamics (see Adhesion Dynamics in the Absence of Cytoskeletal Transport Processes, above). In other words, the membrane separation quickly adapts to a given distribution of the macromolecules. Therefore, parameters like the bending rigidity κ and the lateral tension γ, which govern the relaxation dynamics, do not directly affect the pattern evolution timescales.
T cells and APCs have been observed to form numerous dynamic, short-lived contacts with a duration of a few minutes in a three-dimensional collagen model of the extracellular matrix (Gunzer et al., 2000). Based on these observations, a serial-encounter model of T-cell activation has been postulated (Friedl and Gunzer, 2001), which contrasts the view that T cells have to form a long-lasting, mature synapse for activation (Dustin et al., 2001b). Recent in vivo experiments show that T cells and APCs both have multiple short encounters with a duration of minutes and long-lasting stable contacts with a duration up to an hour and more, in different phases of T-cell activation (Mempel et al., 2004). We have focused here on the pattern formation during long-lasting contacts between T cells and APCs. However, our simulations show that relatively large TCR/MHCp domains already arise in the first seconds and minutes after adhesion. These domains may play an important role in signaling events during short cell encounters.
We have applied our model here to T-cell adhesion, using the specific lengths of the TCR/MHCp and ICAM-1/LFA-1 complexes in the interaction potentials (Eqs. 3 and 4). However, the model is rather general and also applies to other cell adhesion events. We have previously considered a simpler membrane system with stickers and repellers (Weikl et al., 2002). The phase separation into sticker- and repeller-rich domains is driven by the length difference between the two molecule types. In the cell adhesion geometry, we obtained intermediate patterns which are similar to those presented here. A difference to T-cell membranes is that the repeller-rich domains are unbound. Large-scale membrane fluctuations in these domains then drive the final sticker clusters toward the center of the contact zone, at least for the free boundary conditions with unconstrained membrane separation at the contact zone rim (Weikl et al., 2002). In contrast, the coexisting TCR/MHCp and ICAM-1/LFA-1 domain types of T cells are both bound, and large-scale membrane fluctuations are suppressed.
Natural killer (NK) cells form an inverted synapse, consisting of a peripheral ring of short HLA-C/KIR complexes and a central domain with the longer LFA-1/ICAM-1 complexes. The formation of the NK cell synapse seems not to depend on active cytoskeletal processes, since ATP depletion or disruption of the cytoskeleton has no effect on the pattern (Davis et al., 1999; Fassett et al., 2001). A possible explanation for the NK cell synapse is the metastability of the inverted pattern in the absence of active cytoskeletal processes. Without active transport, the inverted intermediate synapse persists up to an hour in our model.
We have characterized the receptor/ligands by an effective binding energy which is directly related to an effective two-dimensional equilibrium constant K2d; see Appendix. The equilibrium constant K2d is the ratio of the kinetic on- and off-rates kon and koff for the receptor-ligand binding (Bell, 1978). Characterizing the binding kinetics by the single parameter K2d rather than the two parameters kon and koff is justified at least if the on-reaction of a receptor-ligand pair in apposing membrane patches of our discrete model is faster than the timescale of 1 ms for the diffusive Monte Carlo steps. In general, such an approach may also be justified by a local equilibration within domains.
APPENDIX: BINDING ENERGIES AND TWO-DIMENSIONAL EQUILIBRIUM CONSTANTS
In this Appendix, we consider the relation between the two-dimensional equilibrium constants and the binding energies of receptors and ligands with square-well potentials (Eq. 3 or Eq. 4). The two-dimensional equilibrium constants are defined by
 |
(A1) |
where xR is the area concentration of receptors R in one of the membranes, xL is the area concentration of the ligands L in the apposing membrane, and xRL is the concentration of the complexes. In general, K2d depends on the state of the membrane, not only on the interaction potential of receptors and ligands. For example, if the membrane separation is to large to allow complex formation, the equilibrium constant (Eq. A1) is zero. In a bound state, K2d will depend on the separation and roughness of the membrane, which in turn are affected by the concentrations of the receptors, ligands, and steric repellers such as glycoproteins. Here, we only consider the ideal two-dimensional equilibrium constant for a membrane segment which is entirely within the binding range of the receptor/ligand square-well interaction.
For convenience, we choose in the following the grand canonical ensemble with chemical potentials μR and μL for receptors and ligands. However, the ideal two-dimensional equilibrium constant derived below will be independent of μR and μL and thus applies also to the canonical ensemble with fixed overall receptor and ligand concentrations.
Let us consider two apposing membrane patches within binding range of the receptors R and ligands L. A state of these apposing patches is characterized by the numbers mL and mR of ligands and receptors present in the two membranes. The configurational energy is h(mL,mR) = −URL min(mL,mR)–μLmL–μRmR, where URL > 0 is the binding energy of RL complexes. To simplify the notation below, the parameters μR, μL, and URL are taken to be in units of the thermal energy kBT. In a given state, there can be k bound RL complexes, plus either i uncomplexed ligands or j uncomplexed receptors (or no additional uncomplexed molecules). The partition function then has the form
 |
(A2) |
and the concentration of bound RL complexes is
 |
(A3) |
In deriving these expressions we made use of
 |
(A4) |
for s < 1. The concentration of uncomplexed receptors is given by
 |
(A5) |
and accordingly, the concentration of uncomplexed ligands is
 |
(A6) |
Hence, the ideal two-dimensional equilibrium constant of receptors and ligands in apposing membrane patches within binding range is given by
 |
(A7) |
The last expression holds for  which is true for the receptor and ligand concentrations studied in this article (see below).
For comparison, let us also consider two apposing membrane patches with a separation outside of the binding range of receptors and ligands. The partition function for the patches then is
 |
(A8) |
and the concentrations of receptors and ligands are given by
 |
(A9) |
References
- Alberts, B., D. Bray, J. Lewis, M. Raff, K. Roberts, and J. D. Watson. 1994. Molecular Biology of the Cell, 3rd Ed. Garland, New York.
- Allenspach, E. J., P. Cullinan, J. Tong, Q. Tang, A. G. Tesciuba, J. L. Cannon, S. M. Takahashi, R. Morgan, J. K. Burkhardt, and A. I. Sperling. 2001. ERM-dependent movement of CD43 defines a novel protein complex distal to the immunological synapse. Immunity 15:739–750. [DOI] [PubMed] [Google Scholar]
- Almeida, P. F. F., and W. L. C. Vaz. 1995. Lateral diffusion in membranes. In Handbook of Biological Physics, Vol 1. R. Lipowsky and E. Sackmann, editors. Elsevier/North Holland, Amsterdam.
- Bell, G. I. 1978. Models for the specific adhesion of cells to cells. Science. 200:618–627. [DOI] [PubMed] [Google Scholar]
- Binder, K., and D. W. Heermann. 1992. Monte Carlo Simulations in Statistical Physics. Springer, Berlin.
- Brochard, F., and J. F. Lennon. 1975. Frequency spectrum of the flicker phenomenon in erythrocytes. J. Phys. (Paris). 36:1035–1047. [Google Scholar]
- Bromley, S. K., W. R. Burack, K. G. Johnson, K. Somersalo, T. N. Sims, C. Sumen, M. M. Davis, A. S. Shaw, P. M. Allen, and M. L. Dustin. 2001. The immunological synapse. Annu. Rev. Immunol. 19:375–396. [DOI] [PubMed] [Google Scholar]
- Brown, D. A., and E. London. 1998. Structure and origin of ordered lipid domains in biological membranes. J. Membr. Biol. 164:103–114. [DOI] [PubMed] [Google Scholar]
- Burack, W. R., K.-H. Lee, A. D. Holdorf, M. L. Dustin, and A. S. Shaw. 2002. Cutting edge: quantitative imaging of raft accumulation in the immunological synapse. J. Immunol. 169:2837–2841. [DOI] [PubMed] [Google Scholar]
- Burroughs, N. J., and C. Wülfing. 2002. Differential segregation in a cell-cell contact interface: the dynamics of the immunological synapse. Biophys. J. 83:1784–1796. [DOI] [PMC free article] [PubMed] [Google Scholar]
- Chen, H.-J. 2003. Adhesion-induced phase separation of multiple species of membrane junctions. Phys. Rev. E. 67:031919. [DOI] [PubMed] [Google Scholar]
- Coombs, D., M. Dembo, C. Wofsy, and B. Goldstein. 2004. Equilibrium thermodynamics of cell-cell adhesion mediated by multiple ligand-receptor pairs. Biophys. J. 86:1408–1423. [DOI] [PMC free article] [PubMed] [Google Scholar]
- Davis, D. M., I. Chiu, M. Fassett, G. B. Cohen, O. Mandelboim, and J. L. Strominger. 1999. The human natural killer cell immune synapse. Proc. Natl. Acad. Sci. USA. 96:15062–15067. [DOI] [PMC free article] [PubMed] [Google Scholar]
- Davis, S. J., and P. A. van der Merwe. 1996. The structure and ligand interactions of CD2: implications for T-cell function. Immunol. Today. 17:177–187. [DOI] [PubMed] [Google Scholar]
- Delon, J., and R. N. Germain. 2000. Information transfer at the immunological synapse. Curr. Biol. 10:R923ÐR933. [DOI] [PubMed]
- Delon, J. K. Kaibuchi, and R. N. Germain. 2001. Exclusion of CD43 from the immunological synapse is mediated by phosphorylation-regulated relocation of the cytoskeletal adaptor myosin. Immunity. 15:691–701. [DOI] [PubMed] [Google Scholar]
- Dietrich, C., B. Yang, T. Fujiwara, A. Kusumi, and K. Jacobson. 2002. Relationship of lipid rafts to transient confinement zones detected by single particle tracking. Biophys. J. 82:274–284. [DOI] [PMC free article] [PubMed] [Google Scholar]
- Dustin, M. L., M. W. Olszowy, A. D. Holdorf, J. Li, S. Bromley, N. Desai, P. Widder, F. Rosenberger, P. A. van der Merwe, P. M. Allen, and A. S. Shaw. 1998. A novel adaptor protein orchestrates receptor patterning and cytoskeletal polarity in T-cell contacts. Cell. 94:667–677. [DOI] [PubMed] [Google Scholar]
- Dustin, M. L., and J. A. Cooper. 2000. The immunological synapse and the actin cytoskeleton: molecular hardware for T-cell signaling. Nat. Immunol. 1:23–29. [DOI] [PubMed] [Google Scholar]
- Dustin, M. L., S. K. Bromley, M. M. Davis, and C. Zhu. 2001a. Identification of self through two-dimensional chemistry and synapses. Annu. Rev. Cell Dev. Biol. 17:133–157. [DOI] [PubMed] [Google Scholar]
- Dustin, M. L., P. M. Allen, and A. S. Shaw. 2001b. Environmental control of immunological synapse formation and duration. Trends Immunol. 22:192–194. [DOI] [PubMed] [Google Scholar]
- Dustin, M. L., T. G. Bivona, and M. R. Philips. 2004. Membranes as messengers in T-cell adhesion signaling. Nat. Immunol. 5:363–372. [DOI] [PubMed] [Google Scholar]
- Fassett, M. S., D. M. Davis, M. M. Valter, G. B. Cohen, and J. L. Strominger. 2001. Signaling at the inhibitory natural killer cell immune synapse regulates lipid raft polarization but not class I MHC clustering. Proc. Natl. Acad. Sci. USA. 98:14547–14552. [DOI] [PMC free article] [PubMed] [Google Scholar]
- Friedl, P., and M. Gunzer. 2001. Interaction of T cells with APCs: the serial encounter model. Trends Immunol. 22:187–191. [DOI] [PubMed] [Google Scholar]
- Grakoui, A., S. K. Bromley, C. Sumen, M. M. Davis, A. S. Shaw, P. M. Allen, and M. L. Dustin. 1999. The immunological synapse: a molecular machine controlling T-cell activation. Science. 285:221–227. [DOI] [PubMed] [Google Scholar]
- Gunzer, M., A. Schäfer, S. Borgmann, S. Grabbe, K. S. Zänker, E.-B. Bröcker, E. Kämpgen, and P. Friedl. 2000. Antigen presentation in extracellular matrix: interactions of T cells with dendritic cells are dynamic, short lived, and sequential. Immunity. 13:323–332. [DOI] [PubMed] [Google Scholar]
- Hailman, E., W. R. Burack, A. S. Shaw, M. L. Dustin, and P. A. Allen. 2002. Immature CD4+CD8+ thymozytes form a multifocal immunological synapse with sustained tyrosine phosphorylation. Immunity. 16:839–848. [DOI] [PubMed] [Google Scholar]
- Janes, P. W., S. C. Ley, and A. I. Magee. 1999. Aggregation of lipid rafts accompanies signaling via the T-cell antigen receptor. J. Cell Biol. 147:447–461. [DOI] [PMC free article] [PubMed] [Google Scholar]
- Janes, P. W., S. C. Ley, A. I. Magee, and P. S. Kabouridis. 2000. The role of lipid rafts in T-cell antigen receptor (TCR) signaling. Semin. Immunol. 12:23–34. [DOI] [PubMed] [Google Scholar]
- Johnson, K. G., S. K. Bromley, M. L. Dustin, and M. L. Thomas. 2000. A supramolecular basis for CD45 tyrosine phosphatase regulation in sustained T-cell activation. Proc. Natl. Acad. Sci. USA. 97:10138–10143. [DOI] [PMC free article] [PubMed] [Google Scholar]
- Krummel, M. F., M. D. Sjaastad, C. Wülfing, and M. M. Davis. 2000. Differential clustering of CD4 and CD3ζ during T-cell recognition. Science. 289:1349–1352. [DOI] [PubMed] [Google Scholar]
- Kusumi, A., and Y. Sako. 1996. Cell surface organization by the membrane skeleton. Curr. Surface Org. Membr. Skel. 8:566–574. [DOI] [PubMed] [Google Scholar]
- Lee, K.-H., A. D. Holdorf, M. L. Dustin, A. C. Chan, P. A. Allen, and A. S. Shaw. 2002. T-cell receptor signaling precedes immunological synapse formation. Science. 295:1539–1542. [DOI] [PubMed] [Google Scholar]
- Lee, K.-H., A. R. Dinner, C. Tu, G. Campi, S. Raychaudhuri, R. Varma, T. N. Sims, W. R. Burack, H. Wu, J. Wang, O. Kanagawa, M. Markiewicz, A. M. Allen, M. L. Dustin, A. K. Chakraborty, and A. S. Shaw. 2003. The immunological synapse balances T-cell receptor signaling and degradation. Science. 302:1218–1222. [DOI] [PubMed] [Google Scholar]
- Lee, S.-J. E., Y. Hori, J. T. Groves, M. L. Dustin, and A. K. Chakraborty. 2002. Correlation of a dynamic model for immunological synapse formation with effector functions: two pathways to synapse formation. Trends Immunol. 23:492–499. [DOI] [PubMed] [Google Scholar]
- Lee, S.-J., Y. Hori, and A. K. Chakraborty. 2003. Low T-cell receptor expression and thermal fluctuations contribute to formation of dynamic multifocal synapses in thymozytes. Proc. Natl. Acad. Sci. USA. 100:4383–4388. [DOI] [PMC free article] [PubMed] [Google Scholar]
- Lollo, B. A., K. W. H. Chan, E. M. Hanson, V. T. Moy, and A. A. Brian. 1993. Direct evidence for two affinity states for the lymphozyte function-associated antigen 1 on activated T cells. J. Biol. Chem. 268:21693–21700. [PubMed] [Google Scholar]
- Mehta, A. D., M. Rief, J. A. Spudich, D. A. Smith, and R. M. Simmons. 1999. Single-molecule biomechanics with optical methods. Science. 283:1689–1695. [DOI] [PubMed] [Google Scholar]
- Mempel, T. R., S. E. Henrickson, and U. H. von Andrian. 2004. T-cell priming by dendritic cells in lymph nodes occurs in three distinct phases. Nature. 427:154–159. [DOI] [PubMed] [Google Scholar]
- Monks, C. R. F., B. A. Freiberg, H. Kupfer, N. Sciaky, and A. Kupfer. 1998. Three-dimensional segregation of supramolecular activation clusters in T cells. 1998. Nature. 395:82–86. [DOI] [PubMed] [Google Scholar]
- Orsello, C. E., D. A. Lauffenburger, and D. A. Hammer. 2001. Molecular properties in cell adhesion: a physical and engineering perspective. Trends Biotechnol. 19:310–316. [DOI] [PubMed] [Google Scholar]
- Potter, T. A., K. Grebe, B. Freiberg, and A. Kupfer. 2001. Formation of supramolecular activation clusters on fresh ex vivo CD8+ T cells after engagement of the T-cell receptor and CD8 by antigen-presenting cells. Proc. Natl. Acad. Sci. USA. 98:12624–12629. [DOI] [PMC free article] [PubMed] [Google Scholar]
- Pralle, A., P. Keller, E. L. Florin, K. Simons, and J. K. H. Hörber. 2000. Sphingolipid-cholesterol rafts diffuse as small entities in the plasma membrane of mammalian cells. J. Cell Biol. 148:997–1007. [DOI] [PMC free article] [PubMed] [Google Scholar]
- Qi, S. Y., J. T. Groves, and A. K. Chakraborty. 2001. Synaptic pattern formation during cellular recognition. Proc. Natl. Acad. Sci. USA. 98:6548–6553. [DOI] [PMC free article] [PubMed] [Google Scholar]
- Seifert, U., and R. Lipowsky. 1995. Morphology of vesicles. In Handbook of Biological Physics, Vol 1. R. Lipowsky and E. Sackmann, editors. Elsevier/North Holland, Amsterdam.
- Richie, L. I., P. J. R. Ebert, L. C. Wu, M. F. Krummel, J. J. T. Owen, and M. M. Davis. 2002. Imaging synapse formation during thymozyte selection: inability of CD3ζ to form a stable central accumulation during negative selection. Immunity. 16:595–606. [DOI] [PubMed] [Google Scholar]
- Raychaudhuri, S., A. K. Chakraborty, and M. Kardar. 2003. An effective membrane model of the immunological synapse. Phys. Rev. Lett. 91:208101. [DOI] [PubMed] [Google Scholar]
- Sharma, P., R. Varma, R. C. Sarasij, Ira, K. Gousset, G. Krishnamoorthy, M. Rao, and S. Mayor. 2004. Nanoscale organization of multiple GPI-anchored proteins in living cell membranes. Cell. 116:577–589. [DOI] [PubMed] [Google Scholar]
- Shaw, A. S., and M. L. Dustin. 1997. Making the T-cell receptor go the distance: a topological view of T-cell activation. Immunity. 6:361–369. [DOI] [PubMed] [Google Scholar]
- Simons, K., and E. Ikonen. 1997. Functional rafts in lipid membranes. Nature. 387:569–572. [DOI] [PubMed] [Google Scholar]
- Simons, K., and D. Toomre. 2000. Lipid rafts and signal transduction. Nat. Rev. Mol. Cell Biol. 1:31–41. [DOI] [PubMed] [Google Scholar]
- Simson, R., E. Wallraff, J. Faix, J. Niewohner, G. Gerisch, and E. Sackmann. 1998. Membrane bending modulus and adhesion energy of wild-type and mutant cells of Dictyostelium lacking talin or cortexillins. Biophys. J. 74:514–522. [DOI] [PMC free article] [PubMed] [Google Scholar]
- van der Merwe, A. P., S. J. Davis, A. S. Shaw, and M. L. Dustin. 2000. Cytoskeletal polarization and redistribution of cell-surface molecules during T-cell antigen recognition. Semin. Immunol. 12:5–21. [DOI] [PubMed] [Google Scholar]
- van Kampen, N. G. 1992. Stochastic Processes in Physics and Chemistry. Elsevier, Amsterdam, NL.
- Viola, A., and A. Lanzavecchia. 1999. T-cell activation and the dynamic world of rafts. APMIS. 107:615–623. [DOI] [PubMed] [Google Scholar]
- Weikl, T. R., J. T. Groves, and R. Lipowsky. 2002. Pattern formation during adhesion of multicomponent membranes. Europhys. Lett. 59:916–922. [Google Scholar]
- Wülfing, C., and M. M. Davis. 1998. A receptor/cytoskeletal movement triggered by costimulation during T-cell activation. Science. 282:2266–2269. [DOI] [PubMed] [Google Scholar]
- Wülfing, C., I. Tskvitaria-Fuller, N. Burroughs, M. D. Sjaastad, J. Klem, and J. D. Schatzle. 2002. Interface accumulation of receptor/ligand couples in lymphozyte activation: methods, mechanisms, and significance. Immunol. Rev. 189:64–83. [DOI] [PubMed] [Google Scholar]
- Zhang, X., E. Wojcikiewicz, and V. T. Moy. 2002. Force spectroscopy of the leukocyte function-associated antigen-1/intercellular adhesion molecule-1 interaction. Biophys. J. 83:2270–2279. [DOI] [PMC free article] [PubMed] [Google Scholar]