

Abstract
Ribonuclease Sa (RNase Sa) contains no tryptophan (Trp) residues. We have added single Trp residues to RNase Sa at sites where Trp is found in four other microbial ribonucleases, yielding the following variants of RNase Sa: Y52W, Y55W, T76W, and Y81W. We have determined crystal structures of T76W and Y81W at 1.1 and 1.0 Å resolution, respectively. We have studied the fluorescence properties and stabilities of the four variants and compared them to wild-type RNase Sa and the other ribonucleases on which they were based. Our results should help others in selecting sites for adding Trp residues to proteins. The most interesting findings are: 1), Y52W is 2.9 kcal/mol less stable than RNase Sa and the fluorescence intensity emission maximum is blue-shifted to 309 nm. Only a Trp in azurin is blue-shifted to a greater extent (308 nm). This blue shift is considerably greater than observed for Trp71 in barnase, the Trp on which Y52W is based. 2), Y55W is 2.1 kcal/mol less stable than RNase Sa and the tryptophan fluorescence is almost completely quenched. In contrast, Trp59 in RNase T1, on which Y55W is based, has a 10-fold greater fluorescence emission intensity. 3), T76W is 0.7 kcal/mol more stable than RNase Sa, indicating that the Trp side chain has more favorable interactions with the protein than the threonine side chain. The fluorescence properties of folded Y76W are similar to those of the unfolded protein, showing that the tryptophan side chain in the folded protein is largely exposed to solvent. This is confirmed by the crystal structure of the T76W which shows that the side chain of the Trp is only ∼7% buried. 4), Y81W is 0.4 kcal/mol less stable than RNase Sa. Based on the crystal structure of Y81W, the side chain of the Trp is 87% buried. Although all of the Trp side chains in the variants contribute to the unusual positive circular dichroism band observed near 235 nm for RNase Sa, the contribution is greatest for Y81W.
INTRODUCTION
Tryptophan residues are sensitive reporters of their environment (Chen and Barkley, 1998; Engelborghs, 2003). Consequently, there is often a large change in the fluorescence emission spectrum when a protein unfolds and fluorescence intensity can be used to follow protein folding (Eftink, 1991). This is especially useful because fluorescence measurements are extremely sensitive and only small amounts of protein are needed. Fluorescence is also useful for other purposes in the study of proteins. The emission from fluorophores occurs at wavelengths that are longer than those of light absorption. This loss of energy between absorption and emission of light is termed the Stokes' shift, and it depends on the environment of the fluorophore. The λmax of native proteins containing Trp ranges from 308 to 355 nm (Vivian and Callis, 2001), with residues in apolar environments typically having the most blue-shifted emission. Unfolding of a protein almost always leads to a red shift in the emission to a λmax in the range 345–355 nm (Eftink, 1991; Swaminathan et al., 1994). One goal of the present study was to gain a better understanding of how the environment influences λmax and the fluorescence intensity of folded proteins. This information will be useful to those who want to insert a Trp into a protein for use in studying the folding of the protein or the binding of the protein to other molecules like DNA (Mascotti and Lohman, 1997).
Several of the microbial RNases have proven to be useful models for studying protein folding: RNase T1 (Giletto and Pace, 1999; Loris et al., 1999); barnase (Axe et al., 1999; Bond et al., 1997; Killick et al., 1998; Soler-Gonzalez and Fersht, 1997); and RNases Sa, Sa2, and Sa3(Grimsley et al., 1999; Laurents et al., 2003; Pace et al., 1998, 2001). Table 1 shows the percent sequence identity and aromatic amino acid content of these five RNases. Note that RNase Sa contains no Trp residues but that the other four RNases do. For the studies reported here, we have prepared variants of RNase Sa in which single Trp residues are inserted in RNase Sa at sites equivalent to where Trp residues occur in the other four RNases. (See Pace et al., 1998, for an amino acid sequence alignment.) As shown in Table 2, the solvent accessibilities of these sites range from completely buried to completely exposed. The location of the residues in RNase Sa which were replaced by Trp residues is shown in a ribbon diagram in Fig. 1.
TABLE 1.
Percent sequence identity and aromatic amino acid content for five microbial RNases
| Sequence identity to Sa | Tryptophan | Tyrosine | Phenylalanine | Aromatics/total | |
|---|---|---|---|---|---|
| Sa | 100% | 0 | 8 | 3 | 11/96 |
| Sa2 | 69% | 1 | 7 | 3 | 11/97 |
| Sa3 | 56% | 1 | 8 | 4 | 13/99 |
| T1 | 23% | 1 | 9 | 3 | 13/104 |
| Ba | 11% | 3 | 7 | 4 | 14/110 |
From Pace et al. (1998).
TABLE 2.
Side-chain accessibilities in wild-type RNase Sa, T76W, Y81W, and the Trp residues in the corresponding RNases
| Residue in RNase Sa | Side chain % buried* | Trp side chain in T76W & Y81W | Trp residue in corresponding RNase | Side chain % buried |
|---|---|---|---|---|
| Tyr52 | 98 | NA | RNase Ba Trp71 | 98 |
| Tyr55 | 91 | NA | RNase T1 Trp59 | 100 |
| Thr76 | 4 | 7%† | RNase Sa3 Trp79 | 0 |
| Tyr81 | 89 | 87%* | RNase Sa2 Trp82 | 94 |
Percent buried calculated by the Lee and Richards (1971) algorithm.
Average for the two molecules in the asymmetric unit.
Average for the two conformation of the Trp. The individual values are 3.6 and 10.5% buried.
FIGURE 1.

Secondary structure representation of RNase Sa showing the residues that were replaced by tryptophan in the four variants studied in this article. This plot was prepared using the program MOLSCRIPT (Kraulis, 1991).
RNase Sa is the smallest member of the microbial RNase family with just 96 amino acids. It is one of the smallest enzymes known. A crystal structure of RNase Sa has been determined at 1.2 Å resolution (Sevcik et al., 1996) and at 1.0 Å resolution (Sevcik et al., 2002a), and a solution structure has been determined using NMR (Laurents et al., 2001). NMR has also been used to measure the pK values of the ionizable residues in RNase Sa (Huyghues-Despointes et al., 2003; Laurents et al., 2003). The thermodynamics of folding of RNase Sa has been studied and the conformational stability is 6.0 kcal mol−1 at 25°C and pH 7.0 (Pace et al., 1998).
The fluorescence properties of the single Trp in RNase T1 have been studied by several groups (See Eftink, 1991, for a review), as have the three Trp residues in barnase (Loewenthal et al., 1991; Willaert et al., 1992). In this article we report studies of the fluorescence properties of the seven single Trp-containing proteins listed in Table 2 in both their folded and unfolded conformations. We also report studies of the contribution of the Trp residues to the conformational stability and to the circular dichroic properties of RNase Sa.
MATERIALS AND METHODS
Materials
N-acetyl-l-tryptophan-amide and 3-[N-morpholino] propanesulfonic acid (MOPS) were obtained from Sigma-Aldrich (St. Louis, MO). N-acetyl-Ala-Trp-Ala-amide was synthesized by AnaSpec (San Jose, CA). Ultrapure urea was obtained from Nacalai Tesque (Kyoto, Japan). Enzymes for the manipulation of DNA were from Promega (Madison, WI). Oligonucleotides were made by the Gene Technologies Laboratory at Texas A&M University and were used without further purification. All other reagents were of analytical grade. Wild-type and variant forms of RNase Sa were prepared and purified as described previously (Hebert et al., 1997). Urea stock solutions were prepared by weight, and the molarity of the solutions was calculated as described previously (Pace and Scholtz, 1997).
Sample preparation
The concentrations of the RNase Sa solutions were determined spectrophotometrically using a Gilford Model 250 spectrophotometer (Gilford, Oberlin, OH). A molar absorption coefficient of ɛ280 = 12045 M−1 cm−1 was used for wild-type RNase Sa (Hebert et al., 1997). For the tyrosine to tryptophan variants a molar absorption coefficient of ɛ280 = 16,055 M−1 cm−1 was used, and for the threonine to tryptophan variant, ɛ280 = 17,545 M−1 cm−1 was used. These are based on the average molar absorption coefficients observed for Tyr and Trp residues in proteins (Pace et al., 1995). The error in determining the protein concentration using these predicted extinction coefficients is <4%.
Fluorescence emission spectra
Protein samples with 0.94 μM concentration in 30 mM MOPS, pH 7.0, 25°C were studied under native and denatured conditions (9 M urea). All fluorescence measurements were made on an SLM 8100 spectrofluorometer (SLM, Urban, IL). The samples were excited at 280 nm and the emission was recorded from 300 to 400 nm every nanometer, using 2-nm emission and 4-nm excitation bandwidths and a 5-s integration time. The temperature was controlled using a Brinkman Lauda RM refrigerated water bath (Brinkman Lauda, Westbury, NY). The fluorescence contribution from the MOPS and urea was subtracted from that of the samples, and instrument corrections were applied. The emission λmax is the wavelength where the greatest fluorescence intensity, IF, was observed.
Urea denaturation curves
The stability of wild-type RNase Sa and the four variants was determined by analyzing urea denaturation curves determined using circular dichroism measurements at 234 nm as previously described (Pace and Scholtz, 1997). For Y52W, Y55W, and Y81W, denaturation curves were also determined by measuring the fluorescence intensity at 320 nm for Y52W, 352 nm for Y55W, and 324 nm for Y81W. (For Y76W and wild-type RNase Sa, the difference in fluorescence intensity between the folded and unfolded states is too small to use to follow unfolding.) Each sample was incubated for at least 16 h before measurements were made to ensure that the folding reaction had reached equilibrium. The intrinsic fluorescence intensity of each sample was measured by exciting at 280 nm and monitoring emission at a constant wavelength for a period of 1 min in an SLM 8100 spectrofluorometer with four nanometer emission and four nanometer excitation bandwidths.
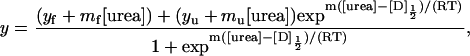
Analysis of the denaturation curves was performed using the two-state folding model and the linear extrapolation method (Pace and Shaw, 2000), as described by Santoro and Bolen (1988),
 |
(1) |
where y is the observed parameter, mf and yf are the slope and intercept of the pretransition baseline and mu and yu are the slope and intercept of the post-transition baseline, m is the dependence of free energy of unfolding on urea concentration, and D½ is the midpoint of the denaturation curve. The free energy of unfolding in the absence of denaturant, ΔG(H2O), is the product of m and D½. The experimental curves were fit by the above equation using ORIGIN or SigmaPlot data analysis software. Denaturation curves were performed at least twice for each variant.
Circular dichroism
Circular dichroism spectra were measured in 0.1-cm quartz cuvettes in 30 mM MOPS buffer, pH 7, and 25°C using an Aviv 202 CD spectrophotometer (Lakewood, NJ). Measured circular dichroism ellipticity values were converted to mean residue ellipticity, [θ], in deg cm2 decimol−1 using the equation
 |
(2) |
where Δθ is the difference in millidegrees between the protein sample and the buffer, C is the concentration of protein in mM, n is the number of residues in the protein, and l is the pathlength of the cuvette in cm.
Crystal structure determination
Crystals were prepared using the hanging-drop vapor-diffusion method. Crystallization conditions were very close to those reported for wild-type RNase Sa (Sevcik et al., 1996). For data collection, crystals of both mutants were soaked in the precipitant solutions enriched by glycerol at concentrations of 20% and flash-frozen in a stream of liquid nitrogen directly in the cryogenic loops.
The data for the Y81W mutant were collected at cryogenic temperature (100 K) from a single crystal with a MAR Research (Hamburg, Germany) imaging plate scanner, and a radiation wavelength of 0.812 Å. Two sets of images with limiting resolution of 1.0 and 2.4 Å were measured, with an oscillation range of 0.4 and 0.8° per image, respectively. For both sets, ∼120° of total rotation was covered. For the low-resolution pass, the exposure time was diminished sixfold.
The data for crystals of the T76W mutant were collected in the same way with a radiation of wavelength 1.096 Å. Two sets with limiting resolution of 1.1 and 2.5 Å were measured, with an oscillation range of 0.5 and 2.0° per image, respectively. For both sets, ∼145° of total rotation was covered. For the low-resolution pass, the exposure time was diminished threefold.
The two molecules of Y81W and one molecule of T76W gave a VM parameter of 2.3 and 1.8 Å3/Da with a solvent content of 46 and 32%, respectively (Matthews, 1968). The data collection statistics for both mutants are summarized in Table 3.
TABLE 3.
Summary of data collection statistics for RNase Sa variants T76W and Y81W
| Y81W | T76W | |
|---|---|---|
| X-ray source | BW7A | X31 |
| Wavelength (Å) | 0.812 | 1.096 |
| Temperature (K) | 100 | 100 |
| Resolution range (Å) | 33.3–1.0 | 29.0–1.1 |
| Space group | P212121 | P212121 |
| Unit cell a, b, c (Å) | 38.21, 64.31, 77.67 | 33.87, 40.46, 56.64 |
| Last resolution shell (Å) | 1.01–1.00 | 1.11–1.10 |
| Unique reflections | 103,514 (4121) | 29,254 (705) |
| Completeness (%) | 99.6 (97.7) | 95.3 (90.2) |
| R(I)merge* (%) | 4.7 (16.5) | 3.0 (18.0) |
| I/σ(I) | 34.5 (10.2) | 53.3 (8.65) |
| Redundancy | 6.5 (4.5) | 6.4 (5.2) |

The structures of the Y81W and T76W variants were solved by molecular replacement with the program MOLREP (Murshudov et al., 1997) using molecule A from RNase Sa coordinate set 1RGG as the search model. For Y81W, both the rotation and translation function searches resulted in two clear solutions. Rigid-body refinement of the resulting model gave a correlation coefficient of 48% and an R-factor of 44% in the 10–3.5 Å resolution range. For T76W, MOLREP gave one clear solution with a correlation coefficient of 51% and R-factor of 49% in the 10–3.5 Å resolution range.
Refinement of both structures was done using Version 5.1.24 of the maximum-likelihood program REFMAC (Murshudov et al., 1997) against 95% of the data. The remaining 5% of randomly excluded reflections were used for cross-validation by means of the Rfree factor (Brunger and Nilges, 1993). Both structures were refined with isotropic, and in the later stages with anisotropic temperature factors including contributions of the hydrogen atoms generated at their riding positions on their parent C, N, and O atoms. Isotropic and anisotropic temperature factors, bond lengths, and bond angles were restrained according to the standard criteria employed in REFMAC. After each refinement cycle an automated refinement procedure ARP/wARP (Perrakis et al., 1999) was applied for modeling and updating the solvent structure. The models were adjusted manually between refinement cycles on the basis of (3Fo–2Fc, αc) and (Fo–Fc, αc) maps using the program XtalView (McRee, 1993). Tryptophan residues were introduced at the stage when the electron density at the Thr76 and Tyr81 mutation sites clearly confirmed the mutations.
RESULTS
Structure of T76W
The structure of T76W RNase Sa was determined at 1.1 Å resolution. The asymmetric unit contains one protein molecule and 240 solvent molecules. Two conformations were modeled for the main chain in segments Val2 –Thr5, Arg65–Gly66, and Gly83–Tyr86; and for the side chains of Ser48, Glu54, and Trp76. The refinement statistics and PDB accession code are given in Table 4.
TABLE 4.
Summary of refinement statistics for RNase Sa variants T76W and Y81W
| Y81W | T76W | |
|---|---|---|
| Molecules in asymmetric unit | 2 | 1 |
| Model atom sites | 928/758 | 828 |
| Solvent molecules | 589 | 240 |
 |
1 | — |
| Rfree factor (%) | 16.6 | 16.7 |
| R-factor (%) | 14.6 | 13.0 |
| Average B-values (Å2) | ||
| Protein atoms | 8.02/8.63 | 8.66 |
| Solvent molecules | 24.67 | 23.62 |
 anion anion |
7.53 | — |
| Wilson plot (Å2) | 10.3 | 9.9 |
| Coordinates ESU (Å) | ||
| Based on R | 0.025 | 0.034 |
| Based on Rfree | 0.026 | 0.036 |
| B-factor restraints | ||
| Main-chain bond (Å2) | 1.179 | 1.003 |
| Main-chain angle (Å2) | 1.804 | 1.560 |
| Side-chain bond (Å2) | 2.068 | 1.790 |
| Side-chain angle (Å2) | 2.912 | 2.543 |
| RMS deviations from ideal values | ||
| Bond distances (Å) | 0.01 | 0.01 |
| Bond angles (°) | 1.478 | 1.428 |
| Chiral centers (Å3) | 0.091 | 0.084 |
| Planar groups (Å) | 0.009 | 0.010 |
| Ramachandran profile | ||
| Most favorable (%) | 92.5/88.8 | 90.0 |
| Additionally allowed (%) | 7.5/11.2 | 10.0 |
| PDB code | 1T2H | 1T2I |
Despite using the same crystallization conditions as those for the wild-type RNase Sa, the crystal packing in the T76W structure is different with only one molecule in the asymmetric unit. In the wild-type structure there are two molecules: A and B. Thr76 is localized in a surface loop and its side chain in molecule A is involved in crystal contacts with a neighboring molecule in the wild-type structure. Thus, the replacement of Thr by Trp seems to be responsible for the change in crystal packing. Least-square superposition (Kabsch, 1976) of the T76W mutant with the wild-type RNase Sa structure (1RGG) based on all 96 Cα atoms gave an RMSD of 0.56 Å. The maximum displacement is 1.22 Å at the Cys96 Cα atom. The deviation between the Thr76 and Trp76 Cα atoms is 0.99 Å. This difference is probably mainly due to differences in crystal packing rather than a direct effect of the mutation.
The crystal structure of RNase Sa3, the RNase on which the T76W mutation was based, was solved previously at 1.7 Å (1MGR) and 2.0 Å (1MGW) resolution (Sevcik et al., 2002b). Electron density for the Trp79 side chain was poorly defined in the 1MGR structure, so 1MGW was used for comparison with the mutant structure. A stereo view of the superposition of the surface loop of wild-type RNase Sa, the T76W variant, and RNase Sa3 is shown in Fig. 2 A.
FIGURE 2.

(A) Stereo view of the superposition of the T76W structure (red) and the RNase Sa3 structure (blue) on the wild-type RNase Sa structure (green). (B) Stereo view of the superposition of the Y81W structure (red) and the RNase Sa2 structure (blue) on the wild-type RNase Sa structure (green). In A, the succeeding residue is shown and in B the succeeding residue is shown, as are the Leu and Val side chains that are important in burying the Tyr/Trp side chains. In both A and B the water molecules hydrogen-bonded to the Nɛ1 of the Trp residues or the −OH of the Tyr residue are also shown. This plot was prepared using the program MOLSCRIPT (Kraulis, 1991).
Structure of Y81W
The structure of Y81W RNase Sa was determined at 1.0 Å resolution. The asymmetric unit contains two protein molecules, 589 solvent molecules, and a sulfate anion in the phosphate binding site. Two conformations were modeled for the main-chain segments Asp25–Ser42 and Thr82–His85 in Molecule A, as was the case for the wild-type RNase Sa structure determined at 1.0 Å resolution (Sevcik et al., 2002a). These conformations represent open and closed conformations of the active site. Intermolecular contacts in the crystal make it impossible for the same segments in molecule B to move. For the side chain of Arg65 in molecule A and Asp25 and Tyr49 in molecule B, two conformations were modeled. The refinement statistics and PDB accession code are given in Table 4.
For all RNase Sa structures with two molecules in the asymmetric unit, molecule A differs from molecule B mainly near Arg63 with a maximum displacement of 1.5 Å. This difference is caused by different crystal contacts. The Cα RMSD values for the structural overlaps of wild-type RNase Sa (1RGG) and Y81W are as follows: 0.33 Å (A with A), 0.44 Å (A with B), 0.42 Å (B with A), and 0.20 Å (B with B), respectively. In these overlaps, the maximum displacements are 0.79 Å (at Cα 40), 1.93 Å (at Cα 31), 1.59 Å (at Cα 63), and 0.71 Å at (Cα 3), respectively. Overall, these results suggest that the differences in the main-chain conformations are small and comparable to those caused by the intrinsic experimental error. A stereo view of the superposition of wild-type RNase Sa, the Y81W variant, and RNase Sa2 is shown in Fig. 2 B.
Fluorescence emission spectra
The four panels in Fig. 3 compare the fluorescence emission spectra of the native and denatured states of the four single Trp-containing RNase Sa variants with similar spectra for the corresponding microbial RNases. (The comparison between RNase Sa Y52W and barnase was not done since barnase contains three tryptophans.) The wavelength of maximum fluorescence intensity, λmax, and the fluorescence intensity, IF, at λmax are listed in Table 5 for all of the scans in Fig. 3. For Y52W, λmax is >30 nm lower for the native protein than for the denatured protein and IF is greater for the native protein near 310 nm, but less above 330 nm (Fig. 3 A). The emission spectrum of native Y55W bears little resemblance to that of native RNase T1, but the denatured spectra are very similar (Fig. 3 B). For T76W, the λmax values are similar to those of RNase Sa3 for both the native and denatured states, but the IF values are substantially higher (Fig. 3 C). This is the only case where the IF values for the denatured state differ significantly between the variant and the corresponding microbial ribonuclease. For Y81W, the λmax values are similar to those of RNase Sa2 for both the native and denatured states, but the IF value for the native state of RNase Sa2 is considerably greater than that of Y81W (Fig. 3 D).
FIGURE 3.

Fluorescence emission spectra (280 nm excitation) of four RNase Sa variants: Y52W (A), Y55W (B), T76W (C), Y81W (D); and RNase T1 (B), RNase Sa3 (C), and RNase Sa2 (D) The conditions were: 0.94 μM RNase in 30 mM MOPS, pH 7.0 and 25°C for the native states; and 0.94 μM RNase in 30 mM MOPS, pH 7.0, 9 M urea and 25°C for the denatured states. (A) RNase Sa (Y52W): native state (open circles) and denatured state (line). The native λmax is 309 nm, and the denatured λmax is 344 nm. (B) RNase Sa (Y55W): native state (open circles) and denatured state (line); RNase T1: native state (solid circles) and denatured state (plus symbols).The native λmax is 318 nm for RNase T1 and 310 nm for RNase Sa Y55W. The denatured λmax is 345 nm for RNase T1 and 345 nm for RNase Sa Y55W. (C) RNase Sa (T76W): native state (open circles) and denatured state (line); RNase Sa3: native state (solid circles) and denatured state (plus symbols). The native λmax is 337 nm for RNase Sa3 and 340 nm for RNase Sa T76W. The denatured λmax is 343 nm for RNase Sa3 and 343 nm for RNase Sa Y55W. (D) RNase Sa (Y81W): native state (open circles) and denatured state (line); RNase Sa2: native state (solid circles) and denatured state (plus symbols). The native λmax is 320 nm for RNase Sa2 and 319 nm for RNase Sa Y81W. The denatured λmax is 343 nm for RNase Sa2 and 343 nm for RNase Sa Y81W.
TABLE 5.
Wavelengths of maximum fluorescence emission intensity, λmax, and fluorescence intensities, IF, at λmax for the native and denatured states of the four RNase Sa variants and the wild-type proteins on which the variants are based
| Native emission*
|
Denatured emission†
|
||||
|---|---|---|---|---|---|
| Variant | % Buried | λmax, nm | IF | λmax, nm | IF |
| Y52W (Ba) | 98 (98) | 309 (332)‡ | 30,900 (NA) | 344 (NA) | 23,100 (NA) |
| Y55W (T1) | 91 (100) | 310§ (318) | 8150 (82,800) | 345 (345) | 26,300 (29,200) |
| T76W (Sa3) | 4 (0) | 335 (337) | 30,100 (21,200) | 344 (343) | 25,800 (20,100) |
| Y81W (Sa2) | 87 (94) | 319 (320) | 40,200 (62,700) | 343 (343) | 21,500 (19,500) |
30 mM MOPS buffer, pH 7, 25°C.
9 M urea, 30 mM MOPS buffer, pH 7, 25°C.
Data from Willaert et al. for barnase with a single tryptophan at residue 71; from Willaert et al. (1992).
If a wavelength of 296 nm is used for the excitation instead of 280 nm, λmax = 322 nm.
Circular dichroic spectra
Fig. 4 shows the far ultraviolet (UV) circular dichroism (CD) spectra of wild-type RNase Sa and the four single tryptophan-containing variants. It is clear that the positive CD band at 235 nm is greater for all of the variants than it is for wild-type RNase Sa. Thus, all of the added Trp contribute to the positive CD band, but the contributions differ significantly depending on the location of the Trp.
FIGURE 4.

Far UV CD spectra of wild-type RNase Sa and the four tryptophan variants (200 μM) in 30 mM MOPS, pH 7.0 and 25°C . The scans show wild-type (dashed line), Y81W (solid line), Y52W (solid circles), T76W (plus symbols), and Y55W (open circles).
Urea denaturation
Typical results from an analysis of urea denaturation curves for wild-type RNase Sa and the four variants are shown in Fig. 5. The urea denaturation curves were analyzed using the linear extrapolation method (Pace and Shaw, 2000), and the results are summarized in Table 6. The T76W variant is more stable than wild-type RNase Sa, but the other three variants are less stable.
FIGURE 5.

Urea denaturation of wild-type RNase Sa and the four tryptophan variants. The curves represent the following proteins: RNase Sa (solid circles), T76W (open diamonds), Y81W (open circles), Y55W (solid squares), and Y52W (solid triangles).
TABLE 6.
Parameters characterizing the urea unfolding curves of wild-type RNase Sa and four single Trp-containing variants
| Protein | Probe |
 (M) (M) |
m-value* (cal mol−1 M−1) |
 (kcal mol−1) (kcal mol−1) |
Δ(ΔG)† |
|---|---|---|---|---|---|
| WT | Fluorescence‡ | ||||
| CD | 6.52 | 900 | 5.85 | ||
| Y52W | Fluorescence | 3.47 | 970 | 3.35 | |
| CD | 3.48 | 990 | 3.45 | −2.9 | |
| Y55W | Fluorescence | 4.5 | 1200 | 5.40 | |
| CD | 4.44 | 1090 | 4.85 | −2.1 | |
| T76W | Fluorescence‡ | ||||
| CD | 7.30 | 920 | 6.70 | +0.7 | |
| Y81W | Fluorescence | 6.00 | 940 | 5.70 | |
| CD | 6.10 | 1050 | 6.40 | −0.4 |
The urea denaturation curves were determined at 25°C, pH = 7, in 30 mM MOPS buffer, and analyzed using Eq. 1, as described in Materials and Methods.
The error for (urea)½ measurements is ±0.03; the error for m-value measurements is ±10%.
Δ(ΔG) values were calculated as follows: (average m-value) × ([Urea]1/2, variant–[Urea]1/2, wt). A positive value denotes an increase in stability over wild-type.
Urea denaturation curves could not be determined using fluorescence measurements for RNase Sa and the T76W variant.
DISCUSSION
RNase Sa contains no tryptophan residues (Table 1). We have added single tryptophans to RNase Sa at the four residues shown in Fig. 1. We chose sites where Trp residues are found in other microbial RNases (Table 2). We are currently using these Trp-containing variants to study the mechanism of RNase Sa folding and to gain a better understanding of the denatured state ensemble. Some properties of the aromatic amino acids are summarized in Table 7. Trp has the largest and most hydrophobic side chain of all of the amino acids. Because of its size, when a Trp residue replaces any other residue in a protein it may cause a conformational change and decrease the stability for steric reasons. Our four Trp-containing variants retain their enzyme activity, indicating that their conformation has not been changed to a great extent. We were able to determine crystal structures of two of the variants, T76W and Y81W, and these structures are discussed next.
TABLE 7.
Aromatic amino acids: residue volumes, mean percent buried in proteins, hydrophobicity, absorbance and fluorescence properties
| Absorbance§
|
Fluorescence∥
|
||||||
|---|---|---|---|---|---|---|---|
| Amino acid | Volume (Å3)* | Mean % buried† | Hydrophobicity (kcal mol−1)‡ | λmax | ɛmax | λmax | ϕF |
| Tryptophan | 232 | 87 | 3.1 | 280 | 5600 | 353 | 0.13 |
| Tyrosine | 197 | 77 | 1.3 | 275 | 1400 | 304 | 0.14 |
| Phenylalanine | 194 | 88 | 2.4 | 258 | 200 | 282 | 0.02 |
From Harpaz et al. (1994).
The mean fraction buried in a sample of 61 proteins, from Lesser and Rose (1990).
From Schmid (1997).
From Lakowicz (1999).
Structures of T76W and Y81W
The solvent accessibility of the newly introduced Trp side chains in the variants is similar to the accessibility of the residues in RNase Sa that they replaced and to the accessibility of the residues in the ribonucleases that they were modeled after (Table 2). For example, the Thr76 side chain is 4% buried in wild-type RNase Sa, the Trp76 side chain has two conformations that are 4 and 11% buried in T76W, and the Trp79 side chain is 0% buried in RNase Sa3 (Fig. 2 A). Neither the side chain of Thr76 in wild-type RNase Sa nor the Trp76 side chain in T76W form intramolecular hydrogen bonds. When T76W (1T2H) and RNase Sa (1RGG) are compared, the RMSD of the Cα atoms is 0.56 Å. In contrast, a similar comparison of Y80F (1I8V) and Y86F (1I7O) with RNase Sa (1RGG) gave Cα RMSD values of only 0.062 Å and 0.082 Å, respectively (Pace et al., 2001). Thus, even though the Trp of T76W is largely exposed to solvent, it appears that the conformation of the enzyme has changed slightly. In line with this, the amount of polar and nonpolar surface buried on folding is 5615 Å2 for Y76W and only 5275 Å2 for RNase Sa. In Fig. 2 A, the conformations of RNase Sa, T76W, and RNase Sa3 near the site of the mutation are compared. It is clear that the side chains of Thr76 in RNase Sa, Trp76 in T76W, and Trp79 in RNase Sa3 are quite accessible to solvent, but that the polypeptide chain and side-chain conformations differ slightly. There is also a small change in the conformation of the chains near the disulfide bond between residues 7 and 96.
In Fig. 2 B, the conformations of Tyr81 in RNase Sa, Trp81 in Y81W, and Trp82 in RNase Sa2 are compared near the site of the mutation. Despite the fact that the three residues are largely buried, they all form intermolecular hydrogen bonds with water molecules. The amount of polar and nonpolar surface buried is identical for Y81W and wild-type RNase Sa within experimental error. The B-factors for the Trp side chain in the Y81W variant are 10.5 and 7.0 Å2 for the two molecules in the unit cell, as compared to 9.0 and 8.6 for Tyr81 in wild-type RNase Sa. Neither Tyr81 nor Trp81 appears to form a hydrogen bond based on the crystal structures, but Tyr81 forms a hydrogen bond in 34 of the 36 NMR solution structures (Laurents et al., 2001).
Stability of the tryptophan variants
As shown in Table 6, three of the Trp variants are less stable than wild-type RNase Sa. In these cases, Trp was substituted for a Tyr at largely buried sites in RNase Sa (Table 2). In a related study, Tyr and Phe residues were replaced with Trp at five sites in adrenotoxin and in every case the variant containing Trp was less stable than the wild-type protein (Hannemann et al., 2002). We previously measured the changes in stability when the eight Tyr residues in RNase Sa were replaced by Phe (Pace et al., 2001). The decreases in stability were: −3.6 kcal/mol for Y52F, −0.6 kcal/mol for Y55F, and −1.2 kcal/mol for Y81F. Tyr52 in RNase Sa forms an excellent hydrogen bond to the carbonyl O of Pro45. The loss of this hydrogen bond probably makes a large contribution to the decrease in stability observed for the Y52W variant. Both Tyr55 and Tyr81 form hydrogen bonds to water molecules, but no intramolecular hydrogen bonds. It is clear that the gain in hydrophobicity from the newly introduced Trp residues is not enough to compensate for the possible steric effects and the loss of hydrogen bonds and favorable van der Waals interactions of the Tyr residues that they replace.
In contrast, the side chain of Thr76 is largely exposed to solvent and not hydrogen-bonded and the T76W variant is 0.7 kcal/mol more stable than wild-type RNase Sa. The small extent of burial of the Trp76 side chain and the change in conformation for T76W discussed above appears to lead to the burial of some additional surface so that T76W is more stable than wild-type RNase Sa.
Fluorescence properties of the tryptophan variants
In a previous study, we examined the absorption spectra of Trp models in various solvents and compared them with the average spectra observed for Trp residues in a sample of 18 proteins (Pace et al., 1995). One surprising finding was that n-propanol is a poor model for the interior of a protein: the absorption maxima for Trp occurred at 282 nm in both n-propanol and the average protein, but the average molar absorption coefficient was >8% lower in the protein. We showed that the molar absorption coefficients of proteins could be predicted considerably better using model compound data obtained in 6 M GdnHCl or 8 M urea than in propanol. Since the aromatic side chains in folded proteins are ∼85% buried on average (Table 7), we suggested that the tight packing of the Trp side chains in the interior of the protein might explain these unusual absorption properties. Since the absorption λmax is not shifted, the difference in energy between the ground and excited states of the Trp must be about the same in the protein and in propanol, but the lower molar absorption coefficient suggests that the transition dipole moment must be smaller in the protein than in propanol. One goal of the present study was to see if the fluorescence properties of Trp residues in folded proteins could give us further insight into these observations.
Tryptophan is the most important of the intrinsic fluorescence probes: it has a larger molar absorption coefficient (Table 7), it serves as an energy transfer acceptor for the other aromatic amino acids, it can be selectively excited at long wavelengths (e.g., >295 nm), and its fluorescence intensity (IF) and the intensity wavelength maximum (λmax) are sensitive to the microenvironment of the indole group (Beechem and Brand, 1985; Chen and Barkley, 1998; Eftink, 1991; Lakowicz, 1999;Weinryb and Steiner, 1971). We will next discuss the λmax and IF values summarized in Table 5 for the single Trp-containing proteins studied here.
λmax
The fluorescence intensity wavelength maxima, λmax, for tryptophans in proteins range from 308 to 355 nm (Eftink, 1991; Vivian and Callis, 2001). It is generally thought that there is a relationship between λmax and the solvent exposure of tryptophans in proteins (Burstein et al., 1973). For example, Callis wrote: “The wavelength of maximum fluorescence intensity (λmax) is universally and unquestioningly used as an indicator of exposure to water, i.e., as an indicator of how deeply the tryptophan is buried in the protein (Callis, 1997).” More recently, Vivian and Callis have reported calculations that suggest that the observed shifts in λmax can be largely accounted for by differences in the electrostatic interactions of the ground state and the 1La excited state of the tryptophan and the surrounding protein/solvent environment (Vivian and Callis, 2001).
The fluorescence emission spectra of the native states of wild-type RNase Sa and the four single Trp-containing variants are compared in Fig. 6 A. The λmax values range from 309 for Y52W to 335 nm for T76W. In a vacuum, λmax for a Trp will be ∼300 nm; in a nonpolar solvent like cyclohexane, λmax will be ∼320 nm; and in water, λmax will be ∼350 nm (Table 8). It is very surprising that the Trp of Y52W is red-shifted to such a small extent. The smallest red shift observed to date is to 308 nm for Trp48 in azurin. Note that the Tyr replaced by Trp in RNase Sa is 98% buried and the corresponding Trp in barnase is also 98% buried but has a λmax of 332 nm. Vivian and Callis (2001) consider the question “Why so few blue shifts from protein?” One possibility they suggest is that the ground state dipole of tryptophan is oriented to give a favorable electrostatic interaction with the protein and since the 1La excited state has a larger dipole and is nearly parallel to that of the ground state (Pierce and Boxer, 1995), we expect an even more favorable electrostatic interaction with the excited state and hence a red shift in most proteins. Our data support this idea. We have substituted tryptophans at sites selected for other kinds of residues so it is unlikely that the Trp side chain would have favorable electrostatic interactions with the protein and this might explain why the newly-introduced Trp residues are all blue-shifted with respect to the Trp residues in the corresponding proteins.
FIGURE 6.

Native (A) and denatured (B) fluorescence emission spectra (280 nm excitation) of RNase Sa and the four tryptophan variants. The conditions are the same as described in Fig. 3. The scans show wild-type (dashed line), Y52W (solid circles), Y55W (open circles), T76W (plus symbols), and Y81W (solid line).
TABLE 8.
λmax values for tryptophan and three tryptophan models in various solvents
|
λmax (nm) in various solvents*
|
||||||
|---|---|---|---|---|---|---|
| Compound | Hexane | Dioxane | Ethanol | Acetonitrile | Water | 9 M Urea |
| NATA† | 320 | 328 | 337 | 335 | 351 | 348 |
| AWA† | 322 | 327 | 337 | 335 | 351 | 349 |
| NATA‡ | 329 | 340 | 334 | 352 | ||
| Trp§ | 329 | 338 | 350 | |||
The dielectric constants for the solvents are: hexane, 1.9; dioxane, 2.2; ethanol, 24; acetonitrile, 38; water, 78; and 9 M urea, 99.
This article; NATA is N-acetyl-Trp-amide; AWA is N-acetyl-Ala-Trp-Ala-amide.
From Ross et al. (1997).
Trp59 in RNase T1 is one of the most studied tryptophan residues in proteins (Axelsen and Prendergast, 1989; Eftink, 1991; Longworth, 1971; Vivian and Callis, 2001). It is 100% buried, but the N in the indole ring is hydrogen-bonded to a water molecule (Martinez-Oyanedel et al., 1991). The RNase T1 native emission λmax is 318 nm (Table 5), but when we place a Trp at the equivalent position in RNase Sa (Y55W), the fluorescence intensity is markedly reduced and λmax appears to be lowered to near 310 nm. However, it appears that the Trp fluorescence is quenched to such an extent that we are mainly observing a weak Trp fluorescence superimposed on the stronger fluorescence of the Tyr residues. This is supported by the observation that λmax shifts from 310 nm to 322 nm when the exciting wavelength is increased from 280 nm to 296 nm. Similar results were observed when Tyr92 in RNase A was replaced by a Trp (Sendak et al., 1996).
Table 8 summarizes our data for the fluorescence emission λmax for N-acetyltryptophanamide (NATA) and N-acetyl-Ala-Trp-Ala-amide (AWA) in various solvents. Our λmax values are in good agreement with previous data for both NATA and Trp in the same solvents. These data clearly show that more polar solvents have favorable interactions with the large dipole of the 1La excited state of the indole ring to give large red shifts in λmax, and that in solvents such as hexane where only dipole-induced dipole interactions are possible, the red shifts are smaller. The smaller red shifts observed in the corresponding RNases in their native states suggests that the environment of most Trp side chains is designed to favor interactions with the smaller ground state dipole and the interactions with the excited state—although favorable—are not as favorable as can be achieved in a polar solvent. The red shifts are even smaller for the RNase Sa variants because the Trp side chains are now in environments selected for other side chains.
The λmax values for the unfolded states in 9 M urea range from 343 to 345 nm and these differences are not significant (Table 5 and Fig. 6 B). However, the λmax values for our Trp models are somewhat higher ≈348 nm (Table 8), and we think this indicates that the Trp residues in the RNases are in a less polar environment than in the model compounds. Both experimental (Pace et al., 1992) and theoretical studies (Wong et al., 2000) suggest that barnase has a compact denatured state and this would be expected to lead to a lower value of λmax than observed in the model compounds. The denatured states in the other microbial ribonucleases would be even more compact because they are restrained by disulfide bonds and barnase is not. In a similar study, Tew and Bottomley (2001) suggested that the fluorescent properties of a Trp residue in α1-antitrypsin resulted from the presence of persistent residual structure in 8 M urea. Thus, these results are consistent with the idea that the unfolded states of proteins are quite compact and may contain elements of the native structure (Creamer et al., 1995, 1997; Elcock, 1999; Shortle, 2002).
IF
It can be seen in Fig. 6 A and Table 5 that adding a Trp to RNase Sa markedly increases the fluorescence of Y52W, T76W, and Y81W, but not Y55W. At identical concentrations, the fluorescence intensities of the folded proteins vary more than 10-fold from 8150 (Y55W) to 82,800 (RNase T1). In contrast, the fluorescence intensities of the unfolded proteins vary over a more limited range (1.5-fold) from 19,500 (RNase Sa2) to 29,200 (RNase T1) (Fig. 6 B and Table 5). The Trp in folded RNase Sa3 is completely exposed to solvent so, as expected, the fluorescence intensity is almost the same in the folded and unfolded state. However, when a Trp is added to the equivalent position in RNase Sa, the fluorescence intensity is substantially higher in the folded protein and somewhat higher in the unfolded protein. The newly introduced Trp (T76W) is only 7% buried in RNase Sa, but must have more favorable interactions with the protein than the Thr side chain that it replaces. Based on these results, it appears that fluorescence intensity with a 1.5-fold range of values is more sensitive to structure in the unfolded state than λmax where the range is only from 343 to 345 nm (Table 5).
Of the seven single Trp proteins in Table 5, the Trp of RNase T1 has the greatest fluorescence intensity, but when a Trp is added to the equivalent position in RNase Sa (Y55W), the Trp has the lowest intensity of any of the proteins. The Trp in Y55W appears to be almost completely quenched. Experimental (Adams et al., 2002; Pan and Barkley, 2004; Sillen et al., 2000) and theoretical (Callis and Vivian, 2003) evidence suggests that electron transfer to the carbonyl C of a neighboring peptide group may be the most important mechanism for intramolecular quenching of Trp fluorescence. We have been unable to get usable crystals of the Y55W variant that would allow us to determine the crystal structure. It will be interesting to see if we can understand the strong quenching of the Trp in Y55W once we know the structure.
Circular dichroism of the tryptophan variants
Some proteins, including most of the microbial RNases, have positive CD bands in the far UV spectra between 220 and 235 nm, and Woody has proposed that tryptophans can make a significant contribution to this band (Woody, 1994). RNase Sa has a positive CD band at 234 nm that is lost when the protein unfolds and the CD change is so large that this is the wavelength we use to follow unfolding. Most of the proteins with these positive CD bands contain Trp, but RNase Sa does not. We previously showed that when tyrosine 52 is replaced with phenylalanine the positive CD band was shifted slightly to longer wavelengths and the magnitude was substantially reduced (Hebert, 1997). In this study, without exception, the presence of tryptophan in the variants increased the mean residue ellipticity at 234 nm.. The largest change is for Y81W where the mean residue ellipticity is more than double the value for wild-type RNase Sa. Our results show that both tyrosine and tryptophan residues contribute to the positive CD band at 234 nm observed in the microbial ribonuclease family. The high content of aromatic amino acids in the microbial ribonucleases is probably the reason that analyses of the far UV CD spectra do not give accurate predictions of the amount of secondary structure (Woody, 1994).
In summary, we used the location of Trp residues in related microbial ribonucleases to guide us in adding Trp residues to RNase Sa. We found that replacing other aromatic amino acids with Trp always resulted in a decrease in protein stability. However, the Trp added in place of an exposed Thr residue resulted in an increase in stability. The λmax values for newly introduced Trp residues differed substantially and were always blue-shifted relative to the λmax values for the Trp residues in the related ribonuclease. The IF values differed significantly for the Trp variants, and in one case the Trp was almost completely quenched, even though the Trp in the related ribonuclease has a very high quantum yield. For the denatured states, the λmax values for the proteins were almost identical, but interesting differences were observed in the IF values. We have studied these differences in the fluorescence properties of the denatured states in detail and they will be described in a forthcoming publication.
Acknowledgments
We thank the European Molecular Biology Laboratory Hamburg team for providing us with synchrotron facilities and for help in data collection.
J.S. and L.U. thank the European Community for support through the Access to Research Infrastructure Action of the Improving Human Potential Program to the EMBL Hamburg Outstation (Contract HPRI-CT-1999-00017). This work was supported by the Slovak Academy of Sciences, grant No. 2/1018/21 (J.S. and L.U.); by grants GM-37039, GM-52483, and GM-33216 from the National Institutes of Health; by grants BE-1060, BE-1281, and A1543 from the Robert A. Welch Foundation; and by the Tom and Jean McMullin Professorship.
References
- Adams, P. D., Y. Chen, K. Ma, M. G. Zagorski, F. D. Sonnichsen, M. L. McLaughlin, and M. D. Barkley. 2002. Intramolecular quenching of tryptophan fluorescence by the peptide bond in cyclic hexapeptides. J. Am. Chem. Soc. 124:9278–9286. [DOI] [PubMed] [Google Scholar]
- Axe, D. D., N. W. Foster, and A. R. Fersht. 1999. An irregular β-bulge common to a group of bacterial RNases is an important determinant of stability and function in barnase. J. Mol. Biol. 286:1471–1485. [DOI] [PubMed] [Google Scholar]
- Axelsen, P. H., and F. G. Prendergast. 1989. Molecular dynamics of tryptophan in ribonuclease-T1. II. Correlations with fluorescence. Biophys. J. 56:43–66. [DOI] [PMC free article] [PubMed] [Google Scholar]
- Beechem, J. M., and L. Brand. 1985. Time-resolved fluorescence of proteins. Annu. Rev. Biochem. 54:43–71. [DOI] [PubMed] [Google Scholar]
- Bond, C. J., K. B. Wong, J. Clarke, A. R. Fersht, and V. Daggett. 1997. Characterization of residual structure in the thermally denatured state of barnase by simulation and experiment: description of the folding pathway. Proc. Natl. Acad. Sci. USA. 94:13409–13413. [DOI] [PMC free article] [PubMed] [Google Scholar]
- Brunger, A. T., and M. Nilges. 1993. Computational challenges for macromolecular structure determination by x-ray crystallography and solution NMR-spectroscopy. Q. Rev. Biophys. 26:49–125. [DOI] [PubMed] [Google Scholar]
- Burstein, E. A., N. S. Vedenkina, and M. N. Ivkova. 1973. Fluorescence and the location of tryptophan residues in protein molecules. Photochem. Photobiol. 18:263–279. [DOI] [PubMed] [Google Scholar]
- Callis, P. R. 1997. 1La and 1Lb transitions of tryptophan: applications of theory and experimental observations to fluorescence of proteins. Methods Enzymol. 278:113–150. [DOI] [PubMed] [Google Scholar]
- Callis, P. R., and J. T. Vivian. 2003. Understanding the variable fluorescence quantum yield of tryptophan in proteins using QM-MM simulations. Quenching by charge transfer to the peptide backbone. Chem. Phys. Lett. 369:409–414. [Google Scholar]
- Chen, Y., and M. D. Barkley. 1998. Toward understanding tryptophan fluorescence in proteins. Biochemistry. 37:9976–9982. [DOI] [PubMed] [Google Scholar]
- Creamer, T. P., R. Srinivasan, and G. D. Rose. 1995. Modeling unfolded state of peptides and proteins. Biochemistry. 34:16245–16250. [DOI] [PubMed] [Google Scholar]
- Creamer, T. P., R. Srinivasan, and G. D. Rose. 1997. Modeling unfolded states of proteins and peptides. II. Backbone solvent accessibility. Biochemistry. 36:2832–2835. [DOI] [PubMed] [Google Scholar]
- Eftink, M. R. 1991. Fluorescence techniques for studying protein structure. Methods Biochem. Anal. 35:127–205. [DOI] [PubMed] [Google Scholar]
- Elcock, A. H. 1999. Realistic modeling of the denatured states of proteins allows accurate calculations of the pH dependence of protein stability. J. Mol. Biol. 294:1051–1062. [DOI] [PubMed] [Google Scholar]
- Engelborghs, Y. 2003. Correlating protein structure and protein fluorescence. J. Fluor. 13:9–16. [Google Scholar]
- Fauchere, J. L., and V. E. Pliska. 1983. Hydrophobic parameters of amino-acid side chains from the partitioning of N-acetyl-amino-acid amides. Eur. J. Med. Chem. 18:369–375. [Google Scholar]
- Giletto, A., and C. N. Pace. 1999. Buried, charged, non-ion-paired aspartic acid 76 contributes favorably to the conformational stability of ribonuclease T1. Biochemistry. 38:13379–13384. [DOI] [PubMed] [Google Scholar]
- Grimsley, G. R., K. L. Shaw, L. R. Fee, R. W. Alston, B. M. Huyghues-Despointes, R. L. Thurlkill, J. M. Scholtz, and C. N. Pace. 1999. Increasing protein stability by altering long-range Coulombic interactions. Protein Sci. 8:1843–1849. [DOI] [PMC free article] [PubMed] [Google Scholar]
- Hannemann, F., A. K. Bera, B. Fischer, M. Lisurek, K. Teuchner, and R. Bernhardt. 2002. Unfolding and conformational studies on bovine adrenodoxin probed by engineered intrinsic tryptophan fluorescence. Biochemistry. 41:11008–11016. [DOI] [PubMed] [Google Scholar]
- Harpaz, Y., M. Gerstein, and C. Chothia. 1994. Volume changes in protein folding. Structure. 2:641–649. [DOI] [PubMed] [Google Scholar]
- Hebert, E. J. 1997. Conformational stability of ribonuclease Sa from Streptomyces aureofaciens. Ph.D. dissertation. Texas A&M University, College Station, TX.
- Hebert, E. J., G. R. Grimsley, R. W. Hartley, G. Horn, D. Schell, S. Garcia, V. Both, J. Sevcik, and C. N. Pace. 1997. Purification of ribonucleases Sa, Sa2, and Sa3 after expression in Escherichia coli. Protein Expr. Purif. 11:162–168. [DOI] [PubMed] [Google Scholar]
- Huyghues-Despointes, B. M., R. L. Thurlkill, M. D. Daily, D. Schell, J. M. Briggs, J. M. Antosiewicz, C. N. Pace, and J. M. Scholtz. 2003. pK values of histidine residues in ribonuclease Sa: effect of salt and net charge. J. Mol. Biol. 325:1093–1105. [DOI] [PubMed] [Google Scholar]
- Kabsch, W. 1976. Solution for best rotation to relate two sets of vectors. Acta Crystallogr. A. 32:922–923. [Google Scholar]
- Killick, T. R., S. M. Freund, and A. R. Fersht. 1998. Real-time NMR studies on folding of mutants of barnase and chymotrypsin inhibitor 2. FEBS Lett. 423:110–112. [DOI] [PubMed] [Google Scholar]
- Kraulis, P. J. 1991. MOLSCRIPT: a program to produce both detailed and schematic plots of protein structures. J. Appl. Crystallogr. 24:946–950. [Google Scholar]
- Lakowicz, J. R. 1999. Principles of Fluorescence Spectroscopy. Kluwer Academic/Plenum Publishers, New York.
- Laurents, D., J. M. Perez-Canadillas, J. Santoro, M. Rico, D. Schell, C. N. Pace, and M. Bruix. 2001. Solution structure and dynamics of ribonuclease Sa. Proteins. 44:200–211. [DOI] [PubMed] [Google Scholar]
- Laurents, D. V., B. M. Huyghues-Despointes, M. Bruix, R. L. Thurlkill, D. Schell, S. Newsom, G. R. Grimsley, K. L. Shaw, S. Trevino, M. Rico, J. M. Briggs, J. M. Antosiewicz, J. M. Scholtz, and C. N. Pace. 2003. Charge-charge interactions are key determinants of the pK values of ionizable groups in ribonuclease Sa (pI = 3.5) and a basic variant (pI = 10.2). J. Mol. Biol. 325:1077–1092. [DOI] [PubMed] [Google Scholar]
- Lee, B., and F. M. Richards. 1971. The interpretation of protein structures: estimation of static accessibility. J. Mol. Biol. 55:379–400. [DOI] [PubMed] [Google Scholar]
- Lesser, G. J., and G. D. Rose. 1990. Hydrophobicity of amino acid subgroups in proteins. Proteins. 8:6–13. [DOI] [PubMed] [Google Scholar]
- Loewenthal, R., J. Sancho, and A. R. Fersht. 1991. Fluorescence spectrum of barnase: contributions of three tryptophan residues and a histidine-related pH dependence. Biochemistry. 30:6775–6779. [DOI] [PubMed] [Google Scholar]
- Longworth, J. W. 1971. The luminescence of the aromatic amino acids. In Excited States of Proteins and Nucleic Acids. R.F. Steiner and I. Weinryb, editors. Plenum Press, New York. 319–484.
- Loris, R., U. Langhorst, S. De Vos, K. Decanniere, J. Bouckaert, D. Maes, T. R. Transue, and J. Steyaert. 1999. Conserved water molecules in a large family of microbial ribonucleases. Proteins. 36:117–134. [DOI] [PubMed] [Google Scholar]
- Martinez-Oyanedel, J., H.-W. Choe, U. Heinemann, and W. Saenger. 1991. Ribonuclease T1 with free recognition and catalytic site: crystal structure analysis at 1.5 Å resolution. J. Mol. Biol. 222:335–352. [DOI] [PubMed] [Google Scholar]
- Mascotti, D. P., and T. M. Lohman. 1997. Thermodynamics of oligoarginines binding to RNA and DNA. Biochemistry. 36:7272–7279. [DOI] [PubMed] [Google Scholar]
- Matthews, B. W. 1968. Solvent content of protein crystals. J. Mol. Biol. 33:491–497. [DOI] [PubMed] [Google Scholar]
- McRee, B. 1993. 1993 Founders Award. Presented to Elizabeth Katsikas. Health Phys. 65:465–466. [PubMed] [Google Scholar]
- Murshudov, G. N., A. A. Vagin, and E. J. Dodson. 1997. Refinement of macromolecular structures by the maximum-likelihood method. Acta Crystallogr. D Biol. Crystallogr. 53:240–255. [DOI] [PubMed] [Google Scholar]
- Pace, C. N., E. J. Hebert, K. L. Shaw, D. Schell, V. Both, D. Krajcikova, J. Sevcik, K. S. Wilson, Z. Dauter, R. W. Hartley, and G. R. Grimsley. 1998. Conformational stability and thermodynamics of folding of ribonucleases Sa, Sa2 and Sa3. J. Mol. Biol. 279:271–286. [DOI] [PubMed] [Google Scholar]
- Pace, C. N., G. Horn, E. J. Hebert, J. Bechert, K. Shaw, L. Urbanikova, J. M. Scholtz, and J. Sevcik. 2001. Tyrosine hydrogen bonds make a large contribution to protein stability. J. Mol. Biol. 312:393–404. [DOI] [PubMed] [Google Scholar]
- Pace, C. N., D. V. Laurents, and R. E. Erickson. 1992. Urea denaturation of barnase: pH dependence and characterization of the unfolded state. Biochemistry. 31:2728–2734. [DOI] [PubMed] [Google Scholar]
- Pace, C. N., and J. M. Scholtz. 1997. Measuring the conformational stability of a protein. In Protein Structure: A Practical Approach. T.E. Creighton, editor. Oxford University Press, New York, NY. 299–321.
- Pace, C. N., and K. L. Shaw. 2000. Linear extrapolation method of analyzing solvent denaturation curves. Proteins. Suppl 4:1–7. [DOI] [PubMed] [Google Scholar]
- Pace, C. N., F. Vajdos, L. Fee, G. Grimsley, and T. Gray. 1995. How to measure and predict the molar absorption coefficient of a protein. Protein Sci. 4:2411–2423. [DOI] [PMC free article] [PubMed] [Google Scholar]
- Pan, C. P., and M. D. Barkley. 2004. Conformational effects on tryptophan fluorescence in cyclic hexapeptides. Biophys. J. 86:3828–3835. [DOI] [PMC free article] [PubMed] [Google Scholar]
- Perrakis, A., R. Morris, and V. S. Lamzin. 1999. Automated protein model building combined with iterative structure refinement. Nat. Struct. Biol. 6:458–463. [DOI] [PubMed] [Google Scholar]
- Pierce, D. W., and S. G. Boxer. 1995. Stark-effect spectroscopy of tryptophan. Biophys. J. 68:1583–1591. [DOI] [PMC free article] [PubMed] [Google Scholar]
- Ross, J. B., A. G. Szabo, and C. W. Hogue. 1997. Enhancement of protein spectra with tryptophan analogs: fluorescence spectroscopy of protein-protein and protein-nucleic acid interactions. Methods Enzymol. 278:151–190. [DOI] [PubMed] [Google Scholar]
- Santoro, M. M., and D. W. Bolen. 1988. Unfolding free energy changes determined by the linear extrapolation method. 1. Unfolding of phenylmethanesulfonyl α-chymotrypsin using different denaturants. Biochemistry. 27:8063–8068. [DOI] [PubMed] [Google Scholar]
- Schmid, F. X. 1997. Optical spectroscopy to characterize protein conformation and conformational changes. In Protein Structure: A Practical Approach. T.E. Creighton, editor. Oxford University Press, New York. 261–297.
- Sendak, R. A., D. M. Rothwarf, W. J. Wedemeyer, W. A. Houry, and H. A. Scheraga. 1996. Kinetic and thermodynamic studies of the folding/unfolding of a tryptophan-containing mutant of ribonuclease A. Biochemistry. 35:12978–12992. [DOI] [PubMed] [Google Scholar]
- Sevcik, J., Z. Dauter, V. S. Lamzin, and K. S. Wilson. 1996. Ribonuclease from Streptomyces aureofaciens at atomic resolution. Acta Crystallogr. D Crys. Struct. Comm. 52:327–344. [DOI] [PubMed] [Google Scholar]
- Sevcik, J., V. S. Lamzin, Z. Dauter, and K. S. Wilson. 2002a. Atomic resolution data reveal flexibility in the structure of RNase Sa. Acta Crystallogr. D Biol. Crystallogr. 58:1307–1313. [DOI] [PubMed] [Google Scholar]
- Sevcik, J., L. Urbanikova, P. A. Leland, and R. T. Raines. 2002b. X-ray structure of two crystalline forms of a streptomycete ribonuclease with cytotoxic activity. J. Biol. Chem. 277:47325–47330. [DOI] [PubMed] [Google Scholar]
- Shortle, D. 2002. The expanded denatured state: an ensemble of conformations trapped in a locally encoded topological space. Adv. Protein Chem. 62:1–23. [DOI] [PubMed] [Google Scholar]
- Sillen, A., J. F. Diaz, and Y. Engelborghs. 2000. A step toward the prediction of the fluorescence lifetimes of tryptophan residues in proteins based on structural and spectral data. Protein Sci. 9:158–169. [DOI] [PMC free article] [PubMed] [Google Scholar]
- Soler-Gonzalez, A. S., and A. R. Fersht. 1997. Helix stability in barstar peptides. Eur. J. Biochem. 249:724–732. [DOI] [PubMed] [Google Scholar]
- Swaminathan, R., G. Krishnamoorthy, and N. Periasamy. 1994. Similarity of fluorescence lifetime distributions for single tryptophan proteins in the random coil state. Biophys. J. 67:2013–2023. [DOI] [PMC free article] [PubMed] [Google Scholar]
- Tew, D. J., and S. P. Bottomley. 2001. Probing the equilibrium denaturation of the serpin α1-antitrypsin with single tryptophan mutants; evidence for structure in the urea unfolded state. J. Mol. Biol. 313:1161–1169. [DOI] [PubMed] [Google Scholar]
- Vivian, J. T., and P. R. Callis. 2001. Mechanisms of tryptophan fluorescence shifts in proteins. Biophys. J. 80:2093–2109. [DOI] [PMC free article] [PubMed] [Google Scholar]
- Volotovskii, I. D., and S. V. Konev. 1967. [Relation between the conformation and UV luminescence of proteins.] Biofizika. 12:200–205. [PubMed] [Google Scholar]
- Weinryb, I., and R. F. Steiner. 1971. The luminescence of the aromatic amino acids. In Excited States of Proteins and Nucleic Acids. Plenum Press, New York. 277–318.
- Willaert, K., R. Loewenthal, J. Sancho, M. Froeyen, A. Fersht, and Y. Engelborghs. 1992. Determination of the excited-state lifetimes of the tryptophan residues in barnase, via multifrequency phase fluorometry of tryptophan mutants. Biochemistry. 31:711–716. [DOI] [PubMed] [Google Scholar]
- Wong, K. B., J. Clarke, C. J. Bond, J. L. Neira, S. M. Freund, A. R. Fersht, and V. Daggett. 2000. Towards a complete description of the structural and dynamic properties of the denatured state of barnase and the role of residual structure in folding. J. Mol. Biol. 296:1257–1282. [DOI] [PubMed] [Google Scholar]
- Woody, R. W. 1994. Contributions of tryptophan side chains to the far-ultraviolet circular dichroism of proteins. Eur. Biophys. J. 23:253–262. [DOI] [PubMed] [Google Scholar]