Abstract
A method is proposed for the measurement of the B22 value of proteins in aqueous solutions in flow-mode that utilizes a novel fabricated dual-detector cell, which simultaneously measures protein concentration and the corresponding scattered light intensity at 90°, after the protein elutes from a size-exclusion column. Each data point on the chromatograms obtained from the light scattering detector and the concentration (ultraviolet) detector is converted to Rayleigh's ratio, Rθ, and concentration, c, respectively. The B22 value is calculated from the slope of the Debye plot (Kc/Rθ versus c) generated from a range of concentrations obtained from these chromatograms for a single protein injection. It is shown that this method provides reliable determination of the B22 values for such proteins as lysozyme, chymotrypsinogen, and chymotrypsin in various solution conditions that agree well with those reported in literature.
INTRODUCTION
Protein-protein interactions play an important role in several phenomena of interest, including protein crystallization (George et al., 1997; George and Wilson, 1994), which relates to protein solubility (Guo et al., 1999; Rosenbaum and Zukoski, 1996), amorphous precipitation (Curtis et al., 2002; Piazza, 1999; Poon, 1997), formation of reversible protein aggregates in supersaturated solutions (Knezic et al., 2004), and irreversible aggregation (Chi et al., 2003a; Ho et al., 2003; Petsev et al., 2000; Zhang and Liu, 2003). These in turn have implications in the pathology of diseases such as Alzheimer's (Fabian et al., 1993) and in the stability of protein pharmaceuticals (Chi et al., 2003b). The second virial coefficient, B22, represents nonideality in dilute protein solutions (Tanford, 1961), and has been widely used as a parameter to study weak protein-protein interactions in aqueous solutions. For example, correlation has been shown among the B22 values, solubility of proteins, and solution conditions under which the protein crystals can be obtained (Guo et al., 1999).
A widespread application of the B22 value for investigating protein-protein interactions is lacking, presumably due to the limitations of the commonly employed techniques of batch-mode static light scattering, membrane osmometry, and sedimentation equilibrium. In addition to the long duration of time necessary to complete these experiments (∼1–2 days), these techniques require large amounts of protein (∼25–100 mg) in order to obtain reliable estimates for B22 values. Furthermore, errors can be introduced from impurities in the sample, such as dust particles or protein aggregates.
Recently, reports have emerged on rapid and improved methods to estimate protein-protein interactions in aqueous solutions—methods based either on self-interaction chromatography (Tessier et al., 2002) or size-exclusion chromatography (Bloustine et al., 2003). Although promising, these techniques require additional steps for determination of the B22 values. The technique of self-interaction chromatography, for example, requires prior immobilization (Tessier et al., 2002) of the same protein; and immobilization itself can affect protein structure and, hence, protein-protein interactions. Attempts have been made to utilize size-exclusion chromatography (SEC) (Bloustine et al., 2003), which is routinely used in protein molecular weight characterization, for the measurement of protein-protein interactions. Bloustine et al. (2003) utilized the solute distribution coefficient as determined from the retention times in SEC to obtain the B22 values of proteins in aqueous solutions, and Wyatt (2002) recently disclosed the use of SEC utilizing a light scattering detector and a concentration detector connected in series to obtain the B22 values of proteins. Although this technique minimizes contributions from dust and aggregate impurities, it is still prone to errors arising from interdetector delay volume (IDV) and interdetector band broadening (Netopilik, 1997, 2003; Shortt, 1994; Wyatt, 1993b; Wyatt and Papazian, 1993; Zammit et al., 1998) within the two detectors, and hence requires mathematical correction factors to obtain the B22 values.
It is necessary to emphasize the issues of IDV and band broadening in SEC utilizing two detectors (i.e., a light scattering detector and a concentration detector such as an ultraviolet detector) connected in series, especially when data points on the chromatogram, rather than the whole chromatogram, are used for analysis. When the protein sample, after separation in the SEC column, passes through the two detectors in series, a lag time occurs in the chromatogram due to physical separation of the detectors that relates to IDV. For proper analysis, the chromatograms from the two detectors must be overlaid precisely after correcting for this IDV. This is commonly done by measuring the peak-to-peak time difference between the two chromatograms, using a known standard and converting this time difference to the IDV from the information on the flow rate. Once known, this IDV is then used for all samples. The phenomenon of IDV is schematically represented in Fig. 1.
FIGURE 1.
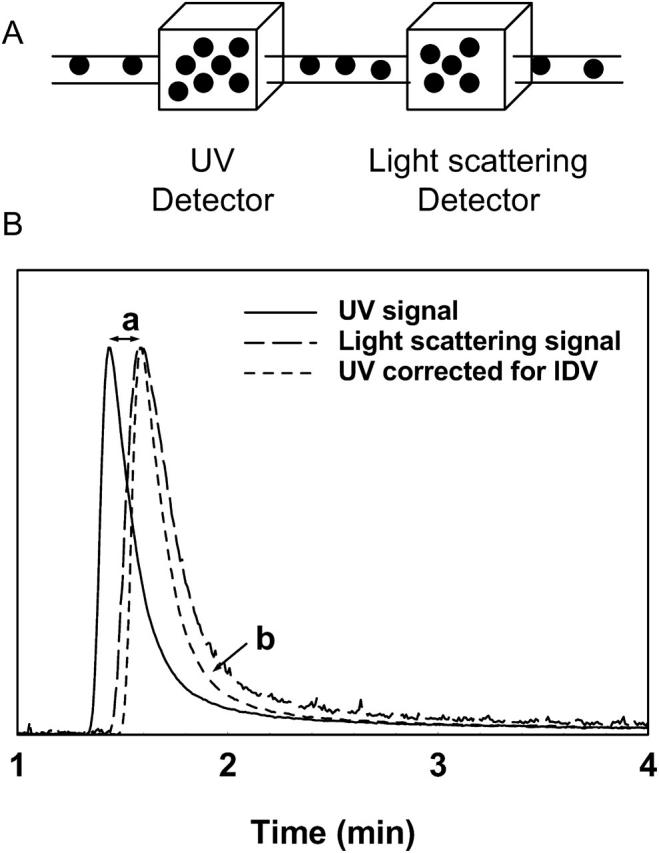
(A) A schematic showing the two detectors (UV detector and light scattering detector) connected in series in a typical SEC-HPLC setting for molecular weight determination of proteins using laser light scattering. (B) Interdetector volume (a) and interdetector band broadening (b) appear as the sample passes from one detector to the next connected in series demonstrated using a sample of γ-immunoglobulin injected through an SEC guard column. The band broadening effect is seen even after correction for the interdetector volume.
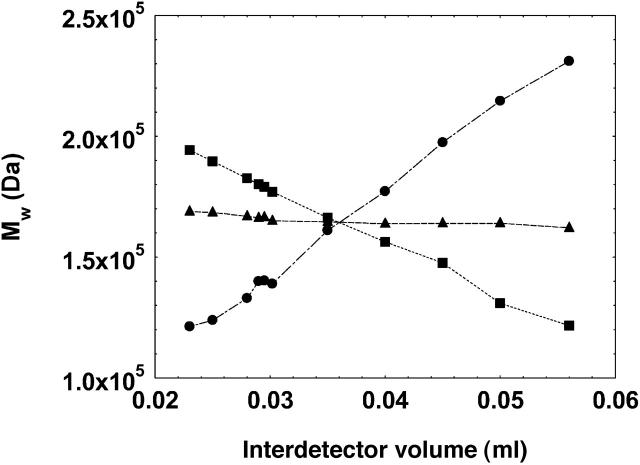
The present work was initiated to extract the values of B22 from the light scattering and ultraviolet (concentration) chromatograms as generated by the two detectors in a typical SEC setting. Toward this end, in our preliminary studies, we observed that the interdetector value, calculated from the peak-to-peak time difference between the two detectors, varied for protein solutions as a function of solution pH; concentration of protein injected; and volume of protein injected. This meant that the IDV calculated under a given solution condition was not valid for another solution condition. Other authors have also made similar observations (Netopilik, 2003; Zammit et al., 1998). It should be noted that this variation in interdetector volume did not affect the calculation of the average molecular weight of the whole peak; however, it did affect the molecular weight calculation when a specific part of the chromatogram was used for the analysis (see Fig. 2 and its legend for details).
FIGURE 2.
The effect of varying interdetector volumes (IDV) on the calculation of weight-average molecular weight of a monomeric peak of the antibody, γ-immunoglobulin (pH 7.4, 150 mM solution ionic strength) using the whole chromatogram (▴), initial half of the chromatogram (•), and latter half of the chromatogram (▪). The lines are used as guide to the eyes. The chromatograms were generated in an SEC-HPLC setting using an LDC/Milton Roy UV detector (Ivyland, PA) and a PD 2000 system (Precision Detectors) hosting the 90° light scattering detector. The data were analyzed using the Precision/Analyze software (Precision Detectors) for the calculation of the molecular weight. The software allows calculation of the molecular weight of the whole peak as well as for any specific part of the chromatogram. The IDV was first estimated from the peak/peak difference in the chromatograms from the two detectors (0.035 ml) and then varied manually in the software parameters at this approximate IDV value to study the effect of change in IDV on the calculation of molecular weight.
For analysis of the B22 values we intended to use specific data points on the chromatogram representing different concentrations and scattering intensities instead of the whole chromatogram. Since the molecular weight calculations for a specific part of the chromatogram are affected by variation in IDV value, it was expected that the B22 values would also be affected. In fact, due to this variation in IDV under different solution conditions, our initial attempts to determine the B22 values from the SEC utilizing the scattering and the concentration detector were not successful and erroneous values were obtained. The error in IDV resulted in an error in measuring the light scattering intensity for a corresponding concentration for a single data point on the chromatogram. The attempt to determine the B22 values of proteins using two detectors connected in series was further hampered by the issue of interdetector band broadening, which occurs from dilution of the protein sample as it passes from one detector cell to the next detector connected in series (Fig. 1). It should be noted that although the IDV can still be determined for a specific solution condition, the issue of band broadening is difficult to correct, since the dilution effect within the detectors is not evenly spread throughout the chromatogram.
In this report, we present a method that measures the static light scattering intensity and protein concentration simultaneously in flow-mode using SEC, which therefore allows for the determination of B22 values of proteins in aqueous solutions. The simultaneous measurement of scattered light intensity and protein concentration is achieved by employing a specially designed dual-detector cell equipped with a 90° light scattering detector and an ultraviolet (UV) detector, which is used online in a size-exclusion chromatography/high-performance chromatography (SEC-HPLC) setting. The dual-detector cell has been fabricated primarily to eliminate the issues of interdetector band broadening and delay volume between the two detectors (See Methods, below, for details). Thus, a range of protein concentrations and their corresponding scattering intensities can be obtained from the eluting protein peak, after a single protein injection using this dual-detector cell to determine the B22 values from the resulting Debye plot. We show that this method can provide reliable estimates of the B22 values of such proteins as lysozyme, chymotrypsinogen, and chymotrypsin—values similar to those obtained by using other techniques reported in the literature.
EXPERIMENTAL
Materials
All buffer components and chemical reagents used in the present studies were of highest-purity grade, obtained from commercial sources, and used without further purification. Chicken egg-white lysozyme (3× crystallized and lyophilized), bovine pancreatic α-chymotrypsinogen A (6× crystallized), α-chymotrypsin from bovine pancreas (3× crystallized from 4× crystallized chymotrypsinogen A), and bovine serum albumin (BSA) were obtained from Sigma (St. Louis, MO) and stored at −20°C. Double-distilled water filtered through a 0.1-μm polycarbonate membrane filter was used for preparation of the mobile phase and protein solutions. For studies with BSA, a 25-mM phosphate buffer (buffer ionic strength = 40 mM) was used at pH 7.4. For studies with lysozyme, a 25-mM acetate buffer (buffer ionic strength = 16 mM) at pH 4.6 was used. For studies with α-chymotrypsinogen A and chymotrypsin A, a 10-mM citrate buffer was used at pH values 3.0, 5.0, and 6.8. The ionic strength of all solutions was adjusted with NaCl. The final pH of all solutions was measured using a Piccoloplus Hi-1295 digital pH meter (Fisher Scientific, Pittsburgh, PA) and adjusted to the desired pH using either 1.0 N NaOH or 1.0 N HCl. All experiments were performed at 25°C.
Methods
Size-exclusion chromatography
The chromatograms for the determination of B22 were obtained using SEC in an HPLC setting using a Precision Detectors' PD 2000 (Northampton, MA) detection system that hosts a 90° light scattering detector followed by a Waters 410 differential refractometer (Waters Corporation, Milford, MA). This type of system is routinely used for molecular weight characterization of macromolecules in an SEC setting (Jackson et al., 1989) and has the advantage that it does not require calibration of the column (Wyatt, 1993a) using various molecular weight markers. In fact, after a single calibration (as described below) using a protein of a well-defined molecular weight, for example BSA, the determination of the molecular weight of any given protein can be determined independent of the type of column used and the amount of protein injected as long as the refractive index increment (dn/dc) of the protein is known (Wyatt, 1993a). The details of this method, used for measurement of protein molecular weight, are discussed elsewhere (Wen et al., 1996).
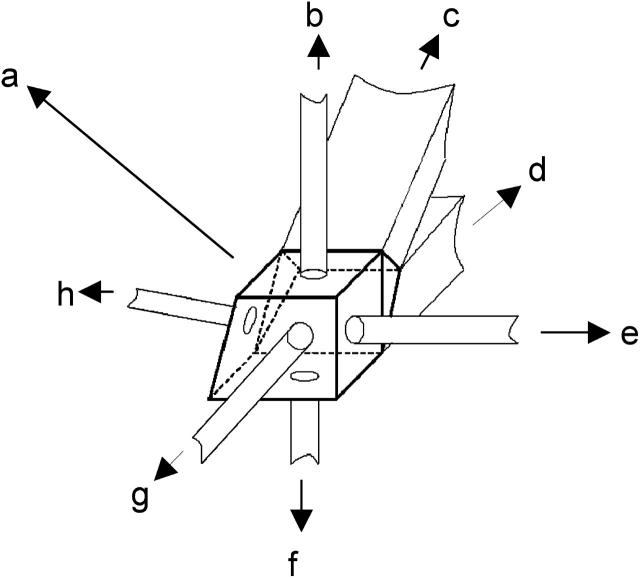
In the present studies, a PD 2000 system was employed for determination of the B22 values, since it has the ability to monitor intensity of the scattered light using a 90° light scattering detector as the sample elutes from an SEC column. A significant modification was made to the cell that hosts the 90° light scattering detector in the PD 2000 system—namely, to incorporate a UV source and a detector at 180° into the UV source, to monitor intensity of the transmitted UV light and hence the concentration of the eluting sample. A bandpass filter of 280 nm was used at the detector port to allow measurement of protein absorbance. Thus, a total of seven ports were present in the cell: a sample inlet port, a sample outlet port, a laser source for light scattering (685 nm), a 90° light scattering detector, a 15° light scattering detector, a fiber optic cable that served as the UV source from a MiniDATA UV (Analytical Instrument Systems, Flemington, NJ) hosting a deuterium lamp, and a detector for detection of transmitted UV light at 280 nm. The cell volume was 10 μl and the scattering volume was 0.01 μl. The path length for UV measurements was 3 mm. A schematic of this cell is shown in Fig. 3.
FIGURE 3.
A schematic of the multiport cell that allows for simultaneous measurement of scattered light intensity at 90° and protein concentration through UV detection. Various ports linked to the cell are as follows: (a), main cell encasing; (b), UV source; (c), sample inlet; (d), sample outlet; (e), laser source for light scattering; (f), UV detector; (g), 90° light scattering detector; and (h), 15° light scattering detector.
It should be noted that fabrication of this cell forms a significant basis of the present work, since it allows for the simultaneous measurement of the scattered light intensity and the protein concentration as the sample elutes. This enabled the system to behave similarly to the conventional light scattering technique for measurement of the B22 values, the only difference being that the sample is in flow-mode in the present system rather than batch-mode (as used in conventional light scattering measurements).
For SEC, a Spectra Physics P4000 pump (Spectra Physics, Mountain View, CA) in conjunction with a Rheodyne 7725 manual injector (Rheodyne, Rohnert Park, CA) with a 200-μl injection loop was used. A flow rate of 1.0 ml/min and an injection volume of 150 μl of the protein sample, with a concentration of 15 mg/ml, were used for all studies, unless otherwise specified. For each protein-buffer system, the samples were injected in triplicate. A schematic of the chromatographic system along with the detectors is shown in Fig. 1. For studies with BSA, a TSK-G3000SWXL column (250 Å pore size, 5-μm bead size, and 30 cm × 0.8 cm column dimensions) from Tosoh Bioscience (Montgomeryville, PA) was used. For studies with lysozyme, a YMC-pack Diol-60, DL06S05-3008WT column (60 Å pore size, 5-μm bead size, and 30 cm × 0.8 cm column dimensions) from YMC (Kyoto, Japan) was used. For studies with α-chymotrypsinogen A and α-chymotrypsin A, a TSK-G2000SWXL (125 Å pore size, 5-μm bead size, and 30 cm × 0.8 cm column dimensions) from Tosoh Bioscience was used. Appropriate guard columns were employed before the main columns.
Data analysis
In the common approach, the virial coefficient of proteins in aqueous solutions using the technique of static light scattering is obtained by construction of the Debye plot (Tanford, 1961). The Debye equation is written as
 |
(1) |
where Rθ is the excess Rayleigh's ratio of the protein in solution of concentration c, and M is the weight average molecular weight of the protein. K is the optical constant and is defined as
 |
(2) |
where n is the solvent refractive index, dn/dc is the refractive index increment, λ is the wavelength of the incident light, and NA is the Avogadro's number. Experimentally, a Debye plot is constructed by preparing several solutions of varying protein concentrations and measuring the respective Rayleigh's ratios. The virial coefficient is then determined from the slope of the plot of Kc/Rθ versus c.
In the present studies, the Debye plot is generated from a single injection of the protein solution. The chromatograms obtained from the UV detector and the light scattering detector are analyzed to generate the Debye plot to obtain the B22 value of the given protein under a given solution condition. The range of protein concentrations and the corresponding scattered light intensities are obtained from various points that constitute the chromatogram. Since the chromatogram appears as a band, a range of protein concentrations can be obtained, with the highest at the peak and lowest near the baseline of the chromatogram. Each point on the chromatogram represents a collection interval, the upper limit of which is decided by the duration of the collection of the chromatogram. In the present studies, the collection time was varied from 0.5 s to 1.5 s. The duration of sample collection did not affect our results. Each data point on the chromatogram represented an average of the scattered light intensity (and the transmitted UV intensity) from the sample volume that passed through the cell in this data collection time. The scattered light intensity at 90° and the intensity of the transmitted UV light at 280 nm are converted to Rθ and concentration, respectively, as described below.
Molecular weight of the protein sample in dilute solutions and for polarized light is related to intensity of the scattered light from the sample through the equation
 |
(3) |
where NA is the Avogadro's number, λ is the wavelength of the incident radiation, R is the distance of the sample from the detector, Is is the intensity of the scattered light, Io is the intensity of the incident light, c is the concentration of protein sample, dn/dc is the refractive index increment of protein solution, φ is the angle between the plane of the incident polarized light and the scattering detector, and n is the refractive index of the solvent. Upon collecting all the constants and instrument parameters into an overall light scattering instrument constant, A90, Eq. 3 can be written as
 |
(4) |
where
 |
(5) |
Since the intensity of the incident radiation, Io, and the distance between the sample and detector, R, is fixed, the ratio of these two parameters can be obtained by rearranging the above equation and is represented as K1, i.e.,
 |
(6) |
Hence, K1 can be simply obtained from the instrument constant A90, wavelength of the incident light (685 nm), and refractive index of the solution. Rayleigh's ratio at 90° scattering angle is defined as
 |
(7) |
Combining Eqs. 6 and 7, Rayleigh's ratio can now be expressed as
 |
(8) |
Eq. 8 provides a simple means of obtaining Rayleigh's ratio of a given data point on the light scattering chromatogram, once the instrument has been calibrated using an appropriate standard.
The concentration for each corresponding data point on the UV chromatogram was estimated from the UV signal intensity. In the present instrument configuration, the UV chromatogram represented the intensity of the transmitted light. Hence, the concentration of the injected protein at each data point was estimated using the equation
 |
(9) |
where c is the concentration of the protein, I100%T is the intensity of the UV signal at the baseline, I0%T is the signal of the UV detector in off-mode, Ia is the UV signal at a given time point on the chromatogram, E1% is the extinction coefficient of 1% protein solution, and b is the path length of the UV cell (3 mm). The following E1% values at 280 nm were used for the calculation of concentrations of various proteins studied: lysozyme, 26.4; chymotrypsinogen and chymotrypsin, 20.4; and BSA, 6.67.
Once the Rθ values and the corresponding concentrations are obtained for data at each time point on the chromatogram, the Debye plot is constructed according to Eq. 1 and the virial coefficient is obtained from the slope of this plot. An important parameter for the construction of the Debye plot is K, which depends on the square of the dn/dc of the protein solution and the refractive index of the solvent. Since the dn/dc of a given protein varies depending on solution conditions and significantly affects the value of K, this value must be determined for each different solution condition. In the present studies, this value is determined directly from the chromatogram obtained for the differential refractive index (DRI) detector after calibration of this detector using a standard of known dn/dc (see Calibration, below). This is another advantage of using SEC along with light scattering, UV, and DRI detector, since the dn/dc can be obtained from the same injection that is used for the determination of the B22 value. The refractive index of the NaCl solution of a given ionic strength, similar to that of the buffer (mobile phase), was used as the refractive index of the solvent for all calculations.
Calibration
The calibration of the instrument was carried out to determine the constant A90 for the determination of Rθ and the DRI constant, defined as B, to determine the dn/dc of a given protein. For this purpose, BSA was used as the standard. One-hundred microliters of a 2-mg/ml BSA solution in pH 7.4 was injected into a TSK3000SWXL size-exclusion column. A dn/dc of 0.167 and molecular weight of 66,000 was used to calculate calibration constants from the monomer peak of BSA. Under these conditions, the following calibration constants were obtained using the Precision/Analyze software (Precision Detectors): K90 = (B/A90) = 4569.8 and B = 54618.1. A90 is then obtained by dividing B with K90. Once the DRI constant, B, is obtained, the dn/dc of any given protein for a given solution condition can be determined as long as the molecular weight of the protein is known. The dn/dc value is estimated by varying its value in the calculation parameters until the calculated molecular weight from this technique is similar to the reported molecular weight.
RESULTS AND DISCUSSION
For the reasons mentioned earlier, a novel cell is fabricated that can simultaneously measure protein concentration and the scattered light intensity at 90° in flow mode in conjunction with SEC, and hence provide means to estimate B22 of proteins in aqueous solutions through construction of the Debye plot. Fig. 4 A shows chromatograms of lysozyme (pH 4.6, NaCl concentration = 400 mM) injected through the SEC column as recorded from signals obtained by light scattering and UV detectors, and after normalization of the chromatograms to a value of 1.0 at the peak maximum. The normalization was carried out only to facilitate comparison of the two chromatograms and was not used for the calculations of B22. The inset shows the expanded peak of the lysozyme monomer. As evident, the light scattering and the UV chromatograms completely overlay each other and show no interdetector band broadening or delay volume, which is observed when the detectors are connected in series. Hence, at each time point, the scattered light intensity of the protein sample on the light scattering chromatogram corresponds to its exact concentration at that point on the UV chromatogram. Furthermore, the higher molecular weight species or aggregates are well separated from the monomeric peak of lysozyme. This is important, since in batch-mode static light scattering studies such a separation is not attainable—resulting in an error in the measurement of the true scattered intensities.
FIGURE 4.
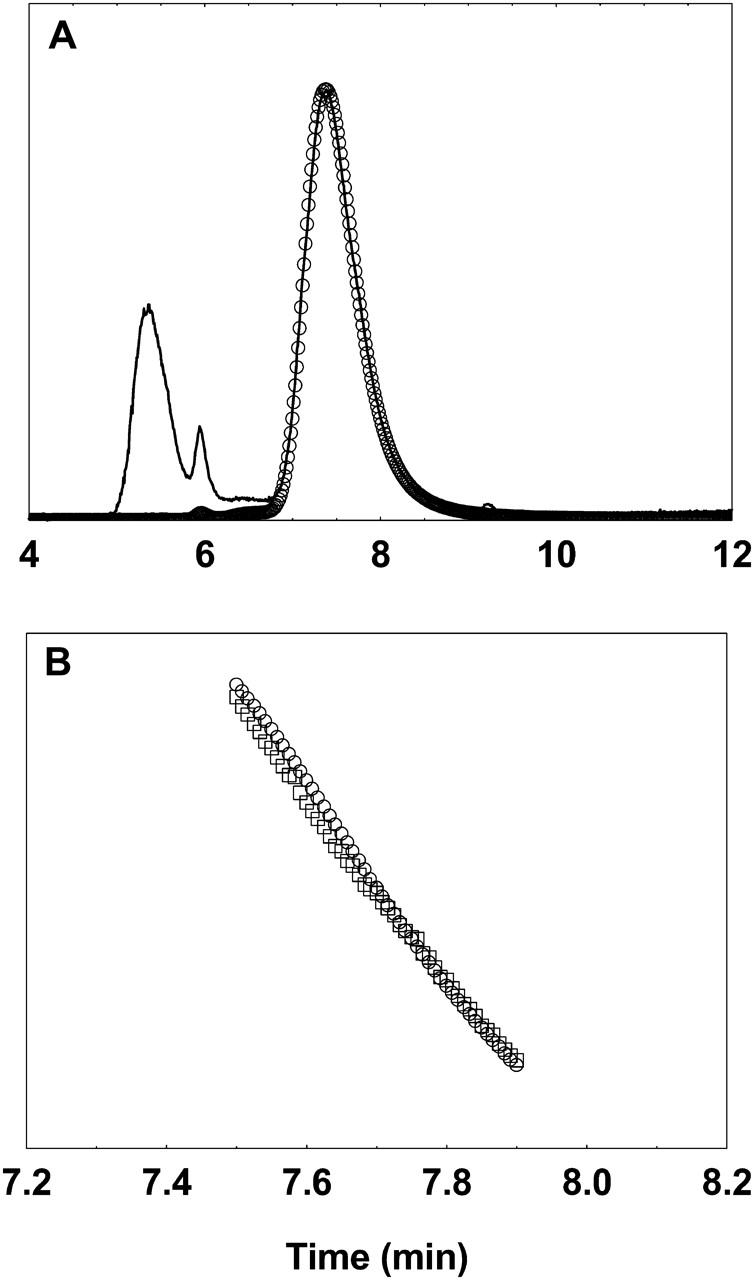
(A) Chromatograms for lysozyme eluted through a SEC column at pH 4.6 (NaCl concentration = 40 mM) generated with simultaneous detection by a 90° light scattering detector (solid line) and a UV detector (○). The inset shows the expanded view of the monomeric species of lysozyme indicating absence of interdetector delay volume or band broadening. (B) The expanded view of the latter half of the monomeric lysozyme chromatogram indicating several data points generated by the UV (○) and the light scattering detector (□).
It is also evident from Fig. 4 A that several data points are present on either side of the peak of the chromatograms, each of which represents a protein concentration and its corresponding scattered light intensity. In principle, one can use either side of the chromatogram to obtain a range of concentrations. In our studies, we selected the latter half of the peak for the analysis, as it generated more reproducible results. This could be because the initial half of the peak is somewhat affected by the aggregate peak in the light scattering chromatogram (the baselines do not completely overlap at the beginning of the chromatogram). Fig. 4 B shows the expanded view of the latter half of the normalized chromatograms illustrating that a range of several concentrations and their corresponding scattering intensities can be obtained from a single injection of the protein.
For the determination of B22, each individual data point on the UV chromatogram and the corresponding data point on the light scattering chromatogram is converted to concentration and Rayleigh's ratio, respectively, as described in Data Analysis, above. After calculating the value of K (defined in Eq. 2) a plot of Kc/Rθ versus c is then generated for all these points. Fig. 5 A shows such a plot for lysozyme at pH 4.6 for solution NaCl concentrations of 40 mM and 1.14 M. Several features are evident from this plot. It is clearly demonstrated that the proposed method provides a novel way of generating the Debye plot and hence of estimation of the B22 values, which in principle is similar to the values obtained from a batch-mode static light scattering method. Furthermore, a range of concentrations (∼5–20 mg/ml) with several intermediate concentrations can be obtained from a single injection of 150 μl of a 30-mg/ml lysozyme solution thus providing enough data for a reliable linear regression analysis. Most importantly, this method can estimate and track positive and negative B22 values of lysozyme at pH 4.6 for various solution ionic strengths similar to those reported in literature under the given solution conditions (Fig. 5 B). Clearly, our values agree well quantitatively with those reported previously.
FIGURE 5.
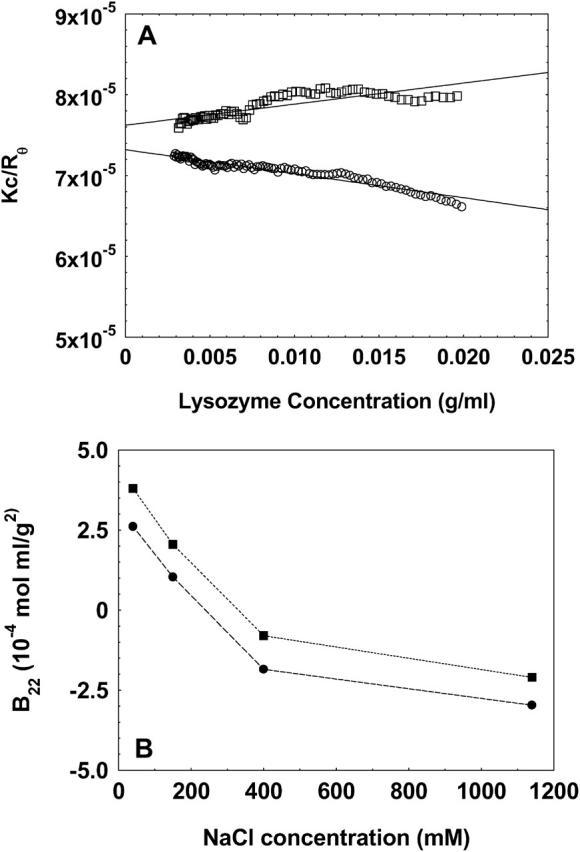
(A) Debye plots (Kc/Rθ versus c) of lysozyme at pH 4.6 and NaCl concentrations of 40 mM (□) and 400 mM (○). The lines are generated by linear regression of the data points and the slope of the line represents the B22 of lysozyme under these solution conditions. (B) B22 values of lysozyme at pH 4.6 at varying NaCl concentrations determined by the method presented in this study (•) and its comparison to those reported in literature obtained by batch-mode static light scattering method (Rosenbaum and Zukoski, 1996) (▪). The lines are used as a guide to the eye.
To test the validity and generality of this technique for the measurement of B22, we further conducted experiments on α-chymotrypsinogen A, whose B22 values have been well reported in literature under various solution conditions. Fig. 6 A shows the B22 values of chymotrypsinogen A at pH 3.0 for varying NaCl concentrations in solution and Fig. 6 B shows the B22 values of this protein at a solution NaCl concentration 300 mM at varying solution pH. It is seen that the B22 values obtained by the method presented in this study follow similar trends compared to those reported in literature for the various solution conditions studied. It should be noted that the absolute values may not match since different techniques may result in different values of B22 as has been previously reported in similar type of studies (Bloustine et al., 2003; Teske et al., 2004; Velev et al., 1998). These differences have been attributed either to the effect of systematic errors associated with the techniques or to the multiple-body interaction of solute with each other (e.g., solute in the mobile phase interacting with multiple immobilized solutes in affinity chromatography). Furthermore, it should be noted that batch-mode light scattering incorporates scattering contributions from everything that is present in solution, e.g., aggregates and dust particles, whereas in SEC these contributions are eliminated. Hence, the net result of these factors could result in a disagreement in the comparison of absolute values of B22 among various techniques.
FIGURE 6.
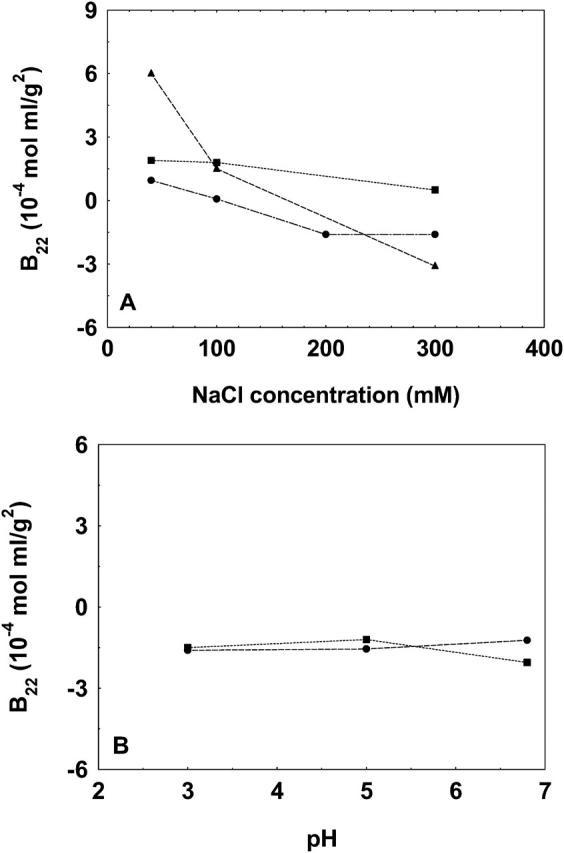
The B22 values of chymotrypsinogen at pH 3.0 at varying NaCl concentrations (A) and at NaCl concentration of 300 mM at varying pH (B) determined by the method presented in this study (•), compared to those reported in literature obtained either by batch-mode static light scattering method (Velev et al., 1998) (▴) or by self-interaction chromatography (Tessier et al., 2002) (▪). The lines are used as a guide to the eye.
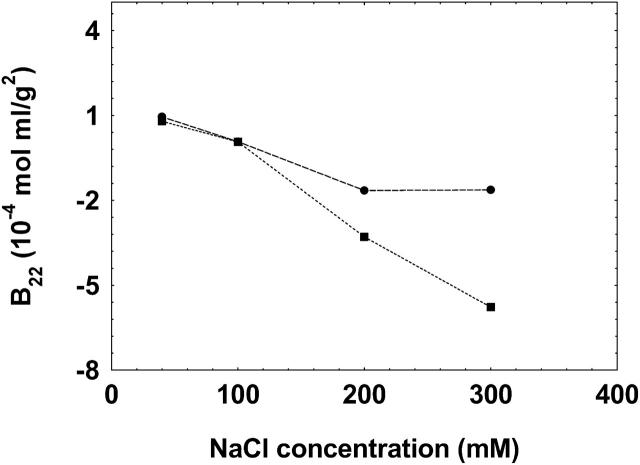
Chymotrypsin is a related protein to chymotrypsinogen and in fact can be obtained from chymotrypsinogen through autocatalytic activation of the latter. Hence, the protein-protein interactions in chymotrypsin are presumed to be similar to those present in chymotrypsinogen. This provided yet another way to test the validity of the present method, since under a given set of solution conditions similar values of B22 should be obtained for both the proteins. Fig. 7 shows that, at pH 3.0, for 40-mM and 100-mM solution NaCl concentrations, similar B22 values are obtained for these two proteins, but that at 200-mM and 300-mM NaCl concentrations, the difference is significantly large. Evidently, at higher NaCl concentrations, the net protein-protein interactions are not similar for these proteins and appear to be more attractive for chymotrypsin compared to that for chymotrypsinogen. These data demonstrate the applicability of the proposed method in identifying different protein-protein interactions even when the proteins are closely related to each other.
FIGURE 7.
The B22 values of chymotrypsinogen (•) and chymotrypsin (▪) determined by the method presented in this study at pH 3.0 at varying NaCl concentrations. The lines are used as a guide to the eye.
Table 1 shows a summary of the B22 values of the various proteins studied under different solution conditions in this study compared to those reported in literature using batch-mode static light scattering technique. The standard deviation in the B22 values for all solutions obtained in this study was always <0.3 × 10⁻⁴ mol ml/g2. These results demonstrate the applicability of the flow-mode static light scattering method with dual-detectors in a single cell in conjunction with SEC to determine the B22 of proteins in aqueous solutions comparable to those reported in literature. The advantages offered include 1), smaller amount of protein required (B22 values can be obtained from a single protein injection); 2), minimum contribution of dust; 3), separation of aggregates from monomeric species; and 4), amenability to high throughput screening from the use of automated SEC-HPLC systems (which can run several samples in a short duration of time).
TABLE 1.
The B22 values of various proteins under different solution conditions, as determined by the method presented in this study compared to those reported in literature
|
B22 (10−4 mol ml/g2)
|
||
|---|---|---|
| Solution conditions (pH, NaCl concentration) | Our results (mean ± SD, n = 3) | Literature values |
| Lysozyme | ||
| pH 4.6, 40 mM | 2.6 ± 0.1 | 3.8* |
| pH 4.6, 150 mM | 1.0 ± 0.2 | 2.0 |
| pH 4.6, 400 mM | −1.8 ± 0.1 | −0.8 |
| pH 4.6, 1.14 M | −3.0 ± 0.3 | −2.1 |
| Chymotrypsinogen | ||
| pH 3.0, 40 mM | 0.9 ± 0.1 | 6.0† |
| 1.9‡ | ||
| pH 3.0, 100 mM | 0.1 ± 0.1 | 1.5 |
| 1.8 | ||
| pH 3.0, 200 mM | −1.6 ± 0.2 | — |
| pH 3.0, 300 mM | −1.6 ± 0.2 | −1.5 |
| 0.5 | ||
| pH 5.0, 300 mM | −1.6 ± 0.2 | −1.2 |
| pH 6.8, 300 mM | −1.2 ± 0.2 | −2.0 |
| Chymotrypsin | ||
| pH 3.0, 40 mM | 0.8 ± 0.1 | — |
| pH 3.0, 100 mM | 0.1 ± 0.01 | — |
| pH 3.0, 200 mM | −3.3 ± 0.3 | — |
| pH 3.0, 300 mM | −5.8 ± 0.3 | — |
CONCLUSIONS
In this study, we have reported a method for the measurement of the B22 values of proteins in aqueous solutions—one which utilizes a novel fabricated dual-detector cell, with the capability of simultaneously measuring scattered light intensity and protein concentration in flow-mode after the protein elutes from a SEC column. We conclude that this method provides a reliable and simple means of estimating B22 values, with results similar to those achieved by conventional techniques such as static light scattering.
Acknowledgments
The authors acknowledge Dr. Norman Ford for his help with fabrication of the dual-detector cell.
The authors gratefully acknowledge financial support from Boehringer Ingelheim, Ridgefield, CT and the National Science Foundation Industry/University Cooperative Research Center for Pharmaceutical Processing (http://www.ipph.purdue.edu∼nsf/aboutCPPR.html).
Vikas K. Sharma's present address is Biotechnology Process Engineering Center, and Dept. of Chemistry, Massachusetts Institute of Technology, Cambridge, MA 02139.
References
- Bloustine, J., V. Berejnov, and S. Fraden. 2003. Measurements of protein-protein interactions by size-exclusion chromatography. Biophys. J. 85:2619–2623. [DOI] [PMC free article] [PubMed] [Google Scholar]
- Chi, E. Y., S. Krishnan, B. S. Kendrick, B. S. Chang, J. F. Carpenter, and T. W. Randolph. 2003a. Roles of conformational stability and colloidal stability in the aggregation of recombinant human granulocyte colony-stimulating factor. Protein Sci. 12:903–913. [DOI] [PMC free article] [PubMed] [Google Scholar]
- Chi, E. Y., S. Krishnan, T. W. Randolph, and J. F. Carpenter. 2003b. Physical stability of proteins in aqueous solution: mechanism and driving forces in nonnative protein aggregation. Pharm. Res. 20:1325–1336. [DOI] [PubMed] [Google Scholar]
- Curtis, R. A., J. Ulrich, A. Montaser, J. M. Prausnitz, and H. W. Blanch. 2002. Protein-protein interactions in concentrated electrolyte solutions: Hofmeister-series effects. Biotech. Bioeng. 79:367–380. [DOI] [PubMed] [Google Scholar]
- Fabian, H., L. P. Choo, G. I. Szendrei, M. Jackson, W. C. Halliday, L. Otvos, Jr., and H. H. Mantsch. 1993. Infrared spectroscopic characterization of Alzheimer plaques. Appl. Spectrosc. 47:1513–1518. [Google Scholar]
- George, A., Y. Chiang, B. Guo, A. Arabshahi, Z. Cai, and W. W. Wilson. 1997. Second virial coefficient as predictor in protein crystal growth. Meth. Enzymol. 276:100–110. [DOI] [PubMed] [Google Scholar]
- George, A., and W. W. Wilson. 1994. Predicting protein crystallization from a dilute solution property. Acta Crystallog. D Biol. Crystallog. D50:361–365. [DOI] [PubMed] [Google Scholar]
- Guo, B., S. Kao, H. McDonald, A. Asanov, L. L. Combs, and W. W. Wilson. 1999. Correlation of second virial coefficients and solubilities useful in protein crystal growth. J. Crystal Growth. 196:424–433. [Google Scholar]
- Ho, J. G. S., A. P. J. Middelberg, P. Ramage, and H. P. Kocher. 2003. The likelihood of aggregation during protein renaturation can be assessed using the second virial coefficient. Protein Sci. 12:708–716. [DOI] [PMC free article] [PubMed] [Google Scholar]
- Jackson, C., L. M. Nilsson, and P. J. Wyatt. 1989. Characterization of biopolymers using a multi-angle light scattering detector with size exclusion chromatography. J. Applied Polym. Sci. 43:99–114. [Google Scholar]
- Knezic, D., J. Zaccaro, and A. S. Myerson. 2004. Thermodynamic properties of supersaturated protein solutions. Crystal Growth Des. 4:199–208. [Google Scholar]
- Netopilik, M. 1997. Combined effect of interdetector volume and peak spreading in size exclusion chromatography with dual detection. Polymers. 38:127–130. [Google Scholar]
- Netopilik, M. 2003. Problems connected with band-broadening in size-exclusion chromatography with dual detection. J. Biochem. Biophys. Meth. 56:79–93. [DOI] [PubMed] [Google Scholar]
- Petsev, D. N., B. R. Thomas, S. T. Yau, and P. G. Vekilov. 2000. Interactions and aggregation of apoferritin molecules in solution: effects of added electrolytes. Biophys. J. 78:2060–2069. [DOI] [PMC free article] [PubMed] [Google Scholar]
- Piazza, R. 1999. Interactions in protein solutions near crystallization: a colloid physics approach. J. Crystal Growth. 196:415–423. [Google Scholar]
- Poon, W. C. K. 1997. Crystallization of globular proteins. Phys. Rev. E Stat. Phys. Plasmas Fluids Rel. Interdisc. Topics. 55:3762–3764. [Google Scholar]
- Rosenbaum, D. F., and C. F. Zukoski. 1996. Protein interactions and crystallization. J. Crystal Growth. 169:752–758. [Google Scholar]
- Shortt, D. W. 1994. Measurement of narrow-distribution polydispersity using multiangle light scattering. J. Chromatogr. A. 686:11–20. [Google Scholar]
- Tanford, C. 1961. Physical Chemistry of Macromolecules. Wiley, New York.
- Teske, C. A., H. W. Blanch, and J. M. Prausnitz. 2004. Measurement of lysozyme-lysozyme interactions with quantitative affinity chromatography. J. Phys. Chem. B. 108:7437–7444. [Google Scholar]
- Tessier, P. M., A. M. Lenhoff, and S. I. Sandler. 2002. Rapid measurement of protein osmotic second virial coefficients by self-interaction chromatography. Biophys. J. 82:1620–1631. [DOI] [PMC free article] [PubMed] [Google Scholar]
- Velev, O. D., E. W. Kaler, and A. M. Lenhoff. 1998. Protein interactions in solution characterized by light and neutron scattering: comparison of lysozyme and chymotrypsinogen. Biophys. J. 75:2682–2697. [DOI] [PMC free article] [PubMed] [Google Scholar]
- Wen, J., T. Arakawa, and J. S. Philo. 1996. Size-exclusion chromatography with on-line light-scattering, absorbance, and refractive index detectors for studying proteins and their interactions. Anal. Biochem. 240:155–166. [DOI] [PubMed] [Google Scholar]
- Wyatt, P. J. 1993a. Light scattering and the absolute characterization of macromolecules. Anal. Chim. Acta. 272:1–40. [Google Scholar]
- Wyatt, P. J. 1993b. Mean square radius of molecules and secondary instrumental broadening. J. Chromatogr. A. 648:27–32. [Google Scholar]
- Wyatt, P. J. Wyatt Technology Corporation, USA. assignee. 2002. Method for measuring the 2nd virial coefficient of a protein monomer. US patent 6411383.
- Wyatt, P. J., and L. A. Papazian. 1993. The interdetector volume in modern light scattering and high performance size-exclusion chromatography. LC-GC. 11:862–872. [Google Scholar]
- Zammit, M. D., T. P. Davis, and K. G. Suddaby. 1998. Factors influencing detector matching in multidetector SEC: solvent and concentration effects. Polymers. 39:5789–5798. [Google Scholar]
- Zhang, J., and X. Y. Liu. 2003. Effect of protein-protein interactions on protein aggregation kinetics. J. Chem. Phys. 119:10972–10976. [Google Scholar]


