

Abstract
The sustained increase of the cytosolic calcium concentration ([Ca2+]i) plays a central role in T-cell receptor (TCR)-mediated T-cell activation. Previous experiments using a [Ca2+]i clamp technique have demonstrated that specificity is encoded by the [Ca2+]i oscillation frequency since cytokine transcription factors are activated in a frequency-dependent manner. An outstanding question is how encoding of specific activation occurs under physiological conditions. In this case, continuous TCR interactions with specific peptides bound to cell surface-associated major histocompatibility complexes are driving the sustained [Ca2+]i increase. Addressing this question, we analyzed [Ca2+]i time series from individual T-cells mathematically. We are able to identify signal fluctuations associated with the TCR-triggering dynamics. We also find that [Ca2+]i time series associated with T-cells activated to IFN-γ production exhibit oscillations with higher frequencies than the time series corresponding to T-cells not activated to IFN-γ production. We show that signal autocorrelations are a means to distinguish functional signals according to their associated cytokine production. The signal level, however, allows for the distinction of nonfunctional from functional signals. These findings provide strong evidence for specificity encoding of biological functions in intracellular signals via signal level and signal correlations.
INTRODUCTION
Cell activation and differentiation is typically initiated by inductive signals (Wolpert et al., 1998). Such signals often have their origin in the triggering of surface-bound receptors. After the initiation by surface-bound receptors, the signal propagates to the cell nucleus via a complex network of signaling cascades that may exhibit crosstalk, feedback, and branchings (Meyer and Teruel, 2003). As a consequence, signals originating at the cell surface may undergo a series of complex changes while propagating toward the cell nucleus. Hence signal specificity plays a fundamental role in cell activation since cellular signals reflect a particular external stimulus that results in the expression of specific genes and the associated cellular response (Feske et al., 2001). Two central questions of intracellular signaling therefore are: to what extent does the intracellular signal contain information about the triggering dynamics of surface-associated receptors, and how is the signal specificity encoded in intracellular signals?
T-cells mediating an efficient and specific immune response to an invading pathogen constitute an interesting system in which to study the above questions. In the case of T-cells, specific information about the pathogen is passed from antigen-presenting cells (APCs) to T-cells by immediate cell-cell contact (Germain, 1994). This information is then processed and converted into an appropriate T-cell response to the pathogen (Janeway and Travers, 1997). A classic example for this process is Th1/Th2 differentiation, wherein the immune system takes a decision as to whether a cellular or a humoral T-cell response is appropriate (Abbas et al., 1996; Höfer et al., 2002). The amount of pathogen detected by the APCs can also influence the final biological function attained by the T-cell. An example for this is the induction of cytoxicity and cytokine production in cytotoxic T-lymphocytes (i.e., CTLs; CTLs form a subset of T-cells specialized in killing diseased cells) which is controlled by the amount of foreign peptide (also called specific peptide). A low specific peptide concentration induces only the ability to kill infected cells (cytotoxicity). A high specific peptide concentration, however, leads to the induction of cytokine production in addition to cytotoxicity (Valitutti et al., 1996; Porgador et al., 1997; Faroudi et al., 2003).
The morphological manifestation of specific peptide presentation to a T-cell is the formation of a central supramolecular activation cluster also called the immunological synapse. The synapse is located in the cell-cell contact area of the APC and the T-cell (Monks et al., 1998; Bromley et al., 2001) and is characterized by an organized large-scale molecular structure whose formation is driven by differential bond lengths of surface molecules on APCs and T-cells and by receptor transport via cytoskeleton attachment (Qi et al., 2001; Burroughs and Wülfing, 2002). Continuous interaction of peptide/major histocompatibility complexes (pMHC) with T-cell receptors (TCR) (i.e., pMHC-TCR) in the cell-cell contact area induces a sustained signaling (Valitutti et al., 1995; Wofsy et al., 2001; Huppa et al., 2003).
The sustained increase of [Ca2+]i is a classic quantity for studying the encoding of specific information in intracellular signaling, since it is a key signaling step involved in TCR-mediated T-cell activation (Goldsmith and Weiss, 1988). Seminal studies on T-cell activation to biological functions by clamp-induced calcium oscillations have shown that efficiency and specificity of gene expression depends on the oscillation frequency: rapid oscillations stimulate NF-AT, Oct/OAP, and NF-κB, whereas infrequent oscillations activate only NF-κB (Dolmetsch et al., 1998). However, clamp-induced calcium oscillations do not correspond to typical [Ca2+]i patterns induced by a T-cell-to-APC contact under physiological conditions. Hence, a crucial issue in the understanding of T-cell activation is how encoding of efficient and specific activation occurs when successive pMHC-TCR interactions are the central cause of a sustained [Ca2+]i increase leading to T-cell activation. Looking at the problem in this way highlights the upstream and downstream aspect of the issue (see Fig. 1). First (upstream), can aspects of TCR-pMHC interaction (i.e., the triggering dynamics) be identified in the calcium time series? And second (downstream), can physiologically derived [Ca2+]i patterns be successfully correlated with the final biological functions of the corresponding T-cell?
FIGURE 1.

A reductionist scheme of T-cell receptor-mediated signaling. T-cell receptors are stochastically engaged by peptide MHCs, which leads to the initiation of a signaling cascade with the direct consequence of a [Ca2+]i increase. This induces the expression of IFN-γ via the activation of NF-AT, NF-κB, and AP-1. Stochastic engagement of TCRs means that the calcium stimulus fluctuates over time (A and B). Stochasticity in the signaling cascade may also contribute to the stimulus fluctuations.
The above questions were studied using mathematical tools developed for the analysis of time-series data. Our analysis characterizes pMHC-TCR interaction-associated signal fluctuations. Also, we are able to sort the time-series data into two groups of calcium patterns using the autocorrelation function. Our analysis indicates that frequency encoding of biological T-cell functions occurs under physiological conditions.
RESULTS
Description of the data sets
The text is organized as follows. This section gives a description of the data followed by our data analysis yielding the characterization of signaling-associated noise (Identification of Signaling-Associated Noise). Next, the dominant frequencies exhibited by the time series are analyzed (Oscillation Periods and Damping Times) and the importance of the autocorrelation function for signaling pattern classification and its relevance for the coding problem is discussed (Signal Discrimination Using Autocorrelations). And finally, in Nonfunctional Signals an examination of nonfunctional signals is provided.
The data analysis presented in this article was performed using the TISEAN 2.1 (Hegger et al., 1999) and R 1.5 (Ihaka and Gentleman, 1996; Venables and Ripley, 2002) software packages.
Existing [Ca2+]i time series from individual cytotoxic T-lymphocytes (CTLs) activated by target cells pulsed with two different specific peptide concentrations were used in this study (Faroudi et al., 2003). An HLA-A2-restricted T-cell line CMVpp65 specific for the human cytomegalovirus protein peptide pp65 (NLVPMVATV) was used. HLA-A2-matched, Epstein-Barr-virus-transformed B-cells were used as target cells. T-cell line and Epstein-Barr-virus B-cell lines were generated and maintained as described (Faroudi et al., 2003). Briefly, the T-cell line was generated from one healthy donor, kept in culture in the presence of human serum and IL-2, and was periodically restimulated. To verify their full functionality T-cells were regularly tested for their response to antigenic stimulation by measuring antigen-induced TCR downregulation and perforin secretion.
The T-cells were incubated with the calcium-binding dye Fura 2-AM. After washing, Fura-2-loaded T-cells were dropped onto target cells previously pulsed with various concentrations of the specific peptide and attached to a poly-L-lysine-coated slide to form a monolayer. Fluorescence measurements were done on a Zeiss Axiovert 200M inverted microscope (Carl Zeiss, Jena, Germany) equipped with a charge-coupled device camera (Princeton Instruments, Trenton, NJ), an arc-xenon lamp, and a computer-controlled monochromator (TILL Photonics, Planegg, Germany) at 37°C, 5% CO2. Cells were consecutively excited with 340 and 380 nm at 5-s intervals by means of the monochromator, and both emissions were collected with the charge-coupled device camera. The Fura 2-loaded CTLs changed the ratio of excitation at 340 and 380 nm upon [Ca2+]i increase.
Altogether, 38 time series obtained at a low specific peptide concentration of 1 nM, and 44 time series obtained at a high specific peptide concentration of 10 μM, were analyzed. The time series were obtained in four different experimental sessions. It has been estimated that the concentrations of 20 μM and 50 nM of specific peptide lead to the localization of ∼104 and 102 specific pMHCs in the APC:CD4 T-cell contact area (Valitutti et al., 1995). Therefore we can assume that the number of molecules triggering the TCRs in our cellular system differs by a factor of ∼102−103. Both concentrations of specific peptide induce cytoxicity in the CTLs but only the high concentration yields saturation of cytokine production in the CTL population (at the low concentration, 10% of the maximal cytokine production is attained; Faroudi et al., 2003). Thus, both sets of [Ca2+]i patterns constitute signals capable of evoking a cellular response (functional signals) that are generated by two different triggering dynamics, i.e., different numbers of pMHCs involved in the TCR triggering eliciting two different biological functions. Hence, the [Ca2+]i data incorporate both upstream and downstream aspects of the encoding problem. Ten typical time series resulting from the two experimental setups are depicted in Fig. 2, A and B. The temporal resolution Δt is 5 s; the first 10 min (constituting 120 points) of signaling are depicted.
FIGURE 2.

Typical [Ca2+]i patterns induced by the high and low specific peptide concentrations are depicted (A and B; time is measured in integers as the index of the data points). The corresponding detrended time series are shown in C and D; note that, in C and D, the first minute of signaling has already been cut off.
A striking feature of the data is its variability: the level of [Ca2+]i as well as dynamic characteristics such as the presence of pronounced oscillations vary considerably. It therefore appears that the basic parameters underlying each realization of the time series can vary from cell to cell in the same experiment. One source of variability might also lie in individual differences in capability of the T-cells for processing the fluorescence marker, since the measurement calibration is performed on the population level. However, it is our general experience that data analysis of the [Ca2+]i time series is highly comparable with data analysis performed on the directly observed fluorescence data.
In general we find that the ensemble average of the high and low concentration data sets of [Ca2+]i saturate after the first minute, after which they start a linear decline. The ensemble average is defined by  where the summation includes all time-series i of the respective set (i.e., n = 44 for the high peptide concentration and n = 38 for the low peptide concentration). A linear regression analysis for the 9 min of the linear postsaturation decline yields the relations 〈Cat〉High = 395.8–8.4 nM/min t and 〈Cat〉Low = 238.4–4.8 nM/min t (see also Faroudi et al., 2003). The following analysis focuses on this 9-min postsaturation phase where the ensemble average of each set follows a moderate linear decline, thus the first minute of each time series is ignored in the analysis in the remainder of this article.
The first step in our data analysis is the removal of trends exhibited by the time series. To remove these trends, the two above-mentioned regression lines are interpreted as an average trendline of each of the two data sets. Hence we use in this study two detrending schemes capable of removing linear trends: detrending by lagged differences Cat+Δt−Cat and detrending by lagged ratios Cat+Δt/Cat (Appendix 1). Lagged differences were used to detrend each time series; examples of 10 detrended time series coming from each data set are depicted in Fig. 2, C and D. The detrended time series are, approximatively, first- and second-order stationary—and they are used for the analysis described in the remainder of this article.
It should be pointed out that different choices for the detrending of a set of time series can be made and that an appropriate detrending scheme depends also on the quantity of interest, i.e., on the scientific question. Previously we were interested in signal roughness (or spikiness) and the temporal evolution of the signal roughness in the two data sets (Faroudi et al., 2003). Hence, we chose to detrend each time series individually by fitting a smooth curve to the time series and subsequently subtracting it from the time series. The root mean-square of the resulting detrended time series constitutes a sensitive measure for the signal roughness. However, this method is not appropriate for studying the spectrum of a time series since a fitted smooth curve follows moderate oscillations of the time series. Thus subtraction of the smooth curve from the time series can result in the removal of low frequency oscillations from the time series. In this study the signal roughness is of secondary interest whereas signal oscillations and their frequencies are of primary interest. This is why we used lagged differences as a detrending scheme since the lagged differences lead to a detrended time series whose spectrum has a bias-free relation with the original spectrum (Appendix 2). On the one hand, using the lagged differences as a detrending scheme, we are able to reproduce previous results on signal roughness and its evolution; but, on the other hand, with reduced sensitivity (data not shown), we are able to study oscillations and their frequency with greater accuracy.
Before discussing the results of the data analysis we would like to address the T-cell's point of view: how can the T-cell signaling cascade constitute a dynamical system that processes the incoming signal in such a way that it carries out an analysis of the time series? We would like to bring forward a hypothesis on how the signaling cascade architecture might provide a molecular analysis mechanism comprising detrending and frequency decoding.
One possible realization of such a molecular mechanism can be envisaged by using mathematical models of signaling cascades. Mathematical modeling of simple signal transduction cascades often uses linear-signaling cascade steps, whose kinetic parameters determine signal stretching and its propagation speed (Heinrich et al., 2002). Linear cascades yield no changes in the fundamental statistics of the signal as long as they do not saturate. As such, a branching and subsequent rejoining of a signaling cascade might constitute a natural time-lagging mechanism and competition of two differentially controlled factors at the joining of the cascade can constitute a differencing/ratioing of the signal. This mechanism would provide a mechanistic cellular analog for our detrending procedure. Subsequent frequency decoding might be performed by a biochemical high- or low-pass filter.
In the following we will give a brief mathematical explanation of how signal differencing/ratioing may be achieved by branching and subsequent rejoining of a signaling cascade. Let C be a factor activating a particular biological function; let A be a factor whose concentration is mainly determined by signaling through branch Ã; and B, a factor controlled by signaling through branch B̃. Assuming that signaling through branch B̃ differs from signaling through à only in its propagation speed, we get Bt = At−δt. Competition between A and B in the form of an activatory (A) and inhibitory (B) influence on C gives a differencing of the signal ( ) and control of C through the balance of A and B leads to ratioing of the signal (
 ). It should be pointed out that these considerations are only intended to propose a generic mechanism for a molecular detrending mechanism where important details such as signal amplification are ignored; and also that δt, the time delay created by differences in propagation speeds, is not related to the temporal resolution Δt. However, the magnitude of the time delay is not important for detrending by lagged differences or lagged ratios, as is evident from the considerations in Appendix 1. In concluding this section, we propose that one role of the immense complexity encountered in intracellular signal transduction networks, is to provide a means of molecular data analysis of which signal detrending by the formation of time-lagged differences is one aspect.
Identification of signaling-associated noise
In this section we show that the signal fine structure is dependent on pMHC-TCR interactions demonstrating that the time-series analysis of [Ca2+]i patterns is a new way of probing the pMHC-TCR interaction. Typically, the detrended time series (an example of a low peptide concentration-induced time series is shown in Fig. 3 A) contain nontrivial correlations as attested to, by the corresponding autocorrelation function (Fig. 3 B). Since the two sets of time series in our study are induced by a process involving two very different numbers of pMHC molecules as the driving force, it is likely that fluctuations due to stochastic pMHC-TCR binding and TCR triggering are different in both sets. However, we would like to stress that stochastic pMHC-TCR binding and TCR-triggering events are not the only possible source of fluctuations. Other random contributions such as measurement noise, fluctuations in the signaling cascade, and membrane fluctuations of target and T-cell, contribute to the stochastic part of each time series.
FIGURE 3.

A detrended time series and its autocorrelation function are given in A and B. AR fitting of the time series results in correlation free residuals (autocorrelation function and cumulative periodogram in C) whose values follow a Gaussian distribution (Q−Q plot in D).
It should also be pointed out that an increase of [Ca2+]i can be induced without the engagement of TCRs with specific pMHCs, which has recently been demonstrated in Revy et al. (2001). The adhesion molecule LFA-1 required for the formation of a cell-cell interface is thought to play a crucial role in TCR independent-signal transduction (Perez et al., 2003). However, since the cell-cell interface and the adhesion molecule affinity are modulated by the TCR signaling itself (Lollo et al., 1993) it can, in the case of functional signals, be assumed that the major contribution to the increase of [Ca2+]i is dependent on TCR-mediated signaling (nonfunctional signals are discussed toward the end of this article). Hence, measurement noise is the only TCR signaling-independent source of fluctuations since TCR signaling affects the state of the signaling cascade as well as membrane fluctuations via its effect on cell-cell adhesion. Thus, we use the term signaling-associated noise to emphasize that a multitude of processes contributes to the signal noise and that their contribution can, in turn, be modulated by signaling events.
A general means of separating correlations and fluctuations in a time series is by fitting autoregressive (AR) models of the form
 |
(1) |
to a time series. Each series is separated into a purely stochastic part εt and a part containing correlations given by the AR coefficients αi; t denotes the time index and p the order of the AR model. The resulting residuals (εt) represent the absolute noise contained in the time-series Xt. In fact, fitting an AR model to time-series data is similar to a (non)linear regression analysis of a point distribution, in the sense that the data correlations which are characterized by the model coefficients (αi) are determined for the complete data set by finding, for example, the least-square distance between fit and data with the aim that the residuals are normally distributed. This approach of AR modeling of the detrended time series implicitly assumes that removing the linear trend in the original time series yields a time series whose statistical properties remain approximately constant over the time span of the data set. Indeed we find that the detrended time series are approximately first- and second-order stationary. The biological implication of this is that the signaling-induced loss of signaling components via downregulation and degradation is not very pronounced in the first few minutes of signaling, inasmuch as the local loss of signaling components is countered by transport of new signaling components to the cell-cell contact area (Favier et al., 2001). Technical details of AR fitting are discussed in Appendix 3.
Using AR fitting we obtain residuals εt for all the time series that hardly contain correlations and are Gaussian. In Fig. 3 C the autocorrelation function as well as the cumulative periodogram of the residual corresponding to Fig. 3 A is depicted, and no correlations are discernible. In addition to that, the residuals follow a Gaussian distribution as is demonstrated by the quantile-versus-quantile plot (Fig. 3 D). These three quantities have been checked for each time series and it has been verified that the residuals contain virtually no correlations and follow a Gaussian distribution to a very good approximation.
The two histograms in Fig. 4 depict the cumulative distribution of all the residuals ( and
and  details in Appendix 4) of each data set and the curves depict Gaussian distributions with standard deviations of σhigh = 0.79 and σlow = 1.59 (obtained from a time-series detrended by lagged differences). For the data obtained using lagged ratios, the estimates
  and
and  are obtained. The standard deviations were estimated using the median absolute deviation (Venables and Ripley, 2002; Huber, 1981); this method is stable with respect to outliers. In comparing the ratios (σlow/σhigh = 2.013 and
  ), we find that both methods yield nearly identical results (this supports the assumptions made in Appendix 4).
FIGURE 4.

The cumulative residuals of all time series induced by the high and low specific peptide concentrations are depicted. Both follow, in good approximation, a Gaussian distribution with standard deviation of σHigh = 0.79 and σLow = 1.59.
The database comprises >3500 data points for each data set. The highly significant difference in the standard deviation of both distributions indicates that the residuals contain signal-dependent stochasticity that is related to pMHC-TCR interactions. Furthermore, our analysis shows that the signaling-associated noise halves when the number of pMHCs is increased by a factor of ∼100 (the difference of specific pMHCs located in the cell-cell contact area for the two concentrations). In addition to that we propose that time-series analysis using AR modeling has the potential to probe the [Ca2+]i time series, leading to the identification of fundamental aspects of the pMHC-TCR triggering statistics.
It is instructive to discuss these results in the context of some mathematical considerations of pMHC-TCR interactions. The fact that purely stochastic fluctuations in signaling decrease with increase in the number of TCR triggering events is congruent with a simple two-state model of the signaling cascade. Ascribing either an open state (denoted 1) to a receptor contributing to the increase of [Ca2+]i, or a closed state (denoted 0) to a receptor not contributing to the increase of [Ca2+]i, leads to a process described by a pair of master equations,
 |
(2) |
 |
(3) |
where p(0, t) and p(1, t) are the probabilities of finding the receptor at time t in state 0 or 1; γ is the rate for going from a closed to an open signaling cascade; and β is the corresponding rate for the reverse process. Let us assume that the reversion rate β is independent of the number of pMHCs, whereas the rate γ—at which a pMHC-TCR bond is formed—is a monotone-increasing function of the number of free pMHCs. The expectation value for the state of the signaling pathway is 〈n〉 = γ/(γ + β) with a standard deviation  Thus it is found that for high bond formation rates (γ ≫ β), the standard deviation decreases as
  The ratio of standard deviations obtained from our data analysis,
  differs significantly from the ratio of 0.1 obtained under the simple assumption that the bond formation rate γ depends linearly on the number of pMHCs (
 ).
).
This deviation from a linear relation between bond formation rate and pMHC number could have its origin in a saturation effect possibly mediated by competition of pMHCs for signaling components. Such a saturation effect would be expected from biological considerations, since the high specific peptide concentration saturates the biological functions of the T-cell. This means that all the activation parameters of the T-cell such as IFN-γ production saturate at this concentration, with the natural conclusion that the amount of cell stimulus (TCR-mediated signaling) would also be saturated.
It should be pointed out that the above model serves only as an illustration of how an increasing number of pMHCs can lead to a decrease in the standard deviation of the signaling fluctuations. More detailed models of signaling mediated by pMHC-TCR interaction include spatiality (Chan et al., 2001; Coombs et al., 2002) as well as possible crosstalk and feedback of the entire signaling process. In general, signaling fluctuations can also be useful for immunological considerations, since they provide a new tool of probing pMHC-TCR interactions. Signaling-associated fluctuations should, for example, be dependent on the peptide quality. Hence, an interesting question would be to measure which peptide minimizes the amount of signaling-associated fluctuations, and whether this peptide is optimal in terms of activating the T-cell.
Oscillation periods and damping times
In the previous section we were analyzing the purely stochastic part of the detrended time series. In this section we will focus on signal correlations as expressed by damped oscillations and decay patterns. The results presented are obtained using lagged differences for detrending, but nearly identical results are obtained using lagged ratios for detrending.
The detrended time series presented in Fig. 3 A apparently exhibits stochastically influenced oscillations, i.e., a dominant oscillatory mode with a period of ∼20 × 5 s is discernible, but the oscillation period displays clear variations. The corresponding autocorrelation function in Fig. 3 B reveals that the dominant oscillatory mode is damped since the autocorrelation function decays to a value of 1/e (e the Euler constant) at a time-lag of 11. This suggests that the dominant oscillatory mode is a stochastically forced, damped oscillator with a damping time approximately one-half the oscillation period. Thus, it appears that an approach analyzing signal oscillations should be taking oscillation periods as well as their damping times into account.
The AR coefficients introduced in the previous sections reflect correlations in a time series and can thus be used to analyze typical oscillation periods and damping times of signals. One way of doing this is the eigen-decomposition of an AR model (Honerkamp, 1994). In this case, a univariate AR model of order p is transformed into p univariate AR models, which are coupled only by the noise (Neumaier and Schneider, 2001). The average dynamics of each eigenmode V has a representation in the complex plane given by
 |
(4) |
with damping times τk = − 1/log| λk| and oscillation periods Tk = 2π/|argλk| (note that 〈…〉 denotes the temporal average, which explains the absence of noise in Eq. 4). In principle, two different dynamical modes can be distinguished according to their eigenvalue λk. A mode associated with a real and positive eigenvalue is called a stochastically forced relaxator, whereas all other modes are called stochastically forced oscillators. The time series depicted in Fig. 3 A, for example, contains a dominant mode described by a stochastically forced oscillator with an oscillation period of T = 20.8 × 5 s and a damping time of τ = 8.4 × 5 s. Dynamical modes associated with a real but negative eigenvalue are oscillatory, but their oscillation period is not well enough resolved since it is shorter than the temporal resolution. These modes are assigned the shortest possible oscillation period T of 2. The observation of oscillatory modes whose oscillation frequency cannot be reliably determined can be illustrated by the example of a pendulum whose motion is observed with a stroboscope. When observing a pendulum with a stroboscope one can easily detect the periodic motion, even if the stroboscope frequency is much lower than the frequency of the pendulum. However, a reliable determination of the pendulum frequency would require an improved resolution of the pendulum motion by using a higher stroboscope frequency.
As a technical note it should be added that the oscillation frequencies computed by eigen-decomposition of the AR model were compared with results from a direct estimation of the spectrum by computing the squared correlation between the series and corresponding sine/cosine waves as well as the autocorrelation function. Good agreement between all three methods was found. However, the estimation of frequencies near the frequency cutoff of 0.5 × 1/5 s is error-prone; an improved analysis of the high frequency modes therefore requires time-series data with a better temporal resolution.
We find that the decay of correlations—measured by the damping times of the dynamical modes in the [Ca2+]i time series, induced by the high specific peptide concentration—is significantly faster than for the low specific peptide concentration (the average maximal damping times are  and
and  ). Hence we find that the two sets of time-series display a pronounced difference in the decay of correlations.
Furthermore, we find that ∼79% of the observed time series induced by the high specific peptide concentration exhibit oscillatory modes and 76% of the time series induced by the low specific peptide concentration have at least one oscillatory mode. The two histograms depicted in Fig. 5 show the distribution of the smallest oscillation frequencies (1/T) found for each set of time series. A frequency of zero means that the particular time series does not exhibit any oscillatory modes, and a frequency of 0.5 × 1/5 s means that the time series exhibits oscillations of frequencies equal to or higher than the highest resolved frequency of 0.5 × 1/5 s. The two histograms show that [Ca2+]i patterns by the high specific peptide concentrations tend to exhibit oscillations with higher frequencies than the patterns associated with the low specific peptide concentration. Only 13% of the patterns induced by the low peptide concentration contain a lowest frequency >0.1 × 1/5 s, whereas 59% of the patterns induced by the high peptide concentration contain a lowest frequency >0.1 × 1/5 s. This result is in support of the hypothesis that the activation of a particular biological function, such as cytokine production, is encoded by frequency in intracellular signals (the reader is referred to Appendix 2 for a discussion of the connection between the spectrum of the original and the detrended time series).
FIGURE 5.

Histograms of the distribution of the lowest frequency exhibited by the [Ca2+]i patterns are shown for both sets of time series. Low peptide concentration-induced time series contain oscillatory modes with smaller frequencies than the oscillatory modes associated with the high peptide concentration.
A second striking feature of the frequency distributions is the fact that three different signaling modes can be distinguished for signaling induced by the low specific peptide concentration. The majority of patterns exhibits oscillations at a frequency of ∼0.075 × 1/5 s; significant numbers of non-oscillating patterns, as well as patterns with oscillations of the highest possible frequency of 0.5 × 1/5 s, are observed. The two latter modes can also be found in the patterns induced by the high specific peptide concentration. However, a clear distribution around an intermediate frequency is not observable. Hence, a classification of these high concentration patterns into distinct signaling modes is not possible with the current data in particular, since a substantial amount of oscillatory signaling modes contained in the high concentration data is not well resolved by the temporal resolution of 1/5 s.
We find also that correlation of the cell's eventual biological function with the signal correlations requires more information than provided by the oscillation frequencies of these three different signaling modes. This is evident from the fact that these three modes are also found in T-cells that are neither activated to cytotoxicity nor cytokine production (see Nonfunctional Signals, below). Hence, we hypothesize that these three modes reflect typical realizations of the state of the cellular signaling network. The correlation of the eventual biological function of the cell with the signal correlations is discussed in detail in the following section.
Signal discrimination using autocorrelations
The previous section provided evidence for the frequency encoding of biological T-cell functions by demonstrating that high specific peptide concentrations tend to induce [Ca2+]i patterns that contain oscillations with higher frequencies than the patterns induced by a low specific peptide concentration. We found that the oscillatory modes of the [Ca2+]i patterns can be described by damped stochastically forced oscillators and that the damping times associated with the oscillatory modes also depend on the specific peptide concentration.
Motivated by these findings, we studied the question of whether frequency encoding of biological functions can occur under physiological conditions. To answer this question we have to adopt the T-cell's point of view: can the IFN-γ expression of an individual T-cell be controlled by the frequencies and damping times of oscillations found in its [Ca2+]i pattern? In our specific case, this means that we can only answer the question by using the oscillation frequencies and damping times of the individual time series to explain the pronounced differences in IFN-γ production found for the two specific peptide concentrations. We used the first 10 points of the autocorrelation functions of each [Ca2+]i pattern as a suitable measure for the oscillation frequencies and damping times.
The conceptual starting point of the following analysis is the fact that the exact relation between a certain [Ca2+]i pattern and the resulting IFN-γ production is unknown. This problem is similar to a wide range of problems encountered in biology. Examples are the classification of individuals into species using multivariate measures such as height, weight, and color (Venables and Ripley, 2002) or the detection of differences in gene expression patterns of tissue treated and not treated with a certain drug (Lesk, 2002). These problems are often approached by using multivariate analysis tools such as principal component analysis, multidimensional scaling analysis, or clustering methods. One aim of multivariate analysis is to find out whether a multivariate data set—such as gene expression patterns of two types of tissue—can be sorted into two distinct clusters that correlate with the tissue type. For example, multidimensional scaling analysis and principal component analysis try to find a low-dimensional projection of the original data set with maximal variability. Ideally, this projection contains all the variability of the original data set and interesting features such as the existence of distinct clusters can be studied by visual inspection of the low dimensional representation.
The basic consideration for the use of multidimensional scaling in our context is: if we find quantitative signaling characteristics whose distributions are statistically the same for both sets of time series (i.e., high and low specific peptide concentration), then these characteristics cannot play a major role in the control of IFN-γ production. If, on the contrary, we find quantitative characteristics that show pronounced statistical differences for the two sets of time series, we can say that these quantities might play a role in the control of IFN-γ production.
By statistically different we mean, in this case, that not only the mean and median of both distributions are different, but also that the overlap of both distributions is very small. Again, this line of thinking is inspired by the T-cell's perspective: can the IFN-γ expression be controlled by processing the cytosolic calcium concentration? Thus we are looking for signaling characteristics whose low-dimensional representation exhibits two clusters with small overlap and the two clusters have to correlate with the specific peptide concentration (further details are discussed in Appendix 5).
Using this perspective, we examine the data distribution of the average cytosolic calcium concentration ([Ca2+]i) in Fig. 6 A. The considerable overlap of both data sets means that a large fraction of cells of the low- and the high-concentration data sets would produce identical amounts of IFN-γ, if the average [Ca2+]i increase were the sole determinant of IFN-γ production. This finding is difficult to bring into concordance with the fact that the two peptide concentrations induce the production of very different amounts of IFN-γ (Faroudi et al., 2003). Thus, we are looking for quantitative signaling characteristics whose distributions exhibit a smaller overlap. The data presented in Fig. 6 B is the result of a multidimensional scaling analysis of the autocorrelation functions of all the time-series data. This low-dimensional projection of the data demonstrates that the distribution of autocorrelations of the two data sets has a significantly smaller overlap than the average [Ca2+]i increase. The small overlap between the two data sets compares well with the fact that the two peptide concentrations induce very different amounts of IFN-γ; thus it is possible that the autocorrelation (i.e., the oscillation frequencies and damping times) of the [Ca2+]i patterns is a major determinant of IFN-γ production. It is worthwhile to note that this result agrees well with studies on the activation of biological T-cell functions under nonphysiological conditions (Dolmetsch et al., 1998).
FIGURE 6.

(A) Depicts a strip chart and a box plot of the values for the average [Ca2+]i increase in the minutes 1–10 of signaling. A considerable overlap of both data sets is apparent. The scatter plot in B is a low-dimensional representation of the autocorrelation function associated with each time series. Time series induced by high (circles) and low (squares) specific peptide concentrations are grouped according to their autocorrelation function. A higher degree of data separation than for the average [Ca2+]i increase data is found. This is documented by the reduced overlap of both data sets along the x axis of the scatter plot. The box plot using the data distribution along the x axis illustrates the data separation (box plots display the quartiles 25%, 50%, and 75% of a distribution as a box with a middle line; the dashed lines cover 1.5 times the box size; additional single points are observations falling outside the dashed lines). In C, the autocorrelation function as well as the average [Ca2+]i increase were used to characterize each time series.
In Fig. 6 C, the autocorrelation function as well as the average [Ca2+]i increase are used to characterize each time series. The resulting two-dimensional representation is shown in the scatter plot as well as the box plot corresponding to the data distribution along the x axis. It is striking that the data separation is only marginally improved in comparison to the data separation presented in Fig. 6 B. This analysis suggests that signal correlations play an even more important role in the induction of biological functions than the signaling level itself. Nonetheless, it is worth mentioning that all quantities, i.e., each point of the autocorrelation function as well as the average [Ca2+]i, enter with the same weight into the analysis since the data are standardized before projection into a smaller dimension. Appropriate changes in the weights could lead to an even better data separation, thereby possibly emphasizing the importance of the average [Ca2+]i. The results are robust with respect to changes in the form of the multidimensional scaling.
The results indicate that oscillations as well as signal damping measured by the autocorrelation function can play an important role in the information transfer from the APC to the nucleus of the T-cell. We have ignored contributions from other signaling pathways involved in T-cell activation by focusing only on the increase in [Ca2+]i. Nonetheless, the above results show that the signaling pathway involving [Ca2+]i may contain enough information to control the differential IFN-γ gene expression patterns observed under the two experimental conditions. All in all, the data analysis of this section indicates that frequency encoding of specific T-cell activation parameters via the oscillation frequencies and damping times of [Ca2+]i patterns can occur under physiological conditions.
Nonfunctional signals
The data explored in the previous sections represent [Ca2+]i data of experiments where a defined biological function is induced by TCR-mediated signals, i.e., either only cytotoxicity or cytotoxicity and cytokine production. However, encounters between a T-cell and an APC can lead to the increase of [Ca2+]i not predominantly induced by TCR signaling. An example for this is the engagement of a T-cell and an APC carrying no specific peptide. The resulting calcium patterns range from patterns that show no increase above the basal level over singular spikes, to a sustained [Ca2+]i increase lasting for up to 10 min and more. These patterns have also been observed in our experimental setup and 10 examples are depicted in Fig. 7 A. The main driving force behind these calcium mobilization patterns is thought to be the stochastic engagement of adhesion molecules such as LFA-1 in the cell-cell interface; cross-reactivity might also lead to some signaling events.
FIGURE 7.

Ten typical [Ca2+]i time series observed in the absence of specific peptide are shown (A). In the scatter plot of B and C a low-dimensional representation of only the autocorrelation function and of the autocorrelation function together with the average [Ca2+]i increase associated with each time series is given (circles, high specificity; squares, low specificity; and diamonds, zero specificity in peptide concentration). In this case, the natural logarithm of the average [Ca2+]i was used in order to take a saturating behavior into account. For the same reason, the dissimilarity matrix is not standardized. In D, the average [Ca2+]i increase is plotted with respect to the lowest oscillation frequency found in the pattern. The highest [Ca2+]i increase observed in the absence of specific peptide is also depicted (dashed line).
To identify signaling-associated fluctuations we exploit the fact that the saturated average signal of 23 [Ca2+]i patterns declines approximately linearly (〈Cat〉No = 128.1−2.5 nM/min t). Subsequent AR modeling of the time series detrended by lagged differences yields again approximately uncorrelated residuals which follow a Gaussian distribution. The distribution of all 23 residuals has an estimated standard deviation of σno = 1.57. This value is similar to the one obtained for the signal fluctuations at the low specific peptide concentration (σlow = 1.59) and larger than the one found for the high specific peptide concentration of σhigh = 0.79. This finding can be understood by considering that the Gaussian distributions characterize two fundamentally different stochastic processes. Fluctuations in adhesion molecule binding are largely suppressed in the presence of sufficient specific peptides, inasmuch as TCR signaling leads to a stable cell-cell interface. The fact that synapse-like structures are observed for the high and low peptide concentration (Faroudi et al., 2003) means that the magnitude of adhesion molecule fluctuations is, in these two cases, largely reduced compared to signals induced in the absence of specific peptides.
A second issue in characterizing nonfunctional signaling data is the question of specificity. That means the fact that no IFN-γ production is induced in the absence of specific peptides (Faroudi et al., 2003) should be reflected by some of the properties of the time series. Therefore, correlations as well as frequencies of the dominant modes and the mean [Ca2+]i are of interest. Correlations identified by eigen-decomposition of the [Ca2+]i patterns decay on a short timescale ( ), but only approximately one-half of the patterns (52%) show oscillatory behavior, and most of the oscillations observed exhibit small amplitudes. This rapid decay in the absence of specific peptides is similar to that found for patterns induced by the high specific peptide concentration. Consequently, a multidimensional scaling analysis using only the autocorrelation function gives no good data separation with respect to the IFN-γ production (Fig. 7 B). However, the average [Ca2+]i is stereotypical in the absence of specific peptides. Hence, characterizing each [Ca2+]i pattern by its average and the autocorrelation function, yields a good data separation (Fig. 7 C). Thus, the average [Ca2+]i increase is an important quantity in the distinction of nonfunctional from functional signals.
In Fig. 7 D the average [Ca2+]i increase from minutes 1–10 is plotted against the minimal oscillation frequency for all time series. It is apparent that the distribution of the average calcium mobilization data is more compact in the absence of specific peptides than in the cases of low and high specific peptide concentration. Furthermore, the data display only a marginal overlap with the average [Ca2+]i increase associated with the high specific peptide concentration. This small overlap shows that a threshold mechanism working on the level of the average [Ca2+]i can give a good data separation of the nonfunctional data from the functional data. This is supported by the NF-AT and NF-κB gene expression data obtained by the clamp experiments (Dolmetsch et al., 1998), which demonstrate a threshold-like behavior where, below a steady-state [Ca2+]i of ∼100 nM, virtually no expression of the NF-AT and NF-κB genes is detected.
A striking property of the time-series data illustrated by Fig. 7 D is the lack of a clear correlation between the lowest oscillation frequency exhibited by a pattern and its average [Ca2+]i. This lack of a correlation between signaling frequencies and average [Ca2+]i suggests that the observed oscillations are not due to a deterministic feedback mechanism between calcium release from cell internal stores and calcium release-activated channels, inasmuch as these models typically suggest a deterministic relation between average level and oscillation frequency (De Young and Keizer, 1992).
DISCUSSION
Our analysis of physiologically derived [Ca2+]i patterns provides strong evidence in favor of the hypothesis that specificity for the activation of particular biological functions is encoded in intracellular signals by the means of the signal level and the signal autocorrelation. We find that signal autocorrelations can be used to distinguish functional signals according to their associated cytokine production. Furthermore, we find that the signal level plays an important role in the distinction of nonfunctional from functional signals. The autocorrelations of a signal are a measure for the frequencies contained in the time series, holding information equivalent to the power spectrum but emphasizing different aspects of the data. The power spectrum emphasizes dominant frequencies of the signal whereas signal memory is emphasized by the autocorrelation.
Thus, our analysis of a phenomenologically derived [Ca2+]i time series indirectly confirms earlier studies that demonstrated, by using clamp induction of oscillatory [Ca2+]i patterns, that the activation of transcription factors regulating IL-2 production such as NF-AT and NF-κB is dependent upon oscillation frequency and signal level (Dolmetsch et al., 1998). These findings are congruent with the fact that the two specific peptide concentrations used in our study induce [Ca2+]i patterns with pronounced differences in their spectra (i.e., autocorrelation functions), and with very different levels of IFN-γ production (also regulated by NF-AT and NF-κB).
A question naturally linked with the encoding of specific information in intracellular signals is how the molecular signaling machinery processes these signals in order to perform an adequate decoding. How do signaling and gene expression dynamics convert a specific signal into a particular molecular response? Our analysis gives a hint about which properties of signaling and gene expression dynamics may be central to the decoding process. Mathematical modeling of simple signal transduction cascades often uses linear signaling cascade steps, whose kinetic parameters determine signal stretching and propagation speed (Heinrich et al., 2002). Linear cascades yield no changes in the fundamental statistics of the signal as long as they do not saturate. As such, a branching and subsequent rejoining of a signaling cascade might constitute a natural time-lagging mechanism, and competition of two differentially controlled factors at the joining of the cascade can constitute a differencing/ratioing of the signal. This mechanism would provide a mechanistic cellular analog for our detrending procedure. Subsequent frequency decoding might be performed by a biochemical frequency filter. These considerations are in accord with the biology of the TCR-associated signaling cascade. TCR-mediated signaling involving a sustained increase of [Ca2+]i results in the activation of NF-AT, NF-κB, and AP-1 (Isakov and Altman, 2002); the three transcription factors bind to the IFN-γ promoter. This implies that the absolute and relative concentrations of all three transcription factors have an effect on the production of IFN-γ. It has also been demonstrated that NF-AT has a rapid shuttling dynamics in response to calcium signals (Timmerman et al., 1996). Thus, it can be hypothesized that the NF-AT/NF-κB dynamics, for example, can provide a detrended correlation/frequency analysis of the time series, whereas AP-1 might measure the signal level.
Furthermore, we were able to probe the calcium mobilization patterns by means of mathematical data analysis yielding the identification of signaling-associated fluctuations. Thus we were able to demonstrate that, besides the average [Ca2+]i mobilization, the fine structure of the signal is also directly dependent on the pMHC-TCR interaction. An immediate immunological relevance of this finding lies in the fact that it provides a new tool of probing pMHC-TCR interactions. For example, it would be very interesting to use our analysis for the measurement of signaling-associated fluctuations for various peptides in relation to the ability of the peptide to activate the T-cell. Moreover, systematic measurements of the dependence of signal-associated fluctuations on the peptide concentrations could yield further insights into the TCR-triggering statistics.
Signaling-induced loss of signaling components via downregulation and degradation is an intrinsic property of TCR-mediated signaling under physiological conditions. This loss of signaling components means that the [Ca2 +]i patterns are, in principle, non-stationary. However, the non-stationarity is not very pronounced in the first few minutes of signaling, since the local loss of signaling components is countered by transport of new signaling components to the cell-cell contact area (Favier et al., 2001). In this study, a linear trend was removed from the time series; following this, they were treated as pseudo-stationary. Nonetheless, our previous work (Faroudi et al., 2003) has shown that the [Ca2+]i time series exhibit, in addition to the dominant linear decline, a detectable second-order non-stationarity. This means that analyzing longer signaling patterns has to take this non-stationarity into account. A fascinating possibility of analyzing signal non-stationarity would be the tracking of TCR downregulation via the change in signaling fluctuations. It would also be interesting to study possible changes in signal correlations and their effect on data classification via the autocorrelation function. Another intriguing aspect and source of signal non-stationarity is the molecular context of TCR triggering events, since the immunological synapse that determines this molecular context is a dynamic entity. However, reliable results on the exact influence of each of these aspects and their temporal evolution require long time-series with an improved temporal resolution.
In conclusion, the results of our data analysis indicate that the overall level of signaling activity is only one component involved in the information transfer from the APC to the T-cell. Our analysis implies that the oscillation frequencies and damping times of [Ca2+]i patterns contribute, under physiological conditions, to the encoding of information leading to the specific activation of IFN-γ production.
Acknowledgments
The authors thank Thomas Höfer, Alexander Morton, David Rand, and Hugo van den Berg for critical comments and helpful discussions.
This work was supported by grants from la Ligue Contre le Cancer “Equipe Labelisee 2001.” C.U. was supported by a Marie Curie Individual Fellowship (No. HPMT-CT-2002-01541).
APPENDIX 1: DATA DETRENDING
Most of the results presented in this article were obtained after detrending of each time series. A linear trend in the data of the form
 |
(5) |
is usually removed by using time-delayed differences of the time series
 |
(6) |
where a is the average linear trend of the time series. This is obtained by regression analysis of the [Ca2+]i patterns for each of the two peptide concentrations. This means that a is the average trend in a temporal and ensemble sense. It should be pointed out that detrending by lagged differences does not require any input parameters; however, the quantitative evaluation of results requires an estimate of the average trend a. Consequently, in comparing the data analysis results of the two data sets we use the linear trend ah = 8.4 nM/min (high specific peptide concentration) and al = 4.8 nM/min (low specific peptide concentration) for all the time series of one data set.
If the condition b ≫ a holds, a linear detrending can also be achieved by working with the time-delayed ratios,
 |
(7) |
where a and b are the slope and intersection of the line obtained by linear regression analysis of the [Ca2+]i patterns for each of the two peptide concentrations. Both detrending methods yield nearly identical results. As discussed in the main text, this study uses these detrending schemes as opposed to smooth-line-fitting because it is easier to envisage them being realized by molecular mechanisms on the cell level.
APPENDIX 2: SPECTRA OF DETRENDED TIME SERIES
Using the relation cos(x) − cos(y) = − 2 sin((x + y)/2) sin((x − y)/2), we find that
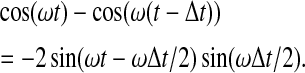 |
(8) |
Thus, detrending leads to a phase shift and an amplitude modulation of each cosine and sine wave contained in the signal. In general, the original spectrum  and the spectrum of the detrended time series are related by the factor (1 − exp(iωΔt)).
APPENDIX 3: AR MODELING
In our study, each time series is individually fitted by an AR model using the Yule-Walker method. The Akaike Information Criterion (AIC) (Akaike, 1974) is used for model order selection: for each time series, AR models of order p = 1.20 are fitted and the resulting AIC is computed. The model with smallest AIC is chosen for fitting the particular time series (Venables and Ripley, 2002). This approach for AR-modeling was chosen instead of treating all the time series of one set as one multivariate time series which is then fitted by a multivariate AR model, inasmuch as the individual approach does accommodate the profound data variability discussed in Description of the Data Sets, above. Such an approach of fitting each time series by application of the AIC for order selection results in a variation of the fitting orders of the time series. The AR models obtained for the detrended time series (using lagged differences) induced by a high peptide concentration have an order range from 0 to 8, with an average order of  and the orders of AR models corresponding to the low specific peptide concentration range from 0 to 13, with an average order of
  Similar results are obtained for the two sets of time series obtained by detrending with lagged ratios.
APPENDIX 4: SIGNALING CONTRIBUTIONS
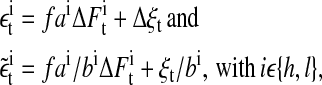
The measured time-series Mt contains fluctuations ξt originating from the measurement process
 |
(9) |
as well as fluctuations that have their origin in the signaling process. Assuming that the major contributions to the calcium mobilization comes from signaling, we can deduce that
 |
(10) |
Furthermore, we use  and
and  with i ε {h, l}, where ai is the average linear trend of the data set of time series induced either by the high (ah) or the low (al) specific peptide concentration, and f is a proportionality factor that converts the decrease of [Ca2+]i over time into an decrease of [Ca2+]i over the loss of signaling events. The basic assumption underlying the use of a linear relation is that the temporal decrease of calcium is directly driven by the temporal decrease of signaling events. We obtain for detrending by time-delayed differences
 |
(11) |
Analogously detrending by time-delayed ratios yields
 |
(12) |
Using these results and Eq. 1, the detrended time series can be written as
 |
(13) |
where ah (or, respectively, al) denotes the average linear trend of the set of high (or, respectively, low) specific peptide concentration-induced time series; ξt stands for the measurement noise; and ΔSt denotes the change in calcium stimulus between two subsequent time steps (i.e., S is a differentiable function of signaling events). Supposing that the signal S is a linear combination of a part C containing the correlations and a random part F (ΔSt = ΔCt + ΔFt), yields the relation between signaling-associated noise F and the noise identified by AR modeling,
 |
(14) |
where  is the noise term obtained after AR fitting of the time series detrended by lagged differences and
  is the noise term obtained after AR fitting of the time series detrended by lagged ratios. Hence, the residuals
  can be interpreted as comprising measurement noise as well as the stochastic part of cellular signaling fluctuations weighted by ai and bi. These signaling-associated fluctuations contain fluctuations originating from pMHC-TCR interactions as well as signaling cascade fluctuations. The ratio between the signaling-associated fluctuations induced by the high and the low specific peptide concentration is given by
 |
(15) |
where we use  and
and 
Analyzing the quantile-quantile plot of the cumulative residuals (data not shown) we find that the residuals contain heavy tails—i.e., large data fluctuations are not normally distributed. This deviation of large fluctuations from the normal distribution is, in our view, a detrending artifact, since sudden jumps in the time series will lead to the occurrence of large fluctuations. However, the fact that for each data set and for both detrending schemes, between 80% and 90% of the data are normally distributed, demonstrates that our choice of detrending schemes is reasonable.
APPENDIX 5: MULTIDIMENSIONAL SCALING
The first 10 points of the autocorrelation function are used to characterize each detrended time series. The aim is to study the variability of oscillation periods and damping times among the two sets of time series. The vector containing the 10 values is a representative of the time series that yields a multivariate distribution of data points in a high dimensional space. Spatial proximity in this space implies relatedness via the autocorrelation (structures such as clusters are often used for data classification).
We use a multidimensional scaling of the data so that distances in the resulting low-dimensional data representation also reflect the distances in the original data configuration. A good low-dimensional representation of the data exhibiting small stress depends generally on the choice of the target space dimension; not all multivariate data sets are well projected into two dimensions. It is found for the applications in this article that a projection into two dimensions puts too much stress onto the data, thus altering its structure. In contrast, projection dimensions of three and above have considerably less stress, thus retaining the essential distances of the data. The results presented are obtained by mapping the data onto four dimensions, giving a reasonable fit quality. Fig. 6, B and C, show representations of the four-dimensional configuration by two variables, of which one variable contains nearly all the variability among the autocorrelation functions of the data; i.e., this variable discriminates between the autocorrelation functions of the time-series data.
The results presented are obtained using detrending with lagged differences, but they are equally valid for detrending by lagged ratios. The results are also stable with respect to changes in the particular form of the multidimensional scaling; Sammon's nonlinear mapping (Sammon, 1969) and the nonmetric mapping proposed by Kruskal and Shepard (Cox and Cox, 2001) yield nearly identical results.
References
- Abbas, A. K., K. M. Murphy, and A. Sher. 1996. Functional diversity of helper T-lymphocytes. Nature. 383:787–793. [DOI] [PubMed] [Google Scholar]
- Akaike, H. 1974. A new look at statistical model identification. IEEE Trans. Automat. Contr. AU-19:716–722. [Google Scholar]
- Bromley, S. K., W. R. Burack, K. G. Johnson, K. Somersalo, T. N. Sims, C. Sumen, M. M. Davis, A. S. Shaw, P. M. Alle, and M. C. Dustin. 2001. The immunological synapse. Annu. Rev. Immunol. 19:375–396. [DOI] [PubMed] [Google Scholar]
- Burroughs, N. J., and C. Wülfing. 2002. Differential segregation in a cell-cell contact interface: the dynamics of the immunological synapse. Biophys. J. 83:1784–1796. [DOI] [PMC free article] [PubMed] [Google Scholar]
- Chan, C., A. J. George, and J. Stark. 2001. Cooperative enhancement of specificity in a lattice of T-cell receptors. Proc. Natl. Acad. Sci. USA. 98:5758–5763. [DOI] [PMC free article] [PubMed] [Google Scholar]
- Coombs, D., A. M. Kalergis, S. G. Nathenson, C. Wofsy, and B. Goldstein. 2002. Activated TCRs remain marked for internalization after dissociation from peptide-MHC. Nat. Immunol. 3:926–932. [DOI] [PubMed] [Google Scholar]
- Cox, T. F., and M. A. A. Cox. 2001. Multidimensional Scaling. Chapman & Hall/CRC, London, UK.
- De Young, G. W., and J. Keizer. 1992. A single pool IP3-receptor based model for agonist-stimulated Ca2+ oscillations. Proc. Natl. Acad. Sci. USA. 89:9895–9899. [DOI] [PMC free article] [PubMed] [Google Scholar]
- Dolmetsch, R. E., K. Xu, and R. S. Lewis. 1998. Calcium oscillations increase the efficiency and specificity of gene expression. Nature. 392:933–936. [DOI] [PubMed] [Google Scholar]
- Faroudi, M., C. Utzny, M. Salio, V. Cerundolo, M. Guiraud, S. Müller, and S. Valitutti. 2003. Lytic versus stimulatory synapse in CTL/target cell interaction: manifestation of a dual activation threshold. Proc. Natl. Acad. Sci. USA. 100:14145–14150. [DOI] [PMC free article] [PubMed] [Google Scholar]
- Favier, B., N. Burroughs, L. Weddeburn, and S. Valitutti. 2001. TCR dynamics on the surface of living T-cells. Int. Immunol. 13:1525–1532. [DOI] [PubMed] [Google Scholar]
- Feske, S., J. Giltnane, R. E. Dolmetsch, L. Staudt, and A. Rao. 2001. Gene regulation mediated by calcium signals in T-lymphocytes. Nat. Immunol. 2:316–324. [DOI] [PubMed] [Google Scholar]
- Germain, R. N. 1994. MHC-dependent antigen processing and peptide presentation: providing ligands for T-lymphocyte activation. Cell. 76:287–299. [DOI] [PubMed] [Google Scholar]
- Goldsmith, M. A., and A. Weiss. 1988. Early signal transduction by the antigen receptor without commitment of T-cell activation. Science. 240:1029–1031. [DOI] [PubMed] [Google Scholar]
- Hegger, R., H. Kantz, and T. Schreiber. 1999. Practical implementation of nonlinear time series methods: the TISEAN package. Chaos. 9:413–435. [DOI] [PubMed] [Google Scholar]
- Heinrich, R., B. Neel, and T. Rapoport. 2002. Mathematical models of protein kinase signal transduction. Mol. Cell. 9:957–970. [DOI] [PubMed] [Google Scholar]
- Höfer, T., H. Nathansen, M. Löhning, A. Radbruch, and R. Heinrich. 2002. GATA-3 transcriptional imprinting in TH2 lymphocytes: a mathematical model. Proc. Natl. Acad. Sci. USA. 99:9364–9368. [DOI] [PMC free article] [PubMed] [Google Scholar]
- Honerkamp, J. 1994. Stochastic Dynamical Systems: Concepts, Numerical Methods, Data Analysis. VCH, New York.
- Huber, P. J. 1981. Robust Statistics. Wiley, New York.
- Huppa, J. B., M. Gleimer, C. Sumen, and M. M. Davis. 2003. Continuous T-cell receptor signaling required for synapse maintenance and full effector potential. Nat. Immunol. 4:749–755. [DOI] [PubMed] [Google Scholar]
- Ihaka, R., and R. Gentleman. 1996. R: a language for data analysis and graphics. J. Comput. Graph. Stat. 5:299–314. [Google Scholar]
- Isakov, N., and A. Altman. 2002. Protein kinase Cθ in T-cell activation. Annu. Rev. Immunol. 20:761–794. [DOI] [PubMed] [Google Scholar]
- Janeway, C. A., and P. Travers. 1997. Immuno Biology. Current Biology Ltd., London, San Francisco, and New York.
- Lesk, A. M. 2002. Bioinformatics. Oxford University Press, Oxford, UK.
- Lollo, B., K. Chan, E. Hanson, V. Moy, and A. Brian. 1993. Direct evidence for two affinity states for lymphocyte function-associated antigen 1 on activated T-cells. J. Biol. Chem. 268:21693–21700. [PubMed] [Google Scholar]
- Meyer, T., and M. N. Teruel. 2003. Fluorescence imaging of signaling networks. Trends Cell Biol. 13:101–106. [DOI] [PubMed] [Google Scholar]
- Monks, C., B. Freiberg, H. Kupfer, N. Sciaky, and A. Kupfer. 1998. Three-dimensional segregation of supramolecular activation clusters in T-cells. Nature. 395:82–86. [DOI] [PubMed] [Google Scholar]
- Neumaier, A., and T. Schneider. 2001. Estimation of parameters and eigenmodes of multivariate autoregressive models. ACM Trans. Math. Software. 27:27–57. [Google Scholar]
- Perez, O. D., D. Mitchell, D. C. Jager, S. South, C. Murriel, J. McBride, L. A. Herzenberg, S. Kinoshita, and G. P. Nolan. 2003. Leukocyte functional antigen 1 lowers T-cell activation thresholds and signaling through cytohesin-1 and Jun-activating binding protein 1. Nat. Immunol. 4:1083–1092. [DOI] [PubMed] [Google Scholar]
- Porgador, A., J. Yewdell, Y. Deng, J. Bennink, and R. N. Germain. 1997. Localization, quantitation and in situ detection of specific peptide-MHC class I complexes using a monoclonal antibody. Immunity. 6:715–726. [DOI] [PubMed] [Google Scholar]
- Qi, S. Y., J. T. Groves, and A. K. Chakraborty. 2001. Synaptic pattern formation during cellular recognition. Proc. Natl. Acad. Sci. USA. 98:6548–6553. [DOI] [PMC free article] [PubMed] [Google Scholar]
- Revy, P., M. Sospedra, B. Barbour, and A. Trautmann. 2001. Functional antigen-independent synapses formed between T-cells and dendritic cells. Nat. Immunol. 2:925–931. [DOI] [PubMed] [Google Scholar]
- Sammon, J. W. 1969. A non-linear mapping for data structure analysis. IEEE Trans. Comput. C-18:401–409. [Google Scholar]
- Timmerman, L. A., N. A. Clipstone, S. N. Ho, J. P. Northrop, and G. R. Crabtree. 1996. Rapid shuttling of NF-AT in discrimination of Ca2+ signals and immunosuppression. Nature. 383:837–840. [DOI] [PubMed] [Google Scholar]
- Valitutti, S., S. Mueller, M. Cella, E. Padovan, and A. Lanzavechia. 1995. Serial triggering of many T-cell receptors by a few peptide-MHC complexes. Nature. 375:148–151. [DOI] [PubMed] [Google Scholar]
- Valitutti, S., S. Müller, M. Dessing, and A. Lanzavecchia. 1996. Different responses are elicited in cytotoxic T-lymphocytes by different levels of T-cell receptor occupancy. J. Exp. Med. 183:1917–1921. [DOI] [PMC free article] [PubMed] [Google Scholar]
- Venables, W. N., and R. D. Ripley. 2002. Modern Applied Statistics with S. Springer, Berlin, Germany.
- Wofsy, C., D. Coombs, and B. Goldstein. 2001. Calculations show substantial serial engagement of T-cell receptors. Biophys. J. 80:606–612. [DOI] [PMC free article] [PubMed] [Google Scholar]
- Wolpert, L., R. Beddington, J. Brockes, T. Jessel, P. Lawrence, and E. Meyerowitz. 1998. Principles of Development. Oxford University Press, Oxford, UK.