Abstract
In the accompanying article, we compared main functional properties of the three mammalian inositol 1,4,5-trisphosphate receptors (InsP3R) isoforms. In this article we focused on modulation of mammalian InsP3R isoforms by cytosolic Ca2+. We found that: 1), when recorded in the presence of 2 μM InsP3 and 0.5 mM ATP all three mammalian InsP3R isoforms display bell-shaped Ca2+ dependence in physiological range of Ca2+ concentrations (pCa 8–5); 2), in the same experimental conditions InsP3R3 is most sensitive to modulation by Ca2+ (peak at 107 nM Ca2+), followed by InsP3R2 (peak at 154 nM Ca2+), and then by InsP3R1 (peak at 257 nM Ca2+); 3), increase in ATP concentration to 5 mM had no significant effect of Ca2+ dependence of InsP3R1 and InsP3R2; 4), increase in ATP concentration to 5 mM converted Ca2+ dependence of InsP3R3 from “narrow” shape to “square” shape; 5), ATP-induced change in the shape of InsP3R3 Ca2+ dependence was mainly due to an >200-fold reduction in the apparent affinity of the Ca2+-inhibitory site; 6), the apparent Ca2+ affinity of the Ca2+ sensor region (Cas) determined in biochemical experiments is equal to 0.23 μM Ca2+ for RT1-Cas, 0.16 μM Ca2+ for RT2-Cas, and 0.10 μM Ca2+ for RT3-Cas; and 7), Ca2+ sensitivity of InsP3R1 and InsP3R3 isoforms recorded in the presence of 2 μM InsP3 and 0.5 mM ATP or 2 μM InsP3 and 5 mM ATP can be exchanged by swapping their Cas regions. Obtained results provide novel information about functional properties of mammalian InsP3R isoforms and support the importance of the Ca2+ sensor region (Cas) in determining the sensitivity of InsP3R isoforms to modulation by Ca2+.
INTRODUCTION
The inositol (1,4,5)-triphosphate receptor (InsP3R) is an intracellular calcium (Ca2+) release channel that plays a key role in Ca2+ signaling in cells (Berridge, 1993). Three mammalian InsP3R isoforms—InsP3R type 1 (InsP3R1), InsP3R type 2 (InsP3R2), and InsP3R type 3 (InsP3R3)—are expressed in mammals (Furuichi et al., 1994), each with the unique expression pattern (Taylor et al., 1999). Modulation of InsP3R by cytosolic Ca2+ is one of the most fundamental InsP3R properties responsible for complex spatiotemporal aspects of Ca2+ signaling (Berridge, 1993). In the accompanying article (Tu et al., 2005), we used the planar lipid bilayer reconstitution technique to compare main functional properties (conductance, gating, InsP3 sensitivity, and modulation by ATP) of the recombinant rat InsP3R1, InsP3R2, and InsP3R3 expressed in Sf9 cells by baculoviral infection. In this article, we used the planar lipid bilayer reconstitution technique and biochemical experiments to compare modulation of mammalian InsP3R isoforms by cytosolic Ca2+. In our previous studies, we identified a putative Ca2+ sensor region (Cas) within a modulatory domain of InsP3R1 (Miyakawa et al., 2001; Tu et al., 2003). Here we show that the observed differences in Ca2+ sensitivity between mammalian InsP3R isoforms can be explained by isoform-specific differences in affinities of the Cas region for Ca2+. Our results provide information about Ca2+ modulation of three mammalian InsP3R isoforms and further support a role of the Ca2+ sensor region (Cas) in the InsP3R modulation by Ca2+.
MATERIAL AND METHODS
Generation of recombinant baculoviruses
The baculoviruses expressing rat InsP3R1 (RT1) and rat InsP3R3 (RT3) have been previously described (Maes et al., 2000; Tu et al., 2002). The generation of baculovirus encoding rat InsP3R2 (RT2) is described in the accompanying article (Tu et al., 2005). The RT1-V-3 and RT3-V-1 chimeric constructs in pFastBac1 vector (Invitrogen, Carlsbad, CA) were generated by PCR-mediated gene fusion and verified by sequencing. In RT1-V-3 construct amino acids E1932-L2312 of InsP3R1 were replaced with amino acids M1835-F2242 of InsP3R3; in RT3-V-1 construct amino acids M1835-F2242 of InsP3R3 were replaced with amino acids E1932-L2312 of InsP3R1. The RT1-V-3 and RT3-V-1 baculoviruses were generated and amplified using Bac-to-Bac system according to the manufacturer's (Invitrogen) instructions. Expression of RT1-V-3 and RT3-V-1 proteins in Sf9 cells was confirmed by Western blotting with rabbit polyclonal anti-InsP3R1 antibody T443 described previously (Kaznacheyeva et al., 1998) and the affinity purified rabbit polyclonal anti-InsP3R3 antibody (IB7124-AP) described in the accompanying article (Tu et al., 2005).
Expression of InsP3R in Sf9 cells and planar lipid bilayer experiments
RT1, RT2, RT3 isoforms, RT1-V-3, and RT3-V-1 chimeras were expressed in Sf9 cells and reconstituted into planar lipid bilayers as described in the accompanying article (Tu et al., 2005). Single-channel analysis of currents supported by RT1-V-3 and RT3-V-1 chimeras was performed as described for RT1, RT2, and RT3 isoforms in the accompanying article (Tu et al., 2005). Ca2+ dependence of InsP3R isoforms and chimeras was determined as described in Bezprozvanny et al. (1991) by consecutive additions CaCl2 to the cis (cytosolic) chamber from the concentrated 20 mM CaCl2 stock with at least 30 s stirring of solutions in both chambers. Calcium concentration in 20 mM CaCl2 stock solution was verified by atomic absorption spectroscopy (Galbraith Laboratories, Knoxville, TN). Free Ca2+ concentration in the cis chamber was controlled in the range from 10 nM Ca2+ (pCa 8) to 100 μM Ca2+ (pCa 4) by the mixture of 1 mM EGTA, 1 mM HEDTA, and variable concentrations of CaCl2 and calculated by using a program described in Fabiato (1988). Evidence for the presence of multiple channels in the bilayer (multiple open levels) was obtained in the majority of the experiments. The single-channel open probability (Po) was estimated from multichannel records and normalized to the maximum Po observed in the same experiment as described for InsP3- and ATP-dependence experiments in the accompanying article (Tu et al., 2005). The normalized data from several experiments with each InsP3R isoform or chimera were averaged together for presentation and fitting as described for InsP3- and ATP-dependence experiments in the accompanying article (Tu et al., 2005).
To obtain parameters of Ca2+ dependence the normalized and averaged data were fit by the “bell-shaped equation”:
 |
(1) |
modified from Bezprozvanny et al. (1991), where Pm is a parameter proportional to the maximal normalized Po value, n is the Hill coefficient, KCa is the apparent affinity of the Ca2+-activating site, and kCa is the apparent affinity of the Ca2+-inhibitory site. As explained in Tu et al. (2003), parameter Pm is equal to maximal normalized Po only in the case when kCa = KCa. If kCa ≠ KCa, parameter Po is proportional (and higher) than maximal Po.
To obtain parameters of Ca2+ dependence of InsP3R3 and RT1-V-3 at 5 mM ATP, the normalized and averaged data were fit by the “biphasic Hill equation”:
 |
(2) |
modified from Mak et al. (1998), where Pm is a parameter proportional to the maximal normalized Po value, Ha is the Hill coefficient of the activation phase, KCa is the apparent affinity of the Ca2+-activating site, Hi is the Hill coefficient of the inhibitory phase, and kCa is the apparent affinity of the Ca2+-inhibitory site.
The fits using Eqs. 1 and 2 were generated using least-squares routine (Sigma Plot 2001, Jandel Scientific) and the quality of the fit was evaluated from the coefficient of determination (R2). The standard errors of resulting parameters were obtained as the estimates of the uncertainties in the values of regression coefficients obtained as a result of the fitting procedure (Sigma Plot 2001, Jandel Scientific, San Rafael, CA).
Ca2+ binding assay
RT1-Cas (E1932-R2270 of rat InsP3R1) expression construct in pGEX-KG expression vector (Amersham-Pharmacia Biotech, Uppsala, Sweden) was previously described (Tu et al., 2003). RT2-Cas (E1884-R2224 of rat InsP3R2) and RT3-Cas (M1835-R2199 of rat InsP3R3) regions were amplified by polymerase chain reaction (PCR) and subcloned into pGEX-KG vector. RT1-Cas, RT2-Cas, and RT3-Cas proteins were expressed in BL21 bacteria, purified on glutathione-sepharose 4B beads (Amersham-Pharmacia Biotech), and cleaved from glutathione S-transferase (GST) by thrombin as previously described for RT1-Cas (Tu et al., 2003). Obtained proteins were used immediately in intrinsic tryptophan fluorescence spectroscopy measurements performed as previously described for RT1-Cas (Tu et al., 2003). Briefly, a quartz cuvette containing 2 ml of recombinant proteins at 80 μg/ml in cis recording buffer (110 mM Tris dissolved in HEPES, pH 7.35) was supplemented with 1 mM EGTA and 1 mM HEDTA (pH 7.35). The free Ca2+ concentration in the cuvette was adjusted in the range pCa 9.4–2 by consecutive additions of calibrated CaCl2 stock solutions (20 mM CaCl2, 100 mM CaCl2, and 1 M CaCl2) with constant stirring. The free Ca2+ concentration in the cuvette was calculated using MaxChelator (http://www.stanford.edu/∼cpatton/maxc.html). Intrinsic tryptophan fluorescence was excitated by 280 nm (2-nm-slit width) light (DeltaRAM, Photon Technology International, Lawrenceville, NJ) and emission spectra were collected at room temperature in the 290–500-nm range with a 2-nm step size. The experiments were controlled and analyzed by Felix software package (Photon Technology International).
The absolute peak tryptophan fluorescence values at each Ca2+ concentration F(Ca2+) were determined from the generated emission spectra. The measured peak fluorescence values were corrected for dilution Fcor (Ca2+) = F0/(1 + v/V), where Fcor (Ca2+) is dilution-corrected peak fluorescence value, F0 is the peak fluorescence value with no CaCl2 added (pCa 9.4), v is the total volume of CaCl2 added, and V is the starting solution volume in the cuvette (2 ml). The difference between measured and dilution-corrected peak tryptophan fluorescence values ΔF (Ca2+) = F(Ca2+) − Fcor (Ca2+) was taken as a measure of Ca2+-induced conformational changes in RT1-Cas, RT2-Cas, and RT3-Cas recombinant proteins (Tu et al., 2003; Ward, 1985). The ΔF values at each Ca2+ concentration were normalized to the maximal ΔF value (ΔFmax) measured at pCa 2.0 in the same experiment. The normalized ΔF values from three independent experiments for each recombinant protein were averaged together at each Ca2+ concentration for presentation and fitting. The Ca2+ dependence of the normalized and averaged ΔF values was fit using equation
 |
(3) |
from Tu et al. (2003), where [Ca2+] is the Ca2+ concentration in the cuvette, n is the Hill coefficient, and KCa is the apparent affinity for Ca2+. The fits were generated using least-squares routine (Sigma Plot 2001, Jandel Scientific), and the quality of the fit was evaluated from the coefficient of determination (R2). The standard errors of resulting KCa and n values were obtained as the estimates of the uncertainties in the values of regression coefficients obtained as a result of the fitting procedure (Sigma Plot 2001, Jandel Scientific).
RESULTS
Modulation of mammalian InsP3R isoforms by Ca2+
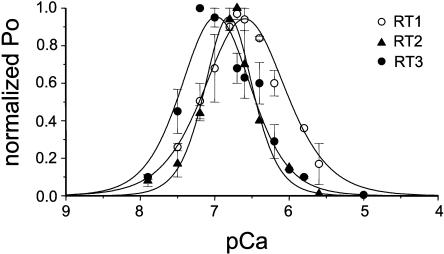
In the accompanying article (Tu et al., 2005), we compared main functional properties (conductance, gating, InsP3 sensitivity, and modulation by ATP) of the recombinant rat InsP3R1, InsP3R2, and InsP3R3 expressed in Sf9 cells by baculoviral infection and reconstituted into planar lipid bilayers. Modulation of InsP3R by cytosolic Ca2+ is one of the most fundamental InsP3R properties responsible for complex spatiotemporal aspects of Ca2+ signaling (Berridge, 1993). Does cytosolic Ca2+ affect InsP3R function in an isoform-specific manner? To answer this question we determined Ca2+ dependence of recombinant InsP3R1, InsP3R2, and InsP3R3 in the presence of 2 μM InsP3 and 0.5 mM ATP. Because most of the experiments resulted in multichannel bilayers, the Po values in each experiment were normalized to the maximal Po in the same experiment as described in Materials and Methods, and the normalized data from different experiments with each InsP3R isoform were averaged together for presentation and analysis. In agreement with our previous findings (Nosyreva et al., 2002; Tu et al., 2002, 2003), InsP3R1 expressed in Sf9 cells (RT1) display bell-shaped Ca2+ dependence with the peak at 257 nM Ca2+ (Fig. 1, open circles). Fit to the RT1 Ca2+ dependence using Eq. 1 (Fig. 1, curve; R2 = 0.99) yielded apparent affinities of activating (KCa) and inhibitory (kCa) sites equal to 0.17 ± 0.03 μM Ca2+ and 0.37 ± 0.01 μM Ca2+, respectively (Table 1). Similar to RT1, RT2 and RT3 also displayed bell-shaped Ca2+ dependence in the physiological range of Ca2+ concentrations (pCa 8–5). The peak of bell-shaped Ca2+ dependence was located at 154 nM Ca2+ for RT2 (Fig. 1, solid triangles), and at 107 nM Ca2+ for RT3 (Fig. 1, solid circles). Fit to the RT2 and RT3 Ca2+ dependence using Eq. 1 (Fig. 1, curves; R2 = 0.98 for RT2 and R2 = 0.94 for RT3) yielded the apparent affinities of the activating and inhibitory sites equal to 0.15 ± 0.04 μM Ca2+ and 0.16 ± 0.04 μM Ca2+ for RT2, and 0.06 ± 0.03 μM Ca2+ and 0.17 ± 0.02 μM Ca2+ for RT3, respectively (Table 1).
FIGURE 1.
Ca2+ dependence of mammalian InsP3R isoforms. The single-channel open probability (Po) for each InsP3R isoform was measured as a function of cytosolic Ca2+ concentrations from 10 nM to 5 μM Ca2+ on the cis (cytoplasmic) side of the membrane in the presence of 2 μM InsP3 and 0.5 mM Na2ATP. The normalized and averaged data (see Materials and Methods) at each Ca2+ concentration are shown as means ± SE (n ≥ 3) for RT1 (○), RT2 (▴), RT3 (•). These data were fitted by Eq. 1 (see Materials and Methods). The parameters of the best fit (curves) are in Table 1.
TABLE 1.
Ca2+ dependence of mammalian InsP3R isoforms and Ca2+ sensor swap chimeras
| Ca2+ dependence
|
Ca2+ binding
|
||||||
|---|---|---|---|---|---|---|---|
| InsP3R | ATP (mM) | Activation KCa (μM) | Inhibition kCa (μM) | Hill coefficient nHill | Peak (nM Ca2+) | KCa (μM) | Hill coefficient nHill |
| RT1 | 0.5 | 0.17 ± 0.03 | 0.37 ± 0.01 | 1.23 | 257 | 0.23 ± 0.04 | 0.47 |
| RT2 | 0.5 | 0.15 ± 0.04 | 0.16 ± 0.04 | 2.05 | 154 | 0.16 ± 0.06 | 0.37 |
| RT3 | 0.5 | 0.06 ± 0.03 | 0.17 ± 0.02 | 1.46 | 107 | 0.10 ± 0.04 | 0.39 |
| 5 | 0.029 ± 0.004 | 37 ± 6 | 1.80 (Ha) 1.17 (Hi) | 100–10,000 | |||
| RT1-V-3 | 0.5 | 0.06 ± 0.02 | 0.16 ± 0.01 | 2.17 | 100 | RT3 | RT3 |
| 5 | 0.04 ± 0.003 | 33 ± 5 | 4.0 (Ha) 1.8 (Hi) | 100–10,000 | |||
| RT3-V-1 | 0.5 | 0.24 ± 0.01 | 0.25 ± 0.02 | 1.65 | 239 | RT1
|
RT1
|
| 5 | 0.28 ± 0.03 | 0.31 ± 0.04 | 0.94 | 310 | |||
Entries in the “Ca2+ binding” columns for RT1-V-3 and RT3-V-1 chimeras are used to indicate the “parental” InsP3R isoform for the Cas region in each chimera. Both Ha and Hi values (see Eq. 2) are entered in the nHill column for RT3 Ca2+ dependence at 5 mM ATP.
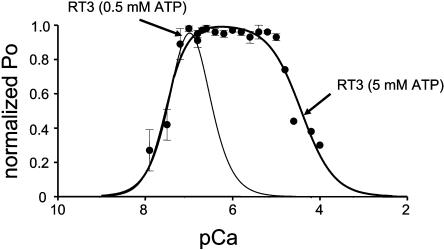
As described in the accompanying article (Tu et al., 2005), 5 mM concentration of ATP is required to maximally activate RT3 channels. Thus, in the next series of experiments we determined Ca2+ dependence of RT3 in the presence of 2 μM InsP3 and 5 mM ATP. We found that in the presence of 5 mM ATP, RT3 displayed a “square-shaped” Ca2+ dependence with the maximal channel activity observed in the range of Ca2+ concentrations between 0.1 μM Ca2+ and 10 μM Ca2+ (pCa 7–5) (Fig. 2, solid circles). The “square-shaped” Ca2+ dependence observed in this condition is similar to “square-shaped” Ca2+ dependence described for Xenopus InsP3R (InsP3R1) (Mak et al., 1998) and rat InsP3R3 expressed in Xenopus oocytes (Mak et al., 2001b). Thus, to fit these data we used “biphasic Hill equation” (Eq. 2) adapted from Mak et al. (1998). Fit to RT3 Ca2+-dependence data using Eq. 2 (Fig. 2, thick curve; R2 = 0.93) yielded apparent affinities of activating and inhibitory sites equal to 0.029 ± 0.004 μM Ca2+ and 37 ± 6 μM Ca2+ (Table 1). Thus, increase in ATP concentration to 5 mM had only a twofold effect on the apparent affinity of the Ca2+-activating site of InsP3R3, but resulted in a >200-fold reduction in the apparent affinity of the Ca2+-inhibitory site of InsP3R3 (Table 1). In contrast to InsP3R3 (Fig. 2), we found that the Ca2+ dependence of InsP3R1 and InsP3R2 was not significantly different at 0.5 mM ATP and at 5 mM ATP (data not shown).
FIGURE 2.
Ca2+ dependence of InsP3R3 isoform at 5 mM ATP. The single-channel open probability (Po) for InsP3R3 (RT3) was measured as a function of cytosolic Ca2+ concentrations from 10 nM to 100 μM Ca2+ on the cis (cytoplasmic) side of the membrane in the presence of 2 μM InsP3 and 5 mM Na2ATP. The normalized and averaged data (see Materials and Methods) at each Ca2+ concentration are shown as means ± SE (n ≥ 3) (•). These data were fit by Eq. 2 (see Materials and Methods). The parameters of the best fit (thick line) are in Table 1. The fit to the RT3 Ca2+ dependence in the presence of 2 μM InsP3 and 0.5 mM Na2ATP (thin line) is from Fig 1.
Ca2+ binding to InsP3R Ca2+ sensor
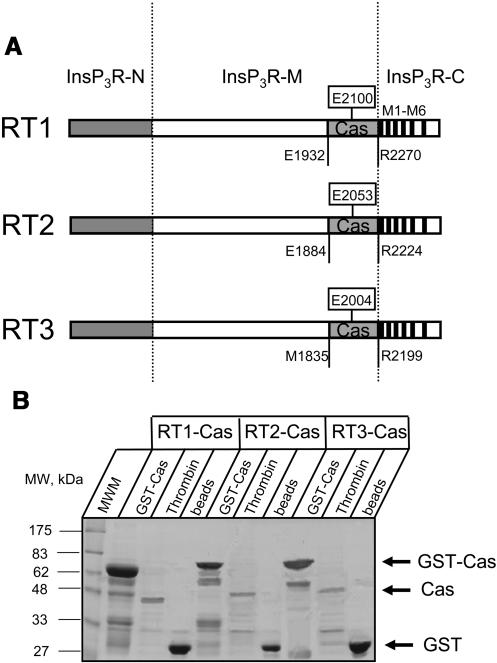
Different Ca2+ sensitivity of InsP3R1, InsP3R2, and InsP3R3 has been observed in our experiments performed at 2 μM InsP3 and 0.5 mM ATP (Fig. 1; Table 1). We previously proposed that the putative Ca2+ sensor region (Cas) in the coupling domain of InsP3R1 is responsible for InsP3R1 modulation by Ca2+ (Miyakawa et al., 2001; Tu et al., 2003). If “Ca2+ sensor hypothesis” is correct, then the differences in Ca2+ sensitivity between InsP3R isoforms should correlate with the differences in Ca2+ affinities of corresponding Cas regions. To test this prediction, we expressed in bacteria and purified RT1-Cas (E1932-R2270 of rat InsP3R1), RT2-Cas (E1884-R2224 of rat InsP3R2), and RT3-Cas (M1835-R2199 of rat InsP3R3) proteins (Fig. 3 A). Similar yield of RT-Cas proteins was obtained as a result of our expression and purification procedure for each InsP3R isoform (Fig. 3 B).
FIGURE 3.
Expression and purification of the putative Ca2+ sensor (Cas) regions of mammalian InsP3R isoforms. (A) Domain structure of the InsP3R isoforms (adapted from Furuichi et al., 1994). The boundaries of the amino-terminal InsP3 binding domain InsP3R-N, the carboxyl-terminal channel-forming domain InsP3R-C with transmembrane domains M1–M6, and the middle coupling domain InsP3R-M are indicated. The putative InsP3R Ca2+ sensor region (Cas) is shown for InsP3R1 (E1932-R2270), InsP3R2 (E1884-R2224), and InsP3R3 (M1835-R2199). (B) Expression and purification of the putative Ca2+ sensor (Cas) regions of mammalian InsP3R isoforms. Samples of GST-Cas attached to glutathione beads (GST-Cas), Cas proteins released by thrombin cleavage (Thrombin), and glutathione beads after thrombin cleavage (beads) were analyzed by SDS-PAGE gel electrophoresis (10% polyacrylamide gel stained with Coomassie blue). The predicted molecular weight of GST-Cas (68 kDa), Cas (39 kDa), and GST (29 kDa) are indicated by the arrows. Total protein of 1/60 (GST-Cas and beads lanes) or 1/200 (Thrombin lanes) was loaded on the gel for RT1-Cas, RT2-Cas, and RT3-Cas.
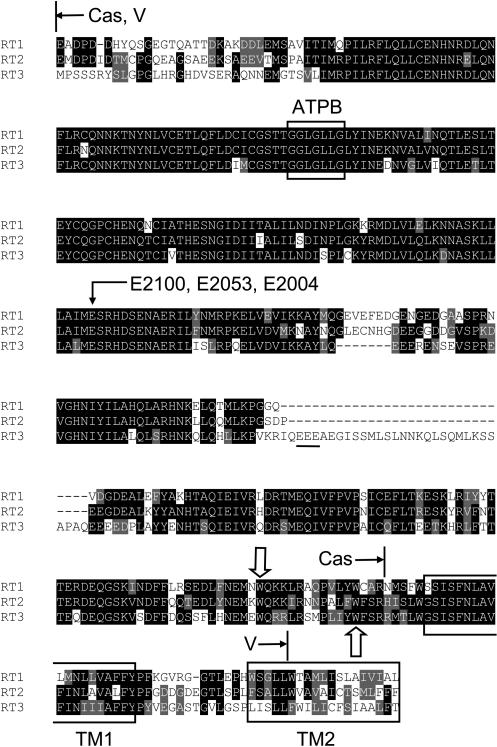
Sequence alignment of RT1-Cas, RT2-Cas, and RT3-Cas regions shows a high degree of sequence conservation (Fig. 4). The E2100 glutamate residue that we previously identified to be critical for InsP3R1 modulation by Ca2+ (Miyakawa et al., 2001; Tu et al., 2003) is conserved in InsP3R2 (E2053) and InsP3R3 (E2004) sequences (Fig. 4, arrow). In the previous study (Tu et al., 2003), we utilized intrinsic tryptophan fluorescence assay to compare Ca2+ binding affinity of RT1-Cas wild type and E2100 mutants. The W2255 and W2267 residues of InsP3R1 present within the RT1-Cas region (Fig. 4, open arrows) are conserved in InsP3R2 (W2209 and W2221) and in InsP3R3 (W2183 and W2195). For all three InsP3R isoforms, these are the only two tryptophan residues within Cas sequence (Fig. 4). Thus, we reasoned that intrinsic tryptophan fluorescence of RT2-Cas and RT3-Cas proteins is likely to be quenched in a Ca2+-dependent manner similar to our previous findings with RT1-Cas (Tu et al., 2003).
FIGURE 4.
Sequence alignment of InsP3R Cas regions. The fragment of rat InsP3R1 sequence (P29994, E1932-L2326) is aligned with the corresponding region of rat InsP3R2 (P29995, E1884-F2281) and rat InsP3R3 (Q63269, M1825-T2255). The amino-terminal boundary of the alignment (E1932 in InsP3R1) is chosen from the limited trypsin digestion pattern of InsP3R1 (Yoshikawa et al., 1999). The carboxy-terminal boundary of the alignment (L2326 in InsP3R1) corresponds to the end of the predicted second transmembrane domain (TM2). The boundaries of soluble RT-Cas constructs (Cas) and the domain swap boundaries in RT1-V-3 and RT3-V-1 chimeras (V) are shown. Also shown is the ATPB binding site (2015GGLGLLG2021 in InsP3R1) (Maes et al., 2001), conserved glutamate residue (E2100 in InsP3R1) mutated in our previous studies of InsP3R1 Ca2+ sensor (Miyakawa et al., 2001; Tu et al., 2003), two conserved tryptophan residues (W2255 and W2267 in InsP3R1) present within the RT-Cas region, a unique EEE cluster in the RT3-Cas sequence, and predicted boundaries of the TM1 and TM2 transmembrane domains.
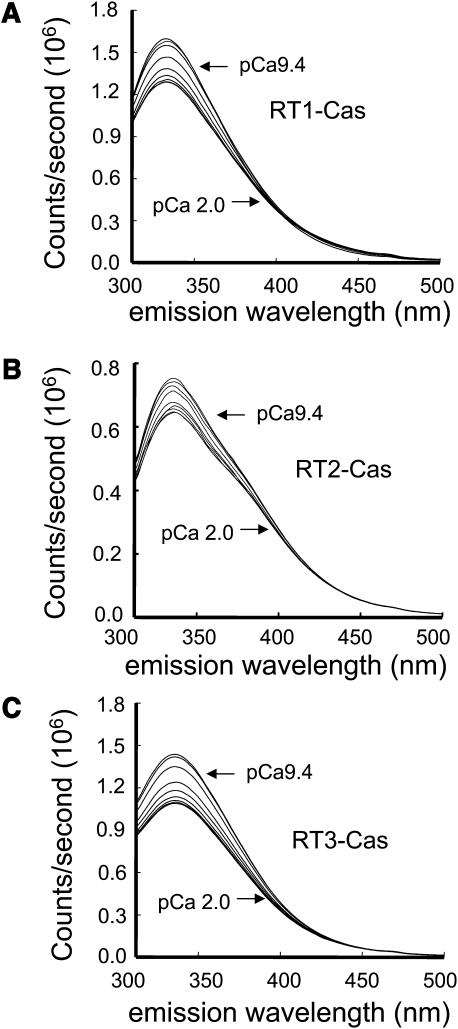
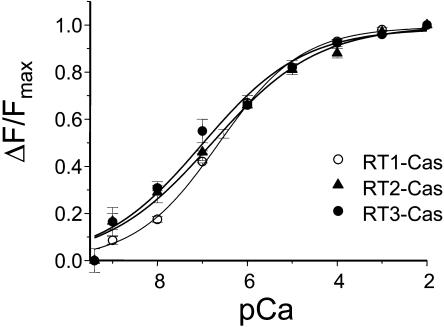
To test this hypothesis, we collected emission spectra (excitation at 280 nm) of RT1-Cas, RT2-Cas, and RT3-Cas proteins at different Ca2+ concentrations (pCa 9.4–2.0, buffered by 1 mM EGTA and 1 mM HEDTA). We found that the position of the emission peak (λmax) remained constant at 332 nm for all three RT-Cas proteins at all Ca2+ concentrations (Fig. 5, A–C). However, a systematic and saturable change in the intensity of the intrinsic fluorescent signal was observed for all three RT-Cas proteins as a function of Ca2+ (Fig. 5, A–C). To compare the data from different experiments, the observed changes in RT1-Cas, RT2-Cas, and RT3-Cas peak fluorescence intensity (ΔF) were corrected for dilution (see Materials and Methods), normalized to the maximal change in the peak fluorescence intensity (ΔFmax), averaged, and plotted against Ca2+ concentration (Fig. 6). By fitting the obtained results using Eq. 3 (see Materials and Methods) (Fig. 6, curves; R2 = 1.0 for RT1-Cas, R2 = 0.99 for RT2-Cas, and R2 = 0.98 for RT3-Cas), we determined that the apparent affinity for Ca2+ (KCa) is equal to 0.23 ± 0.04 μM for RT1-Cas, 0.16 ± 0.06 μM for RT2-Cas, and 0.10 ± 0.04 μM for RT3-Cas (Table 1). Obtained results are in quantitative agreement with the sensitivity of InsP3R isoforms to Ca2+ modulation determined in planar lipid bilayer experiments (Fig. 1; Table 1). For all three RT-Cas regions, the Hill coefficient (nHill) determined in Ca2+-binding experiments was in the range 0.4–0.5 (Fig. 6; Table 1). As discussed previously for RT1-Cas (Tu et al., 2003), an apparent negative cooperativity in association of RT-Cas regions with Ca2+ may be due to multimerization of recombinant proteins during our measurements or due to the presence of multiple Ca2+ binding sites within the RT-Cas regions.
FIGURE 5.
Intrinsic tryptophan fluorescence emission spectra of the InsP3R Ca2+ sensor region. Representative intrinsic tryptophan fluorescence emission spectra of RT1-Cas (A), RT2-Cas (B), and RT3-Cas (C) proteins at variable Ca2+ concentrations (pCa 9.4–2.0, as indicated). Similar results were obtained in at least three independent experiments with RT1-Cas, RT2-Cas, and RT3-Cas proteins.
FIGURE 6.
Ca2+ binding to the InsP3R Ca2+ sensor region. Dilution-corrected and normalized changes in the peak fluorescence intensity (ΔF/ΔFmax) were averaged together at each Ca2+ concentration (see Materials and Methods) and shown as means ± SE (n ≥ 3) for RT1-Cas (○), RT2-Cas (▴), and RT3-Cas (•). The data for each InsP3R isoform were fitted by Eq. 3 (see Materials and Methods). The parameters of the optimal fits (curves) are presented in Table 1.
Functional analysis of InsP3R Ca2+ sensor swap chimeras
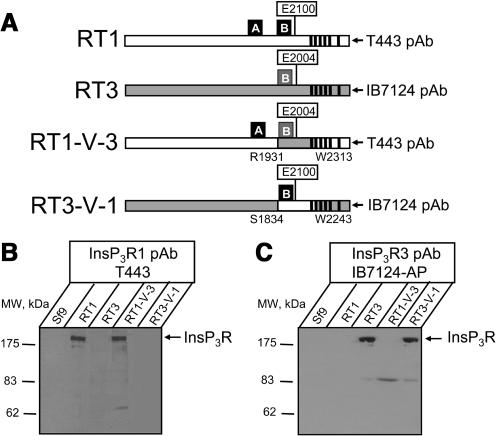
Is Cas region alone sufficient to determine InsP3R sensitivity to Ca2+? To answer this question and to further test the “Ca2+ sensor hypothesis” (Miyakawa et al., 2001; Tu et al., 2003), we generated chimeric RT1-V-3 and RT3-V-1 baculoviruses by swapping Cas-containing regions between InsP3R1 and InsP3R3 (Fig. 7 A). The regions swapped in RT1-V-3 and RT3-V-1 chimeras had the same amino-terminal boundary (E1932 in InsP3R1 and M1835 in InsP3R3) as the soluble RT1-Cas and RT3-Cas constructs expressed in bacteria (see Fig. 4). To simplify the construction, the swapped regions were 43 amino acids longer on carboxy-termini than the soluble RT1-Cas and RT3-Cas constructs (to the middle of the second predicted transmembrane domain, L2312 in InsP3R1 and F2242 of InsP3R3) (see Fig. 4). As discussed in the accompanying article (Tu et al., 2005), coupling domain of InsP3R1 contains high-affinity (ATPA) and low-affinity (ATPB) ATP-binding sites (Fig. 7 A). In contrast, coupling domain of InsP3R3 contains only low-affinity (ATPB) ATP-binding site (Fig. 7 A). Cas regions of InsP3R1 and InsP3R3 include corresponding ATPB sites in their sequence (Fig. 4). Thus, RT1-V-3 chimera contains the high-affinity ATPA site from InsP3R1 and the low-affinity ATPB site from InsP3R3 (Fig. 7 A). In contrast, RT3-V-1 chimera contains only the low-affinity ATPB site from InsP3R1 (Fig. 7 A). As discussed in the accompanying article (Tu et al., 2005), InsP3R1 and InsP3R3 differ dramatically in their sensitivity to ATP modulation. Thus, swapping Cas regions may affect not only Ca2+, but also ATP dependence of parental constructs. Expression of RT1-V-3 and RT3-V-1 proteins in Sf9 cells was confirmed by Western blotting with anti-InsP3R1 T443 antibodies (Fig. 7 B) and anti-InsP3R3 affinity purified IB7124 antibodies (Fig. 7 C). The epitopes for T443 antibodies (Kaznacheyeva et al., 1998) and IB7124 antibodies (Tu et al., 2005) are located at the carboxy-terminal ends of InsP3R1 and InsP3R3 sequences, which are not affected by swapping Cas-containing domains in RT1-V-3 and RT3-V-1 chimeras (Fig. 7 A).
FIGURE 7.
Expression of Ca2+ sensor swap chimeras. (A) The diagram of RT1, RT3, RT1-V-3, and RT3-V-1 constructs. In RT1-V-3 construct the putative InsP3R1 Cas region (E1932-L2312) was replaced by the Cas region of InsP3R3 (M1835-F2242; shaded). In RT3-V-1 construct the putative InsP3R3 Cas region (M1835-F2242) was replaced by the Cas region of InsP3R1 (E1932-L2312; open). Locations of E2100 residue in the InsP3R1 Cas sequence (Miyakawa et al., 2001; Tu et al., 2003) and the corresponding E2004 residue in the InsP3R3 sequence are shown. Also shown are locations of ATPA (1773GGGGGGPG1780 in InsP3R1) and ATPB (2015GGLGLLG2021 in InsP3R1 and 1919GGLGLLG1925 in InsP3R3) sites (Maes et al., 2001) and the epitopes for T443 (anti-InsP3R1) (Kaznacheyeva et al., 1998) and IB7124 (anti-InsP3R3) (Tu et al., 2005) polyclonal antibodies. (B and C) The microsomes isolated from noninfected Sf9 cells (Sf9), and from Sf9 cells infected with RT1, RT3, RT1-V-3, and RT3-V-1 baculoviruses were analyzed by Western blotting with anti-InsP3R1 polyclonal antibody T443 (B) and anti-InsP3R3 affinity purified polyclonal antibody IB7124-AP (C). For each microsomal preparation, 10 μg of total protein was loaded on the gel.
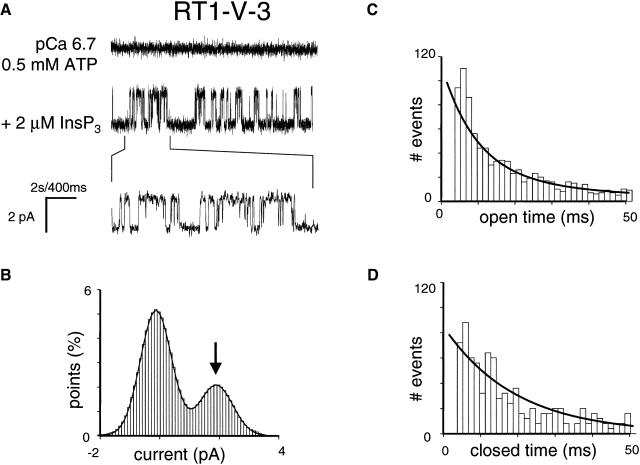
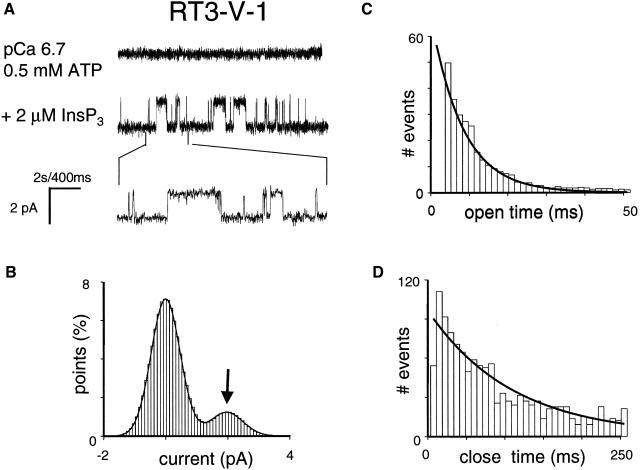
Recombinant RT1-V-3 and RT3-V-1 chimeric proteins formed functional InsP3-gated channels in planar lipid bilayers when recorded in standard recording conditions (pCa 6.7, 0.5 mM ATP, 2 μM InsP3) (Figs. 8 A and 9 A). The Gaussian fit to the amplitude histogram of currents supported by RT1-V-3 chimera (Fig. 8 B) resulted in the average unitary current amplitude of RT1-V-3 channels equal to 1.86 ± 0.06 pA (n = 3) and the mean Po of RT1-V-3 channels equal to 20 ± 4% (n = 3). The open and closed dwell time distributions of RT1-V-3 channels could be fit with a single exponential function (Fig. 8, C and D) that yielded the mean open time of RT1-V-3 channels equal to 7.8 ± 0.9 ms (n = 3) and the mean closed time of RT1-V-3 channels equal to 10 ± 1 ms (n = 3). The Gaussian fit to the amplitude histogram of currents supported by RT3-V-1 chimera (Fig. 9 B) yielded the average unitary current amplitude equal to 1.87 ± 0.06 pA (n = 3) and the mean Po equal to 8 ± 3% (n = 3). The open dwell time and closed dwell time distributions of RT3-V-1 currents were fit by a single exponential function (Fig. 9, C and D), resulting in the mean open time of RT3-V-1 channels equal to 8 ± 1 ms (n = 3) and the mean closed time equal to 83 ± 5 (n = 3). Thus, conductance and gating properties of RT1-V-3 and RT3-V-1 chimeric channels are similar to conductance and gating properties of wild-type InsP3R1 and InsP3R3 channels described in the accompanying article (Tu et al., 2005). Thus, we have not induced gross abnormalities in InsP3R gating and conductance properties by swapping Cas regions between InsP3R1 and InsP3R3.
FIGURE 8.
Functional properties of RT1-V-3 chimera. (A) Single-channel records of RT1-V-3 channels in planar lipid bilayers. The experiments were performed at pCa 6.7 in the presence of 0.5 mM ATP (control, top trace). Addition of 2 μM InsP3 to the cis (cytoplasmic) side activates RT1-V-3 channels (middle trace). Current traces at the expanded timescale are also shown (bottom trace). (B–D) Analysis of the single-channel records of RT1-V-3 channels was performed and analyzed as described for InsP3R1 in the accompanying article (Tu et al., 2005). The Gaussian peak corresponding to an open state of RT1-V-3 was centered at 1.89 pA, had σ = 0.56 pA, and area 28%. Open time distribution (C; number of events = 2200) was fitted with a single exponential function (curve) that yielded mean open time τ0 = 8.4 ms. Closed time distribution (D; number of events = 2200) was fitted with a single exponential function (curve) that yielded mean closed time τC = 9.8 ms. The data from the same experiment with a single active channel in the bilayer were used for panels A–D.
FIGURE 9.
Functional properties of RT3-V-1 chimera. (A) Single-channel records of RT3-V-1 channels in planar lipid bilayers. The experiments were performed at pCa 6.7 in the presence of 0.5 mM ATP (control, top trace). Addition of 2 μM InsP3 to the cis (cytoplasmic) side activates RT3-V-1 channels (middle trace). Current traces at the expanded timescale are also shown (bottom trace). (B–D) Analysis of the single-channel records of RT3-V-1 channels was performed and analyzed as described for InsP3R3 in the accompanying article (Tu et al., 2005). The Gaussian peak corresponding to an open state of RT3-V-1 was centered at 1.910 pA, had σ = 0.53 pA, and area 16%. Open and closed time distributions (C and D; number of events = 1000) were fitted with a single exponential function (curve) that yielded mean open time τ0 = 8.4 ms and mean closed time τC = 87.6 ms for RT3-V-1. The data from the same experiment with a single active channel in the bilayer were used for panels A–D.
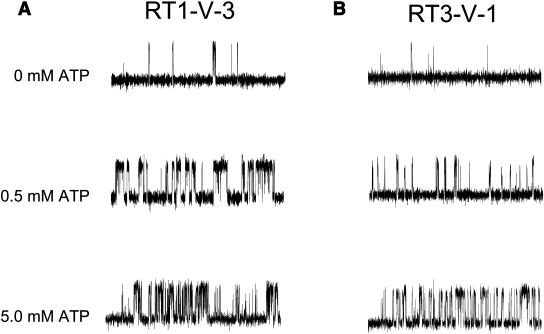
We reasoned that low open probability of RT3-V-1 channels when compared with RT1-V-3 channels in standard recording conditions may be due to lower sensitivity of these channels to ATP modulation, as described for RT3 channels relative to RT1 channels in the accompanying article (Tu et al., 2005). To test this hypothesis, we compared channel activity of RT1-V-3 and RT3-V-1 chimeras in the presence of 2 μM InsP3 at pCa 6.7 in the absence of ATP, at 0.5 mM ATP, and at 5 mM ATP (Fig. 10). We found that both RT1-V-3 and RT3-V-1 channels display very low levels of activity in the absence of ATP (Po = 3 ± 1% (n = 3) for RT1-V-3 and Po = 2 ± 1% (n = 2) for RT3-V-1) (Fig. 10, A and B, top traces). Addition of 0.5 mM ATP potentiated activity of RT1-V-3 channels to Po = 20 ± 4% (n = 3) (Fig. 10 A, middle trace). The Po of RT3-V-1 channels at 0.5 mM ATP was much lower at 8 ± 3% (n = 3) (Fig. 10 B, middle trace). However, addition of 5 mM ATP resulted in maximal level of activity of both RT1-V-3 (Po = 23 ± 5% (n = 3)) and RT3-V-1 (Po = 25 ± 7% (n = 2)) channels (Fig. 10, A and B, bottom traces). Comparison with results in the accompanying article (Tu et al., 2005) clearly shows that RT1-V-3 channels are modulated by ATP similar to RT1 channels, and RT3-V-1 channels are modulated by ATP similar to RT3 channels. Thus, the main reason for differences in ATP sensitivity of the RT1 and RT3 channels is related to the presence or absence of the high-affinity ATPA site (Fig. 7 A), in agreement with our previous conclusions based on the functional analysis of InsP3R1-opt mutant (Tu et al., 2002).
FIGURE 10.
ATP sensitivity of Ca2+ sensor swap chimeras. Representative current records of RT1-V-3 (A) and RT3-V-1 (B) channels in the bilayers in the presence of 2 μM InsP3 and pCa 6.7 at concentrations of Na2ATP as indicated on the cis (cytoplasmic) side of the membrane. The recordings from the same experiment are shown on each panel. Similar results were obtained in at least three experiments with each chimera.
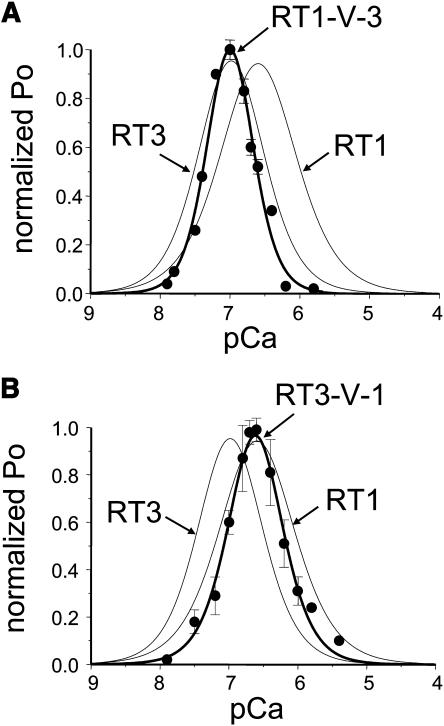
In the presence of 2 μM InsP3 and 0.5 mM ATP both InsP3R1 and InsP3R3 display narrow bell-shaped Ca2+ dependence with the peak at 257 nM Ca2+ for InsP3R1 and 107 nM Ca2+ for InsP3R3 (Fig. 1). To investigate the effects of Cas region swap on sensitivity of InsP3R to Ca2+, we determined Ca2+ dependence of RT1-V-3 and RT3-V-1 channels in the same recording conditions. Because most of the experiments resulted in multichannel bilayers, the Po values in each experiment were normalized to the maximal Po in the same experiment as described in Materials and Methods and the normalized data from different experiments with each chimera were averaged together for presentation and analysis. We found that the RT1-V-3 chimera displayed bell-shaped Ca2+ dependence that closely overlaps with the RT3 Ca2+ dependence with the peak at 100 nM Ca2+ (Fig. 11 A, solid circles). Fit to the Ca2+ dependence of RT1-V-3 channels using Eq. 1 (Fig. 11 A, smooth thick curve; R2 = 0.98) yielded the apparent affinities of activating and inhibitory Ca2+-binding sites equal to 0.06 ± 0.02 and 0.16 ± 0.01 μM Ca2+ (Table 1), identical to the values obtained for the RT3 channels. The difference between RT1-V-3 and RT3 Ca2+-dependence curves was due to differences in apparent Hill coefficients of Ca2+ modulation (n = 2.17 for RT1-V-3 and n = 1.46 for RT3; Table 1).
FIGURE 11.
Ca2+ dependence of Ca2+ sensor swap chimeras at 0.5 mM ATP. Ca2+ dependence of RT1-V-3 (A) and RT3-V-1 (B) chimeras in planar lipid bilayers. The normalized and averaged data (see Materials and Methods) at each Ca2+ concentration are shown as means ± SE (n ≥ 3) (•). The data were fit (thick lines) by Eq. 1 (see Materials and Methods). The parameters of the best fits are in Table 1. The fits to InsP3R1 and InsP3R3 (at 0.5 mM ATP) Ca2+ dependence curves (thin lines) are from Fig 1.
In contrast to RT1-V-3, the RT3-V-1 chimera displayed bell-shaped Ca2+ dependence that closely overlaps with the RT1 Ca2+ dependence with the peak at 239 nM Ca2+ (Fig. 11 B). Fit to the Ca2+ dependence of RT3-V-1 channels using Eq. 1 (Fig. 11 B, smooth thick curve; R2 = 0.99) yielded the apparent affinities of activating and inhibitory Ca2+-binding sites equal to 0.24 ± 0.01 and 0.25 ± 0.02 μM Ca2+ (Table 1), close to the values obtained for the RT1 channels. Similar to RT1-V-3 chimera, the difference between RT3-V-1 and RT1 Ca2+-dependence curves was largely due to differences in apparent Hill coefficients of Ca2+ modulation (n = 1.65 for RT3-V-1 and n = 1.23 for RT1; Table 1). The results obtained with RT1-V-3 and RT3-V-1 chimeras (Fig. 11) indicated that swapping Cas regions between InsP3R1 and InsP3R3 was sufficient to exchange sensitivities to modulation by Ca2+ between these two mammalian InsP3R isoforms.
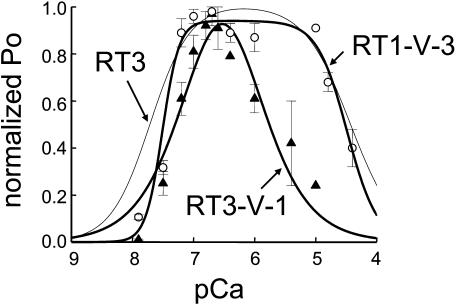
In the presence of 5 mM ATP, the RT3 channels display “square-shaped” Ca2+ dependence (Fig. 2). In the next series of experiments we compared Ca2+ dependence of RT1-V-3 and RT3-V-1 chimeras in the presence of 2 μM InsP3 and 5 mM ATP. We found that in the presence of 5 mM ATP, RT1-V-3 chimera (Fig. 12, open circles) displayed a “square-shaped” Ca2+ dependence very similar to Ca2+ dependence of RT3 channels, whereas RT3-V-1 chimera (Fig. 12, triangles) displayed “narrow” Ca2+ dependence. Fit to the Ca2+ dependence of RT1-V-3 channels using Eq. 2 (Fig. 12, smooth thick curve; R2 = 0.98) yielded the apparent afinities of activating and inhibitory Ca2+-binding sites equal to 0.040 ± 0.003 and 33 ± 5 μM Ca2+ (Table 1), close to the values obtained for the RT3 channels at 5 mM ATP. Fit to the Ca2+ dependence of RT3-V-1 channels using Eq. 1 (Fig. 12, smooth thick curve; R2 = 0.96) yielded the apparent affinities of activating and inhibitory Ca2+-binding sites equal to 0.28 ± 0.03 and 0.31 ± 0.04 μM Ca2+ (Table 1), similar to the values obtained for the RT1 channels.
FIGURE 12.
Ca2+ dependence of Ca2+ sensor swap chimeras at 5 mM ATP. Ca2+ dependence of RT1-V-3 (○) and RT3-V-1 (▴) chimeras in planar lipid bilayers at the presence of 5 mM ATP. The normalized and averaged data (see Materials and Methods) at each Ca2+ concentration are shown as means ± SE (n ≥ 3). The RT1-V-3 data were fit by Eq. 2 (thick curve) and the RT3-V-1 data were fit by Eq. 1 (thick curve). The parameters of the best fits are in Table 1. The fit to Ca2+ dependence of InsP3R3 at 5 mM ATP (thin line) is from Fig 2.
DISCUSSION
Ca2+ dependence of mammalian InsP3R isoforms
In standard recording conditions (2 μM InsP3 and 0.5 mM ATP) all three mammalian InsP3R displayed narrow bell-shaped Ca2+ dependence within a physiological range of Ca2+ concentrations (pCa 8–5) (Fig. 1; Table 1). In an independent study we demonstrated that Drosophila melanogaster InsP3R displays similar narrow bell-shaped Ca2+ dependence when reconstituted into planar lipid bilayers and analyzed in standard recording conditions (Srikanth et al., 2004). Thus, bell-shaped Ca2+ dependence of InsP3R appears to be a fundamental and evolutionary conserved feature of all InsP3R. This conclusion is in contrast with some previous bilayer studies of InsP3R2 (Ramos-Franco et al., 2000, 1998) and InsP3R3 (Hagar et al., 1998). However, bell-shaped Ca2+ regulation of InsP3R3 observed in our experiments is consistent with Ca2+ flux measurements in RIN-5F (Swatton et al., 1999) and 16HBE14o- bronchial mucosal cells (Missiaen et al., 1998) and with nuclear patch recordings of recombinant InsP3R3 expressed in Xenopus oocytes (Mak et al., 2001b). The reasons for these discrepancies are not clear. The InsP3R1 contain a high-affinity Ca2+/calmodulin (CaM)-binding site in the coupling domain, which is not conserved in the InsP3R3 sequence (Yamada et al., 1995). The fact that InsP3R3 display bell-shaped Ca2+ dependence despite the absence of a Ca2+/CaM-binding site further supports the notion that association with CaM at this Ca2+/CaM binding site does not play a role in biphasic modulation of InsP3R by Ca2+ (Nosyreva et al., 2002; Zhang and Joseph, 2001) (but see Michikawa et al., 1999). With all three InsP3R isoforms displaying bell-shaped Ca2+ dependence (Fig. 1), how can we explain isoform-specific Ca2+ oscillation profiles observed in the study with DT40 cells (Miyakawa et al., 1999)? We would like to suggest that the unique ability of InsP3R2 to support robust Ca2+ oscillations observed in the study of Miyakawa et al. (1999) results from higher affinity of InsP3R2 for InsP3 when compared to InsP3R1 and InsP3R3 isoforms (Miyakawa et al., 1999; Sudhof et al., 1991; Tu et al., 2005). We would like to suggest that ligation of B-cell receptors (BCR) with anti-BCR antibody in the study with DT40 cells (Miyakawa et al., 1999) resulted in long-lasting InsP3 elevation above the threshold of InsP3R2 activation, close to the threshold of InsP3R1 activation, and below the threshold of InsP3R3 activation.
The narrow shape of InsP3R1 bell-shaped Ca2+ dependence in our planar lipid bilayer experiments (Fig. 1 and Nosyreva et al., 2002; Tu et al., 2002, 2003) is different from the “square” shape described for Xenopus InsP3R (xInsP3R) (InsP3R1 homolog; Kume et al., 1993) in nuclear patch experiments by Mak et al. (1998), but it is consistent with the earlier nuclear patch experiments by Stehno-Bittel et al. (1995). Also, the maximal Po of InsP3R1 in our experiments (Tu et al., 2005) and in experiments by Stehno-Bittel et al. (1995) is in the range of 20–30%, whereas Po of xInsP3R in experiments of Mak et al. (1998) reaches 80%. What is an explanation of these differences? And more importantly, what behavior more closely reflects InsP3R1 function in vivo? The Po of InsP3R1 in vivo is unknown. However, all Ca2+ flux measurements performed with permeabilized cells (Iino, 1990), isolated brain microsomes (Finch et al., 1991), and Xenopus oocytes (Parker and Ivorra, 1990; Yao and Parker, 1992) are consistent with the “narrow” shape of InsP3R1 Ca2+ dependence. In all of these experiments InsP3-induced Ca2+ release was completely blocked by Ca2+ concentrations in the 5–10 μM range, whereas Ca2+ concentrations in the 50–100 μM range were required to inhibit xInsP3R and InsP3R3 in nuclear patch recordings of Mak et al. (1998). Therefore, we concluded that “narrow” bell-shaped Ca2+ dependence observed in our experiments (Fig. 1 and Nosyreva et al., 2002; Tu et al., 2002, 2003) more closely reflects the physiological behavior of InsP3R1 and InsP3R3 than the “square” Ca2+ dependence of xInsP3R reported by Mak et al. (1998).
A recently published mathematical modeling study (Fraiman and Dawson, 2004) offers a potential explanation to the different behavior of InsP3R1 observed in planar lipid bilayer experiments (Bezprozvanny et al., 1991 and Fig. 1) and in nuclear patch recordings (Mak et al., 1998). Fraiman and Dawson (2004) were able to explain most of the differences in results obtained in the planar lipid bilayer and nuclear patches recordings of InsP3R1 activity by introducing an additional intraluminal Ca2+ modulatory site. These authors were able to explain “square” Ca2+ dependence and high Po of xInsP3R in nuclear patch recordings of Mak et al. (1998) by the fact that these experiments were performed using monovalent cations to carry current in the absence of Ca2+ or other divalent cations. In contrast, the planar lipid bilayer recordings are performed using 50 mM Ca2+ (Bezprozvanny et al., 1991) or Ba2+ (Fig. 1 and Nosyreva et al., 2002; Tu et al., 2002, 2003) as a current carrier. In the previous study we compared gating of InsP3R1 with 50 mM Ca2+, Ba2+, Sr2+, and Mg2+ as current carriers and analyzed modulation of InsP3R1 by intraluminal Ca2+ levels (Bezprozvanny and Ehrlich, 1994). As discussed by Fraiman and Dawson (2004), the results from Bezprozvanny and Ehrlich (1994) are mostly consistent with the model proposed in their article. Thus, we concluded that “square” Ca2+ dependence and high Po of xInsP3R in nuclear patch recordings of Mak et al. (1998) most likely results from using divalent-free recording conditions (Fraiman and Dawson, 2004). Interestingly, this argument does not explain the difference between results of Mak et al. (1998) and Stehno-Bittel et al. (1995), as both groups used 140 mM K+ as a current carrier in nuclear patch recordings of xInsP3R activity.
In standard recording conditions (2 μM InsP3 and 0.5 mM ATP) InsP3R3 also displayed narrow bell-shaped Ca2+ dependence in physiological range of Ca2+ concentrations (pCa 8–5) (Fig. 1; Table 1). In contrast to our experiments, Mak et al. reported “square-shaped” Ca2+ dependence of rat InsP3R3 expressed in Xenopus oocytes and recorded in nuclear patch experiments in the presence of 0.5 mM ATP and 10 μM InsP3 (Mak et al., 2001b). The maximal InsP3R3 open probability in standard recording conditions in our experiments was low (Po < 5%) (Tu et al., 2005), whereas Po of InsP3R3 in experiments of Mak et al. (2001b) reaches 80%. Once again, “narrow” bell-shaped Ca2+ dependence of InsP3R3 is consistent with Ca2+ flux measurements in permeabilized 16HBE14o- bronchial mucosal cells and RINm5F cells enriched in InsP3R3 (Missiaen et al., 1998; Swatton et al., 1999). The explanation of the differences between “narrow” and “square-shaped” Ca2+ dependence of InsP3R3 observed in our experiments (Fig. 1) and in experiments of Mak et al. (2001b) is most likely related to use of divalent-free recording conditions as discussed above for InsP3R1.
Interestingly, the “narrow” Ca2+ dependence of InsP3R3 in standard recording conditions (2 μM InsP3 and 0.5 mM ATP) (Fig. 1) was converted to “square-shaped” Ca2+ dependence when recordings were performed in the presence of 2 μM InsP3 and 5 mM ATP (Fig. 2). The ATP-induced change in the shape of Ca2+ dependence was a unique feature of InsP3R3, as Ca2+ dependence of InsP3R1 remained “narrow” in the presence of 5 mM ATP (data not shown). Fit to “narrow” (Fig. 1) and “square” (Fig. 2) Ca2+-dependence curves of InsP3R3 indicated that an increase in ATP concentration from 0.5 to 5 mM resulted in a twofold increase in the apparent affinity of the Ca2+-activating site of InsP3R3 and a >200-fold reduction in the apparent affinity of the Ca2+-inhibitory site of InsP3R3 (Table 1). In experiments of Mak et al. (2001a) with InsP3R3 expressed in Xenopus oocytes an increase in ATP concentration from 0 to 0.5 mM resulted in a 10-fold increase in the affinity of the Ca2+-activating site and a threefold increase in the affinity of the Ca2+-inhibitory site. Unfortunately, the inhibitory phase of InsP3R3 Ca2+ dependence was not analyzed at ATP concentrations >0.5 mM by Mak et al. (2001a), so it is not clear if the differences between our studies and the Mak et al. studies are due to a different range of ATP concentrations compared (0.5 and 5 mM in our study and 0 and 0.5 mM in the Mak et al., 2001a study) or because of the use of divalent-free recording conditions as discussed above. Notably, Mak et al. (1998) earlier reported that the increase in InsP3 concentration from 20 nM to 10 μM leads to a 280-fold reduction in the apparent affinity of the Ca2+-inhibitory site of xInsP3R. In our hands the affinity of the InsP3R3 Ca2+-inhibitory site is affected in a very similar way by an increase in ATP concentration (Figs. 1 and 2; Table 1).
The role of InsP3R Ca2+ sensor
When modulation of different InsP3R isoforms by Ca2+ was compared side-by-side in standard recording conditions (2 μM InsP3 and 0.5 mM ATP), we discovered that InsP3R3 are most sensitive to modulation by Ca2+ (peak at 107 nM Ca2+), followed by InsP3R2 (peak at 154 nM Ca2+), and then by InsP3R1 (peak at 257 nM Ca2+) (Fig. 1; Table 1). High sensitivity to activation by Ca2+ observed for InsP3R2 is consistent with the previous Ca2+ flux studies in DT40 cells (Miyakawa et al., 1999) and with the single-channel recordings of native and recombinant InsP3R2 (Ramos-Franco et al., 2000, 1998). High sensitivity to activation by Ca2+ observed for InsP3R3 is also consistent with previous Ca2+ flux studies in DT40 cells (Miyakawa et al., 1999) and with single-channel recordings of recombinant InsP3R3 expressed in Xenopus oocytes (Mak et al., 2001b).
In the previous studies (Miyakawa et al., 2001; Tu et al., 2003) we identified a putative Ca2+ sensor (Cas) region in the InsP3R1 sequence. The sequence of Cas region is highly conserved between InsP3R isoforms (Fig. 4), including a conserved glutamate residue (E2100 in InsP3R1), the importance of which we established previously (Miyakawa et al., 2001; Tu et al., 2003). Are small variations in Cas sequence (Fig. 4) sufficient to explain different Ca2+ sensitivity of InsP3R isoforms? To answer this question, we expressed RT1-Cas, RT2-Cas, and RT3-Cas proteins in bacteria (Fig. 3) and performed a series of intrinsic tryptophan fluorescence measurements at different Ca2+ concentrations by following a method described previously for RT1-Cas (Tu et al., 2003). Importantly, the W2255 and W2267 residues of InsP3R1 present within the RT1-Cas region (Fig. 4, open arrows) are conserved in InsP3R2 and InsP3R3. For all three RT-Cas proteins, the intensity of the intrinsic tryptophan fluorescence signal was quenched as a function of Ca2+ (Fig. 5), consistent with Ca2+-induced conformational change. By fitting the obtained results we determined that the RT1-Cas apparent affinity for Ca2+ (KCa) is equal to 0.23 μM, RT2-Cas apparent affinity for Ca2+ is equal to 0.16 μM, and RT3-Cas apparent affinity for Ca2+ is equal to 0.10 μM (Fig. 6; Table 1). Thus, small variations in Cas sequence between different InsP3R isoforms (Fig. 4) do appear to be sufficient to result in different affinities for Ca2+ (Fig. 6). Future mutagenesis of the RT-Cas region or solution of the RT-Cas structure will be required to identify structural determinants that form a Ca2+-binding site within the RT-Cas region.
Ca2+ binding affinities of isolated RT-Cas regions are in quantitative agreement with the sensitivity of corresponding InsP3R isoforms to the Ca2+ modulation determined in planar lipid bilayer experiments (Table 1). Are different RT-Cas affinities for Ca2+ sufficient to explain different Ca2+ sensitivity of InsP3R isoforms? To answer this question, we swapped Cas regions between the InsP3R1 and InsP3R3 isoforms and generated baculoviruses encoding RT1-V-3 and RT3-V-1 chimeras (Fig. 7). Single-channel analysis revealed that conductance and gating properties of RT1-V-3 and RT3-V-1 chimeras are similar to the properties of “parental channels” (Figs. 8 and 9). Thus, swapping InsP3R1 and InsP3R3 Cas regions did not induce gross abnormalities in InsP3R gating and conductance properties. The low-affinity ATP-binding site (ATPB) is contained within the Cas region (Fig. 4). Thus, RT1-V-3 chimera contains the ATPA site from InsP3R1 and the ATPB site from InsP3R3 (Fig. 7 A), and RT3-V-1 chimera contains the ATPB site from InsP3R1 (Fig. 7 A). Consistent with the predominant role played by the ATPA site in modulating InsP3R1 gating by ATP (Maes et al., 2001; Tu et al., 2002), RT1-V-3 chimera displayed ATP sensitivity similar to InsP3R1 (Fig. 10 A) and RT3-V-1 chimera displayed ATP sensitivity similar to InsP3R3 (Fig. 10 B).
Consistent with “Ca2+ sensor hypothesis,” we found that swapping Cas regions was sufficient to exchange Ca2+ sensitivities of InsP3R1 and InsP3R3 isoforms (Fig. 11, A and B; Table 1). Interestingly, both activating and inhibitory parts of bell-shaped Ca2+ dependence were affected by Cas domain swap in our experiments with RT1-V-3 and RT3-V-1 chimeras (Fig. 11, A and B). These results are consistent with our previous analysis of RT1-E2100 point mutants (Tu et al., 2003). As discussed in Tu et al. (2003), these data can be explained if Cas region forms a part of both Ca2+-activating and Ca2+-inhibitory sites, or by sequential Ca2+ binding to activating and inhibitory sites of the InsP3R. In our experiments we found that the Ca2+ sensitivity of RT1-V-3 chimera closely resembles Ca2+ sensitivity of RT3 (Fig. 11 A), and the Ca2+ sensitivity of RT3-V-1 chimera closely matches Ca2+ sensitivity of RT1 (Fig. 11 B). Moreover, at 5 mM ATP RT1-V-3 chimera displayed “square-shaped” Ca2+ dependence similar to RT3, whereas RT3-V-1 chimera displayed “narrow” Ca2+ dependence similar to RT1 (Fig. 12). These results indicate that the features responsible for ATP-dependent transition from “narrow” to “square” Ca2+ dependence are uniquely encoded within RT3-Cas sequence.
Our results with RT1-V-3 and RT3-V-1 chimeras are in contrast to recent analysis of InsP3R1/2 and InsP3R2/1 coupling domain swap chimeras (Ramos et al., 2003). In the study of Ramos et al. (2003) Ca2+ sensitivity of 1-2-1 and 2-1-2 chimeras was largely lost and did not resemble Ca2+ sensitivity of either “parental” InsP3R (type 1 or type 2). Most likely explanation for the differences between our results and the results of Ramos et al. (2003) is related to the choice of boundaries for “domain swap”. In our RT1-V-3 and RT3-V-1 constructs we choose domain swap boundaries (E1932 in InsP3R1 and M1835 in InsP3R3, Figs. 4 and 7 A) from the limited trypsin digestion pattern of InsP3R1 (Yoshikawa et al., 1999), which also corresponds to the region of sequence divergence between InsP3R isoforms. In contrast, Ramos et al. (2003) choose the most conserved regions of the InsP3R1 and InsP3R2 sequences as boundaries for the coupling domain swap in 1-2-1 and 2-1-2 chimeras. Indeed, we obtained functional results similar to that of Ramos et al. (2003) with several other InsP3R3/1 chimeric constructs with domain swap boundaries chosen in conserved regions of InsP3R1 and InsP3R3 sequences (data not shown).
Common and unique properties of mammalian InsP3R isoforms
In summary, data presented in this and the accompanying article (Tu et al., 2005) as well as the majority of the previously published reports indicate that all three mammalian InsP3R isoforms share common gating and conductance properties and display bell-shaped sensitivity to Ca2+ in a physiological range of Ca2+ concentrations (pCa 8–5). When compared to each other, the InsP3R1 is a medium InsP3-affinity, high ATP-affinity (no cooperativity), and low Ca2+-affinity isoform; the InsP3R2 is a high InsP3-affinity, ATP-independent, medium Ca2+-affinity isoform; the InsP3R3 is a low InsP3-affinity, low ATP-affinity (high cooperativity), and high Ca2+-affinity isoform. Interestingly, saturation of the ATP binding site of InsP3R3 (but not InsP3R1) reduces apparent affinity of the Ca2+-inhibitory site by >200-fold and converts “narrow” bell-shaped Ca2+ dependence of InsP3R3 (Fig. 1) to “square” Ca2+ dependence (Fig. 2). It appears that high affinity of InsP3R2 for InsP3 is encoded within the amino-terminal ligand-binding domain (Sudhof et al., 1991), high affinity of InsP3R1 for ATP is due to the high-affinity ATPA binding site in the InsP3R1 sequence (Fig. 10; also Maes et al., 2001; Tu et al., 2002), and the differences in Ca2+ sensitivity are encoded within a sequence of Ca2+ sensor (Cas) region (Figs. 4, 6, 11, and 12). These conclusions will be useful for understanding the mechanisms of InsP3R function and for analysis of Ca2+ signals supported by various InsP3R subtypes expressed in cells and tissues.
Acknowledgments
We are grateful to Gregory Mignery and Thomas C. Südhof for the kind gift of the rat InsP3R1 and InsP3R2 clones, to Graeme Bell for the kind gift of the rat InsP3R3 clone, and to Humbert De Smedt for RT3 baculovirus. We thank Phyllis Foley for the administrative assistance and Elena Nosyreva for help with bilayer experiments.
This work was supported by the Welch Foundation and National Institutes of Health (R01 NS38082 to I.B.).
References
- Berridge, M. J. 1993. Inositol trisphosphate and calcium signalling. Nature. 361:315–325. [DOI] [PubMed] [Google Scholar]
- Bezprozvanny, I., and B. E. Ehrlich. 1994. Inositol (1,4,5)-trisphosphate (InsP3)-gated Ca channels from cerebellum: conduction properties for divalent cations and regulation by intraluminal calcium. J. Gen. Physiol. 104:821–856. [DOI] [PMC free article] [PubMed] [Google Scholar]
- Bezprozvanny, I., J. Watras, and B. E. Ehrlich. 1991. Bell-shaped calcium-response curves of Ins(1,4,5)P3- and calcium-gated channels from endoplasmic reticulum of cerebellum. Nature. 351:751–754. [DOI] [PubMed] [Google Scholar]
- Fabiato, A. 1988. Computer programs for calculating total from specified free or free from specified total ionic concentrations in aqueous solutions containing multiple metals and ligands. Methods Enzymol. 157:378–417. [DOI] [PubMed] [Google Scholar]
- Finch, E. A., T. J. Turner, and S. M. Goldin. 1991. Calcium as a coagonist of inositol 1,4,5-trisphosphate-induced calcium release. Science. 252:443–446. [DOI] [PubMed] [Google Scholar]
- Fraiman, D., and S. P. Dawson. 2004. A model of the IP3 receptor with a luminal calcium binding site: stochastic simulations and analysis. Cell Calcium. 35:403–413. [DOI] [PubMed] [Google Scholar]
- Furuichi, T., K. Kohda, A. Miyawaki, and K. Mikoshiba. 1994. Intracellular channels. Curr. Opin. Neurobiol. 4:294–303. [DOI] [PubMed] [Google Scholar]
- Hagar, R. E., A. D. Burgstahler, M. H. Nathanson, and B. E. Ehrlich. 1998. Type III InsP3 receptor channel stays open in the presence of increased calcium. Nature. 396:81–84. [DOI] [PMC free article] [PubMed] [Google Scholar]
- Iino, M. 1990. Biphasic Ca2+ dependence of inositol 1,4,5-trisphosphate-induced Ca release in smooth muscle cells of the guinea pig Taenia caeci. J. Gen. Physiol. 95:1103–1122. [DOI] [PMC free article] [PubMed] [Google Scholar]
- Kaznacheyeva, E., V. D. Lupu, and I. Bezprozvanny. 1998. Single-channel properties of inositol (1,4,5)-trisphosphate receptor heterologously expressed in HEK-293 cells. J. Gen. Physiol. 111:847–856. [DOI] [PMC free article] [PubMed] [Google Scholar]
- Kume, S., A. Muto, J. Aruga, T. Nakagawa, T. Michikawa, T. Furuichi, S. Nakade, H. Okano, and K. Mikoshiba. 1993. The Xenopus IP3 receptor: structure, function, and localization in oocytes and eggs. Cell. 73:555–570. [DOI] [PubMed] [Google Scholar]
- Maes, K., L. Missiaen, P. De Smet, S. Vanlingen, G. Callewaert, J. B. Parys, and H. De Smedt. 2000. Differential modulation of inositol 1,4,5-trisphosphate receptor type 1 and type 3 by ATP. Cell Calcium. 27:257–267. [DOI] [PubMed] [Google Scholar]
- Maes, K., L. Missiaen, J. B. Parys, P. De Smet, I. Sienaert, E. Waelkens, G. Callewaert, and H. De Smedt. 2001. Mapping of the ATP-binding sites on inositol 1,4,5-trisphosphate receptor type 1 and type 3 homotetramers by controlled proteolysis and photoaffinity labeling. J. Biol. Chem. 276:3492–3497. [DOI] [PubMed] [Google Scholar]
- Mak, D. O., S. McBride, and J. K. Foskett. 1998. Inositol 1,4,5-trisphosphate activation of inositol trisphosphate receptor Ca2+ channel by ligand tuning of Ca2+ inhibition. Proc. Natl. Acad. Sci. USA. 95:15821–15825. [DOI] [PMC free article] [PubMed] [Google Scholar]
- Mak, D. O., S. McBride, and J. K. Foskett. 2001a. ATP regulation of recombinant type 3 inositol 1,4,5-trisphosphate receptor gating. J. Gen. Physiol. 117:447–456. [DOI] [PMC free article] [PubMed] [Google Scholar]
- Mak, D. O., S. McBride, and J. K. Foskett. 2001b. Regulation by Ca2+ and inositol 1,4,5-trisphosphate (InsP3) of single recombinant type 3 InsP3 receptor channels. Ca2+ activation uniquely distinguishes types 1 and 3 InsP3 receptors. J. Gen. Physiol. 117:435–446. [DOI] [PMC free article] [PubMed] [Google Scholar]
- Michikawa, T., J. Hirota, S. Kawano, M. Hiraoka, M. Yamada, T. Furuichi, and K. Mikoshiba. 1999. Calmodulin mediates calcium-dependent inactivation of the cerebellar type 1 inositol 1,4,5-trisphosphate receptor. Neuron. 23:799–808. [DOI] [PubMed] [Google Scholar]
- Missiaen, L., J. B. Parys, I. Sienaert, K. Maes, K. Kunzelmann, M. Takahashi, K. Tanzawa, and H. De Smedt. 1998. Functional properties of the type-3 InsP3 receptor in 16HBE14o- bronchial mucosal cells. J. Biol. Chem. 273:8983–8986. [DOI] [PubMed] [Google Scholar]
- Miyakawa, T., A. Maeda, T. Yamazawa, K. Hirose, T. Kurosaki, and M. Iino. 1999. Encoding of Ca2+ signals by differential expression of IP3 receptor subtypes. EMBO J. 18:1303–1308. [DOI] [PMC free article] [PubMed] [Google Scholar]
- Miyakawa, T., A. Mizushima, K. Hirose, T. Yamazawa, I. Bezprozvanny, T. Kurosaki, and M. Iino. 2001. Ca(2+)-sensor region of IP(3) receptor controls intracellular Ca(2+) signaling. EMBO J. 20:1674–1680. [DOI] [PMC free article] [PubMed] [Google Scholar]
- Nosyreva, E., T. Miyakawa, Z. Wang, L. Glouchankova, A. Mizushima, M. Iino, and I. Bezprozvanny. 2002. The high affinity calcium-calmodulin-binding site does not play a role in modulation of type 1 inositol (1,4,5)-trisphosphate receptor function by calcium and calmodulin. Biochem. J. 365:659–667. [DOI] [PMC free article] [PubMed] [Google Scholar]
- Parker, I., and I. Ivorra. 1990. Inhibition by Ca2+ of inositol trisphosphate-mediated Ca2+ liberation: a possible mechanism for oscillatory release of Ca2+. Proc. Natl. Acad. Sci. USA. 87:260–264. [DOI] [PMC free article] [PubMed] [Google Scholar]
- Ramos, J., W. Jung, J. Ramos-Franco, G. A. Mignery, and M. Fill. 2003. Single channel function of inositol 1,4,5-trisphosphate receptor type-1 and -2 isoform domain-swap chimeras. J. Gen. Physiol. 121:399–411. [DOI] [PMC free article] [PubMed] [Google Scholar]
- Ramos-Franco, J., D. Bare, S. Caenepeel, A. Nani, M. Fill, and G. Mignery. 2000. Single-channel function of recombinant type 2 inositol 1,4,5-trisphosphate receptor. Biophys. J. 79:1388–1399. [DOI] [PMC free article] [PubMed] [Google Scholar]
- Ramos-Franco, J., M. Fill, and G. A. Mignery. 1998. Isoform-specific function of single inositol 1,4,5-trisphosphate receptor channels. Biophys. J. 75:834–839. [DOI] [PMC free article] [PubMed] [Google Scholar]
- Srikanth, S., Z. Wang, H. Tu, S. Nair, M. K. Mathew, G. Hasan, and I. Bezprozvanny. 2004. Functional properties of the Drosophila melanogaster inositol 1,4,5-trisphosphate receptor mutants. Biophys. J. 86:3634–3646. [DOI] [PMC free article] [PubMed] [Google Scholar]
- Stehno-Bittel, L., A. Luckhoff, and D. E. Clapham. 1995. Calcium release from the nucleus by InsP3 receptor channels. Neuron. 14:163–167. [DOI] [PubMed] [Google Scholar]
- Sudhof, T. C., C. L. Newton, B. T. Archer, Y. A. Ushkaryov, and G. A. Mignery. 1991. Structure of a novel InsP3 receptor. EMBO J. 10:3199–3206. [DOI] [PMC free article] [PubMed] [Google Scholar]
- Swatton, J. E., S. A. Morris, T. J. Cardy, and C. W. Taylor. 1999. Type 3 inositol trisphosphate receptors in RINm5F cells are biphasically regulated by cytosolic Ca2+ and mediate quantal Ca2+ mobilization. Biochem. J. 344:55–60. [PMC free article] [PubMed] [Google Scholar]
- Taylor, C. W., A. A. Genazzani, and S. A. Morris. 1999. Expression of inositol trisphosphate receptors. Cell Calcium. 26:237–251. [DOI] [PubMed] [Google Scholar]
- Tu, H., T. Miyakawa, Z. Wang, L. Glouchankova, M. Iino, and I. Bezprozvanny. 2002. Functional characterization of the type 1 inositol 1,4,5-trisphosphate receptor coupling domain SII(+/−) splice variants and the Opisthotonos mutant form. Biophys. J. 82:1995–2004. [DOI] [PMC free article] [PubMed] [Google Scholar]
- Tu, H., E. Nosyreva, T. Miyakawa, Z. Wang, A. Mizushima, M. Iino, and I. Bezprozvanny. 2003. Functional and biochemical analysis of the type 1 inositol (1,4,5)-trisphosphate receptor calcium sensor. Biophys. J. 85:290–299. [DOI] [PMC free article] [PubMed] [Google Scholar]
- Tu, H., Z. Wang, E. Nosyreva, H. De Smedt, and I. Bezprozvanny. 2005. Functional characterization of mammalian inositol 1,4,5-trisphosphate receptor isoforms. Biophys. J. 88:1046–1055. [DOI] [PMC free article] [PubMed] [Google Scholar]
- Ward, L. D. 1985. Measurement of ligand binding to proteins by fluorescence spectroscopy. Methods Enzymol. 117:400–414. [DOI] [PubMed] [Google Scholar]
- Yamada, M., A. Miyawaki, K. Saito, T. Nakajima, M. Yamamoto-Hino, Y. Ryo, T. Furuichi, and K. Mikoshiba. 1995. The calmodulin-binding domain in the mouse type 1 inositol 1,4,5-trisphosphate receptor. Biochem. J. 308:83–88. [DOI] [PMC free article] [PubMed] [Google Scholar]
- Yao, Y., and I. Parker. 1992. Potentiation of inositol trisphosphate-induced Ca2+ mobilization in Xenopus oocytes by cytosolic Ca2+. J. Physiol. 458:319–338. [DOI] [PMC free article] [PubMed] [Google Scholar]
- Yoshikawa, F., H. Iwasaki, T. Michikawa, T. Furuichi, and K. Mikoshiba. 1999. Trypsinized cerebellar inositol 1,4,5-trisphosphate receptor. Structural and functional coupling of cleaved ligand binding and channel domains. J. Biol. Chem. 274:316–327. [DOI] [PubMed] [Google Scholar]
- Zhang, X., and S. K. Joseph. 2001. Effect of mutation of a calmodulin binding site on Ca2+ regulation of inositol trisphosphate receptors. Biochem. J. 360:395–400. [DOI] [PMC free article] [PubMed] [Google Scholar]


