Abstract
A novel protocol has been developed for comparing the structural properties of lipid bilayers determined by simulation with those determined by diffraction experiments, which makes it possible to test critically the ability of molecular dynamics simulations to reproduce experimental data. This model-independent method consists of analyzing data from molecular dynamics bilayer simulations in the same way as experimental data by determining the structure factors of the system and, via Fourier reconstruction, the overall transbilayer scattering-density profiles. Multi-nanosecond molecular dynamics simulations of a dioleoylphosphatidylcholine bilayer at 66% RH (5.4 waters/lipid) were performed in the constant pressure and temperature ensemble using the united-atom GROMACS and the all-atom CHARMM22/27 force fields with the GROMACS and NAMD software packages, respectively. The quality of the simulated bilayer structures was evaluated by comparing simulation with experimental results for bilayer thickness, area/lipid, individual molecular-component distributions, continuous and discrete structure factors, and overall scattering-density profiles. Neither the GROMACS nor the CHARMM22/27 simulations reproduced experimental data within experimental error. The widths of the simulated terminal methyl distributions showed a particularly strong disagreement with the experimentally observed distributions. A comparison of the older CHARMM22 with the newer CHARMM27 force fields shows that significant progress is being made in the development of atomic force fields for describing lipid bilayer systems empirically.
INTRODUCTION
Many experimental studies on hydrated phospholipid bilayers using neutron and x-ray diffraction have yielded important information about bilayer structure (see reviews by McIntosh, 1990; White and Wiener, 1995; and Tristram-Nagle et al., 1998). However, due to the fluid disorder present in such systems, these experiments provide only one-dimensional information about membrane structure in the direction normal to the plane of the membrane (see review by Franks and Levine, 1981). Molecular dynamics (MD) simulations, on the other hand, inherently provide three-dimensional structural and dynamic information about bilayers. But the accuracy of the MD structures is uncertain in many cases. A potential means for overcoming the limitations of each approach is to combine the two techniques to arrive at experimentally validated, dynamic, three-dimensional structures of fluid bilayer membranes. The key question, which we address in this article, is how to compare simulation-derived three-dimensional structures with experimentally determined one-dimensional structures.
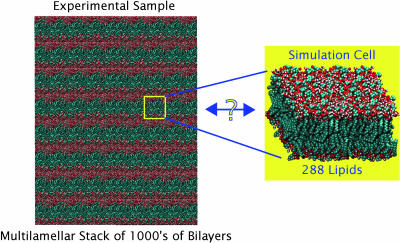
The principal difficulties in answering this seemingly simple question are the strong differences in the space and timescales that the two techniques can intrinsically probe: Experimental structural properties are determined from macroscopic systems over long time periods (hours), whereas simulation structural properties are obtained from hundreds of molecules over short time periods (nanoseconds), as illustrated in Fig. 1. In addition, the data obtained from experiments and simulations are fundamentally different, which further complicates the comparison.
FIGURE 1.
Illustration of the fundamental difference in scale between bilayer diffraction experiments and simulations. An experimental bilayer sample consists of thousands of bilayers measured over many hours or days, whereas a simulation cell typically contains hundreds of lipids simulated on the nanosecond timescale. These fundamental differences complicate comparisons between experiments and simulations. A fundamental question concerns how to compare lipid bilayer simulations, limited in both the time and spatial scales, to experiments performed on huge multibilayer systems.
Experimental diffraction studies of fluid bilayers are performed using oriented multilamellar arrays whose diffraction pattern is characterized by a series of 5–10 sharp Bragg reflections along the normal to the stack of fluid membranes. Fourier reconstruction from the observed structure factors yields the one-dimensional transbilayer scattering-length distribution or electron density of the single-bilayer unit cell. Wiener and White (1992b) developed a joint refinement method that combines x-ray and neutron diffraction data for decomposing the overall scattering-length density profile of a dioleoylphosphatidylcholine (DOPC) bilayer at low hydration into subprofiles, representing the transbilayer distributions of molecular-component groups such as phosphate, choline, carbonyl, etc. The detailed structural image obtained by Wiener and White (1992b) for this system represents an excellent reference for validation of bilayer simulation data. However, these subprofiles are derived quantities that depend upon the assumption that the component groups are described by Gaussian probability distribution functions. Unless heavy-atom, isomorphous labeling of specific component groups is used (Wiener et al., 1991; Wiener and White, 1991b), the only property that is determined directly in a diffraction experiment is the overall scattering-density profile—or equivalently the observed structure factors. With this in mind, one can consider two steps for comparing simulated to experimental structural data. First, compare the overall scattering-density profile computed from simulation and then, once agreement is attained within experimental error, the simulations can be used to scrutinize models for the individual component distributions.
Previous work (Chiu et al., 1999; Feller et al., 1997b; Tu et al., 1995a) has reported comparisons of simulated and experimental density profiles. In these studies, the simulated bilayer x-ray density profiles were determined either by placing the appropriate number of electrons at the sites of the atomic nuclei (Chiu et al., 1999; Feller et al., 1997b) or by placing a Gaussian distribution of electrons on each atomic center with a standard deviation equal to the van der Waals radius (Tu et al., 1995a), and then binning the transmembrane axis over the entire simulation cell. Although the electron density profiles obtained using a binning procedure reproduce qualitatively the main features of the transbilayer electron distribution, such as the headgroup peaks and terminal methyl trough, the underlying models on which they are based precludes rigorous quantitative comparison with experiment (see Results). Furthermore, the simple fact that different binning methods exist complicates the comparison of simulation data with other simulations and experiments, which suggests a need for a standard, rigorous method for computing bilayer density profiles.
We report here a model-independent method that allows one to compare unambiguously the simulated and experimental bilayer structures both in reciprocal space and in real space via Fourier reconstruction. Sachs et al. (2004) have also investigated the reciprocal space properties of lipid bilayers. However, the calculated reciprocal-space data were generated using a binned electron density with electrons centered at the atomic positions, a model that we wished to avoid. The method presented here mimics the analysis of diffraction data that is done by experimentalists to determine the structure of membranes: A series of discrete structure factors as well as the continuous structure factor set are first determined. The density profile is then obtained by Fourier reconstruction of the discrete structure factors. This protocol is applied in the present article to study the accuracy of lipid membrane simulations using current force fields and simulation methodology. A key issue is that one must also account for the uncertainties in both the experimental and simulated structure factors and profiles. A procedure for doing this is described in Methods, below. The Wiener and White bilayer (1992b) (DOPC at 66% relative humidity, corresponding to 5.4 H2O/lipid) was chosen for simulation, because its structure is very well established experimentally. We find that current force fields are not yet up to the task of predicting the DOPC bilayer structure within experimental error.
THEORY
Background
We begin with a brief summary of bilayer diffraction theory based on the comprehensive review by Franks and Levine (1981). Diffraction studies of fluid membranes are frequently performed using oriented multilamellar arrays of bilayers with a repeat distance d along the bilayer normal, corresponding to the Bragg spacing determined in a one-dimensional diffraction experiment. (The high thermal disorder of fluid bilayers precludes Bragg diffraction parallel to the bilayer planes.) Each bilayer may be considered as a planar array of unit cells of cross-sectional area A and thickness d. For a bilayer composed of a single lipid species, each unit cell will contain two lipids and their associated waters of hydration. The time-averaged projection of the unit-cell electron density on to the z axis (bilayer normal) yields an electron density profile ρe(z). Equivalently, one may also construct scattering-length density profiles ρs(z) by simply rescaling ρe(z), because each electron has a scattering length of mc2/e2 at small scattering angles. We use scattering-length density profiles in this article so that the diffraction formalism can also be used for neutron diffraction by replacing electron scattering lengths with neutron scattering lengths.
An important parameter is the average scattering length ρs0(z) of the unit cell, which is the total scattering length bcell divided by the unit cell volume Vcell = d × A. The total scattering length is given by  , where bi is the scattering length of each of the i-atoms in the cell. Because A is not easily determined (Tristram-Nagle et al., 1998), Jacobs and White (1989) introduced the per-lipid scattering-length density ρ(z) = ρs0(z) × A. This per-lipid scale is used throughout this article.
The scattering-length density of a bilayer unit cell is the principal objective of lamellar diffraction experiments. The amplitude of a scattered wave from a point z is proportional to ρ(z), and its phase relative to the origin is 2πsz, where s is the wave vector. The positions of reflections in the diffraction pattern are described using s as a coordinate, given by s = 2sin(θ)/λ where θ is the scattering angle and λ is the wavelength of the x-rays or neutrons. The total amplitude scattered from the whole membrane array is obtained by integrating over the thickness of the array using
 |
(1) |
where FT(s) is called the structure factor or structure amplitude of the stack of membranes. Assuming a stack of N identical membranes, the electron or scattering-length density distribution will then be periodic in z, with repeat distance d, i.e.,
 |
(2) |
The diffraction pattern, represented mathematically by Eq. 1, can therefore be rewritten as a sum of integrals that can be factorized to give
 |
(3) |
where
 |
(4) |
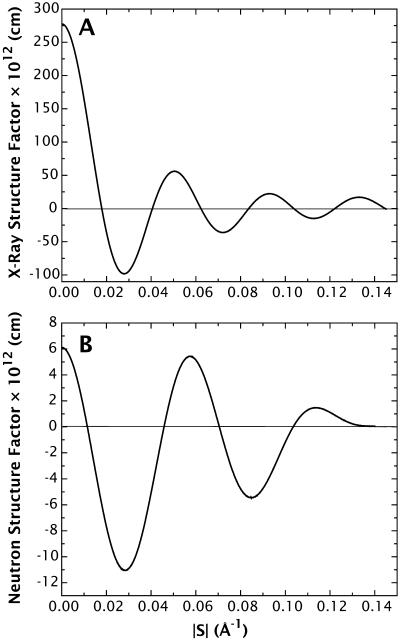
is the structure factor of an isolated bilayer. Because Eq. 4 has the form of a Fourier integral, F(s) is referred to as the continuous Fourier transform. (Some authors, mainly those studying intermembrane interactions, often call this function the bilayer form factor and reserve the term structure factor for the spatial array of bilayers.) If we were able to perform a diffraction experiment on a single isolated bilayer, the observed intensity on the detector I(s) would be a continuous function proportional to the square of F(s). For illustrative purposes, Fig. 2 shows the experimental x-ray and neutron continuous Fourier transform corresponding to the Wiener and White (1992b) DOPC bilayer.
FIGURE 2.
Experimental x-ray (A) and neutron (B) continuous Fourier transforms of a DOPC bilayer at 5.4 H2O/lipid. The structure factors are computed on a per-lipid basis or the so-called relative absolute scale (Wiener and White, 1992b). These functions were obtained from the experimental structure factors reported in Table 1 of Wiener and White (1992b).
The geometric sum in Eq. 3 represents the phase differences introduced into the scattered waves by the spatial separation of the repeat units. This sum is a geometric series, called the lattice or interference function, G(s),
 |
(5) |
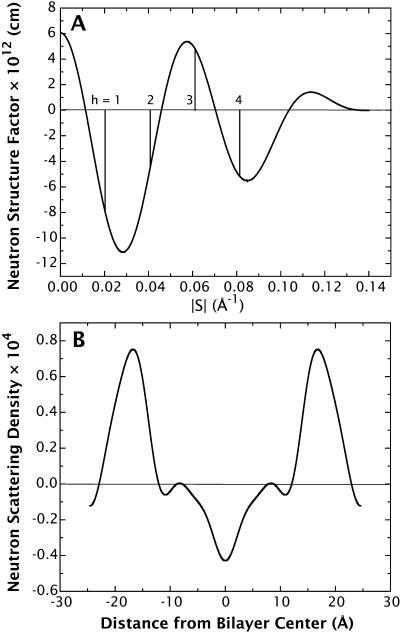
The interference function has peaks in reciprocal space at positions where reflections are predicted to occur by Bragg's law. Thus, the product of F(s) by a perfect-lattice function G(s), consisting of a series of delta functions spaced at intervals of d along the z axis, causes the continuous Fourier transform to be sampled at s = h/d (see Fig. 3 A).
FIGURE 3.
The relationship between the continuous Fourier transform of a single bilayer and its scattering-length density profile. (A) Experimental neutron continuous Fourier transform of the DOPC bilayer at 5.4 H2O/lipid (same as in Fig. 1 B), determined from the neutron structure factors reported in Table 1 of Wiener and White (1992b) and Eq. 10. Schematically, the vertical lines represent the perfect-lattice function that samples the continuous structure factor at multiples of the Bragg condition h/d. (B) Experimental neutron scattering-density profile corresponding to the continuous structure factor in A computed using Eq. 6.
Assuming the bilayer profile is centrosymmetric, i.e., ρ(z) = ρ(−z), the x-ray or neutron scattering-length density function can be determined via Fourier series reconstruction from the discrete structure factors F(h) on the absolute scale using
 |
(6) |
where hmax is the order of the highest observable harmonic (Wiener and White, 1991a) and F(0) is the total scattering-length in the unit cell:  Fig. 3 B shows the neutron scattering-density profile of the Wiener and White (1992b) DOPC bilayer obtained by Fourier reconstruction of the mean experimental structure factors.
This lamellar diffraction theory provides the basis for comparing simulation and diffraction data. For a comparison in reciprocal space, we compare both the discrete and continuous structure factors, i.e., the product F(s) × G(s) and F(s), respectively. For a real space comparison, the density profiles are obtained via Fourier reconstruction from the discrete structure factors.
Determination of the bilayer structure from MD simulation data
The continuous bilayer structure factor that defines both the amplitude and phase of scattered x-ray radiation by the atoms of a unit cell is
 |
(7) |
(Warren, 1969), where fi(s) represents the atomic form factor for atom i, which is given by the Fourier transform of the atomic electron density. Over the years, these functions have been calculated for all the atoms from the available atomic wave functions and fitted to a nine-parameter equation by Cromer and Mann (1968), as
 |
(8) |
In this equation, aj, bj, and c are fitting parameters tabulated in the International Tables of Crystallography (Maslen et al., 1999). The atomic form factor f(s) is given in units of the Thompson scattering length, r0 = e2/4πɛ0mc2 = 2.81 × 10⁻¹³ cm. Eq. 7 can be written in terms of the strength of the scattering of x rays by electrons, i.e., the scattering length bxi(s), which equals r0fi(s). Eq. 7 can thus be written for the i atoms in the unit cell as
 |
(9) |
For neutrons with wavelengths corresponding to interatomic distances, the atomic form factor is not dependent on the wave-vector, because it is a point particle on the length scale of neutron wavelength. In this case, the structure factor of the bilayer is given by
 |
(10) |
where bni is the neutron scattering length of atom i, which can be found in tables for most atoms (Sears, 1986). As in the experiment, the simulated system consists of a periodic array of unit cells, so that the discrete structure factors F(h) can also be derived mathematically by multiplying the continuous Fourier transform (Eq. 9 or Eq. 10) with a perfect-lattice function consisting of a series of delta functions spaced at intervals of d along the bilayer normal, i.e., the Fourier transform is only sampled at multiples of the Bragg condition h/d. From the discrete structure factors F(h), the simulated x-ray or neutron density profiles can be determined by means of Eq. 6. We used this protocol to determine all of the simulated x-ray and neutron scattering-density profiles reported here.
METHODS
MD simulations were carried out using periodic boundary conditions at constant pressure (1 atm), temperature (296 K), and particle number (NPT). A water/lipid ratio of 5.4 waters/DOPC was used in the simulations, which is the same as that of the experimental system extensively studied by Wiener and White (1992b). The centers of mass of all configurations were recentered to Z = 0 (midplane of the bilayer) before analysis to remove inevitable center-of-mass drift. Specific details for each simulation are described below.
CHARMM force-field simulation
The NAMD molecular dynamics program (Kalé et al., 1999) version 2.5 was used with the CHARMM27 force-field parameters (Feller et al., 1997b; Feller and MacKerell, 2000; Schlenkrich et al., 1996) to simulate a cell containing 288 DOPC molecules (forming two 12×12 leaflets) and 1544 water molecules for a total of 44,376 atoms. The temperature was maintained at 296 K by means of Langevin dynamics using a collision frequency of 1/ps. A fully flexible cell constrained to orthorhombic symmetry at constant pressure (1 atm) was employed by means of the Nosé-Hoover Langevin Piston algorithm (Tu et al., 1995a; Feller et al., 1995) as implemented in the NAMD software package. Initial coordinates were taken from a previously equilibrated MD simulation (Feller et al., 1997b). The van der Waals interactions were switched smoothly to zero over the region 10–11 Å and electrostatic interactions were included via the smooth particle-mesh Ewald summation (Essmann et al., 1995). A neighbor list, used for calculating the nonbonded interactions, was kept to 12.5 Å and updated every eight steps. The impulse-based Verlet-I/r-RESPA method (Tuckerman and Berne, 1992; Grubmüller et al., 1991) was used to perform multiple time-stepping: 4 fs for the long-range electrostatic forces, 2 fs for short-range nonbonded forces, and 1 fs for bonded forces. Data for analysis were taken between 8 and 18 ns of the simulation, where the area/lipid and d-spacing for the simulation were stable with time (see Results).
For comparison to the CHARMM27 simulation, a simulation using the CHARMM22 force field was also performed in the same manner as described above. However, the system size was four times smaller (72 DOPC molecules and 386 waters). Another CHARMM27 simulation at this smaller size was also performed for 16 ns (d-spacing: 50.3 ± 0.3 Å, area/lipid: 56.9 ± 0.4 Å2). The observed density profiles were essentially the same as those obtained from the larger CHARMM27 system, making a comparison between smaller CHARMM22 simulation and the reported CHARMM27 simulation appropriate, at least at the qualitative level.
GROMACS force-field simulation
The GROMACS software package (Berendsen et al., 1995) version 3.1.4 was used with a GROMOS lipid force field including parameters described in Berger et al. (1997). A fully flexible simulation cell (constrained to orthorhombic symmetry) containing 288 DOPC molecules (two 12×12 leaflets) and 1554 water molecules was simulated at NPT conditions using Berendsen pressure and temperature coupling (Berendsen et al., 1984) at 1 atm and 296 K, respectively. Due to the united-atom model implemented in the force field used here, each DOPC molecule contained 54 atoms (compared to 138 atoms for the CHARMM27 force field), and each water molecule contained three atoms, for a total of 20,214 atoms in the system. A 10 Å cutoff was used for the neighbor-list, Lennard-Jones, and Coulombic cutoff radii, and electrostatics were calculated using the smooth particle-mesh Ewald technique (Essmann et al., 1995). The simulation was started from the end of a previous simulation of this system. The d-spacing and area/lipid values were stable across the 10-ns simulation, so the entire simulation was used for subsequent analysis (see Results).
Error analysis
The experimentally determined structure factors for DOPC bilayers at 66% RH have experimental uncertainties that have been reported by Wiener and White (1992b). As a result, the bilayer scattering-length density determined from the structure factors has uncertainties associated with it. Because any set of structure factors that falls within the observed experimental errors gives a valid profile, there must be a family of profiles that are equally satisfactory. To give a sense of the observable spread of this family, Wiener and White (1991a; 1992b) adopted a statistical Monte Carlo procedure in which the Box-Muller algorithm (Press et al., 1989) was used to generate hundreds of sets of mock-structure factors whose collective standard deviations agreed with the observed experimental errors. The family of profiles constructed from the mock structure factors provides a confidence band for the observed (mean) profile. (For examples, see Methods, Fig. 2, this article, and Fig. 5 of Wiener and White, 1992b.)
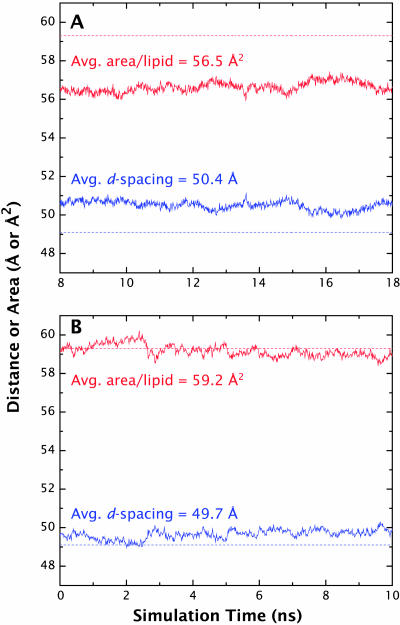
FIGURE 5.
Evolution of the d-spacing (blue) and area/lipid (red) values for the simulations relative to the experimentally determined values. (A) The CHARMM27 simulation yielded an average d-spacing value of 50.4 Å, ∼1 Å above the experimental value of 49.1 Å and area/lipid of 56.5 Å2, which is below the experimental value of 59.3 Å2 by ∼3 Å2. (B) The d-spacing and area/lipid values for the GROMACS simulations are closer to the experimental values at 49.7 Å and 59.2 Å2, respectively.
Similarly, because of the system dynamics, a family of profiles (structure factors) is required to describe the results of MD simulations. If a simulation is in equilibrium, one can compute structure factors for a collection of bilayer configurations drawn from the simulation at regular time intervals. The mean and standard deviations of the collection provide, in principle, estimates of the mean bilayer structure and the fluctuations of the bilayer around the mean. The difficulty is that, on short timescales, bilayer configurations are highly correlated, and thus unsuitable for statistical analysis. The sampling interval must therefore be long enough to assure a collection of uncorrelated bilayer configurations. To establish the minimum sampling interval that yields a collection of uncorrelated structure factors, we used the so-called blocking method, described in detail by Flyvbjerg and Petersen (1989). The application of the method to our computed neutron structure factors indicated that our MD trajectories became uncorrelated after ∼1 ns (see Results). That is, a sampling interval of 1 ns produced a collection of uncorrelated configurations from which the variance of the mean could be obtained using standard statistical protocols. (In the case of correlated data sets, a more sophisticated analysis must be made to determine the error bars of the structure factors (Allen and Tildesley, 1987)).
The comparison of the simulated and experimental structure factors and scattering-density profiles is straightforward using this method. We must emphasize, however, that the number of structure factors computed for the simulation must equal the number of structure factors observed experimentally. Given that condition, if the mean profile of the simulation falls within the confidence band of the experimental profile, then one can declare that the simulated bilayer agrees with the experimental measurements within experimental error.
RESULTS
Comparison of different methods for calculating density profiles
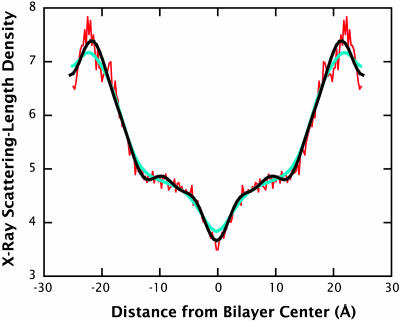
Density profiles calculated from membrane simulations have generally used a binning procedure to produce electronic densities directly from bilayer configurations by assuming either that the electrons are at the atomic centers or that they are normally distributed about them. How do these two approaches compare to the structure-factor approach used in this article? To answer that question, we computed scattering-density profiles from the CHARMM27 simulation using the two approaches, and compared them to a profile obtained by means of Fourier reconstruction from the structure factors (Fig. 4). Even though the three methods used were obtained using exactly the same MD data, the resulting profiles differ significantly. The profile obtained by assuming all electron density is located at the atomic centers produces a spiky profile (red curve) that only qualitatively resembles an experimentally determined profile. On the other hand, the profile calculated using Gaussian-distributed electron densities produces a smooth profile (blue curve), but structural features such as the peak and trough intensities are also smoothed out. The exact shape of the profile depends, however, on the assumed width of the Gaussian smoothing function. Here we have used a Gaussian with a half-width equal to each atom's van der Waals radius. The profile obtained via Fourier reconstruction of the structure factors (black curve) captures the smoothness of an experimental profile without any further assumptions, such as the width of the Gaussian smoothing function.
FIGURE 4.
X-ray scattering-length density profiles calculated for a DOPC bilayer at 5.4 waters/lipid by three different methods. Qualitatively, the profiles show the same general structural features, but they differ at the quantitative level. The profile in red was calculated assuming an electron density located at the atomic center of each atom, whereas the blue profile was calculated using a Gaussian electron distribution around each atom. The exact shape of the profile obtained by in this way depends on the width of the Gaussian chosen. Here we have used a half-width equal to the van der Waals radius of each atom. The profile in black was calculated by Fourier reconstruction of the set of structure factors calculated for this system. The advantage of this method is that no decision is required about how to smooth the profile, as in the Gaussian-smoothing case.
Repeat distance and area per lipid
The time evolution of the repeat-distance (d) and surface area per lipid (A) during the constant NPT simulations are shown in Fig. 5 A (CHARMM27) and Fig. 5 B (GROMACS). These data show that the GROMACS bilayer was stable over the entire course of the simulation, which allowed us to analyze the whole 10-ns run. The CHARMM 27 simulation, on the other hand, took ∼8 ns to reach equilibrium (i.e., stable values of d and A). Our analysis was therefore done from t = 8 ns to t = 18 ns. The experimentally determined values of d and A for DOPC at 66% RH are 49.1 ± 0.3 Å (Jacobs and White, 1989) and 59.3 ± 0.7 Å2 (Wiener and White, 1992a), respectively. The CHARMM27 simulation resulted in an average d-spacing that was too high (50.4 ± 0.24 Å) and an area/lipid that was too low (56.5 ± 0.27 Å2), suggestive of a bilayer that is less fluid than observed experimentally. The GROMACS simulation, on the other hand, yielded values that agreed reasonably well with experiment within experimental uncertainties: d = 49.7 ± 0.24 Å and A = 59.2 ± 0.31 Å2.
Sampling interval of MD data sets
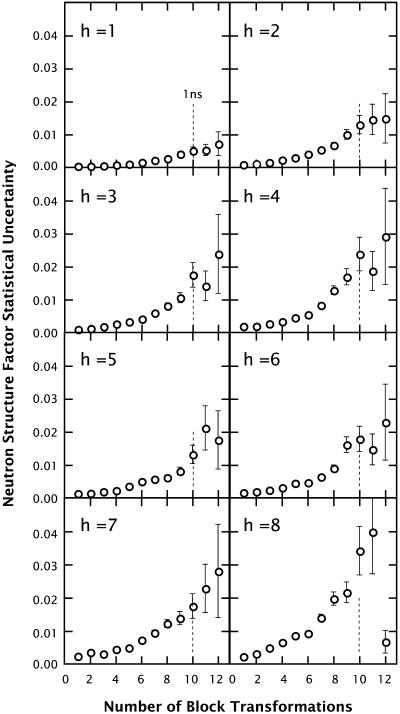
To determine the appropriate sampling interval for producing a collection of statistically independent structure factors, we performed a blocking-transformation analysis (Flyvbjerg and Petersen, 1989) on the neutron structure factors calculated from the CHARMM27 simulation (see Methods). Fig. 6 shows the results obtained from this analysis for all eight orders of diffraction. Structure factors were calculated for the CHARMM27 simulation at 1-ps intervals using the same trajectory used for the structure analyses. For all of the orders, a plateau in the plots can be seen at ∼ 210 transformations, indicating that sets of uncorrelated structure factors can be obtained on the 1-ns timescale (dashed vertical lines in Fig. 6).
FIGURE 6.
Plots of the statistical uncertainties (standard deviations) for each computed neutron structure factor versus the number of blocking transformations, calculated using the method of Flyvbjerg and Petersen (1989). The molecular trajectories from the CHARMM27 simulation were used for computing the structure factors. The basic sampling interval used to derive these plots was 1 ps. Overall, the plots reveal a plateau at ∼210 transformations, corresponding to a correlation time of ∼1 ns (vertical dotted lines). Consequently, a collection of bilayer configurations for statistical analysis was constructed by sampling the bilayer configuration at 1-ns intervals (see text).
Correlations in bilayer structure from simulation trajectories have been previously investigated, often by studying the motions of individual atoms (such as the headgroup phosphate atom), and then assuming the correlations for the individual atoms are characteristic of the entire system. The advantage of using structure factors is that they are characteristic of the overall system structure and thus give a better measure of the overall structural correlations than correlations due to individual atoms.
Structure factors
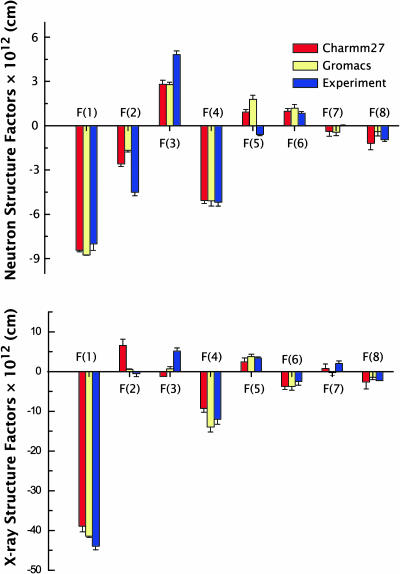
The simulated x-ray and neutron structure factors, determined from Eqs. 9 and 10, respectively, are compared with the experimental values (Wiener and White, 1992b) in Fig. 7 using the data presented in Tables 1 and 2. The uncertainties for the simulation structure factors were determined as described in Methods by computing a set of structure factors F(h) at 1 ns intervals (see above) during the MD simulations and averaging over the resulting collection of configurations. This yielded sets of structure factors:  , where σF is the standard deviation of F(h). Overall, the most important differences are observed in the second and third orders, particularly in the x-ray data. As the first four orders are most strongly related to the main features of the density profile (depth of the midplane trough and distance between headgroups), the data imply significant structural discrepancies between simulations and experiment. The extent of these differences is more apparent in the scattering-length density profiles.
FIGURE 7.
Comparisons of the simulated x-ray and neutron structure factors with the experimentally determined values (Tables 1 and 2). The uncertainties for the simulated structure factors correspond to the standard deviation of a set of structure factors computed at 1-ns intervals (see Fig. 6 and text). Overall, the most salient differences are observed in the second- and third-orders, particularly in the x-ray data.
TABLE 1.
X-ray structure factors of DOPC bilayers (5.4 waters/lipid) on the per-lipid scale (Hristova and White, 1998) in units of 10−12 cm
| Order (h) | CHARMM 27 | GROMACS | Experiment |
|---|---|---|---|
| 1 | −38.91 ± 1.35 | −41.40 ± 0.36 | −43.95 ± 0.88 |
| 2 | 6.53 ± 1.63 | 0.54 ± 0.23 | −0.52 (+0.52, −0.74) |
| 3 | −1.22 ± 1.32 | 0.69 ± 0.54 | 5.15 ± 0.80 |
| 4 | −9.22 ± 0.99 | −13.92 ± 1.24 | −11.97 ± 1.29 |
| 5 | 2.45 ± 0.92 | 3.74 ± 0.65 | 3.38 ± 0.32 |
| 6 | −3.70 ± 0.78 | −3.76 ± 0.88 | −2.47 ± 0.88 |
| 7 | 0.75 ± 1.08 | −0.24 ± 0.77 | 2.03 ± 0.65 |
| 8 | −2.6 ± 1.76 | −1.39 ± 0.63 | −2.24 ± 0.49 |
TABLE 2.
Neutron structure factors of DOPC (5.4 waters/lipid) on the per-lipid scale (Hristova and White, 1998) in units of 10−12 cm
| Order (h) | CHARMM27 | GROMACS | Experiment |
|---|---|---|---|
| 1 | −8.44 ± 0.098 | −8.76 ± 0.029 | −8.00 ± 0.44 |
| 2 | −2.58 ± 0.20 | −1.66 ± 0.12 | −4.51 ± 0.24 |
| 3 | 2.81 ± 0.28 | 2.78 ± 0.18 | 4.81 ± 0.25 |
| 4 | −5.07 ± 0.20 | −5.08 ± 0.37 | −5.18 ± 0.29 |
| 5 | 0.92 ± 0.16 | 1.78 ± 0.28 | −0.59 ± 0.08 |
| 6 | 0.98 ± 0.18 | 1.19 ± 0.25 | 0.84 ± 0.11 |
| 7 | −0.38 ± 0.34 | −0.44 ± 0.23 | 0.0 ± 0.08 |
| 8 | −1.19 ± 0.46 | −0.40 ± 0.28 | −0.94 ± 0.14 |
Scattering-length density profiles
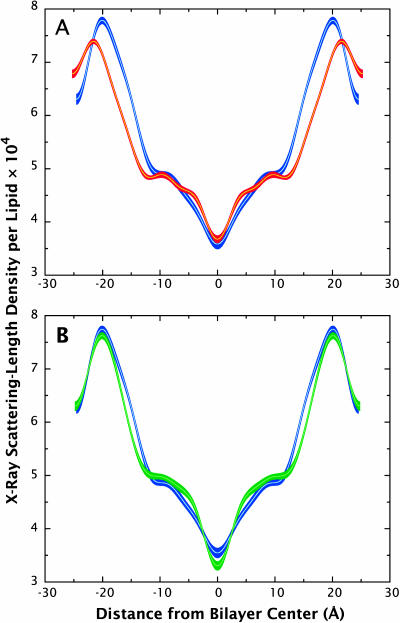
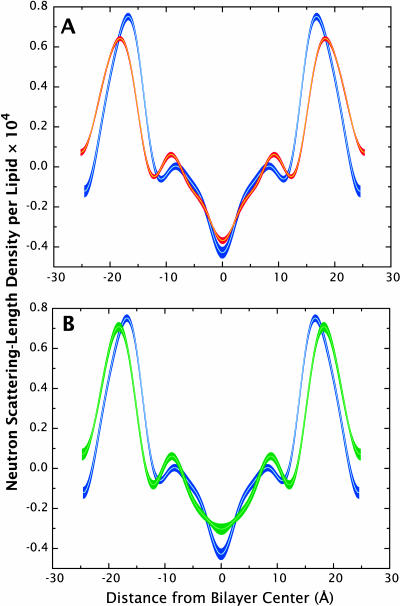
The structure factors shown in Tables 1 and 2 were used to compute profiles by means of Eq. 6. The d-spacings used were the natural ones for the data set (49.1 Å for the experimental data, 50.4 Å for CHARMM27, and 49.7 Å for GROMACS). The associated uncertainties of the structure factors (σF) and the Box-Muller algorithm (Press et al., 1989) were then used to define the confidence bands of the profiles (see Methods). The simulated x-ray and neutron scattering densities are compared to their corresponding experimental profiles in Figs. 8 A and 9 A (CHARMM27) and Figs. 8 B and 9 B (GROMACS).
FIGURE 8.
Comparisons of x-ray scattering-density profiles for the CHARMM27 (red) and GROMACS (green) simulations with experimental profiles (blue). The scattering-length density profiles were constructed by inverting the structure factors calculated for the simulations from reciprocal space to real space. The line thickness for the profiles indicate the margin of error associated with the data/measurements. (A) The headgroup peaks in the CHARMM27 simulations are farther apart compared to the experimental values due in part to the larger average d-spacing of the simulation. The agreement of the profile is relatively good within the first 10 Å from the bilayer center, but becomes less accurate near the headgroup region. (B) The scattering-length density profile for the GROMACS simulation shows good agreement with the experimental data throughout the profile. The headgroup peaks are only slightly farther apart and the trough goes a bit deeper than the experimental profile.
FIGURE 9.
Neutron scattering-length density profiles for the CHARMM27 (red) and GROMACS (green) simulations compared to experimental profiles (blue). Like the x-ray scattering-length density profiles, the neutron scattering-density profiles were constructed via structure-factor inversion to real space densities. The errors of the calculated data or experimental measurements are incorporated into the line thickness of the profiles. The CHARMM27 neutron scattering-density profile (A) again shows reasonable agreement with the experimental profile in the region within <10 Å of the bilayer center, but begins to deviate outside of this region. As in the x-ray density profile, a wider peak spacing is seen in the neutron profile as well. The GROMACS neutron density profile (B) also shows wider peak spacing and more pronounced shoulders compared to experiment.
Qualitatively, the simulated scattering-density profiles reproduce the main features of the experimental profiles. Quantitatively, however, none of them agree with the experimentally determined profiles within experimental error. The CHARMM27 force field yields x-ray density headgroup peaks that are shifted ∼1–2 Å away from the bilayer center, which is partially due to the bigger simulated repeat distance compared to the experiment and to the shift of the simulated phosphate moiety position away from the bilayer center (see below). The trough region, between ±10 Å, however, is well described by the CHARMM27 force field. The GROMACS MD simulation, where the repeat distance is very close to the experiment, produces headgroup peak positions that are in good agreement with the x-ray density profile, although the peak widths are slightly smaller than the experimental values. As for the CHARMM27 results, the trough region for the GROMACS simulation shows good agreement with experiment. Both the CHARMM27 and the GROMACS neutron density profiles show shifted headgroup peaks away from the bilayer center, which is consistent with the difference observed in the simulated position of the carbonyl distribution (see below). The differences in position between the headgroup peaks and the x-ray and neutron profiles arise from different sensitivities to various regions of the phospholipid molecule. X rays scatter mostly from electron-dense regions so that headgroup features (at ∼±20 Å from the midplane) are dominated by the phosphate moiety. Neutrons, on the other hand, scatter most strongly from the carbonyl groups of phospholipids due to the lack of hydrogens, which have negative coherent scattering lengths.
Continuous Fourier transform
The simulated and experimental continuous Fourier transforms were calculated from the sets of structure factors shown in Tables 1 and 2 using the Shannon (1949) sampling theorem,
 |
(11) |
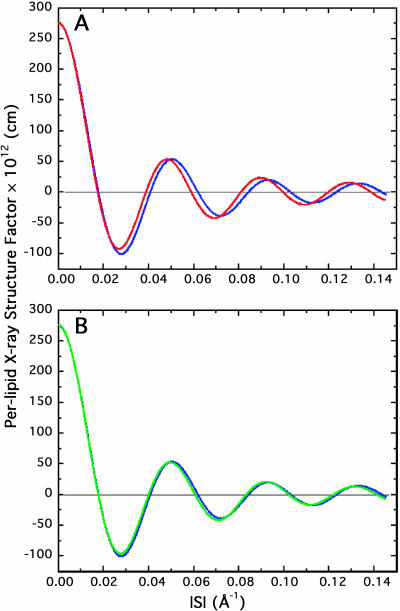
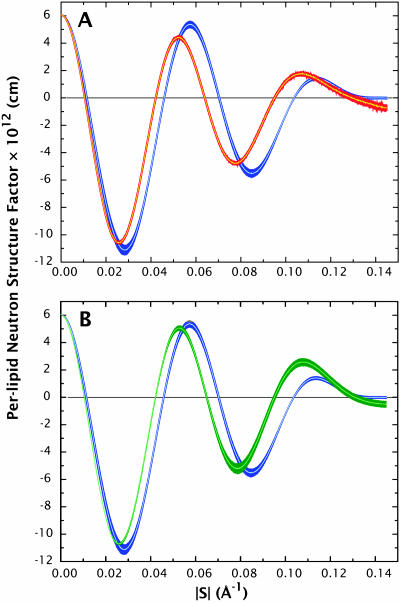
The confidence bands of both the simulated and experimental continuous Fourier transforms were determined in the same way as for the density profiles, i.e., using the Box-Muller method (Shannon, 1949). The simulated x-ray and neutron transforms are compared to experiment in Figs. 10 A and 11 A (CHARMM27) and Figs. 10 B and 11 B (GROMACS). As in the case of the density profiles (above), the simulated and experimental continuous structure factors compare qualitatively well, but neither of the force fields reproduce the experimental data within experimental error. In all the cases, the simulated continuous Fourier transform oscillations are shifted toward smaller wave vectors, due to the overestimation of the bilayer thickness.
FIGURE 10.
X-ray continuous Fourier transforms for the CHARMM27 (red) and GROMACS (green) simulations versus experiment (blue). (A) The CHARMM27 continuous transform shows subtle but important deviations from the experimental transform. The simulation profile is shifted slightly to smaller wave vectors compared to the experimental profile, due in part to the larger d-spacing and headgroup-to-headgroup thickness associated with the simulation. (B) The same trend is observed with the GROMACS simulation, although agreement with the experiment is better, which is also evident in the scattering-length density profile. The subtle differences between the two simulated continuous transforms result in substantial differences in the real-space density profiles.
FIGURE 11.
Neutron continuous Fourier transforms for the CHARMM27 (red) and GROMACS (green) simulations compared with experimental transforms (blue). (A) Again, the CHARMM27 simulation transform is right-shifted toward smaller wave-vectors. (B) The GROMACS neutron transform is also shifted to smaller wave-vectors depth and the height of the last peak is also noticeably larger than experiment.
Means and widths of component distributions
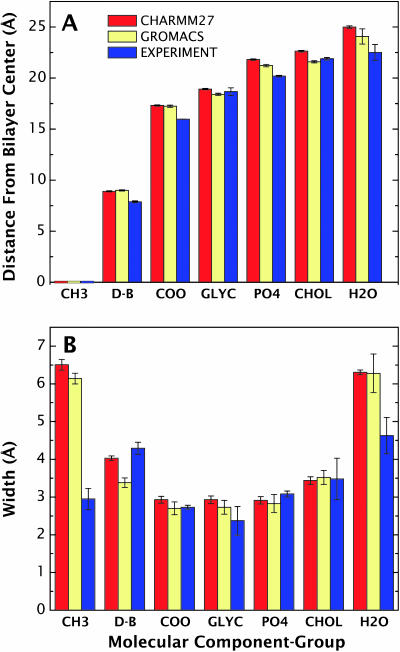
To explore further the origins of the differences between simulation and experiment, we determined Gaussian transbilayer distributions (mean position and width) of the different DOPC quasimolecular component groups—including choline, phosphate, glycerol, carbonyls, double-bonds, terminal methyls, water, and methylenes—from the means and standard deviations of the groups in the simulations. The mean positions and 1/e half-widths of each group determined from the experimental data are compared to those computed directly from the simulations (CHARMM27 and GROMACS) in Fig. 12, A and B, respectively. Whereas the simulated methyl and glycerol mean positions agree with the Wiener and White data within the experimental error, the other distributions lie ∼1–2 Å further from the bilayer center, and are consequently outside experimental error bars.
FIGURE 12.
Comparisons of the mean positions and widths of the molecular component groups in DOPC and water for the CHARMM27 and GROMACS simulations with experimentally determined values. (A) The CHARMM27 simulation mean positions are slightly better than the GROMACS values for the double bond, carbonyl, and glycerol groups, and slightly worse for the phosphate, choline, and water groups. (B) The differences between the simulations and experiments are more pronounced in the molecular component widths. The biggest difference is seen in the terminal methyl group of DOPC, where the simulation widths are nearly twice as large as the experimentally determined value. Such a difference suggests that additional experimental studies of this region of the bilayer are needed.
There is an excellent agreement between the simulated and the joint refinement results for the widths of the carbonyl, glycerol, phosphate, and choline groups, but the simulation results for the water and the double-bond widths show significant discrepancies with respect to the experiment. These differences, however, are not as dramatic as the difference observed between the simulated and experimental terminal methyl group width. Because the methyl distribution was determined in a very indirect way by Wiener and White (1992b) and because both force fields predict a much wider methyl distribution, it is possible that the experimental values are too narrow. Neutron diffraction determinations of the methyl distribution using specific deuteration will resolve the issue.
Differences between CHARMM22 and CHARMM27 results
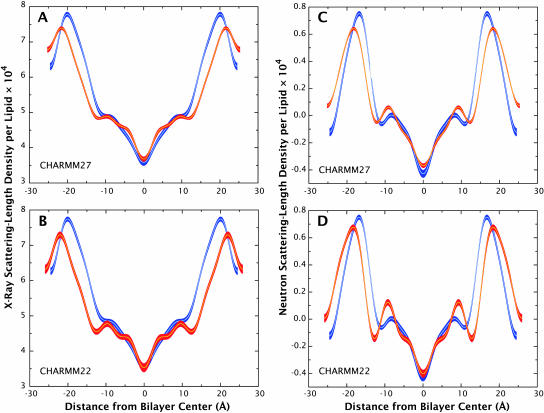
A comparison of the CHARMM27 and CHARMM22 simulations shows that the average d-spacing of the CHARMM22 simulation, 51.8 Å, is >1.6 Å larger than the CHARMM27 simulation value, and >2.5 Å above the experimental value (49.1 Å). The average area/lipid in the CHARMM22 simulation, 55.4 Å, is smaller than that of the CHARMM27 simulation value and experimental value. As a result of the larger d-spacing, the overall x-ray distribution for the CHARMM22 simulation is generally broader than the corresponding CHARMM27 and experimental distributions, as shown in Fig. 13, A and B. More fine-structure is also seen in the CHARMM22 x-ray density profile, especially near the double-bond region of the lipid tails. Fig. 13, C and D, show the neutron scattering-length density profile of the CHARMM27 and CHARMM22 simulations, respectively, along with experimental profiles. Both the CHARMM22 and CHARMM27 profiles show a larger headgroup peak distance compared to experiment, but both describe the region near the center of the bilayer fairly accurately.
FIGURE 13.
Comparison of x-ray and neutron density profiles of the CHARMM22 and CHARMM27 simulations (red) with experiment (blue). The x-ray density profile for the CHARMM27 simulation (A) shows better agreement with experiment compared to the CHARMM22 results (B). However, both simulations show a wider headgroup peak distance compared to the experimental profile. The CHARMM27 simulation (C) also shows better agreement for the CHARMM22 neutron density profile (D). The differences in the scattering-length density profiles from the CHARMM27 and CHARMM22 simulations are small, but given that the d-spacing and area/lipid values as well as the overall x-ray and neutron scattering-length density profiles are closer to experiment for the CHARMM27 simulation, this force field as a whole reproduced experimental results better than the older CHARMM22 force field.
In general, the CHARMM27 results show closer agreement with experiment, which can be seen through the better d-spacing and area/lipid values, and more accurate density profiles. The CHARMM27 force field thus shows definite improvement in structure of the bilayer system studied here versus the older CHARMM22 force field. Progress is being made in the development of realistic all-atom force fields, but they remain unable to produce bilayer structures that agree with experiment. The most general problem is that the areas/lipid are too small, as though the temperature of the bilayers is too low. The CHARMM27 force fields lessened, but did not eliminate, this effect.
DISCUSSION
Previous simulations of DOPC bilayers at various hydrations (Feller et al., 1997b; Chiu et al., 1999; Mashl et al., 2001) have been performed in the NPAT ensemble (constant mole number, pressure, area/lipid, temperature) in which the area/lipid is restrained about the experimentally determined value (Wiener and White, 1992b; Tristram-Nagle et al., 1998; Wiener et al., 1988). Results of these simulations show good agreement between the simulation cell parameters and the corresponding experimental values. However, to perform such simulations, one must have prior experimental knowledge of the area/lipid of the system being studied. Complicating matters, this parameter has been shown to vary greatly with lipid type (Nagle and Tristram-Nagle, 2001) and hydration level (Hristova and White, 1998; Nagle and Tristram-Nagle, 2001), so each system simulated at NPAT requires an area/lipid value specific for that system, which may not be available. Consequently, NPAT simulations will be of marginal value if simulations are to be used eventually in place of experimental analyses of new, unstudied bilayer systems, such as those containing mixtures of lipids and/or membrane proteins. Simulations performed in the NPT (constant mole number, pressure, and temperature) ensemble have the potential for accomplishing this objective, because, in principle, they do not require prior experimental information. Given perfect force fields and constant pressure and temperature algorithms, an NPT simulation should be adequate for reproducing accurate experimental results. We note that the barostat pressure used in bilayer simulations may depend upon system size (Roux, 1996; Jähnig, 1996; Feller and Pastor, 1996), but no general consensus has been reached yet on this issue. In any case, a method for the critical evaluation of NPT simulation protocols against experimental data is a necessary step in the perfection of force fields for lipid bilayers.
We have shown how to treat bilayer simulation data in the same manner as experimental data, by first computing the structure factors of the simulated membrane system, and then inverting them into real-space profiles via Fourier transformation. This type of analysis provides a consistent method, free of assumptions and models, for comparing simulation data directly to experimental results. Furthermore, the continuous transform that is obtained in the course of the analysis can also provide important information about the fit of the simulated data to experiments, because this function is directly linked to the raw experimental data and is hence a very strict judge of the quality of the simulation data.
To demonstrate the effectiveness of our reciprocal-space approach, we performed several MD simulations using two different, widely used, software packages and force fields: 1), The NAMD molecular dynamics program (Kalé et al., 1999) with the CHARMM22 and CHARMM27 all-atom potential energy functions (Feller et al., 1997b; Feller and MacKerell, 2000; Schlenkrich et al., 1996); and 2), the GROMACS software package (Berendsen et al., 1995) with the GROMOS force field (Berger et al., 1997). The CHARMM and GROMOS force fields use the same empirical functions to describe inter- and intramolecular interactions, but differ in the values used to parameterize the model. Furthermore, the CHARMM force field for lipids represents all atoms in the system whereas the GROMOS force field is based on a united-atom model in which the hydrogens on aliphatic carbons are not explicitly represented, but rather grouped together into a carbon/hydrogen atom that is parameterized in such a way as to characterize the corresponding group. An advantage of the united-atom model is that the total number of atoms in a lipid membrane system is greatly reduced, but at the cost of losing the atomistic details of the aliphatic hydrogens.
Application of the reciprocal-space evaluation method revealed that neither CHARMM27 nor GROMACS simulations run under NPT conditions led to bilayer simulations that agreed within experimental error with the experimentally determined structure of a DOPC bilayer in the fluid state. Both simulations describe certain aspects of the experimental data reasonably well. In both the x-ray and neutron profiles, the trough region is well described by both force fields. In the case of the GROMACS force field, the entire x-ray density, and continuous Fourier transform reproduces the experimental data very well, whereas the CHARMM27 simulation shows a better agreement with experiment in the neutron density profile, due in part to the lack of explicit hydrogens in the GROMACS force field. Nonetheless, differences between the simulations and experiment still exist. Specifically, the spacing between the headgroup region peaks is wider in both the CHARMM27 and GROMACS simulations for both the x-ray and neutron density profiles, although this difference is very slight for the GROMACS x-ray density profile. The neutron scattering-length density profiles and continuous Fourier transforms show clear differences compared to experiment for both simulations.
Before the development of the CHARMM27 force field for lipids, the CHARMM22 force field was commonly used for all-atom lipid membrane simulations (Schlenkrich et al., 1996). Although lipid membrane simulations performed using the CHARMM22 force field were able to reproduce many experimental quantities (Feller et al., 1997a,b; Venable et al., 1993; MacKerell, 1995; Woolf and Roux, 1994), some unexpected results concerning the lipid aliphatic tail conformations (Feller et al., 1997a) and headgroup densities were obtained (Tu et al., 1995b). The CHARMM22 force field was therefore reoptimized and developed into the CHARMM27 force field (Feller and MacKerell, 2000). Our comparison of the CHARMM27 and CHARMM22 force field results indicates that the CHARMM27 force field reproduces experimental data for the DOPC system better than the CHARMM22 force field, demonstrating that progress is being made with empirical force-field models. But our results show that further improvements are necessary.
Acknowledgments
The authors are grateful to Bert L. de Groot for providing the initial configuration files of the GROMACS simulations, and to Alfredo Freites and Simon Jaud and the other members of the TEMPO group for useful discussions. The program NAMD was developed by the Theoretical and Computational Biophysics Group at the Beckman Institute for Advanced Science and Technology at the University of Illinois at Urbana-Champaign.
Research was supported in part by National Institutes of Health grants GM68002, RR14812, and GM46823 (to S.H.W.) and by National Research Service Award No. 5 T15 LM00744 from the National Library of Medicine (to R.W.B.).
Francisco Castro-Roman's permanent address is Departamento de Física, Universidad de Sonora, Hermosillo 83000, Mexico.
References
- Allen, M. P., and D. J. Tildesley. 1987. Computer Simulation of Liquids. Oxford University Press, Oxford, UK.
- Berendsen, H. J. C., J. P. M. Postma, W. F. van Gunsteren, A. DiNola, and J. R. Haak. 1984. Molecular dynamics with coupling to an external bath. J. Chem. Phys. 81:3684–3690. [Google Scholar]
- Berendsen, H. J. C., D. van der Spoel, and R. van Drunen. 1995. GROMACS: a new message-passing parallel molecular dynamics implementation. Comp. Phys. Commun. 91:43–56. [Google Scholar]
- Berger, O., O. Edholm, and F. Jähnig. 1997. Molecular dynamics simulations of a fluid bilayer of dipalmitoylphosphatidylcholine at full hydration, constant pressure, and constant temperature. Biophys. J. 72:2002–2013. [DOI] [PMC free article] [PubMed] [Google Scholar]
- Chiu, S. W., E. Jakobsson, S. Subramaniam, and H. L. Scott. 1999. Combined Monte Carlo and molecular dynamics simulation of fully hydrated dioleyl and palmitoyl-oleyl phosphatidylcholine lipid bilayers. Biophys. J. 77:2462–2469. [DOI] [PMC free article] [PubMed] [Google Scholar]
- Cromer, D. T., and J. B. Mann. 1968. X-ray scattering factors computed from numerical Hartree-Fock wave functions. Acta Crystallogr. A. 24:321–324. [Google Scholar]
- Essmann, U., L. Perera, M. L. Berkowitz, T. Darden, H. Lee, and L. G. Pedersen. 1995. A smooth particle-mesh Ewald method. J. Chem. Phys. 103:8577–8593. [Google Scholar]
- Feller, S. E., and A. D. MacKerell, Jr. 2000. An improved empirical potential energy function for molecular simulations of phospholipids. J. Phys. Chem. B. 104:7510–7515. [Google Scholar]
- Feller, S. E., and R. W. Pastor. 1996. On simulating lipid bilayers with an applied surface tension: periodic boundary conditions and undulations. Biophys. J. 71:1350–1355. [DOI] [PMC free article] [PubMed] [Google Scholar]
- Feller, S. E., R. M. Venable, and R. W. Pastor. 1997a. Computer simulation of a DPPC phospholipid bilayer: structural changes as a function of molecular surface area. Langmuir. 13:6555–6561. [Google Scholar]
- Feller, S. E., D. X. Yin, R. W. Pastor, and A. D. MacKerell, Jr. 1997b. Molecular dynamics simulation of unsaturated lipid bilayers at low hydration: parameterization and comparison with diffraction studies. Biophys. J. 73:2269–2279. [DOI] [PMC free article] [PubMed] [Google Scholar]
- Feller, S. E., Y. Zhang, R. W. Pastor, and B. R. Brooks. 1995. Constant pressure molecular dynamics simulation: the Langevin piston method. J. Chem. Phys. 103:4613–4621. [Google Scholar]
- Flyvbjerg, H., and H. G. Petersen. 1989. Error estimates on averages of correlated data. J. Chem. Phys. 91:461–466. [Google Scholar]
- Franks, N. P., and Y. K. Levine. 1981. Low-angle x-ray diffraction. In Membrane Spectroscopy. E. Grell, editor. Springer-Verlag, Berlin, Germany. 437–487.
- Grubmüller, H., H. Heller, A. Windemuth, and K. Schulten. 1991. Generalized Verlet algorithm for efficient molecular dynamics simulations with long-range interactions. Mol. Simul. 6:121–142. [Google Scholar]
- Hristova, K., and S. H. White. 1998. Determination of the hydrocarbon core structure of fluid dioleoylphosphatidylcholine (DOPC) bilayers by x-ray diffraction using specific bromination of the double-bonds: effect of hydration. Biophys. J. 74:2419–2433. [DOI] [PMC free article] [PubMed] [Google Scholar]
- Jacobs, R. E., and S. H. White. 1989. The nature of the hydrophobic binding of small peptides at the bilayer interface: implications for the insertion of transbilayer helices. Biochemistry. 28:3421–3437. [DOI] [PubMed] [Google Scholar]
- Jähnig, F. 1996. What is the surface tension of a lipid bilayer membrane? Biophys. J. 71:1348–1349. [DOI] [PMC free article] [PubMed] [Google Scholar]
- Kalé, L., R. Skeel, M. Bhandarkar, R. Brunner, A. Gursoy, N. Krawetz, J. Phillips, A. Shinozaki, K. Varadarajan, and K. Schulten. 1999. NAMD2: greater scalability for parallel molecular dynamics. J. Comput. Phys. 151:283–312. [Google Scholar]
- MacKerell, A. D., Jr. 1995. Molecular dynamics simulation analysis of a sodium dodecyl sulfate micelle in aqueous solution: decreased fluidity of the micelle hydrocarbon interior. J. Phys. Chem. 99:1846–1855. [Google Scholar]
- Mashl, R. J., H. L. Scott, S. Subramaniam, and E. Jokobsson. 2001. Molecular simulation of dioleoylphosphatidylcholine lipid bilayers at differing levels of hydration. Biophys. J. 81:3005–3015. [DOI] [PMC free article] [PubMed] [Google Scholar]
- Maslen, E. N., A. G. Fox, and M. A. O'Keefe. 1999. Interpretation of diffracted intensities (6.1). In International Table for Crystallography. A.J.C. Wilson and E. Prince, editors. Kluwer Academic Publishers, Dordrecht, The Netherlands. 547–584.
- McIntosh, T. J. 1990. X-ray diffraction analysis of membrane lipids. In Molecular Description of Biological Membrane by Computer-Aided Conformational Analysis. R. Brasseur, editor. CRC Press, Boca Raton, FL. 241–266.
- Nagle, J. F., and S. Tristram-Nagle. 2001. Structure of lipid bilayers. Biochim. Biophys. Acta. 1469:159–195. [DOI] [PMC free article] [PubMed] [Google Scholar]
- Press, W. H., B. P. Flannery, S. A. Teukolsky, and W. T. Vetterling. 1989. Numerical Recipes. The Art of Scientific Computing. Cambridge University Press, Cambridge, UK.
- Roux, B. 1996. Commentary: surface tension of biomembranes. Biophys. J. 71:1346–1347. [DOI] [PMC free article] [PubMed] [Google Scholar]
- Sachs, J. N., H. I. Petrache, and T. B. Woolf. 2004. Interpretation of small angle x-ray measurements guided by molecular dynamics simulations of lipid bilayers. Chem. Phys. Lipids. 126:211–223. [DOI] [PubMed] [Google Scholar]
- Schlenkrich, M., J. Brickmann, A. D. MacKerell, Jr., and M. Karplus. 1996. An empirical potential energy function for phospholipids: criteria for parameter optimization and applications. In Biological Membranes. K.M. Merz, Jr. and B. Roux, editors. Birkhäuser, Boston, MA. 31–81.
- Sears, V. F. 1986. Neutron scattering lengths and cross-sections. In Neutron Scattering, Part A. K. Sköld and D.L. Price, editors. Academic Press, New York. 521–550.
- Shannon, C. E. 1949. Communications in the presence of noise. Proc. Inst. Radio Eng. 37:10–21. [Google Scholar]
- Tristram-Nagle, S., H. I. Petrache, and J. F. Nagle. 1998. Structure and interactions of fully hydrated dioleoylphosphatidylcholine bilayers. Biophys. J. 75:917–925. [DOI] [PMC free article] [PubMed] [Google Scholar]
- Tu, K., D. J. Tobias, and M. L. Klein. 1995a. Constant pressure and temperature molecular dynamics simulation of a fully hydrated liquid crystal phase dipalmitoylphosphatidylcholine bilayer. Biophys. J. 69:2558–2562. [DOI] [PMC free article] [PubMed] [Google Scholar]
- Tu, K. C., D. J. Tobias, and M. L. Klein. 1995b. Constant-pressure and temperature molecular-dynamics simulations of crystals of the lecithin fragments—glycerolphophorylcholine and dilauroylglycerol. J. Phys. Chem. 99:10035–10042. [Google Scholar]
- Tuckerman, M., and B. J. Berne. 1992. Reversible multiple time scale molecular dynamics. J. Chem. Phys. 97:1990–2001. [Google Scholar]
- Venable, R. M., Y. H. Zhang, B. J. Hardy, and R. W. Pastor. 1993. Molecular dynamics simulations of a lipid bilayer and of hexadecane: an investigation of membrane fluidity. Science. 262:223–226. [DOI] [PubMed] [Google Scholar]
- Warren, B. E. 1969. X-Ray Diffraction. Addison-Wesley, Reading, MA.
- White, S. H., and M. C. Wiener. 1995. Determination of the structure of fluid lipid bilayer membranes. In Permeability and Stability of Lipid Bilayers. E. A. Disalvo and S. A. Simon, editors. CRC Press, Boca Raton, FL. 1–19.
- Wiener, M. C., G. I. King, and S. H. White. 1991. Structure of a fluid dioleoylphosphatidylcholine bilayer determined by joint refinement of x-ray and neutron diffraction data. I. Scaling of neutron data and the distribution of double-bonds and water. Biophys. J. 60:568–576. [DOI] [PMC free article] [PubMed] [Google Scholar]
- Wiener, M. C., S. Tristram-Nagle, D. A. Wilkinson, L. E. Campbell, and J. F. Nagle. 1988. Specific volumes of lipids in fully hydrated bilayer dispersions. Biochim. Biophys. Acta. 938:135–143. [DOI] [PubMed] [Google Scholar]
- Wiener, M. C., and S. H. White. 1991a. Fluid bilayer structure determination by the combined use of x-ray and neutron diffraction. II. “Composition-space” refinement method. Biophys. J. 59:174–185. [DOI] [PMC free article] [PubMed] [Google Scholar]
- Wiener, M. C., and S. H. White. 1991b. Transbilayer distribution of bromine in fluid bilayers containing a specifically brominated analog of dioleoylphosphatidylcholine. Biochemistry. 30:6997–7008. [DOI] [PubMed] [Google Scholar]
- Wiener, M. C., and S. H. White. 1992a. Structure of a fluid dioleoylphosphatidylcholine bilayer determined by joint refinement of x-ray and neutron diffraction data. II. Distribution and packing of terminal methyl groups. Biophys. J. 61:428–433. [DOI] [PMC free article] [PubMed] [Google Scholar]
- Wiener, M. C., and S. H. White. 1992b. Structure of a fluid dioleoylphosphatidylcholine bilayer determined by joint refinement of x-ray and neutron diffraction data. III. Complete structure. Biophys. J. 61:434–447. [DOI] [PMC free article] [PubMed] [Google Scholar]
- Woolf, T. B., and B. Roux. 1994. Molecular dynamics simulation of the gramicidin channel in a phospholipid bilayer. Proc. Natl. Acad. Sci. USA. 91:11631–11635. [DOI] [PMC free article] [PubMed] [Google Scholar]


