Abstract
The conjunction of insights from structural biology, solution biochemistry, genetics, and single-molecule biophysics has provided a renewed impetus for the construction of quantitative models of biological processes. One area that has been a beneficiary of these experimental techniques is the study of viruses. In this article we describe how the insights obtained from such experiments can be utilized to construct physical models of processes in the viral life cycle. We focus on dsDNA bacteriophages and show that the bending elasticity of DNA and its electrostatics in solution can be combined to determine the forces experienced during packaging and ejection of the viral genome. Furthermore, we quantitatively analyze the effect of fluid viscosity and capsid expansion on the forces experienced during packaging. Finally, we present a model for DNA ejection from bacteriophages based on the hypothesis that the energy stored in the tightly packed genome within the capsid leads to its forceful ejection. The predictions of our model can be tested through experiments in vitro where DNA ejection is inhibited by the application of external osmotic pressure.
INTRODUCTION
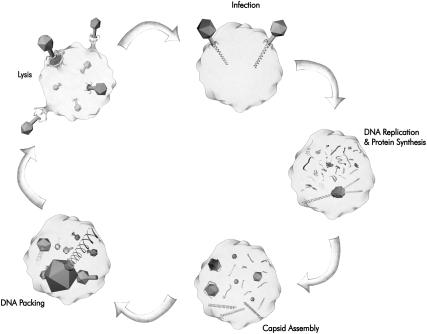
Bacteriophages have served as an historical centerpiece in the development of molecular biology. For example, the classic Hershey-Chase experiment (Hershey and Chase, 1952; Echols, 2001) that established nucleic acid to be the carrier of the genetic blueprint was performed using bacteriophage T2. The biology of bacteriophage λ provided a fertile ground for the development of the understanding of gene regulation (Ptashne, 2004), whereas the study of virulent T phages (T1–T7) paved the way for many other advances such as the definition of a gene, the discovery of mRNA, and elucidation of the triplet code by genetic analysis (Echols, 2001). One of the central theses of the present article is that phage are similarly poised to serve as compelling model systems for quantitative analyses of biological systems. Indeed, each of the stages of the viral life cycle (see Fig. 1) can be subjected to physical analysis.
FIGURE 1.
Life cycle of a bacterial virus. The ejection of the genome into the host cell happens within a minute for phage like λ and T4 (Novick and Baldeschwieler, 1988; Letellier et al., 2004). The eclipse period (time between the viral adsorption and the first appearance of the progeny) can be as short as ∼10–15 min (Endy et al., 1997). The packaging of the genome into a single capsid takes ∼5 min (Smith et al., 2001). Lysis of the bacterial cell is completed in <1 h (Endy et al., 1997).
As shown in Fig. 1, a typical phage life cycle consists of: adsorption; ejection; genome replication; protein synthesis; self-assembly of capsid proteins; genome packaging inside the capsid; and lysis of the bacterial cell. A wealth of knowledge about various aspects of these processes has been garnered over the last century with the main focus being on replication and protein-synthesis. However, recent developments in the fields of x-ray crystallography, cryoelectron microscopy, spectroscopy, etc., have helped reveal the structural properties of the viral components (Baker et al., 1999; Leiman et al., 2003) involved in ejection, assembly, and packaging, whereas recent experiments on φ29 (Smith et al., 2001) and λ (Evilevitch et al., 2003) have helped quantify the forces involved in the packaging and ejection processes, respectively. In this article we bring together these experimental insights to formulate quantitative models for the packaging and ejection processes. The model is based on what we know about the structural parts-list of a phage: the shape, size, and strength of the capsid, the mechanical and electrostatic properties of DNA, and high-resolution images that reveal the structure of assembled phage particles. Our goal is to create a detailed picture of the forces implicated in DNA packaging and ejection and, most importantly, make quantitative predictions that can be tested experimentally.
The article is organized as follows: in Physical Processes in the Bacteriophage Life Cycle, we examine dsDNA bacteriophage with the aim of assembling the relevant insights needed to formulate quantitative models of packing and ejection. In The DNA Packaging Process, we develop the model by examining the DNA packaging process in detail, and in The DNA Ejection Process, we show that it can be used to explain the DNA ejection process as well. The final section takes stock of a range of quantitative predictions that can be made on the basis of the model and suggests new experiments.
PHYSICAL PROCESSES IN THE BACTERIOPHAGE LIFE CYCLE
Since the early measurements of virus sizes many experiments involving viruses have been of a quantitative character. The emergence of quantitative insights into viruses has come from many quarters including electron microscopy, x-ray crystallography, single molecule biophysics, and a large repertoire of classical methods in biochemistry and genetics. For many viruses, these techniques have given us a detailed picture of the structure and function of the entire viral parts list. Many viral genomes have been sequenced, and the structure of many of the proteins coded for in the genome (Baker et al., 1999; Reddy et al., 2001) have been solved. Though it is impossible to discuss all of these advances here, we review some of the experimental insights that have informed our model-building efforts.
Experimental background
DNA is highly compressed inside bacteriophage capsids, and the resulting forces have important effects on the phage life cycle, as revealed in several experiments. One early experiment which shed light on the possible role of the forces associated with packaged DNA is that of Earnshaw and Harrison (1977), who characterized the tight packaging of DNA in viral capsids by the distance ds between strands (∼2.8 nm in full capsids), and by Feiss et al. (1977), who identified limits on the amount of DNA that can be packaged into a λ-capsid. Feiss et al. (1977) found an upper limit barely above the wild-type genome length, and suggested that adding more DNA makes the capsid unstable. Rau et al. (1984) made measurements on large volumes of nonviral DNA that showed that ds values in the range of 2.5–3.0 nm correspond to a pressure of several tens of atmospheres.
Since the experiments of Feiss et al. (1977) and Earnshaw and Harrison (1977), there have been a variety of experiments on DNA packing, several of which stand out because of their relevance to quantifying the internal buildup of force during packaging. Shibata et al. (1987) measured the rate of packaging for phage T3, under various temperatures and chemical conditions. Through these experiments, they determined that the packaging process was reversible—one-third of the genome was ejected back into solution upon early interruption of packaging. Smith et al. (2001) reinforced the idea that a strong force builds up during packaging with real-time single-phage packaging experiments. They measured the rate of DNA packaging while subjecting the DNA to various resisting forces, quantifying the forces imposed by the packaging motor and the force resisting further packaging as a result of the confined DNA. Taken together, these two experiments give us a picture of DNA packaging in which a strong portal motor consumes ATP and in so doing pushes the DNA into the capsid against an ever-increasing resistive force.
It is believed that the tightly wound DNA stores large energies resulting in high forces, which in some cases could aid DNA ejection into the host cell. Recently, an experiment to test this hypothesis was conducted by Evilevitch et al. (2003), who coerced λ into ejecting its genome into a solution containing polyethylene glycol (PEG) to create an external osmotic pressure. They found that various osmotic pressures of several tens of atmospheres could halt the ejection process resulting in fractional genome ejection. The fractional ejection reflects a balance of forces between the inside and outside of the capsid. From this experiment it is concluded that forces are still present during ejection at the same high levels as were observed during packaging and in static capsids.
There are a variety of impressive in vitro experiments which demonstrate pressure-driven ejection of the phage genome (Novick and Baldeschwieler, 1988; Bohm et al., 2001). For the in vivo case, ejection driven by internal force is only one of several mechanisms that have been hypothesized to participate in transferring the genome of bacteriophage into the host cell. Another mechanism is suggested by Molineux (2001) who, on the basis of a wealth of experimental evidence, argues that the DNA of phage T7 is assisted into the cell by DNA binding proteins. It is likely that different bacteriophage use a combination of these two methods for ejecting their DNA into the host cell.
Finally, recent cryoelectron microscopy and x-ray crystallography studies of bacteriophage have revealed their detailed internal structure and particularly, the ordered state of the packaged DNA. Cerritelli et al. (1997) verified the tight packing measured by Earnshaw and Harrison (1977) and showed that the DNA is apparently organized into circular rings within capsids. Other structural experiments have revealed the structure of components involved during ejection in T7 (Kanamaru et al., 2002), the assembly of bacteriophage φ29 (Tao et al., 1998), and structure of the packaging motor in φ29 (Simpson et al., 2000). This structural information complements the single molecule measurements and will guide us in the construction of a quantitative model of the packaging and ejection processes.
Orders of magnitude in bacteriophage biophysics
In the previous section we provided background on some of the experimental advances on bacteriophage which quantify the packaging and ejection processes. It is the aim of the remainder of this article to discuss the implications of these experiments in a more quantitative way and to make predictions about the phage life-cycle that can be tested experimentally. Before describing our models in precise terms, we first perform estimates of the orders of magnitude of relevant physical properties involved in phage biophysics. Bacteriophage range in size from a few tens of nanometers to several hundred nanometers (Baker et al., 1999). The capsids of most are regular icosahedral structures a few tens of nanometers in size. Table 1 gives an idea of the typical sizes of bacteriophage, as well as some animal viruses for comparison. These small containers house a genome which is several tens of microns long, a feat that demands extremely efficient utilization of space. In fact, an interesting dimensionless quantity for roughly characterizing the packaging efficiency is
 |
(1) |
where Ωgenome is the volume of the genetic material and Ωcapsid is the volume of the capsid. For double-stranded DNA bacteriophage, this result may be rewritten simply in terms of the number of basepairs in the phage DNA, Nbp, using the approximation that DNA is a cylinder of radius 1 nm and length 0.34 nm per basepair. Note that this estimate is strictly geometrical and is intended to provide a simple feel for the degree of compaction of the genome. Using these approximations, ρpack can be rewritten as
 |
(2) |
making the calculation of ρpack straightforward. Note that in this formula, Ωcapsid is computed in units of nm3.
TABLE 1.
Packaged volume fractions of some bacteriophage and eukaryotic viruses
| Virus type | Host type | Genome length (Kbp) | Diameter (nm) | ρpack |
|---|---|---|---|---|
| Bacteriophage T7 | Bacteria | 40 | 55 | 0.490 |
| Bacteriophage φ29* | Bacteria | 19.4 | 47 | 0.459 |
| Bacteriophage T4 | Bacteria | 169 | 92 | 0.443 |
| Bacteriophage λ† | Bacteria | 48.5 | 63 | 0.419 |
| Bacteriophage P22 | Bacteria | 41.7 | 63 | 0.319 |
| Herpes Virus HSV1 | Human | 152 | 125 | 0.159 |
| Human Adenovirus C | Human | 36 | 80 | 0.143 |
| Smallpox Virus 1‡ | Human | 186 | 220 | 0.036 |
| Polyoma Virus SV40 | Human | 5.3 | ∼50 | 0.083 |
| Mimivirus§ | Amoeba | ∼800 | ∼400 | 0.026 |
| Papillomavirus BPV1 | Animal | 7.9 | 60 | 0.070 |
We have used the outer dimensions of the capsid from Baker et al. (1999) in the calculation of ρpack since these are more readily available than the dimensions of the empty space inside the capsid. The genome lengths are given, for most viruses, in National Center for Biotechnology Information (2004). The DNA in bacteriophage is seen to be significantly more tightly packed than the other viruses, revealing the geometric origin of the large packing forces associated with bacteriophage.
Tao et al. (1998). Since the φ29 capsids are aspherical, we use an average diameter that gives the correct volume.
World Health Organization (2004). Since the smallpox particles are aspherical, we use an average diameter that gives the correct volume.
La Scola et al. (2003); this is the largest virus currently known.
For the purposes of examining the significance of this parameter, Table 1 shows ρpack for a number of different viruses. A trend that is evident in the table is that viruses that infect bacteria are more tightly packed than the viruses that infect eukaryotic cells. A likely reason for this difference in degree of genome compaction is the difference in infection strategies employed by the two types of viruses. Although eukaryotic viruses are brought into a host cell through processes in which both the genetic material and the capsid are taken into the infected cell, bacteriophage typically attach to the outside of the host and eject their DNA into the cytoplasm through a small channel. To transport their DNA quickly into the host, which itself is pressurized at ∼3 atm (Neidhardt, 1996), bacteriophage may power the ejection with a large internal pressure. However, as mentioned earlier, there is experimental evidence in the case of phage T7 that DNA binding proteins play a role in DNA transport. These experiments raise doubts about the possibility of finding a single mechanism responsible for ejection from all types of phage (Molineux, 2001).
The bacteriophage life cycle is a dynamic process and it is of interest not only to consider the geometric parameters associated with viral DNA, but to attend to the temporal scales that are involved as well. The first step in the cycle is the adsorption of the phage onto the host cell. The frequency of this event depends on the abundance of available phage particles and their hosts. Since ∼50–300 new phage particles are released by a single infection, the destruction of the host cell in a culture proceeds exponentially, once a cell is infected (Young, 1992). After the phage has attached itself to the host its genome is generally released on timescales ranging from seconds to minutes (Letellier et al., 2004). Probably concomitantly the transcription and translocation machinery of the host cell is hijacked and the production of phage proteins and factors required for replication of its genome begins. The time between the adsorption of the phage and the appearance of the first progeny capsids is usually on the order of minutes (Flint et al., 2000). This period is known as the eclipse period and it is the time required to build up the concentration of the phage proteins to a level high enough to initiate self-assembly of the capsid, tail, and motor proteins that constitute a mature phage particle. Self-assembly is a highly concentration-dependent process, but once it starts it proceeds rapidly to completion in a few seconds.
The second step, the packaging process, is completed in ∼5–6 min (Smith et al., 2001). The packaging rate is on the order of 100 bp/s in the initial stages but it slows down as more of the genome is confined inside the capsid. That is, the rate of packaging depends on the force opposing the motor as it packages the genome. This internal force grows as the amount of genome packaged increases, and the magnitude of the force depends on the solvent conditions. In fact, some biologically important multivalent ions, such as spermidine, cause spontaneous DNA condensation resulting in much smaller packaging forces (Evilevitch et al., 2004). This will be demonstrated more clearly later in this article. After the progeny phage have been completely assembled, enzymes lyse the host cell and a new generation of phage are released. The process of adsorption to lysis is completed in <1 h (Flint et al., 2000).
The objective of this section was to highlight some of the opportunities for quantitative analysis provided by processes in the viral life cycle. Despite the wide range of interesting physical process in the viral life cycle, the remainder of this article focuses on the physical forces associated with packaged dsDNA and the implications of these forces for the packing and ejection processes.
THE DNA PACKAGING PROCESS
The model we invoke to examine the energetics of packaged DNA is predicated upon two key physical effects: 1), the elastic cost to bend DNA so that it will fit in the viral capsid and 2), the interaction energy which results from the proximity of nearby strands of DNA and which derives from charges on both the DNA and in the surrounding solution.
Our article is very much inspired by previous theoretical work: Riemer and Bloomfield (1978) laid the foundation for subsequent efforts on the energetics of packaged DNA by systematically examining each of the possible contributions to the overall free energy budget. Kindt et al. (2001) and Tzlil et al. (2003) estimated the forces in packaging of the phage λ. Arsuaga et al. (2002) computed conformations of DNA in phage P4 using molecular mechanics models, observing that the conformation of DNA within a capsid depends on its volume, in agreement with our suggestion that the parameter ρpack characterizes the extent of packing in phage. Odijk (2004) has discussed several issues in bacteriophage packaging including the important problem of deriving an expression for the electrostatic interactions between DNA strands starting from the Poisson-Boltzmann equation with the added complication of high density of packing and possibly nonhexagonal arrangement. Kindt et al. (2001), Purohit et al. (2003b), and Tzlil et al. (2003) do not derive these expressions a priori; instead, they use results obtained by Rau et al. (1984), Parsegian et al. (1986), and Rau and Parsegian (1992) from osmotic pressure experiments on DNA to characterize these interactions. We have already underlined the importance of electrostatic interactions in solutions as a critical factor in the bacteriophage life cycle. More recently, Odijk and Slok (2003) analyze the possibility of a non-uniform density of DNA inside the capsid and compute the size of regions within the capsid that are void. Marenduzzo and Micheletti (2003) study the effects of the finite thickness of DNA on the forces experienced during packaging within a viral capsid. The aim of this article is to take models like those described above and to systematically examine trends from one virus to another as well as for mutants within a given phage type.
Structural models for the packaged DNA
To construct a quantitative model of DNA packaging and ejection, it is necessary to specify the arrangement of the packaged DNA. One of the earliest successful attempts at determining the structure of DNA packaged in a phage capsid was an x-ray diffraction study by Earnshaw and Harrison (1977) on P22 and some mutants of λ. Their studies revealed both long-range and short-range order of the encapsidated DNA. The evidence of long-range order comes from the observation that the diffraction is modulated by a series of ripples indicating that the phage head is uniformly filled. Short-range order was indicated by a strong peak corresponding to a 25 Å spacing. In an earlier study, Richards et al. (1973) used electron microscopy to visualize gently disrupted phage particles and found that the DNA close to the capsid boundary has a circumferential orientation. These investigations together suggested a coaxial spool like arrangement of the DNA inside the capsid. This model was further corroborated by experiments of Booy et al. (1991) on HSV-1 and Cerritelli et al. (1997), who used cryo-electron microscopy to obtain three-dimensional visualizations of the packaged DNA in T7 phage. They consistently found a concentric ringlike geometry in both wild-type and mutant versions of T7 with a spacing of ∼25 Å in nearly-filled phage heads. However, none of these experiments shed much light on the geometry of packaged DNA in the very early stages of packing, nor on the DNA in the central core of the fully packaged capsid.
A well-ordered structure of the encapsidated DNA is also suggested by other observations on DNA condensation in the presence of polyvalent cations or other condensing agents such as methanol, ethanol, or dilute solutions of spermidine, PEG, and other low molecular weight polymers (see Gelbart et al., 2000, for an extensive overview). The strands in the condensate are known to have local hexagonal coordination, another piece of evidence in favor of the kind of short-range order described above. Simulations by Kindt et al. (2001) and theoretical investigations by Odijk (1998) point in this direction as well. Evidence in support of this hypothesis is also provided by the simulations of Arsuaga et al. (2002), who show that the coaxial spool (or inverse spool) is an energetically favorable configuration, particularly when the density of packing is high as in bacteriophage. In light of these arguments we assume that the DNA is arranged in columns of concentric hoops starting from the inner wall of the capsid. Each of the hoops is surrounded by six similar hoops (hexagonal arrangement) except those at the innermost column and those touching the surface of the capsid. Though we have assumed a limited class of geometries for the packaged DNA, namely spool models, we note that such models are not necessarily the lowest possible free-energy structures (Klug and Ortiz, 2003), and other models have been proposed (Black, 1988). Further, we remain unclear as to the precise dynamic pathways that would orchestrate such structures during packing and ejection, although simulations are consistent with the dynamical development of such structures (Arsuaga et al., 2002; Kindt et al., 2001; LaMarque et al., 2004).
Modeling the free energy of packed DNA
With a specific arrangement of DNA in hand, we can now compute the free energy required to package that DNA. Our efforts to write an expression for the free energy of the DNA packed inside a phage capsid are inspired by the experimental insights described above concerning the configuration of the encapsidated DNA and its behavior in ionic environments. We follow Riemer and Bloomfield (1978), Odijk (1998), and Kindt et al. (2001), and break up the energetics of the encapsidated DNA into an elastic term and a DNA-DNA interaction term,
 |
(3) |
We begin with the first term, by asserting that the bending energy in an elastic fragment of length L is given by
 |
(4) |
where ξp is the persistence length of DNA and R(s) is the radius of curvature at the position with arc-length parameter s. This simply reflects the energetic cost Gbend = ξpkBTl/2R2 to bend an elastic rod of length l into a circular arc of radius of curvature R.
The expression for the bending energy is considerably simplified by a structural insight provided by the experiments described earlier of Earnshaw and Harrison (1977), Booy et al. (1991), and Cerritelli et al. (1997), which showed that the DNA is arranged in the capsid in a series of circular hoops starting close to the surface of the capsid and winding inwards in concentric helices. Therefore, we specialize this expression to a hoop of radius R of length l = 2πR and deduce that the bending energy in the hoop is Ghoop = πξpkBT/R. We ignore the pitch of the helix and think of the encapsidated DNA as a series of hoops of different radii (Purohit et al., 2003b). This leads to the following expression for the total bending energy,
 |
(5) |
where N(Ri) is the number of hoops of radius Ri in the capsid. Note that in neglecting the helical pitch we have also assumed that the successive layers of hoops are parallel to each other. A more realistic model would acknowledge that strands in successive layers form a criss-cross pattern. We drop this complication in favor of the simple model used above that captures the essential physics. The persistence length of DNA depends on solvent conditions (Smith et al., 1992) and also on the sequence of basepairs (Bednar et al., 1995). However, ξp = 50 nm is an appropriate number for the solvent conditions in the packaging experiment of Smith et al. (2001) and the ejection experiment of Evilevitch et al. (2003). We note here that the size of many bacteriophage capsids is on the order of a few tens of nanometers, which is comparable to the persistence length of double-stranded DNA itself. This hints that the bending energy indeed constitutes a significant portion of the free energy of the encapsidated DNA. Note that we have neglected twist and writhe as contributors to the free energy very much in line with the work of Arsuaga et al. (2002), Kindt et al. (2001), Tzlil et al. (2003), and Odijk (2004). The twisting modulus of DNA is higher than its bending modulus and the twist would be relaxed if the ends of the DNA are free to rotate. However, there is no conclusive experimental data validating this claim, and more work is required on this point. There is a possibility that the DNA packaging motor is a rotational device (Simpson et al., 2000), and investigations elaborating its mode of operation are expected to shed more light on this problem. Given the current lack of information, we neglect the twisting energy of the DNA and simplify the expression for the bending energy by converting the discrete sum in Eq. 5 to an integral according to the prescription  In particular, we replace the sum of Eq. 5 with
 |
(6) |
where Rout is the radius of the inner surface of the capsid and the length L of packaged DNA is given by
 |
(7) |
The factor of  appears because it is observed (Cerritelli et al., 1997) that the DNA strands are arranged in a lattice with local hexagonal coordination and spacing ds. In other words, each strand has six nearest-neighbors except those near the surface of the capsid and the innermost cylindrical space where there are three nearest-neighbors on average. We expect that the interaction of the DNA with the proteins of the capsid would give rise to surface energy terms (Tzlil et al., 2003) in the expression for the total free energy, but we neglect these terms in our analysis.
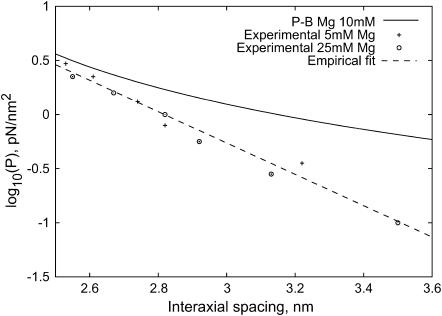
We next turn to Gint, the DNA-DNA interaction energy. DNA has a backbone that is highly negatively charged. As a result there are large energetic costs associated with bringing DNA fragments close together in solution. These interactions can in turn be screened by counterions which fill the space between DNA strands. From a theoretical perspective, it is natural to treat these interactions by applying the Poisson-Boltzmann approximation, in which charge is smoothly distributed according to a Boltzmann distribution consistent with the potential it produces (Nelson, 2003). In this approximation, the free energy is calculated from a sum of entropy (assuming the ions are locally an ideal gas) and electrostatic energy. Water is modeled as a continuous dielectric. In the limit of extremely close packing, ideal-gas pressure dominates over the relatively constant electrostatic energy, and the correct pressure is predicted. However, the experiments of Rau et al. (1984) and Parsegian et al. (1986) show that this approximation does not give the correct dependence of the pressure on interstrand spacing as shown in Fig. 2. The mismatch between theory and experiment is likely due to effects ignored by the Poisson-Boltzmann treatment, such as the discreteness of ions and of water molecules. However, detailed Monte Carlo simulations in which the ions are treated as discrete objects but water remains continuous (Lyubartsev and Nordenskiold, 1995) work remarkably well. Although our treatment of the interaction energy, Gint, will be based upon the experimental data of Rau et al. (1984), calculations like those of Lyubartsev and Nordenskiold (1995) could be used to construct a first-principles model of the interactions, at least for monovalent and divalent counterions. We rely on empirical data for this study but suggest the use of simulated data if experimental data is not available.
FIGURE 2.
Pressure in a hexagonal lattice of DNA, according to experiment and Poisson-Boltzmann theory. Experimental data points are from the data of Rau et al. (1984) for 25 mM and 5 mM Mg2+ concentrations. Our theoretical calculations follow from a discrete one-dimensional Poisson-Boltzmann solver, assuming cylindrical symmetry. The free energy was calculated as a sum of the Shannon entropy of the ions and the electrostatic energy of ions and DNA, with the zero point for the potential set so that internal and external ionic concentrations were related by a Boltzmann factor. The theoretical predictions differ from the experimental points by a factor of 10, although the slopes are approximately correct and it is difficult to distinguish between the data for the two different concentrations. Also shown is a least-squares fit to the empirical datapoints, resulting in the parameters c = 0.30 nm and F0 = 1.2 × 10⁴ pN/nm2.
The experiments of Rau et al. (1984) and Rau and Parsegian (1992) provide an empirical formula that relates osmotic pressure p to strand spacing ds in the range of 2–4 nm as
 |
(8) |
The value of the pressure is dependent on both the ion concentration and its charge. When working with this formula, it is important to remember that a large change in F0 can be mostly compensated by a small change in c, since most data points are in a small region far from the p axis. Hence, even though c is relatively constant, we state the value used for both c and F0 together to avoid confusion. Fig. 2 shows the experimental data for a solution containing 5 and 25 mM MgCl2 at 298 K, in which measurements reveal c = 0.30 nm and F0 = 1.2 × 10⁴ pN/nm2. These values should be appropriate for use whenever Mg2+ ions are the dominant species and have a concentration of 5–25 mM, conditions satisfied in solutions commonly used in phage experiments, including, for example, SM buffer and the TM buffer used in Evilevitch et al. (2003). The solution used by Evilevitch et al. (2003) also contained the buffering agent Tris, which we expect resulted in additional monovalent ions at a 10-mM concentration. Since Mg2+ is smaller and has a higher charge, we expect that it will still be the dominant ion within the phage capsids. Unfortunately, the buffer used in Smith et al. (2001) includes enough sodium to suggest that the effect of Na+ must be considered in addition to Mg2+ . The solutions in vivo are far more complex and F0 is difficult to determine. Even solutions in vitro contain different concentrations of ions and determining F0 for each one of them through experiments would be impractical.
The data on the measured pressure in terms of ds can be used to deduce the functional form of energy stored in the electrostatic interactions. We do not go through the details here but refer the reader to Purohit et al. (2003b) for the full calculation. The calculation rests on the assumption of a pair potential interaction among N parallel strands of length l each packed in a hexagonal array with a spacing ds. The total interaction energy of this arrangement is
 |
(9) |
where L = Nl is the total length of the strands. This is the expression for the interaction energy when the ions in the ambient solution are monovalent or divalent cations. In this regime the interaction between the strands is entirely repulsive and these interactions decay as the strands are moved farther apart. For trivalent and tetravalent ions the physics is quite different. In this regime there is an attractive interaction with a preferred spacing d0 between the strands, and the measurements are well fit by
 |
(10) |
where c = 0.14 nm and d0 = 2.8 nm, for example, in the case of cobalt hexamine as the condensing agent. For ds < d0 the interaction is strongly repulsive and for ds > d0 it is attractive. This expression is a good representation of the free energy of interactions between the DNA molecules for spacings ds less than or equal to the preferred value d0 (Rau and Parsegian, 1992). In viral packaging we encounter interaxial spacings in exactly this range and hence we will use this free energy to study the effects of repulsive-attractive interactions on encapsidated DNA.
It is important to note that in the experiments of Rau et al. (1984) and Rau and Parsegian (1992) DNA was confined in the same way (except for the lack of bending) as it is within a phage capsid. This means that the free energy Gint obtained from their measurements accounts for multiple effects, including electrostatics, entropy of the DNA (Odijk, 1983) and counterions, and any hydration phenomena (Strey et al., 1997).
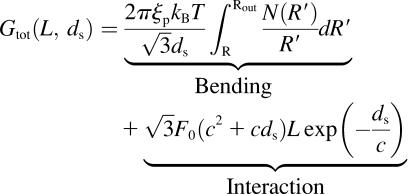
Given that we have now examined the separate contributions arising from DNA bending, entropy, and interaction terms, we now write the free energy of the encapsidated DNA in the repulsive regime,
 . .
|
(11) |
An analogous formula holds for the repulsive-attractive regime. Note that this expression reports the free energy of the inverse spool configurations when a length L has been packaged by relating R to L via Eq. 7. We will now show that the spacing between the strands varies in a systematic way during the packing process, reflecting the competition between bending and interaction terms.
DNA spacing in packed capsids
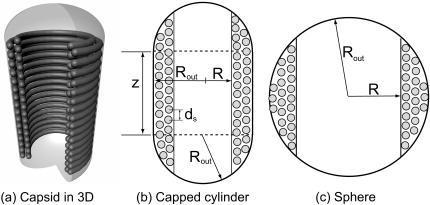
Our model makes a concrete prediction for the free energy Gtot of packaged DNA in any phage and for a wide range of solution conditions. To find Gtot for a particular phage, we minimize Eq. 11 by varying ds, under the constraint that L given by Eq. 7 is equal to the length of DNA already packaged. The expressions for N(R′) will differ for different capsid geometries. Most capsids are icosahedral and we idealize them as spheres. Some capsids, e.g., φ29, have a waist. We idealize them as cylinders with hemispherical caps. Eventually, we will find that the geometry does not affect the overall free energy of packing as long as the internal volume of the idealization is the same for each geometry, once again reflecting the importance of the parameter ρpack, introduced earlier. Before we specialize to particular geometries (see Fig. 3) we observe that  where z(R′) is the height of a column of hoops of DNA situated at radius R′. Using this fact and differentiating Eq. 7 with respect to ds, while holding L constant, gives us
  Minimizing Gtot with respect to the interstrand spacing ds gives
 |
(12) |
FIGURE 3.
Idealized geometries of viral capsids.
This equation represents a balance between the bending energy terms and the interaction terms. Note that if the size of the capsid is fixed then longer lengths of packed DNA imply smaller radii of curvature for the hoops since the strands want to be as far away as possible from each other for the case in which the interaction between the adjacent strands is repulsive. On the other hand, smaller radii of curvature eventually lead to large bending energy costs resulting in a tradeoff that is captured mathematically in Eq. 12.
We now particularize this result to specific geometries (i.e., particular choices of z(R′)). For a sphere,  and the equation which determines the optimal ds reads
 |
(13) |
For a cylinder with hemispherical caps,  where h is the height of the waist portion, and ds is the solution of the equation
 |
(14) |
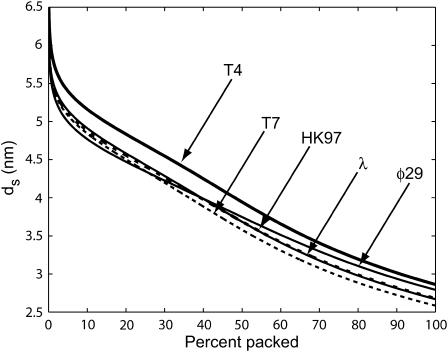
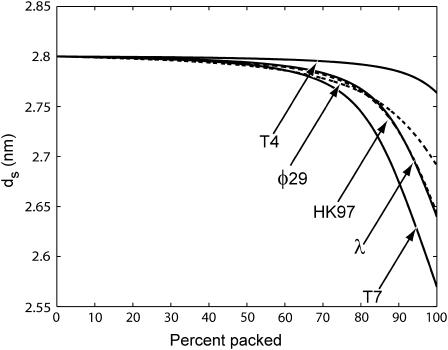
Fig. 4 shows ds as a function of the fraction of the genome packed for five different phage. We assume that all of them are packaged under the same (repulsive) conditions, with F0 = 2.3 × 10⁵ pN/nm2 and c = 0.27 nm as in Purohit et al. (2003b) corresponding to the best visual fit to the data in the experiments of Smith et al. (2001), which was performed in a solution containing 5 mM MgCl2 and 50 mM NaCl. Note that these values are different than those found in the earlier section, Modeling the Free Energy of Packed DNA, because the ionic concentrations differ. Table 2 gives the details of the geometry of the phage used in the calculation.
FIGURE 4.
The spacing ds in five different phage under fully repulsive conditions with F0 = 2.3 × 10⁵ pN/nm2 and c = 0.27 nm. These values of F0 and c result in the best visual fit to the data in the experiment on φ29 by Smith et al. (2001) (5 mM MgCl2 and 50 mM NaCl). The graphs show ds monotonically decreasing as more of the genome is packaged. T7 is the most tightly packed whereas T4 is most loosely packed. The value λ and HK97 show an almost identical history of ds versus fraction of genome packed, since the two are closely related structurally.
TABLE 2.
Idealized geometries of bacteriophage
| Phage type | Geometry | Rout (nm) | h (nm) | Genome length (nm) | ρpack |
|---|---|---|---|---|---|
| T4 (Iwasaki et al., 2000) | Capped cylinder | 39.8 | 29.0 | 57,424 | 0.442 |
| T7* (Cerritelli et al., 1997) | Sphere | 26.6 | 0 | 13,579 | 0.541 |
| φ29 (Tao et al., 1998) | Capped cylinder | 19.4 | 12.0 | 6584 | 0.461 |
| HK97 (Lata et al., 2000) | Sphere | 27.2 | 0 | 13,509 | 0.503 |
| λ (Baker et al., 1999) | Sphere | 29.0 | 0 | 16,491 | 0.507 |
The radius and height are determined by using the volume available to the DNA. They have been calculated from experimental data about the geometry of capsids from several sources (in parentheses above). The value of ρpack for some phage in this table is higher than corresponding values in Table 1 since this table uses internal volumes whereas Table 1 uses the outer dimensions that are more readily available.
The T7 phage is unusual in that a part of its cylindrical tail (radius 9.5 nm, height 28.5 nm) protrudes into the empty space within the spherical capsid. The space occupied by this tail is not available to the DNA and we exclude it to get an effective radius.
As noted earlier, a sufficient concentration of polyvalent cations suffices to induce effective attraction between adjacent DNA strands. Under such repulsive-attractive conditions the left-hand side of Eq. 12 changes and we get
 |
(15) |
Here too, the idea is to solve for the optimal ds at each packaged length L. The results with the repulsive-attractive potential for different phage are shown in Fig. 5. We note the similarity in the observed trends with the results of Kindt et al. (2001), who also study the packaging process with a repulsive-attractive potential. In the presence of surface energy the encapsidated DNA assumes a toroidal configuration in the early stages of packing (Kindt et al., 2001) much as it would have in solution in the absence of a capsid (Raspaud et al., 1998). At the later stages of packing the inverse spool is the more energetically favorable geometry and the calculations of Kindt et al. (2001) show a smooth transition between these configurations. However, we assume that the inverse spool is the optimal geometry throughout the packaging process since we do not have surface energy terms. Note also that the trends in Fig. 5 are quite different from those with the fully repulsive conditions (Fig. 4). Most importantly, in the early stages of packing under repulsive-attractive conditions the DNA strands tend to be at the preferred spacing of 2.8 nm (Kindt et al., 2001; Tzlil et al., 2003). Volumetric constraints at the later stages of packing result in tighter packing and ds decreases to values lower than the preferred 2.8 nm. Under fully repulsive interactions the interstrand spacing decreases monotonically as more DNA is packaged.
FIGURE 5.
The spacing ds under repulsive-attractive conditions. We use F0 = 0.5 pN/nm2, d0 = 2.8 nm and c = 0.14 nm. This corresponds to a solution containing 5 mM Co(NH3)6Cl3, 0.1 M NaCl, 10 mM TrisCl (Kindt et al., 2001; Rau and Parsegian, 1992). The spacing remains at the preferred value of 2.8 nm for most of the packaging process, except in the end when volumetric constraints lead to smaller spacings as a consequence of high energy costs for maintaining this ds.
For many bacteriophage, even were they to be packaged under conditions in which there is an effective attraction between adjacent DNA segments the genome would not fit into the capsid if the interaxial spacing is at the preferred value of 2.8 nm. This would result in repulsive interactions between adjacent DNA segments in the terminal part of the packaging process. Interestingly, in these circumstances, ds can be estimated using strictly geometric arguments. In particular, we equate the total volume available in the capsid with the volume of the packaged DNA. In particular, this implies
 |
(16) |
where L is the length of the packaged DNA. This in turn implies
 |
(17) |
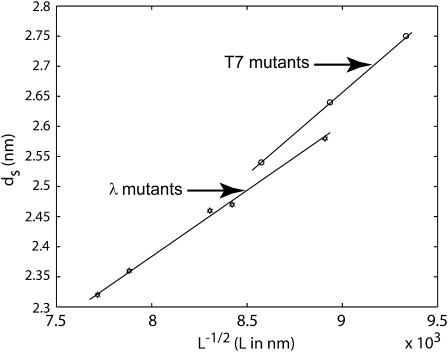
or more generally  In deriving this expression we have assumed that the volume of the cylindrical void (unoccupied by the DNA) (Odijk, 1998; Kindt et al., 2001; Arsuaga et al., 2002) in the middle of the capsid is negligible in comparison to the volume of the capsid. Equivalently, we may assume that the size of the void is independent of the length packaged in the final stages of packaging. The predicted scaling of ds with DNA length L above can be compared to several different experiments as shown in Fig. 6. In particular, the spacing has been measured both in λ-mutants (Earnshaw and Harrison, 1977) and in the T7 bacteriophage (Cerritelli et al., 1997). As seen in the figure, the scaling suggested by the model appears to provide a satisfactory description of the measured trends. More generally, note that the spacing of the packaged DNA is one of the key points of contact between our theory and experiment. In particular, both Figs. 4 and 5 are predictive, in that they suggest how the spacing ds varies from one phage to another for different solution conditions.
FIGURE 6.
Comparison of measured spacings ds with  scaling law. The circles correspond to interstrand spacing in T7 obtained by Cerritelli et al. (1997). The stars represent data from Earnshaw and Harrison (1977) for mutants of λ-phage. We fit straight lines to both these data sets to show that the spacing scales with the inverse square-root of the packaged length in capsids that are nearly full.
Forces during DNA packing
The phage genome is subject to various resistive forces during the packaging process. As discussed earlier, these forces depend on the size and geometry of the capsid, solvent conditions, and the size of the genome. In this section we calculate those forces using the expressions for the elastic and the interaction energy derived in the previous section.
Forces from DNA confinement
To obtain the force we differentiate the total free energy, Gtot, formulated in Eq. 11, with respect to the packaged length L. Since the dependence of the spacing ds on L is already known we substitute it into the expression for Gtot, rendering it a function of L alone. We then carry out the differentiation and obtain the expression for the force as
 |
(18) |
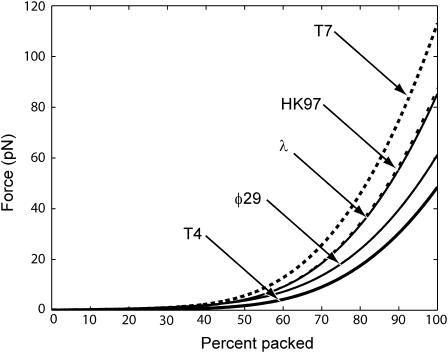
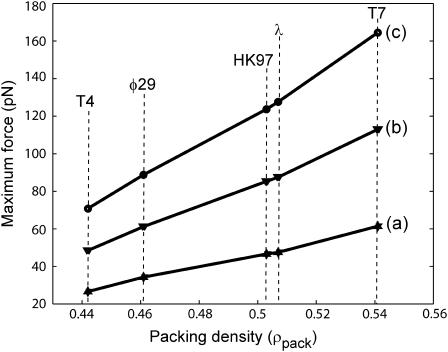
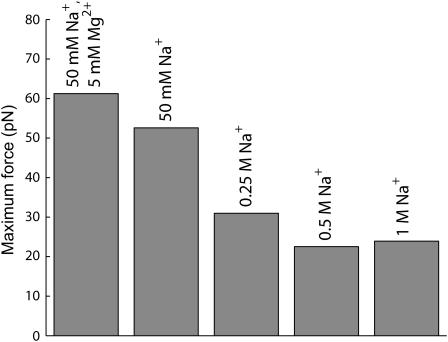
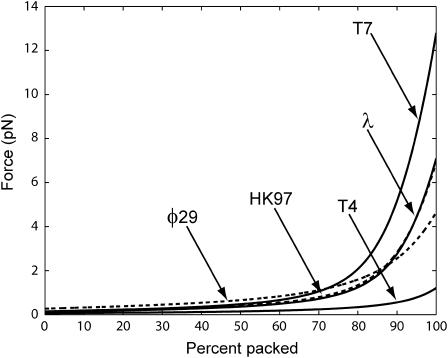
where we assume that the radius R and the spacing ds are known functions of L. In Fig. 7, we show the result of a series of such calculations for different phage, all done assuming ionic conditions such as those used in the experiments of Smith et al. (2001). The values of F0 and c corresponding to these conditions were determined by a fit to the data of Smith et al. (2001) for bacteriophage Φ29. In principle more accurate values of these parameters can be obtained by a least-squares fit. The key point of Fig. 7 is to illustrate the trends across different phage with particular reference to the way in which the maximum packaging-force scales with ρpack. This is shown more clearly in Fig. 8. We observe that the maximum resistive force scales roughly linearly with the packing density ρpack across different phage of varied shapes. We have also plotted the maximum resistive force for φ29 in Fig. 9 for different salt concentrations of the ambient solution. The repulsive interactions between the DNA strands grow progressively larger as the concentration of the Na+ ions in solution decreases. This results in larger packaging forces as can be seen in Fig. 9.
FIGURE 7.
Comparison of forces during DNA packing process for different phage under fully repulsive conditions. T7 requires the largest force to package since it is most densely packed. T4 is at the other end of the spectrum requiring the smallest force. The data above corresponds to F0 = 2.3 × 10⁵ pN/nm2 and c = 0.27 nm obtained by a visual fit to the data of Smith et al. (2001), who conducted the packaging experiment for phage φ29 in a solution containing 5 mM MgCl2 and 50 mM NaCl.
FIGURE 8.
Maximum resistive force in different phage under three different repulsive conditions. a corresponds to F0 = 1.1 × 10⁵ pN/nm2 and c = 0.27 nm; b corresponds to F0 = 2.3 × 10⁵ pN/nm2 and c = 0.27 nm; and c corresponds to F0 = 3.3 × 10⁵ pN/nm2 and c = 0.27 nm. The forces increase with the packing density ρpack and also with increasing F0.
FIGURE 9.
Maximum resistive force in φ29 for different salt concentrations. The maximum force increases as the salt concentration decreases since the DNA interstrand repulsion becomes larger as the solution becomes more dilute. The values of F0 and c for the salt solutions >50 mM used in this figure were obtained from fits to the data of Rau et al. (1984). The leftmost bar represents the data of Smith et al. (2001), and the 50 mM Na+ bar was obtained from data communicated privately by D. Rau (2004).
We have also obtained the force required for packaging under repulsive-attractive interactions. The results can be seen in Fig. 10. The forces are considerably smaller when the strands are at the preferred spacing d0 = 2.8 nm. As with the DNA spacing discussed earlier, the results in Figs. 7 and 8 are predictive and suggest a wide range of new experiments using both different solution conditions and different phage. Although we have attempted to provide a faithful analysis of the interactions between adjacent DNA strands, these interactions are complicated and involve a variety of different factors which make a first-principles analysis of these interactions in the presence of polyvalent cations and bent DNA difficult. However, regardless of the particular choice of interaction, it is clear that adjacent strands repel each other at small interstrand separations and this qualitative behavior and the trends it implies in these calculations are indifferent to these details.
FIGURE 10.
Comparison of forces during DNA packing process for different phage under repulsive-attractive conditions with F0 = 0.5 pN/nm2, d0 = 2.8 nm, and c = 0.14 nm. This corresponds to a solution containing 5 mM CO(NH3)6Cl3, 0.1 M NaCl, 10 mM TrisCl (Kindt et al., 2001; Rau and Parsegian, 1992). The trends seen here are no different from those in the fully repulsive conditions—T7 requires large forces and T4 requires small forces for packaging. The maximum force, however, is significantly smaller than that seen for fully repulsive conditions.
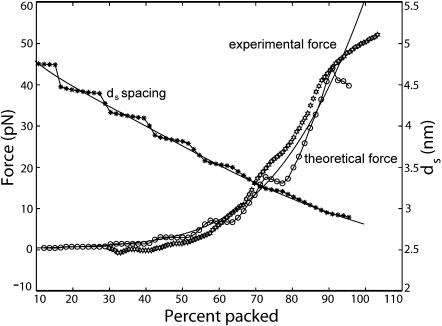
The history of force as a function of packaged length obtained above rested on the assumption that the integral approximation adopted in Eq. 6 is an accurate representation of the bending free energy. In principle the optimal spacing ds(L) and the resistive force F(L) can be obtained by minimizing the free energy without resorting to the integral approximation. This has been carried out in Purohit et al. (2003a) and the results are shown in Fig. 11. There are several distinctive features to be noted in this figure. Foremost among them is that the curves for the history of resistive force and interaxial spacing as a function of the length of DNA packed are not monotonic, unlike the curves obtained from the integral (continuum) models. The discrete steps represent the addition of a new stack of hoops, during the packaging reaction. More importantly, discreteness of packing implies that at specific lengths packaged there will be sharp changes of the spacing ds due to an increase in the number of hoops per layer. These events might be a mechanical signal of the packaging configuration. In particular, the observation of such steps in an experiment would be evidence in favor of our quasistatic picture of the dynamics of packaging.
FIGURE 11.
Force and interaxial spacing as functions of the amount of DNA packed in bacteriophage φ29. The hexagons correspond to the experimental data of Smith et al. (2001). The continuous lines are the results of the continuum model, and the circles/asterisks are obtained from the discrete model.
Forces due to viscous dissipation
Thus far we have calculated the free energy stored in the compressed DNA within a bacteriophage capsid, which represents the total amount of work that the motor must do to package the entire genome. We have not yet considered irreversible work that may result from the high rate of packaging. An obvious source of irreversible work is viscous dissipation in the fluid. Here we demonstrate that, in fact, such forces are negligible, as speculated by Smith et al. (2001).
We identify four sources of viscous dissipation during packaging: drag on 1), the capsid and 2), the unpackaged genome as each is pulled through the fluid; 3), viscous dissipation within the sheath (as might be important during ejection); and 4), dissipation as fluid is extruded through capsid pores. We calculate an upper bound on each to provide an upper bound on fluid dissipation in general, and conclude that such forces are negligible. Note, however, that we assume water to behave as a continuum material throughout this analysis. Noncontinuum effects, which could affect our conclusions, are not treated here. In what follows, we use values from Table 3.
TABLE 3.
Physical numbers for DNA packing in φ29, taken from Tao et al. (1998)
| Expression | Description | Number |
|---|---|---|
| R | Capsid radius | 30 nm |
| tc | Capsid thickness | 2 nm |
| Rp | Pore radius | 2 nm |
| N | Number of pores | 10 |
| X | Sheath length | 50 nm |
| D | Inner sheath radius | 1.3 nm |
| d | DNA radius | 1.0 nm |
| V | DNA velocity | 100 bp/s ≈ 30 nm/s |
| RG | Unpackaged genome radius of gyration | 300 nm |
Since the φ29 capsids are aspherical, we use an average diameter that gives the correct volume.
First, as DNA is pushed into the capsid, equal and opposite forces pull both the unpackaged genome and the capsid through the surrounding fluid. Although the (smaller) capsid certainly moves more quickly than the genome, as an upper bound, we assume each to move at the full translocation velocity V. Furthermore, an upper bound can be obtained using the Stokes drag F = 6πμRbV on a solid sphere of radius Rb bounding each. Using Rb ∼ R for the capsid and Rb = RG for the genome, we obtain
 |
(19) |
giving power dissipation
 |
(20) |
Second, to estimate the dissipation within the sheath, we consider the fluid drag on a DNA molecule (modeled as a cylinder) of radius d moving at velocity V through a cylindrical sheath of inner radius D and length X, into or out of a viral capsid. The fluid between the DNA and the sheath is assumed to obey the Stokes equations subject to the no-slip boundary conditions. Packaging or ejecting DNA requires an equal volume of fluid to be expelled from or injected into the capsid, which can occur either through pores in the capsid, or back through the sheath. Below we treat the fluid dissipation in both cases.
This is a textbook problem in fluid mechanics (Landau and Lifshitz, 1987), giving a fluid velocity profile (with radial coordinate r),
 |
(21) |
The pressure ΔP depends on the nature of the capsid. If the capsid is impermeable to water, the volume of DNA πd2V entering the capsid must exactly equal the fluid volume  Durdr leaving the capsid, which gives
 |
(22) |
of order 102 Pa. The total power dissipated comes from shear stress on the DNA, Ushear = 2πdXV∂ru|r=d and from p − V work, driving a volume flux of DNA against a pressure ΔP, Upressure = πd2VΔP. These two give a total dissipation
 |
(23) |
which represents an upper bound for dissipation within the sheath.
If, as we assume below, it is easier for the fluid to flow through capsid pores than through the sheath, the backflow in Eq. 21, proportional to ΔP, disappears (Gabashvili and Grosberg, 1992). In that case, only shear stresses occur and give a total dissipation
 |
(24) |
Finally, we estimate the power dissipated for fluid extruded through capsid pores, rather than the sheath. These pores occur at N-symmetry points on the capsid shell. A crude estimate for the dissipation through each is obtained by assuming Poiseuille flow through each pore. Entrance and exit effects contribute, at most, a term of comparable magnitude. The flow rate through N-pores due to a pressure ΔP inside the capsid is
 |
(25) |
Requiring the DNA volume entering the capsid πd2V to equal the fluid flux Qp out of the capsid determines ΔP to be
 |
(26) |
giving rise to a viscous dissipation
 |
(27) |
Since the dissipation through the pores is so much lower than that through the sheath, one expects most fluid extrusion to occur primarily through the pores. All of these effects are negligible in comparison with the power supplied by the motor, which consumes roughly ∼10 kBT per two basepairs, giving Wmotor ∼400 kBT/s.
Lastly, we note that if viscous forces from the flow of water into the capsid is the primary damping mechanism during ejection, the DNA ejection velocity can be obtained using the above results. If fluid must flow through the sheath to replace the volume lost by ejecting DNA, the ejection rate is Ve ∼6 μm/s per atmosphere of applied pressure, which implies an ejection time of <1 s; whereas if fluid can flow freely through capsid pores, higher ejection rates, Ve ∼300 μm/s per atmosphere of applied pressure, are obtained, resulting in a 1/50-s ejection time.
Capsid mechanics
In all the calculations above we have assumed the capsid to be rigid. In this section we will be concerned with the elastic properties of the capsid, in an effort to understand the interplay between the forces exerted by the packaged DNA and the elastic deformation of the capsid. We will not consider the inelastic changes of the capsid geometry occurring during the early stages of packaging, referred to in the literature under the general heading of capsid maturation or prohead expansion (Black, 1988; Lata et al., 2000).
The mature capsid of bacteriophages such as λ, T7, and HK97 is made up of copies of a few proteins arranged on an icosahedral shell. For the purposes of this analysis we model the capsid as an elastic sphere and assume that the protein subunits making up the capsids undergo only small deformations so that the elastic energy stored in a capsid expanded to a radius Rout is given by
 |
(28) |
where R0 is the equilibrium radius of an empty capsid and κ is a constant measuring the capsid stiffness. An example of such an energy emerges from the simulations of Tama and Brooks (2002), who perturb the positions of atoms in the capsid of a plant virus (CCMV) and measure its energy as a function of radius. They fit a quadratic polynomial in Rout to the energy obtained from their simulations and find
 |
(29) |
The capsid can be described as a thin shell of radius Rout. In the presence of an internal pressure p, the free energy is minimized (Tzlil et al., 2003; Purohit et al., 2003b) when
 |
(30) |
which implies
 |
(31) |
Using Eq. 29 and parameters from a typical phage capsid, p = 40 atm and Rout = 30 nm, we find
 |
(32) |
This change is negligible in comparison to Rout, implying that a phage capsid can be treated as a rigid shell.
The analysis given above estimates the deformation of the capsid in response to the forces exerted by the packaged DNA. It is also of interest to determine the maximum pressure that a capsid can sustain, particularly in view of the osmotic shock experiments on these systems (Cordova et al., 2003). We approach this problem by modeling the capsid as an assemblage of proteins interacting through weak forces such as van der Waal's forces and hydrogen bonds. We note that capsids have thin walls compared to their diameter. For example, the capsid of φ29 is ∼1.5-nm thick, whereas its linear dimensions are of the order of 40–50 nm (see Tao et al., 1998, for data on φ29). We use these ideas in conjunction with a coarse-grained model for the cohesive energies between protein subunits (Reddy et al., 2001) and estimate the maximum pressure sustainable for a capsid to be in excess of 100 atm. The details of the calculations can be found in Purohit et al. (2003b).
THE DNA EJECTION PROCESS
We saw in the previous sections that packaged bacteriophage capsids are pressurized with pressures as high as 60 atm. This has led to the speculation that the high pressure in the bacteriophage provides the driving force for DNA ejection into the host cell (Smith et al., 2001; Kindt et al., 2001; Tzlil et al., 2003). In this section, we examine the feasibility of this hypothesis. Specifically, we show that internal forces explain the results in Evilevitch et al. (2003) on inhibition of DNA ejection from phage λ and allows us to make predictions for bacteriophages with varying genome lengths.
Any experiment in which we can control the amount of DNA ejected from a bacteriophage by the application of external pressure can help us understand whether internal forces drive ejection. In a recent experiment by Evilevitch et al. (2003), λ-bacteriophage were coerced into ejecting their DNA in vitro with the help of a protein called LamB or maltoporin. This protein, found on the outer membrane of Escherichia coli, is the natural receptor for λ . When the phage binds to this protein it ejects its cargo of DNA. The DNA was ejected into solutions of polyethylene glycol 8000 (PEG) of various concentrations, which applied known osmotic pressures to the capsid. Evilevitch et al. (2003) found that osmotic pressures of 20 atm were sufficient to prevent any DNA from leaving the capsid, whereas DNA was partially ejected at lower external pressures.
We can use our model for the forces associated with the packaged DNA to analyze the experiments of Evilevitch et al. (2003). To that end we consider the system of bacteriophage, ejected DNA, and the PEG solution at equilibrium. The energetics of the DNA inside the phage capsid remains the same as discussed earlier in this article. The extra feature we add is the free energy of the ejected DNA-PEG system. Since the persistence length of the DNA (50 nm) is much larger than the persistence length of the PEG molecule (≈1 nm) we model the insertion of the DNA inside the PEG solution as being equivalent to the insertion of a rigid cylindrical rod of radius R inside a solution which exerts osmotic pressure Π0 on the rod. This problem has been studied by Castelnovo et al. (2003) and Evilevitch et al. (2004), who estimate the work of insertion of rigid rod (DNA) into a polymer (PEG 8000) solution as a combination of pressure-volume work, energy associated with creating new surfaces, and the entropic effects associated with polymer in solution. In particular, depletion effects result in a correction term (de Vries, 2001; Odijk, 1996) that may be significant in this case, because the diameter of DNA is comparable to the mesh size of PEG. Here, however, we resort to a simple approximation where we retain only the term associated with the pressure-volume work. Hence the work expended to insert length L0–L of DNA of radius R into the PEG solution is given by
 |
(33) |
The total free energy of the system is the sum of the free energy of the DNA inside the phage capsid and the work of insertion, and is given by
 |
(34) |
We already know that the free energy of the DNA inside the capsid depends on the parameters F0 and c, which in turn depend on the ionic strength of the buffer used in the ejection reaction. The experiment by Evilevitch et al. (2003) involved a buffer of 10 mM MgSO4. Thus we can use the empirical values c = 0.30 nm and F0 = 1.2 × 10⁴ pN/nm2 for Mg2+ solutions as determined earlier. We will use these values for all the fits to the experimental data and for further predictions.
To find L0–L, the ejected length, we need to minimize the free energy Gtot with respect to L. Differentiating Eq. 34 we get, at equilibrium,
 |
(35) |
The first term in the above expression is merely the resisting force F(d(L), L) derived earlier. Consequently Eq. 35 becomes
 |
(36) |
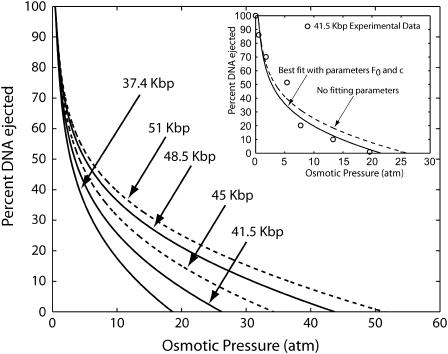
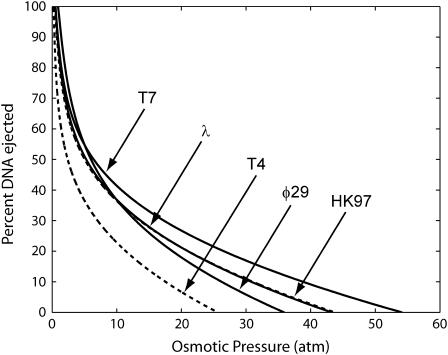
This equation is solved for L for several values of Π0 and the results for the percentage of DNA ejected as a function of osmotic pressure are given in Fig. 12, for different total DNA lengths L0. Experiments are currently underway to examine the extent to which the predictions described here are borne out experimentally. Fig. 13 shows how the model applies to the ejection behavior of other phage under the same solvent conditions as in Evilevitch et al. (2003).
FIGURE 12.
Fractional DNA ejection in λ-phage as a function of osmotic pressure corresponding to experimental conditions in Evilevitch et al. (2003) (10 mM MgSO4). The inset shows the best visual fit to the experimental data of Evilevitch et al. (2003) for λ with genome size 41.5 kbp using parameters F0 and c, and also a parameter free curve obtained from the data of Rau et al. (1984). We see a good match between the experimental findings and the theoretical results. Also shown are the predictions for ejection behavior of λ-phage for genome sizes of 37.4 Kbp, 45 Kbp, 48.5 Kbp, and 51 Kbp under similar experimental conditions.
FIGURE 13.
DNA ejection as a function of osmotic pressure for various wild-type species of bacteriophages for ionic conditions similar to the experiments of Evilevitch et al. (2003) (10 mM MgSO4). The lines show the DNA ejection behavior for T4, HK97, φ29, T7, and λ. Osmotic pressures as high as 35–55 atm are required to inhibit ejection in these bacteriophages.
CONCLUSIONS
This article addresses physical processes in the viral life cycle through a quantitative framework based on insights from structural biology, single molecule biophysics, electron microscopy, and solution biochemistry. The models were motivated by specific experiments on φ29 (Smith et al., 2001) and λ (Evilevitch et al., 2003), but their applicability extends to all dsDNA bacteriophages. In fact, we use our models to predict important features of the packaging and ejection processes in phages other than φ29 and λ.
The key predictions arising from the modeling efforts described here are:
Dependence of forces and spacing on ionic strength. As shown in Figs. 4, 5, 7, and 10, there is a strong dependence of both the spacing of the packaged DNA as well as the forces that build up due to packing on the ionic conditions during the packaging reaction. We suggest systematic experiments to explore these effects.
Dependence of forces and spacing on phage identity. As shown in Figs. 7 and 8, we find a systematic and strong dependence of the packing forces on the particular phage species of interest. In particular, had the experiment of Smith et al. (2001) been carried out in phage T7, we predict a maximum packing force in excess of 100 pN, rather than the 57 pN found in φ29. A simple parameter for developing intuition concerning the forces associated with different phage is ρpack, the ratio of the volume of the genome to the volume of the capsid.
Force steps during packaging. One of the weakest points of the analysis described in this article is the uncertainty that attends the particular structural arrangements of the DNA on the way to the fully packaged state. In particular, we have assumed a sequence of structural states which are all of the inverse spool form and one consequence of this structural picture which might be testable is the presence of steps in both the DNA spacing and forces as shown in Fig. 11.
Dependence of ejection inhibition on genome length, virus type, and solution conditions. The beautiful experiments of Evilevitch et al. (2003) provide a direct window on the forces associated with the packaged DNA. Figs. 12 and 13 represent a wide range of parameter-free prediction for the fractional ejection inhibition that should be seen in such experiments.
Finally, a cautionary note. Experiments have shown that some bacteriophage, such as T7 (Molineux, 2001), may rely on a different mechanism for delivering their genome into the host cell. This is a possibility worthy of further exploration, but we emphasize that viruses may use many different methods or combinations thereof to propagate themselves.
Acknowledgments
We are grateful to Alex Evilevitch, Chuck Knobler, Jon Widom, Bill Gelbart, Andy Spakowitz, Zhen-Gang Wang, Ken Dill, Carlos Bustamante, Larry Friedman, Jack Johnson, Paul Wiggins, Steve Williams, Wayne Falk, Adrian Parsegian, Alasdair Steven, Florence Tama, Vijay Reddy, Charlie Brooks, Peter Privelege, Steve Harvey, Ian Molineux, and Steve Quake.
R.P. and P.P. acknowledge the support of the Keck Foundation, and the support of the National Science Foundation (CMS-0301657) for the Center for Integrative Multiscale Modeling and Simulation at Caltech. J.K. is also supported by the National Science Foundation (DMR-9984471), and is a Research Corporation Cottrell Scholar. P.G. was supported by a National Science Foundation graduate research fellowship.
References
- Arsuaga, J., R. K. Z. Tan, M. Vazquez, D. W. Sumners, and S. C. Harvey. 2002. Investigation of viral DNA packaging using molecular mechanics models. Biophys. Chem. 101–102:475–484. [DOI] [PubMed] [Google Scholar]
- Baker, T. S., N. H. Olson, and S. D. Fuller. 1999. Adding the third dimension to virus life cycles: three-dimensional reconstruction of icosahedral viruses from cryo-electron micrographs. Microbiol. Mol. Biol. Rev. 63:862–922. [DOI] [PMC free article] [PubMed] [Google Scholar]
- Bednar, J., P. Furrer, V. Katritch, A. Z. Stasiak, J. Dubochet, and A. Stasiak. 1995. Determination of DNA persistence length by cryo-electron microscopy. Separation of static and dynamic contributions to the apparent persistence length of DNA. J. Mol. Biol. 254:579–594. [DOI] [PubMed] [Google Scholar]
- Black, L. 1988. DNA packaging in dsDNA bacteriophage. In The Bacteriophages, Vol. 2. R. Calendar, editor. Plenum Press, New York. 321–363.
- Bohm, J., O. Lambert, A. Frangakis, L. Letellier, W. Baumeister, and J. Rigaud. 2001. FhuA-mediated phage genome transfer into liposomes: a cryoelectron tomography study. Curr. Biol. 11:1168–1175. [DOI] [PubMed] [Google Scholar]
- Booy, F. P., W. W. Newcomb, B. L. Trus, J. C. Brown, T. S. Baker, and A. C. Steven. 1991. Liquid-crystalline, phage-like packing of encapsidated DNA in Herpes-Simplex Virus. Cell. 64:1007–1015. [DOI] [PMC free article] [PubMed] [Google Scholar]
- Castelnovo, M., R. K. Bowles, H. Reiss, and W. M. Gelbart. 2003. Osmotic force resisting chain insertion in a colloidal suspension. Eur. Phys. J. E. 10:191–197. [DOI] [PubMed] [Google Scholar]
- Cerritelli, M. E., N. Cheng, A. H. Rosenberg, C. E. McPherson, F. P. Booy, and A. C. Steven. 1997. Encapsidated conformation of bacteriophage T7 DNA. Cell. 91:271–280. [DOI] [PubMed] [Google Scholar]
- Cordova, A., M. Deserno, W. M. Gelbart, and A. Ben-Shaul. 2003. Osmotic shock and the strength of viral capsids. Biophys. J. 85:70–74. [DOI] [PMC free article] [PubMed] [Google Scholar]
- de Vries, R. 2001. Flexible polymer-induced condensation and bundle formation of DNA and F-actin filaments. Biophys. J. 80:1186–1194. [DOI] [PMC free article] [PubMed] [Google Scholar]
- Dokland, T., and H. Murialdo. 1993. Structural transitions during maturation of bacteriophage lambda capsids. J. Mol. Biol. 233:682–694. [DOI] [PubMed] [Google Scholar]
- Earnshaw, W. C., and S. C. Harrison. 1977. DNA arrangement in isometric phage heads. Nature. 268:598–602. [DOI] [PubMed] [Google Scholar]
- Echols, H. 2001. Operators and Promoters: The Story of Molecular Biology and Its Creators. University of California Press, Berkeley, CA.
- Endy, D., D. Kong, and J. Yin. 1997. Intracellular kinetics of a growing virus: a genetically structured simulation for simulation for the growth of bacteriophage T7. Biotechnol. Bioeng. 55:375–389. [DOI] [PubMed] [Google Scholar]
- Evilevitch, A., M. Castelnovo, C. M. Knobler, and W. M. Gelbart. 2004. Measuring the force ejecting DNA from phage. J. Phys. Chem. B. 108:6838–6843. [Google Scholar]
- Evilevitch, A., L. Lavelle, C. M. Knobler, E. Raspaud, and W. M. Gelbart. 2003. Osmotic pressure inhibition of DNA ejection from phage. Proc. Natl. Acad. Sci. USA. 100:9292–9295. [DOI] [PMC free article] [PubMed] [Google Scholar]
- Feiss, M., R. A. Fisher, M. A. Crayton, and C. Egner. 1977. Packaging of the bacteriophage chromosome: effect of chromosome length. Virology. 77:281–293. [DOI] [PubMed] [Google Scholar]
- Flint, S. J., L. W. Enquist, R. M. Krug, V. R. Racaniello, and A. M. Skalka. 2000. Principles of Virology. ASM Press, Washington, DC.
- Gabashvili, I., and A. Grosberg. 1992. Dynamics of double-stranded DNA reptation from bacteriophage. J. Biomol. Struct. Dyn. 9:911–919. [DOI] [PubMed] [Google Scholar]
- Gelbart, W. M., R. F. Bruinsma, P. A. Pincus, and V. A. Parsegian. 2000. DNA-inspired electrostatics. Phys. Today. 53:38–44. [Google Scholar]
- Hershey, A., and M. Chase. 1952. Independent functions of viral protein and nucleic acid in growth of bacteriophage. J. Gen. Physiol. 36:39–56. [DOI] [PMC free article] [PubMed] [Google Scholar]
- Iwasaki, K., B. L. Trus, P. T. Wingfield, N. Cheng, G. Campusano, V. B. Rao, and A. C. Steven. 2000. Molecular architecture of bacteriophage T4 capsid: vertex structure and bimodal binding of the stabilizing accessory protein. Soc. Virology. 271:321–333. [DOI] [PubMed] [Google Scholar]
- Kanamaru, S., P. G. Leiman, V. A. Kostyuchenko, P. R. Chipman, V. M. Mesyanzhinov, F. Arisaka, and M. G. Rossmann. 2002. Structure of the cell-puncturing device of bacteriophage T4. Nature. 415:553–557. [DOI] [PubMed] [Google Scholar]
- Kindt, J., S. Tzlil, A. Ben-Shaul, and W. Gelbart. 2001. DNA packaging and ejection forces in bacteriophage. Proc. Natl. Acad. Sci. USA. 98:13671–13674. [DOI] [PMC free article] [PubMed] [Google Scholar]
- Klug, W. S., and M. Ortiz. 2003. A director field model of DNA packaging in viral capsids. J. Mech. Phys. Sol. 51:1815–1847. [Google Scholar]
- La Scola, B., S. Audic, C. Robert, L. Jungang, X. de Lamballerie, M. Drancourt, R. Birtles, J.-M. Claverie, and D. Raoult. 2003. A giant virus in amoebae. Science. 299:2033. [DOI] [PubMed] [Google Scholar]
- LaMarque, J., T. Le, and S. Harvey. 2004. Packaging double-helical DNA into viral capsids. Biopolymers. 73:348–355. [DOI] [PubMed] [Google Scholar]
- Landau, L. D., and E. M. Lifshitz. 1987. Fluid Mechanics, 2nd Ed. Butterworth-Heinemann, Oxford, UK.
- Lata, R., J. F. Conway, N. Cheng, R. L. Duda, R. W. Hendrix, W. R. Wiko, J. E. Johnson, H. Tsuruta, and A. C. Steven. 2000. Maturation dynamics of a viral capsid: visualization of transitional intermediate states. Cell. 100:253–263. [DOI] [PubMed] [Google Scholar]
- Leiman, P. G., S. Kanamaru, V. V. Mesayanzhinov, F. Arisaka, and M. G. Rossmann. 2003. Structure and morphogenesis of bacteriophage T4. Cell. Mol. Life Sci. 60:2356–2370. [DOI] [PMC free article] [PubMed] [Google Scholar]
- Letellier, L., P. Boulanger, L. Plancon, P. Jacquot, and M. Santamaria. 2004. Main features of tailed phage, host recognition and DNA uptake. Front. Biosci. 9:1228–1239. [DOI] [PubMed] [Google Scholar]
- Lyubartsev, A. P., and L. Nordenskiold. 1995. A Monte Carlo simulation study of ion distribution and osmotic pressure in hexagonally oriented DNA. Phys. Rev. E. 99:10373–10382. [Google Scholar]
- Marenduzzo, D., and C. Micheletti. 2003. Thermodynamics of DNA packing inside a viral capsid: the role of DNA intrinsic thickness. J. Mol. Biol. 330:485–492. [DOI] [PubMed] [Google Scholar]
- Molineux, I. J. 2001. No syringes please, ejection of phage T7 DNA from the virion is enzyme-driven. Mol. Microbiol. 40:1–8. [DOI] [PubMed] [Google Scholar]
- National Center For Biotechnology Information. 2004. Entrez genomes. Http://www.ncbi.nlm.nih.gov/.
- Neidhardt, F. (Editor). 1996. Escherichia coli and Salmonella typhimurium. ASM Press, Herndon, VA.
- Nelson, P. 2003. Biological Physics: Energy, Information, Life. W.H. Freeman, New York.
- Novick, S., and J. Baldeschwieler. 1988. Fluorescence measurement of the kinetics of DNA injection by bacteriophage into liposomes. Biochemistry. 27:7919–7924. [DOI] [PubMed] [Google Scholar]
- Odijk, T. 1983. On the statistics and dynamics of confined or entangled STI-polymers. Macromolecules. 16:1340–1344. [Google Scholar]
- Odijk, T. 1996. Protein-macromolecule interactions. Macromolecules. 29:1842–1843. [Google Scholar]
- Odijk, T. 1998. Hexagonally packed DNA within bacteriophage T7 stabilized by curvature stress. Biophys. J. 75:1223–1227. [DOI] [PMC free article] [PubMed] [Google Scholar]
- Odijk, T. 2004. Statics and dynamics of condensed DNA within phages and globules. Phil. Trans. Roy. Soc. Lon. A. 362:1497–1517. [DOI] [PubMed] [Google Scholar]
- Odijk, T., and F. Slok. 2003. Nonuniform Donnan equilibrium within bacteriophages packed with DNA. J. Phys. Chem. B. 107:8074–8077. [Google Scholar]
- Parsegian, V. A., R. P. Rand, N. L. Fuller, and D. C. Rau. 1986. Osmotic stress for the direct measurement of intermolecular forces. Meth. Enzymol. 127:400–416. [DOI] [PubMed] [Google Scholar]
- Ptashne, M. 2004. Genetic Switch: Phage Lambda Revisited. Cold Spring Harbor Laboratory, Cold Spring Harbor, NY.
- Purohit, P. K., J. Kondev, and R. Phillips. 2003a. Force steps in viral DNA packaging? J. Mech. Phys. Sol. 51:2239–2257. [Google Scholar]
- Purohit, P. K., J. Kondev, and R. Phillips. 2003b. Mechanics of DNA packaging in viruses. Proc. Natl. Acad. Sci. USA. 100:3173–3178. [DOI] [PMC free article] [PubMed] [Google Scholar]
- Raspaud, E., M. O. de la Cruz, J. L. Sikorav, and F. Livolant. 1998. Precipitation of DNA by polyamines: a polyelectrolyte behavior. Biophys. J. 74:381–393. [DOI] [PMC free article] [PubMed] [Google Scholar]
- Rau, D. C., B. Lee, and V. A. Parsegian. 1984. Measurement of the repulsive force between polyelectrolyte molecules in ionic solution: hydration forces between parallel DNA double helices. Proc. Natl. Acad. Sci. USA. 81:2621–2625. [DOI] [PMC free article] [PubMed] [Google Scholar]
- Rau, D. C., and V. A. Parsegian. 1992. Direct measurement of the intermolecular forces between counterion-condensed DNA double helices. Evidence for long-range attractive hydration forces. Biophys. J. 61:246–259. [DOI] [PMC free article] [PubMed] [Google Scholar]
- Reddy, V. S., P. Natarajan, B. Okerberg, K. Li, K. V. Damodaran, R. T. Morton, and C. L. B. J. E. Johnson. 2001. Virus particle explorer (VIPER), a website for virus capsid structures and their computational analyses. Virology. 75:11943–11947. [DOI] [PMC free article] [PubMed] [Google Scholar]
- Richards, K. E., R. C. Williams, and R. Calendar. 1973. Mode of DNA packing within bacteriophage heads. J. Mol. Biol. 78:255–259. [DOI] [PubMed] [Google Scholar]
- Riemer, S. C., and V. A. Bloomfield. 1978. Packaging of DNA in bacteriophage heads: some considerations on energetics. Biopolymers. 17:785–794. [DOI] [PubMed] [Google Scholar]
- Shibata, H., H. Fujisawa, and T. Minagawa. 1987. Characterization of the bacteriophage T3 DNA packaging reaction in vitro in a defined system. J. Mol. Biol. 196:845–851. [DOI] [PubMed] [Google Scholar]
- Simpson, A. A., Y. Tao, P. G. Leiman, M. O. Badasso, Y. He, P. J. Jardine, N. H. Olson, M. C. Morais, S. Grimes, D. L. Anderson, T. S. Baker, and M. G. Rossmann. 2000. Structure of the bacteriophage φ29 DNA packaging motor. Nature. 408:745–750. [DOI] [PMC free article] [PubMed] [Google Scholar]
- Smith, D. E., S. J. Tans, S. B. Smith, S. Grimes, D. L. Anderson, and C. Bustamante. 2001. The bacteriophage φ29 portal motor can package DNA against a large internal force. Nature. 413:748–752. [DOI] [PubMed] [Google Scholar]
- Smith, S. B., L. Finzi, and C. Bustamante. 1992. Direct mechanical measurements of the elasticity of single DNA molecules by using magnetic beads. Science. 258:1122–1126. [DOI] [PubMed] [Google Scholar]
- Strey, H. H., V. A. Parsegian, and R. Podgornik. 1997. Equation of state for DNA liquid crystals: fluctuation-enhanced electrostatic double-layer repulsion. Phys. Rev. Lett. 78:895–898. [Google Scholar]
- Tama, F., and C. L. Brooks. 2002. The mechanism and pathway of pH induced swelling in Cowpea Chlorotic Mottle Virus. J. Mol. Biol. 318:733–747. [DOI] [PubMed] [Google Scholar]
- Tao, Y., N. H. Olson, W. Xu, D. L. Anderson, M. G. Rossmann, and T. S. Baker. 1998. Assembly of a tailed bacterial virus and its genome release studied in three dimensions. Cell. 95:431–437. [DOI] [PMC free article] [PubMed] [Google Scholar]
- Tzlil, S., J. Kindt, W. Gelbart, and A. Ben-Shaul. 2003. Forces and pressures in DNA packaging and release from viral capsids. Biophys. J. 84:1616–1627. [DOI] [PMC free article] [PubMed] [Google Scholar]
- World Health Organization. 2004. Smallpox. Http://www.who.int/mediacentre/factsheets/smallpox/en/.
- Young, R. Y. 1992. Bacteriophage lysis: mechanism and regulation. Microbiol. Rev. 56:430–481. [DOI] [PMC free article] [PubMed] [Google Scholar]


