

Abstract
Historically, predicting macroscopic blood flow characteristics such as viscosity has been an empirical process due to the difficulty in rigorously including the particulate nature of blood in a mathematical representation of blood rheology. Using a two-dimensional lattice Boltzmann approach, we have simulated the flow of red blood cells in a blood vessel to estimate flow resistance at various hematocrits and vessel diameters. By including white blood cells (WBCs) in the flow, we also calculate the increase in resistance due to white cell rolling and adhesion. The model considers the blood as a suspension of particles in plasma, accounting for cell-cell and cell-wall interactions to predict macroscopic blood rheology. The model is able to reproduce the Fahraeus-Lindqvist effect, i.e., the increase in relative apparent viscosity as tube size increases, and the Fahraeus effect, i.e., tube hematocrit is lower than discharge hematocrit. In addition, the model allows direct assessment of the effect of WBCs on blood flow in the microvasculature, reproducing the dramatic increases in flow resistance as WBCs enter short capillary segments. This powerful and flexible model can be used to predict blood flow properties in any vessel geometry and with any blood composition.
INTRODUCTION
Because blood is a non-Newtonian fluid, its rheological properties depend on shear rate and the dimensions and geometry of the conduit through which it flows. Blood is a concentrated suspension of formed elements that includes erythrocytes (red blood cells (RBCs)), leukocytes (white blood cells (WBCs)), and platelets. RBCs are flexible, biconcave disks and constitute ∼45% of blood by volume. Circulating WBCs are approximately spherical in shape with a diameter ∼8–12 μm and are ∼1000 times less abundant than RBCs. Platelets are discoid particles with a diameter ∼2 μm, constituting ∼1/800 of total cell volume. These cellular components are suspended in plasma, an aqueous solution that generally follows Newtonian dynamics. However, the two-phase nature of blood and the interactions between blood cells result in non-Newtonian dynamics, especially in the microcirculation where vessel dimensions become comparable to cell diameters (Popel and Johnson, 2005).
One of the most important properties of blood is the ease with which it flows through the microvasculature. Because flow resistance is affected in many pathological conditions, quantitative approaches have been proposed to characterize the complex rheological properties of blood. For example, flow resistance is often described in terms of apparent viscosity and relative viscosity, which relate blood flow to the Newtonian fluid—the plasma. For Newtonian laminar flow through a circular cylindrical tube, the Hagen-Poiseuille solution describes the pressure drop per length:
 |
(1) |
where Δp is the pressure drop in length ΔL, μ is the viscosity of the fluid, r is the radius of the tube, and Q is the volume rate of flow. For a non-Newtonian fluid such as blood, this equation does not apply, but we can still measure the Δp/ΔL and Q and calculate an apparent viscosity, μapp:
 |
(2) |
If μ0 denotes the viscosity of the plasma, then the ratio μapp/μ0 is defined as relative viscosity, and is denoted by μrel.
Apparent and relative viscosities are not intrinsic properties of the blood: both vary with hematocrit, RBC aggregation state, and vessel geometry. Apparent viscosity can be measured in any flow in which the Newtonian solution is known (e.g., Eq. 2), and relative viscosity can be extended to any flow system; if its structural geometry and elasticity are unknown we need only measure flow and pressure with and without blood cells to calculate the relative viscosity.
The particulate nature of blood results in some interesting flow characteristics in the microvasculature. In vitro measurements have shown that the apparent viscosity is a function of both RBC concentration (hematocrit) and vessel diameter. In long tubes of diameter <∼200 μm the apparent viscosity of blood decreases precipitously with decreasing diameter, reaching a minimum at diameters of ∼5–7 μm, which corresponds to the range of capillary blood vessels. This trend is known as the Fahraeus-Lindqvist effect (Fahraeus and Lindqvist, 1931). As the tube diameter decreases further, the apparent viscosity rises because the blood cells are larger than the conduit, and must be deformed to maintain flow. The Fahraeus-Lindqvist effect has been confirmed in vitro by a large number of investigators (Goldsmith et al., 1989).
The Fahraeus-Lindqvist effect is related to another anomalous flow property of blood known as the Fahraeus effect. In Poiseuille flow, RBCs and plasma do not travel at the same average velocity. This results in differences in tube and discharge hematocrits. The tube hematocrit is defined as the ratio of RBC volume within a vessel to the total volume of the vessel. The discharge hematocrit is defined as the ratio of RBC flow rate to the whole-blood flow rate. Fahraeus and many subsequent investigators performed experiments with blood flow in glass tubes; they found that the tube hematocrit (measured by stopping the flow and emptying the tube contents) is consistently smaller than the discharge hematocrit measured in the collecting reservoir. The higher velocity of the RBCs compared to the plasma is caused by RBC migration toward the flow axis and formation of a cell-depleted layer near the wall. As a result, the apparent viscosity of blood is lower than the bulk viscosity of the uniform suspension as measured in tubes of large diameter or in rotational viscometers (Couette flow).
It is not only the red blood cells that determine the flow characteristics of blood. White blood cells, despite their relatively low number compared to RBCs, contribute dramatically to organ blood flow resistance. Helmke et al. (1997) observed that at constant arterial flow rate, arterial pressure was increased significantly when relatively few leukocytes were added to a suspension containing erythrocytes at physiological hematocrits. However, without RBCs, perfusion with isolated leukocytes only slightly increased the arterial pressure. An increase in resistance was also observed when leukocytes were replaced with 6-μm microspheres. This demonstrates that the mechanism for increasing the hemodynamic resistance involves mechanical interactions between leukocytes and erythrocytes.
Although the above qualitative aspects of blood flow resistance are widely recognized, a rigorous, quantitative description of these effects has been elusive. The non-Newtonian rheology is largely due to the plasma-rich zone that forms near the wall. At a normal hematocrit of ∼40%, this cell-depleted layer is only a few micrometers and it varies with hematocrit, flow rate, and tube geometry. Because this thickness is on the order of the cell dimensions, the problem falls between the continuum and discrete descriptions. In two-phase continuum models, the Newtonian viscous fluid represents the RBC core and an annular concentric layer of a less viscous Newtonian fluid represents the cell-depleted layer (Secomb, 2003; Sharan and Popel, 2001).
But to describe the rheology of blood rigorously, we need to explicitly account for its particulate nature. Some progress has been made in simulations of RBCs (Eggleton and Popel, 1998) or leukocytes (N'Dri et al., 2003; Shyy et al., 2001) to measure their deformation in response to the shear flow. But considering the difficulty in simulating individual RBCs, these approaches are not easily extended to multiparticle systems with physiological numbers of particles. Multiparticle simulations with nondeformable cells in Couette flow have been used to characterize the secondary capture of leukocytes (King and Hammer, 2001b), the interaction between stably rolling spheres (King and Hammer, 2001a), and spherical erythrocyte trajectories with and without leukocyte adhesion (King et al., 2004). However, these studies did not address the overall changes in bulk blood rheology due to interactions of individual cells. In addition, the biconcave shape of the RBC and the blunted parabolic velocity profile impart unique flow properties to blood, causing, for example, the Fahraeus-Lindqvist effect. These effects were not reproduced in the aforementioned multiparticle simulations.
Previously, we developed a mathematic model using a lattice Boltzmann method to characterize the interactions and estimate the forces involved as individual RBCs (modeled as capsules or ellipses) and WBCs interact in capillaries (Migliorini et al., 2002) and in postcapillary expansions (Sun et al., 2003). This model is also ideally suited for analyzing the rheological properties of concentrated cell suspensions. In this study, we use this lattice Boltzmann approach to bridge the gap between individual cell dynamics and bulk blood rheology. We assess the effects of RBC concentration and conduit size on blood flow and quantify the additional resistance contributed by flowing, rolling, and firmly adhering leukocytes. Using this approach, we can reproduce the Fahraeus and Fahraeus-Lindqvist effects by explicitly accounting for the particulate nature of blood. This represents a first step toward achieving a fundamental understanding of the complex fluid dynamics of blood.
METHODS
Fluid and particle dynamics
As a relatively new numerical scheme for simulating complex flow and transport phenomena, the lattice Boltzmann method (LBM) (Chen et al., 1992; Qian et al., 1992) provides an alternative approach in cases where direct solution of the Navier-Stokes equations is not practical. Unlike conventional computational fluid dynamics methods based on macroscopic continuum equations, the LBM uses a mesoscopic equation (the Boltzmann equation) to determine macroscopic fluid dynamics. The efficiency of this approach arises from its “local” nature—only the neighboring nodes need to be considered to update the equilibrium distribution at each time step. Because of its flexibility and local nature, it is easily parallelized and scaled up and has been successfully applied to various physical problems, including single component hydrodynamics, multiphase and multicomponent fluid flows, magneto-hydrodynamics, reaction-diffusion systems, flows through porous media, and solid particle suspensions.
Due to the simplicity of treating moving boundaries, LBM can be easily adapted to the analysis of fluid suspensions of a large number of particles. For these reasons, a lattice Boltzmann method is used to calculate the unsteady flow field and the forces acting on suspending particles in this work. In Fig. 1, the red cells are represented by two-dimensional (2-D) capsules (rectangles with superimposed half-circles at the ends) and white cells are modeled as a disk with adhesion molecules distributed around the circumference.
FIGURE 1.

A disk representing a leukocyte rolls on the wall of a vessel. The leukocyte interacts with the wall through receptor-ligand interactions and a nonspecific repulsive force. The forces and torques of individual bonds are summed (FL, TL) and applied to the leukocyte together with the hydrodynamic forces and the torque (FH, TH). Cells circulate between the two gray parallel lines. Fluid particle velocities of a 2-D lattice Boltzmann model with nine velocities are illustrated at the left lower corner.
The LBM solves a discretized BGK (authors' initials from the original article; Bhatnagar et al., 1954) form of the Boltzmann equation for the fluid particle density distribution:
 |
(3) |
Ωj is the BGK collision operator, τ is a relaxation time, x is the location of the lattice node, and cj is the particle velocity;  is the equilibrium distribution that is determined by the fluid density and momentum:
 |
Once the particle density distribution is known, we calculate the fluid density, ρ, and momentum, ρ v, using:
 |
(4) |
where m is the mass of the fluid particle that may be set to 1. It is well established that with an appropriate equilibrium distribution function and suitable physical limits, the fluid density and velocity obtained using this approach are equivalent to those obtained using the following rigorous Navier-Stokes equations for Newtonian fluids (Bernardin et al., 1991; Qian et al., 1992; Sun, 2000; Sun and Hsu, 2003)
 |
where p is the pressure, v is the velocity, ν is the kinetic viscosity that is given by ν = (2τ − 1)/6 in this model.
The technique used in this work for simulating the dynamics of impermeable particle suspensions is based on the approaches of Aidun et al. (1998) and Ladd (1994). The method solves the lattice Boltzmann equations on a square lattice with nine directions for the fluid phase that are coupled with the Newtonian rotation and translation of solid particles suspended in the fluid through solid-fluid interactions. The cell motion follows Newton's law:
 |
(5) |
where up is the velocity of the cell, mp is the mass of the cell, ωp is the angular velocity, T is the torque, I is inertia, and F is the net force acting on the cell. For RBCs, F is the hydrodynamic force. For leukocytes, F includes the hydrodynamic force and the ligand force FL acting between the leukocyte and the vessel wall (see below). If two cell boundaries approach within 1.6 grids (corresponding to 0.48 μm) of each other, a collision force and torque are included in F and T to keep the boundaries from overlapping. We determine the two locations, designated rA and rB, on the apposing cell surfaces where the separation distance is minimum. vA and vB are the velocities of the two points rA and rB. The velocity of point rA relative to point rB is vAB = vA − vB. If (rA − rB)·vAB < 0, the two gap points are approaching each other and a pair of impulsive forces Fc and −Fc, respectively, are applied to rA and rB. The force Fc is determined by the mass and inertia of the cells so that after collision the two gap points separate with relative velocity −vAB.
Receptor-ligand model for leukocyte rolling
As in our previous work (Migliorini et al., 2002; Sun et al., 2003), we use an adhesion model (Chang and Hammer, 1996; Dong et al., 1999; Hammer and Apte, 1992; Zao et al., 2001) to describe cell attachment, rolling, and firm adhesion in flow (see Fig. 1). The receptor-ligand bonds are modeled as springs, which provide a force along the bond direction given by:
 |
(6) |
where L is the bond length, λ is the equilibrium bond length, and σ is the spring constant. The forces contributed by individual ligand-receptor bonds are summed to determine the total bond force and the torque acting on the cell during the period Δt. If the receptor-ligand distance Yl is less than a critical value Hc (40 nm), a new bond can form with a finite probability Pf:
 |
(7) |
where kon = kfNL, kf is the forward reaction rate, and NL is the ligand density. A preexisting bond is broken with probability Pr, which increases with its current load:
 |
(8) |
where kb is the Boltzmann constant, T is the temperature, kr0 is the reverse reaction rate, and σ* is the transition state spring constant (see Table 1 for parameter definitions).
TABLE 1.
Simulation parameters
| Parameter | Definition | Value (reference) |
|---|---|---|
| RBC diameter | 8.4 μm (Skalak and Chien, 1987) | |
| RBC thickness | 1.98 μm (Skalak and Chien, 1987) | |
| Rc | Disk radius | 4.5 μm (Skalak and Chien, 1987) |
| λ | Equilibrium bond length | 20 nm (Chang and Hammer, 1996) |
| kf | Forward reaction rate | 85 s−1 (Chang et al., 2000) |
| kr0 | Reverse reaction rate | 1·10−2 s−1 (Chang and Hammer, 1996) |
| σ | Spring constant | 2·10−3 N/m (Chang and Hammer, 1996) |
| σ* | Transition state spring constant | 1·10−3 N/m (Chang and Hammer, 1996) |
| T | Temperature | 310 K (Chang and Hammer, 1996) |
| ν | Plasma kinematic viscosity | 1.2·10−6 m2/s (Skalak and Chien, 1987) |
| uL | Mean inlet velocity | 1000 μm/s (Schmid-Schobein et al., 1980) |
| ρc | Disk density | 1070 Kg/m3 (Skalak and Chien, 1987) |
| ρd | RBC density | 1098 Kg/m3 (Skalak and Chien, 1987) |
| ρf | Fluid density | 1000 Kg/m3 (Skalak and Chien, 1987) |
| Hc | Critical height | 40 nm (Chang et al., 2000) |
| D | Vessel diameter | 20–40 μm (Skalak and Chien, 1987) |
| Re | Reynolds number (uLD/ν) | 1.667·10−2–3.333·10−2 |
| NL | Ligand density | 47/μm2 (Chang and Hammer, 1996) (600 ligands along the cylinder peripheral circumference located every 0.45 μm) |
RESULTS
We present five categories of simulations: Case A with RBCs only; Case B with RBCs and one nonadhesive WBC; Case C with RBCs and one rolling WBC; Case D with RBCs and one firmly adhering WBC; and Case E with RBCs and one deformed, adhering WBC. Each case includes six simulations with conduits of 20- and 40-μm width and three different hematocrits (∼0.1, 0.2, and 0.3 Hct). The mean entrance velocity was 1000 μm/s. The Reynolds number was 1.67 × 10⁻² for the 20-μm conduit and 3.33 × 10⁻² for the 40-μm conduit. The simulation for the 40-μm conduit (using 360 × 140 grids) uses ∼20 MB memory and takes 0.029 s per time step on a Pentium IV 3.06-GHz computer. The lattice Boltzmann method is stable for the lattice Boltzmann relaxation time τ > 1/2, which is set to 1 in our simulations, corresponding to a time step of 1.25 × 10⁻⁸ s.
Case A: flow with RBCs only
The left panel of Fig. 2 A shows snapshots of well-developed flow in a 20-μm conduit with tube hematocrits 0.116, 0.204, and 0.305. The velocity field is represented by arrows, and pressure coefficient contours are coded by color in the computational domain. The pressure coefficient is defined as  where U0 is the mean entrance velocity, p is the local pressure, and p0 is the pressure at the exit. To reduce the entrance/exit effects, the following boundary condition is used. The cells circulate between the two parallel cell boundary lines (CBL), one upstream and the other downstream; a cell exiting the downstream CBL reenters at the upstream CBL. While a cell is crossing the downstream CBL, a copy of this cell is created at the upstream CBL to account for its interaction with other cells near the upstream CBL. The copied cell is not shown in the figure until the original cell has completely crossed the downstream CBL. A steady parabolic velocity profile is imposed at entrance of the computational domain and a constant pressure p0 is imposed at the exit. This approach eliminates significant entrance and exit effects because the entrance and exit are far away from the region of observation between the two CBLs. The number of cells, and consequently, the tube hematocrit are constant. The hematocrits are calculated based on the vessel volume between the two CBLs. At the top of each snapshot, the corresponding average plasma velocity profiles (normalized by the mean entry velocity U/U0) across the normalized conduit cross section are shown at a time interval of 7.5 × 10⁻³ after the flow is fully developed. The black parabolic lines are the velocity profiles at zero hematocrit. As hematocrit increases from ∼0.1 to 0.3, interactions between cells cause the velocity profiles to become increasingly flattened and the pressure drop between the two CBLs increases (see pressure contours). At constant flow rate, an increase in pressure drop indicates an increase in flow resistance, and therefore, apparent viscosity.
FIGURE 2.
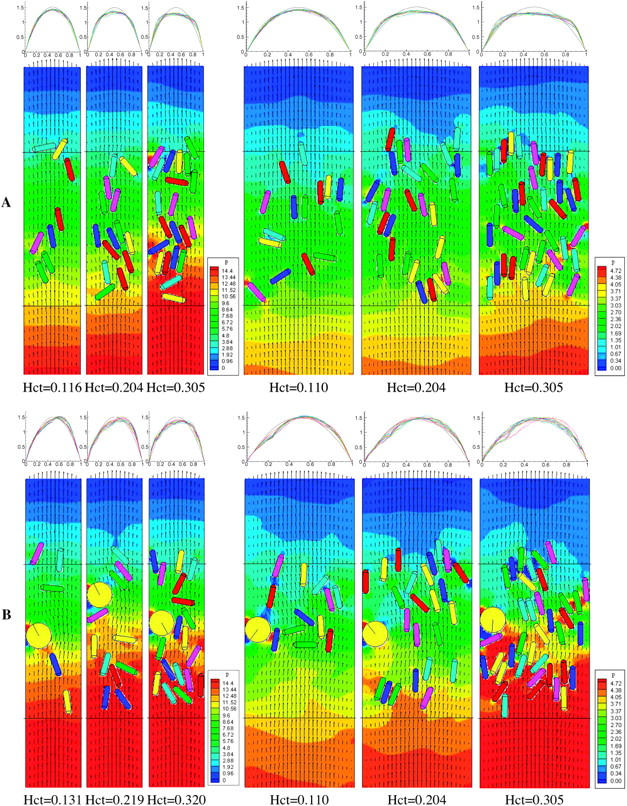
(A) Simulations without a WBC (Case A). Flow is from bottom to top. (Left) Snapshots of cell distributions with velocity fields (represented by arrows) and pressure contours in a 20-μm conduit with tube hematocrits 0.116, 0.204, and 0.305. (Right) Snapshots in a 40-μm conduit with tube hematocrits 0.110, 0.204, and 0.305. The computational domain is 20 × 108 μm for the 20-μm conduit and 40 × 108 μm for the 40-μm conduit. The cells circulate between the two parallel cell boundary lines, which are separated by 54 μm. The corresponding average plasma velocity profiles (normalized by the mean entrance velocity) U/U0 across the conduit cross section are shown at a time interval of 7.5 × 10⁻³ s after the flow is fully developed (top panels). The black parabolic lines are the velocity profiles at zero hematocrit. (B) Simulations with one nonadhesive WBC (Case B). (Left) Snapshots of cell distributions, velocity fields, and pressure coefficient contours in a 20-μm conduit with tube hematocrits 0.131, 0.219, and 0.320. (Right) Snapshots in a 40-μm conduit with tube hematocrits 0.110, 0.204, and 0.305.
In the right panel of Fig. 2 A, the conduit width is increased to 40 μm. Note that the velocity profile deviates from parabolic as hematocrit increases (0.110, 0.204, 0.305), but not as dramatically as it does in the 20-μm conduit. The increase in pressure drop is also not as great. For direct comparison, the relative apparent viscosities of all the simulation cases are summarized in Fig. 5.
FIGURE 5.

(a) Relationship between relative apparent viscosity and discharge hematocrit. The dashed lines represent the data from Pries et al. (1992). Red represents the 40-μm tube and blue the 20-μm tube. In the simulations with a WBC, the relative apparent viscosities are calculated based on a single WBC in the 54-μm channel. The relative apparent viscosities at various WBC counts can be deduced from Eq. 9 or Eq. 11. (b) The ratio of tube hematocrit to discharge hematocrit versus discharge hematocrit.
Case B: flow with RBCs and one nonadhesive WBC
The presence of leukocytes significantly affects blood flow resistance and blood flow distribution in the microcirculation despite the small number ratio of leukocytes relative to RBCs in normal circulation (∼1/1000). In Case B, we assess how a WBC influences the pressure distribution and velocity profile as blood flows in 20- and 40-μm conduits.
The left panel of Fig. 2 B shows one WBC flowing with RBCs in a 20-μm conduit with cell volume fractions 0.131, 0.219, and 0.320. Here, the cell volume fraction includes both the WBC and RBCs. Without ligand-receptor binding, the WBC slides and rotates without interacting with the wall. The average speeds of the WBC are 669, 710, and 813 μm/s for the three runs respectively. These speeds are lower than the mean flow velocity of 1000 μm/s because of the cell's proximity to the wall. The velocity profiles are asymmetric and the flow resistances are higher than those in Case A.
The right panel of Fig. 2 B shows the corresponding simulation in a 40-μm conduit with cell volume fractions 0.110, 0.204, and 0.305. The average WBC velocities are 305, 309, and 363 μm/s for the three runs, respectively. These speeds are much lower than those in the 20-μm conduit shown in the left panel because of the lower shear in the larger conduit. Again, the velocity profiles are asymmetric, and a large pressure drop occurs across the WBC. However, this effect is weaker than that in the smaller conduit.
Case C: flow with RBCs and one adhesive WBC
In Case C, we allow the WBC to interact with the conduit wall through ligand-receptor binding. The initial conditions of this case are the same as in Case B.
The left panel of Fig. 3 A depicts one WBC flowing with RBCs in a 20-μm conduit. The average speeds of the WBC are lower than in Case B due to the adhesive drag: 472, 534, and 681 μm/s for the three hematocrits, respectively. The WBC rolling speed increases with RBC concentration because it is affected by RBC-WBC collision frequency and blunting of the velocity profile. Although the hematocrits of these three runs are comparable to the corresponding hematocrits of Case A in Fig. 2 A, a rolling WBC changes the pressure distribution and the velocity profiles dramatically. The slowly rolling WBC makes the velocity profiles strongly asymmetric (see velocity profiles at top) and induces a large pressure drop across the vessel (see pressure contour). Therefore, the presence of the rolling WBC induces more flow resistance than RBCs alone (Fig. 2 A of Case A) or a noninteracting WBC (Fig. 2 B of Case B).
FIGURE 3.

Simulations with one adhesive WBC. (A, left) Snapshots of cell distributions, velocity fields, and pressure coefficient contours in a 20-μm conduit with tube hematocrits 0.131, 0.219, and 0.320. (A, right) Snapshots in a 40-μm conduit with tube hematocrits 0.110, 0.204, and 0.305. (B) Three close-up snapshots at various times for the run of hematocrit 0.320 in a 20-μm conduit (corresponding to the third frame of panel A). Image a shows the initial cell distribution; the velocity and the pressure fields are those of steady flow without cells (i.e., plasma flow). Images b and c are taken at a time interval of 7.5 × 10⁻³ after the flow is well developed. Images (a)′−(c)′ are the corresponding closeups of the ligand-receptor bonds between the WBC and the wall. The color of the bonds indicates the relative age of the bond (black > blue > green > red).
In the right panel of Fig. 3 A, the conduit width is increased to 40 μm. The average rolling speeds of the WBC are 188, 216, and 269 μm/s for the three hematocrits, respectively. These velocities are much lower than those in the 20-μm conduit because the WBC is subjected to lower shear in this larger conduit at the same mean flow velocity. Again, the slowly rolling WBC makes the velocity profiles asymmetric and induces a large pressure drop, but the effect is much weaker than that in the small conduit (see left panel) because the WBC occupies less of the conduit width.
Fig. 3 B shows three closeups of snapshots at different times for the run of hematocrit 0.320 in a 20-μm conduit (corresponding to the third frame of panel A). Fig. 3 B (a) depicts the initial cell distribution; the velocity and the pressure fields are those of steady flow without cells (i.e., plasma flow). Fig. 3 B (b and c) are taken at a time interval of 7.5 × 10⁻³ after the flow is well developed. Fig. 3 B ((a)′−(c)′) shows the corresponding closeups of the ligand-receptor bonds between the WBC and the wall. The color of the bonds indicates the age of the bond (black > blue > green > red). The individual bond force is in the same direction of the bond.
Case D: flow with RBCs and one firmly adhering WBC
The initial conditions of this case are the same as in Cases B and C shown in Figs. 2 B and 3 A, except that the WBC is stationary. The left panel of Fig. 4 A shows RBCs flowing in a 20-μm tube. The WBC blocks approximately half of the conduit and induces much higher flow resistance compared to Cases B and C.
FIGURE 4.

Simulations with one firmly adherent WBC (panel A for Case D) and with one deformed adherent WBC (panel B for Case E). (A and B, left) snapshots of cell distributions, velocity fields, and pressure coefficient contours in a 20-μm conduit with tube hematocrits 0.131, 0.219, and 0.320. (A and B, right) snapshots in a 40-μm conduit with tube hematocrits 0.110, 0.204, and 0.305.
The right panel of Fig. 4 A shows the corresponding simulation in the 40-μm conduit. Blocking approximately one-quarter of the conduit, the WBC introduces less flow resistance than in the smaller conduit shown in the left panel, but much higher than the moving WBCs in Cases B and C. Again, the highly asymmetric velocity profiles are flattened as the hematocrit increases.
Case E: flow with RBCs and one deformed, adherent WBC
In reality, firmly adhering WBCs deform in response to fluid shear. To assess how cell deformation affects the flow resistance, Case E includes a half-disk at the wall to represent a deformed, firmly adherent WBC. The half-disk has the same area as the WBCs in Cases B–D, which means the ratio of the radii is  The initial conditions of this case are the same as in Case D. The left panel of Fig. 4 B shows flowing RBCs in a 20-μm conduit. The WBC blocks approximately one-third of the conduit and flow resistance is much lower than Case D.
The right panel of Fig. 4 B shows the corresponding simulation in the 40-μm conduit. Blocking approximately one-sixth of the conduit, the WBC introduces less flow resistance compared to the same size conduit in Case D or the smaller conduit shown in the left panel. Again, the highly asymmetric velocity profiles are flattened as the hematocrit increases.
DISCUSSION
Our simulations demonstrate that the flow resistance depends on hematocrit, conduit dimensions, and WBC dynamics. A summary of these simulations in terms of relative apparent viscosity and discharge hematocrit reveals the Fahraeus-Lindqvist and Fahraeus effects (Fig. 5). Based on experimental data, Pries et al. (1992) proposed an empirical formula for the relative viscosity in tube flow. For comparison, the relative apparent viscosities calculated from our simulations and from their formula were plotted in Fig. 5 a. Fig. 5 b shows the ratio of tube hematocrit to discharge hematocrit.
Fahraeus-Lindqvist effect
The Fahraeus-Lindqvist effect predicts that the apparent viscosity of blood in long tubes <∼200 μm in diameter decreases with decreasing diameter, reaching a minimum at diameters of ∼7 μm. The relative apparent viscosity increases monotonously with hematocrit. Fig. 5 a shows that the simulations without WBCs (squares) have the same tendency as the empirical relationship (dashed lines) for the 20-μm tube (blue) and 40-μm tube (red); at equivalent hematocrits, the relative apparent viscosity is higher in larger conduits than in the small conduit, in accordance with Fahraeus-Lindqvist effect. The slight deviation from the empirical formula (compare the squares with the dashed lines) is presumably due to the nonflexibility of the cells and to the two-dimensional geometry of our model. With rigid particles (hardened RBCs), previous studies have shown that the velocity profile is more blunt and that the resistance to flow is higher than with normal blood (Fung, 1981). Our two-dimensional model actually simulates flow between two parallel plates instead of in a cylindrical tube. The ratio of the volume of the cell-free plasma layer near the wall to the total volume of the conduit is higher in a cylindrical tube than between parallel plates. Therefore, our two-dimensional simulations may underestimate the lubrication effect of the plasma layer, which in turn, results in a higher relative viscosity.
Fahraeus effect
For flow in small tubes, the tube hematocrit (HT) is smaller than the discharge hematocrit (HD) because the mean RBC velocity is higher than the mean blood velocity. This is the Fahraeus effect. A simple mass balance analysis yields HT/HD = U/UC, where U is the mean velocity of the particle suspension (cells plus plasma) and UC is the cell mean velocity. Fig. 5 b shows the hematocrit ratio calculated using this formula. For the cases without WBCs (squares), the ratio is ∼0.86 for 20 μm conduits and ∼0.91 for 40 μm conduits, in agreement with the Fahraeus effect. These values agree well with Secomb's results obtained by the modified axial-train model, although they are higher than those from in vitro experiments (∼0.75 for 20-μm tubes and ∼0.79 for 40-μm tubes; Secomb, 2003). The deviation from the in vitro data is likely due to the 2-D geometry and the rigidity of cells of this model, which hinders axial migration of RBCs (Goldsmith and Karino, 1977; Goldsmith and Marlow, 1979).
WBCs influence viscosity
Because of the clinical implications of microvascular stasis, the flow resistance induced by WBCs has been of great interest (Chapman and Cokelet, 1997, 1998; Das et al., 2000). Previous studies have calculated the increase in resistance generated by a stationary sphere in a cylindrical vessel by assuming Newtonian fluid dynamics (Chapman and Cokelet, 1998). Using a Casson model to represent the effect of red blood cell aggregation in the core and a Newtonian fluid for the cell free plasma layer near the wall, Das et al. (2000) estimated the increase in flow resistance caused by a WBC in a narrow tube. However, the strong dependence of flow resistance on hematocrit found in this study indicates that the particulate nature of blood must be considered to accurately simulate blood flow.
The presence of WBCs can produce an apparent reversal of the Fahraeus-Lindqvist effect; with WBCs, the relative apparent viscosities were higher in the 20-μm channel than the 40-μm channel. With a rolling WBC (Fig. 5, circles), the relative apparent viscosity increases significantly compared to flow with RBCs only (squares) at the same hematocrit (see Fig. 5 a). Because the slow rolling WBC occupies a larger portion of the channel in a small tube than in a large tube, the WBC affects the flow more dramatically in the small tube. This is also true with noninteracting WBCs and firmly adherent WBCs. However, the increase in relative apparent viscosity is less in the cases of nonadhesive WBCs (flowing near the wall) and much higher with firmly adherent WBCs. A WBC flowing in the center of the flow stream rather than near the wall does not significantly affect the relative apparent viscosity in a 40-μm channel. However, in the 20-μm conduit, the increase in resistance is ∼20% at a hematocrit of 0.3 but <5% at lower hematocrits (data not shown).
Case E shows that deformation of a firmly adhering WBC significantly reduces flow resistance. This is potentially important in inflammation, where more than one WBC enters a single vessel segment; flattening of already-bound WBCs can lower flow resistance, allowing passage of additional WBCs into that same segment.
The reversal of the Fahraeus-Lindqvist effect described above is due to our restriction of the analysis of viscosity to a 54-μm region up- and downstream from the WBC. Although this local viscosity is strongly influenced by the presence of the WBC, in a longer channel, the effect would be diluted. Indeed, in our simulations, the WBC/RBC ratio is much higher than that in vivo, because reducing the WBC concentration to physiological levels we require a much larger computational domain. To estimate the relative viscosity for any length (i.e., any WBC concentration), we can consider a conduit of length L containing Nsw sliding, Nrw rolling, Nfw firmly adherent, and Ndw deformed, adherent WBCs. Suppose the WBCs are separated by at least L0, the length in which the WBC effect on the flow is restricted, and that the relative viscosities over a conduit of length L0 for RBCs (μR-r), a sliding WBC (μR-sw), a rolling WBC (μR-rw), a firmly adherent WBC (μR-fw), and a deformed, adherent WBC (μR-dw) are known. Assuming a linear dependence, we may estimate the overall relative viscosity in the conduit L using the following formula:
 |
(9) |
where Lr is the equivalent length for flow with RBCs only:
 |
(10) |
Equation 9 can be rearranged to give:
 |
(11) |
The terms in the parentheses represent the differences in viscosity relative to RBC flow, which result from the WBCs.
By this analysis, a single WBC rolling in a 40-μm diameter, 500-μm-long vessel segment would increase the relative viscosity from 1.752 to 1.818 (compared to flow with only RBCs). In a 20-μm diameter segment of the same length, the corresponding increase due to the WBC is from 1.496 to 1.670.
Thus, in a longer channel, the Fahraeus-Lindqvist effect overpowers the influence of the WBC, and the viscosity is larger in the larger channel, as predicted by Fahraeus and Lindqvist. It is important to note, however, that in very short vessel segments, this reversal may occur, resulting in very high resistance to flow in short capillaries containing WBCs. The WBCs do not appear to affect the Fahraeus effect, as the discharge hematocrits are higher than the tube hematocrits in all cases.
It is important to note that the 2-D geometry of our simulations may overestimate the flow resistance caused by WBCs adhering in three-dimensional tubes. For example, a WBC with diameter 9 μm blocks nearly 50% of the cross-sectional area of a 20-μm channel in 2-D, but only ∼25% in a three-dimensional cylindrical tube. Using a two-phase model, Das et al. (2000) estimated a 15% increase in flow resistance at 0.4 hematocrit caused by a firmly adhering WBC in a 100-μm long, 18-μm diameter cylindrical tube, and a 5% increase in a 32-μm diameter tube. To compare with their results, we performed simulations with the height of the adherent WBC adjusted so that the percentage of the cross-sectional area blocked was the same as Das's (Das et al., 2000) case. Using Eq. 11 to convert the relative viscosity to that in a 100-μm-long tube, the adherent WBC caused a 22% increase in flow resistance at 0.31 hematocrit in a 20-μm channel and a 5.6% increase in a 40-μm channel. The remaining discrepancy between our results and those of Das et al. (2000) may be due to the explicit inclusion of particles in our model or additional geometry considerations.
CONCLUSION
We have estimated apparent viscosities of blood flow in conduits over a physiological range of hematocrits. Our lattice Boltzmann model, which explicitly accounts for the particulate nature of blood, not only captures the details of cell-cell and cell-wall interactions, but also the overall blood rheology. Our simulations show that flow resistance depends on hematocrit, conduit size, and the presence and behavior of WBCs. Despite a slight deviation from empirical predictions, our simulations reproduce the Fahraeus-Lindqvist and Fahraeus effects, and predict high resistance to flow in short capillary segments containing interacting or noninteracting WBCs. Future work should extend these studies to a three-dimensional geometry and introduce flexible cells.
Acknowledgments
We acknowledge Drs. R. K. Jain, C. Migliorini, Y. H. Qian, H. D. Chen, J. Baish, A. Mulivor, M. Dupin, and C. K. Aidun for helpful discussions.
This work was supported by National Institutes of Health grant R01 HL64240 (L.L.M.).
References
- Aidun, C. K., Y. Lu, and E. J. Ding. 1998. Direct analysis of particulate suspensions with inertia using the discrete Boltzmann equation. J. Fluid Mech. 373:287–311. [Google Scholar]
- Bernardin, D., O. E. Seroguillaume, and C. H. Sun. 1991. Multispecies 2D lattice gas with energy-levels: diffusive properties. Physica D. 47:169–188. [Google Scholar]
- Bhatnagar, P., E. Gross, and M. Krook. 1954. A model for collision processes in gases. 1. Small amplitude processes in charged and neutral one-component systems. Phys. Rev. 94:511–525. [Google Scholar]
- Chang, K., and D. A. Hammer. 1996. Influence of direction and type of applied force on the detachment of macromolecularly bound particles from surfaces. Langmuir. 12:2271–2282. [Google Scholar]
- Chang, K., D. F. J. Tees, and D. A. Hammer. 2000. The state diagram for cell adhesion under flow. Proc. Natl. Acad. Sci. USA. 97:11262–11267. [DOI] [PMC free article] [PubMed] [Google Scholar]
- Chapman, G. B., and G. R. Cokelet. 1997. Model studies of leukocyte-endothelium-blood interaction. Biorheology. 34:37–56. [DOI] [PubMed] [Google Scholar]
- Chapman, G. B., and G. R. Cokelet. 1998. Flow resistance and drag forces due to multiple adherent leukocytes in postcapillary vessels. Biophys. J. 74:3292–3301. [DOI] [PMC free article] [PubMed] [Google Scholar]
- Chen, H., S. Chen, and W. H. Matthaeus. 1992. Lattice Boltzmann model for simulating flows with multiple phases and components. Phys. Rev. A. 45:5339–5342. [DOI] [PubMed] [Google Scholar]
- Das, B., P. Johnson, and A. Popel. 2000. Computational fluid dynamic studies of leukocyte adhesion effects on non-Newtonian blood flow through microvessels. Biorheology. 37:239–258. [PubMed] [Google Scholar]
- Dong, C., J. Cao, E. J. Struble, and H. H. Lipowsky. 1999. Mechanics of leukocyte deformation and adhesion to endothelium in shear flow. Ann. Biomed. Eng. 27:298–312. [DOI] [PubMed] [Google Scholar]
- Eggleton, C. D., and A. S. Popel. 1998. Large deformation of red blood cell ghosts in a simple shear flow. Phys. Fluids. 10:1834–1845. [DOI] [PMC free article] [PubMed] [Google Scholar]
- Fahraeus, R., and T. Lindqvist. 1931. The viscosity of the blood in narrow capillary tubes. Am. J. Physiol. 96:562–568. [Google Scholar]
- Fung, Y. C. 1981. Biodynamics. Springer-Verlag, New York.
- Goldsmith, H. L., G. R. Cokelet, and P. Gaehtgens. 1989. Robin Fahraeus: evolution of his concepts in cardiovascular physiology. Am. J. Physiol. 257:H1005–H1015. [DOI] [PubMed] [Google Scholar]
- Goldsmith, H. L., and T. Karino. 1977. Microscopic considerations: the motions of individual particles. Ann. N. Y. Acad. Sci. 283:241–255. [Google Scholar]
- Goldsmith, H. L., and J. C. Marlow. 1979. Flow behavior of erythrocytes. II. Particle motions in concentrated suspensions of ghost cells. J. Colloid Interface Sci. 71:383–407. [Google Scholar]
- Hammer, D. A., and S. M. Apte. 1992. Simulation of cell rolling and adhesion on surfaces in shear flow: general results and analysis of selectin-mediated neutrophil adhesion. Biophys. J. 63:35–37. [DOI] [PMC free article] [PubMed] [Google Scholar]
- Helmke, B. P., S. N. Bremne, B. W. Zweifach, R. Skalak, and G. W. Schmid-Schonbein. 1997. Mechanisms for increased blood flow resistance due to leukocytes. Am. J. Physiol. 273:H2884–H2890. [DOI] [PubMed] [Google Scholar]
- King, M. R., D. Bansal, M. B. Kim, and I. H. Sarelius. 2004. The effect of hematocrit and leukocyte adherence on flow direction in the microcirculation. Ann. Biomed. Eng. 32:803–814. [DOI] [PubMed] [Google Scholar]
- King, M. R., and D. A. Hammer. 2001a. Multiparticle adhesive dynamics interaction between stably and rolling cells. Biophys. J. 81:799–813. [DOI] [PMC free article] [PubMed] [Google Scholar]
- King, M. R., and D. A. Hammer. 2001b. Multiparticle adhesive dynamics: hydrodynamic recruitment of rolling leukocytes. Proc. Natl. Acad. Sci. USA. 98:14919–14924. [DOI] [PMC free article] [PubMed] [Google Scholar]
- Ladd, A. C. J. 1994. Numerical simulations of particulate suspensions via a discretized Boltzmann equation. Part 1. Theoretical foundation. J. Fluid Mech. 271:285–309. [Google Scholar]
- Migliorini, C., Y. Qian, H. Chen, E. Brown, R. Jain, and L. Munn. 2002. Red blood cells augment leukocyte rolling in a virtual blood vessel. Biophys. J. 83:1834–1841. [DOI] [PMC free article] [PubMed] [Google Scholar]
- N'Dri, N. A., W. Shyy, and R. Tran-Son-Tay. 2003. Computational modeling of cell adhesion and movement using a continuum-kinetics approach. Biophys. J. 85:2273–2286. [DOI] [PMC free article] [PubMed] [Google Scholar]
- Popel, A. S., and P. C. Johnson. 2005. Microcirculation and hemorheology. Annual Review of Fluid Mechanics. 37:43–69. [DOI] [PMC free article] [PubMed] [Google Scholar]
- Pries, A. R., D. Neuhaus, and P. Gaehtgens. 1992. Blood viscosity in tube flow: dependence on diameter and hematocrit. Am. J. Physiol. 263:H1770–H1778. [DOI] [PubMed] [Google Scholar]
- Qian, Y. H., D. d'Humieres, and P. Lallemand. 1992. Lattice BGK models for Navier-Stokes equations. Europhys. Lett. 17:479–483. [Google Scholar]
- Schmid-Schobein, G. W., S. Usami, R. Skalak, and S. Chien. 1980. The interaction of leukocytes and erythrocytes in capillary and postcapillary vessels. Microvasc. Res. 19:45–70. [DOI] [PubMed] [Google Scholar]
- Secomb, T. W. 2003. Mechanics of red blood cells and blood flow in narrow tubes. In Modeling and simulation of capsules and biological cells. C. Pozrikidis, editor. Chapman & Hall/CRC, Boca Raton, FL; London, UK; New York, NY; Washington, DC. 163–196.
- Sharan, M., and A. S. Popel. 2001. A two-phase model for flow of blood in narrow tubes with increased effective viscosity near the wall. Biorheology. 38:415–428. [PubMed] [Google Scholar]
- Shyy, W., M. Francois, H. S. Udaykumar, N. N'Dri, and R. Tran -Son-Tay. 2001. Moving boundaries in micro-scale biofluid dynamics. ASME: Appl. Mech. Rev. 54:405–453. [Google Scholar]
- Skalak, R., and S. Chien. 1987. Handbook of Bioengineering. McGraw-Hill, New York, NY.
- Sun, C. H. 2000. Adaptive lattice Boltzmann model for compressible flows: viscous and conductive properties. Phys. Rev. E. 61:2645–2653. [Google Scholar]
- Sun, C. H., and A. T. Hsu. 2003. Three-dimensional lattice Boltzmann model for compressible flows. Phys. Rev. E. 68:016303. [DOI] [PubMed] [Google Scholar]
- Sun, C. H., C. Migliorini, and L. L. Munn. 2003. Red blood cells initiate leukocyte rolling in postcapillary expansions: a lattice Boltzmann analysis. Biophys. J. 85:208–222. [DOI] [PMC free article] [PubMed] [Google Scholar]
- Zao, Y., S. Chien, and S. Weinbaum. 2001. Dynamic contact forces on leukocyte microvilli and their penetration of the endothelial glycocalyx. Biophys. J. 80:1124–1140. [DOI] [PMC free article] [PubMed] [Google Scholar]