

Abstract
Brownian adhesive dynamics (BRAD) is a new method for simulating the attachment of viruses to cell surfaces. In BRAD, the motion of the virus is subject to stochastic bond formation and breakage, and thermal motion owing to collisions from the solvent. In the model, the virus is approximated as a rigid sphere and the cell surface is approximated as a rigid plane coated with receptors. In this article, we extend BRAD to allow for the mobility of receptors in the plane of the membrane, both before and after they are ligated by viral attachment proteins. Allowing the proteins to move within the membrane produced several differences in behavior from when the receptors are immobilized. First, the mean steady-state bond number is unaffected by changes in cellular receptor density because proteins are now free to diffuse into the contact area, and the extent of binding is dictated by the availability of viral attachment proteins. Second, the time required to reach steady-state binding increases as both the cellular receptor number decreases and the receptor mobility decreases. This is because receptor diffusion is a slower process than the binding kinetics of the proteins. Decreasing the rate of protein binding was found to decrease the fraction of viruses bound to steady state, but not the extent of binding for those viruses that were bound. Increasing the binding rate increased the fraction of viruses bound, until no further viruses could bind. Alterations in receptor binding kinetics had no discernable effect on the mean steady-state bond number between virus and cell, because interactions were of sufficiently high affinity that all available receptor-viral attachment proteins were destined to bind at steady state.
INTRODUCTION
For a virus to infect a host cell, it must first attach itself to the host cell membrane, usually through binding to cell surface receptors. A potential target for reducing the infection rate of a virus is inhibition of receptor-mediated attachment. At times, increasing the infection rate of a virus is desired—e.g., in the manufacture of vaccine or in transfection of cells with viral vectors for gene expression or gene therapy. If the attachment of viruses to host cells is improved, the efficiency of processes that use viruses is improved. Therefore, a detailed understanding of the mechanisms controlling viral attachment would be valuable for manipulating virus cell-attachment throughout biotechnology.
One way to model the attachment of viruses to cell is to simulate it. We recently developed a simulation method called Brownian adhesive dynamics (BRAD), in which the motion of a virus is subject to Brownian and adhesive forces. BRAD simulations are an extension of adhesive dynamics (AD) simulations, originally developed in the Hammer laboratory to model receptor-mediated leukocyte adhesive phenomena (Hammer and Apte, 1992; Tees et al., 2001; King and Hammer, 2001). In AD, the motion of the particle is calculated by a force balance on the particle, where the adhesive and hydrodynamic forces are balanced. The adhesive forces are calculated by modeling the bonds as Hookean springs. The formation and breakage of bonds is calculated by sampling distance-dependent probability distributions for the formation and breakage of bonds.
To extend AD to viruses, thermal motion was added, since viruses are nanometric particles whose dominant source of motion is from thermal collisions with solvent molecules. A discussion of prior methods for simulating virus attachment to cells can be found in English and Hammer (2004), as well as Wickham et al. (1990) and Perelson (1981).
In BRAD, the motion of the virus derives from a balance of thermal, adhesive, and hydrodynamic forces; the adhesive forces and hydrodynamic drag are calculated the same way as in AD. The method is completely general, capable of simulating multiple different ligand/receptor pairs between the virus and cell, extendable to any geometry, and to any virus/cell system. In this article, the use of BRAD is demonstrated using kinetic rate data from gp120/CD4 interactions in HIV.
In our previous article using BRAD to simulate the adhesion of viruses, we assumed the receptors are immobile in the plane of the membrane. We expect that some of the results we found would be critically dependent on this assumption. For example, we found that the extent of binding (number of ligated viral attachment proteins) at steady state is typically less than calculated using the equivalent site hypothesis for the same molecular binding rates (English and Hammer, 2004); the extent of binding is likely to be much greater when receptors can diffuse into the viral-cell contact zone. Further, the ability for lateral motion to relieve stress on adhesion molecules should lead to longer-lived molecular interactions and more robust adhesion. Given the experimentally measured rates of lateral mobility of membrane proteins, typically from 10−11 to 10−9 cm2/s, measured by techniques such as fluorescence recovery after photobleaching (Koppel et al., 1976; Axelrod et al., 1976), we would expect membrane lateral mobility to have little effect on the probability for viral attachment on subsecond timescales, but could produce significant effects on viral binding over experimentally observable times on the order of seconds. In this article, we incorporate protein diffusion in BRAD, by modeling each cellular receptor protein as a point undergoing a random walk restricted to the plane of the membrane; if a protein is involved in a bond, the force of the bond influences the movement of the protein within the plane. The methodology described here would be useful for modeling other cell-contact phenomena where protein diffusion within the cellular membrane has been shown to play an important role, such as the formation of the immunological synapse (Qi et al., 2001).
In this article, an overview of the BRAD method will be presented. First a discussion of the techniques used to model Brownian motion will be described, followed by a description of adhesive dynamics. The modifications necessary to model the diffusion of proteins within the membrane will be explained. Then a comparison between the predictions of BRAD simulations for viral docking with and without membrane protein diffusion will be made. We will determine how the number of bonds at steady state and the fraction of bound viruses are affected by receptor lateral mobility. In addition, we will examine how rates of membrane diffusion and kinetic reaction between receptor and viral attachment protein affect the time for approaching steady state. Overall, we believe this article to describe the most comprehensive and accurate model for viral docking to a cell membrane currently available.
MODELS
Brownian adhesive dynamics
BRAD is a method to calculate the trajectory of a virus by solving the equations of motion. When the virus is too far from the surface to bind molecularly, a Brownian motion algorithm developed by Torquato and Kim (1989) is used to generate the random walk.
When the virus is sufficiently close to bind molecularly, three forces incorporated into the momentum balance on the virus are Brownian, deterministic, and bonding. Brownian forces are the random forces caused by collisions between the particle and the solution molecules. Deterministic forces are caused by interfacial interactions between virus and cell surface (electrostatic, steric stabilization, and van der Waals interactions), and hydrodynamic drag. The bonding forces result from the extension or compression of receptor-viral attachment protein bonds between virus and cell.
To incorporate the force of the bonds on the motion of the particle, the Brownian motion simulation technique presented in Allen and Tildesley (1987) is used. At each time step in the algorithm, pairs of viral and cellular binding proteins are examined for bond formation. The probabilistic model for bond formation and breakage of Dembo et al. (1988) is used to determine the rates of bond formation and breakage. The rate of bond formation and breakage is given as
 |
(1) |
where kf is the rate of bond formation,  is the intrinsic rate of bond formation, kr is the rate of bond breakage,
  is the intrinsic rate of bond breakage, σ is the spring constant of the bond, σts is the transition-state spring constant, xm is the length of the bond, λ is the equilibrium length of the bond, kb is the Boltzmann constant, and T is the temperature. To determine if a bond is formed, first the end-to-end separation distance of the receptor and viral attachment protein is calculated. Then a uniformly distributed random variable is generated. If that number is less than the cumulative probability given by
 |
(2) |
a bond is formed. To determine if a bond is broken, the length of the bond is calculated, and a uniformly distributed random variable is generated. Then if that number is less than the cumulative probability given by
 |
(3) |
the bond is broken. A diagram of the coordinate system used is shown in Fig. 1. For more details on the BRAD method, see English and Hammer (2004).
FIGURE 1.

Schematic of the coordinate system used in BRAD.
Protein motion within the membrane
The technique of Allen and Tildesley can also be used to model the motion of the proteins within the membrane itself. These differential equations describe the position and velocity of the protein,
 |
(4) |
where r is the vector of positions, v is the vector of velocities, β is the inverse of the viscous relaxation time, A is the vector of accelerations caused by the random forces resulting from thermal motion, and K is the vector of accelerations resulting from deterministic forces caused by the bonds between the virus and cell (Chandrasekhar, 1943). We assume that the forces on the proteins are not sufficient to remove the proteins from the membrane, or to deform the membrane. Thus, because we model the membrane as a plane—reasonable because the diameter of the cell is orders-of-magnitude larger than the diameter of the virus—we need only use the equations associated with the x and y directions to model the protein's path. Only the x and y components of the force from the bond effects the motion of the protein. The inverse of the viscous relaxation time can be written as
 |
(5) |
where kb is the Boltzmann constant, T is the temperature, m is the mass of the protein, and D is the experimentally observed diffusivity of the protein in the membrane. Typical values for D range from 10−11 to 10−9 cm2/s (Eldridge et al., 1980; Schlessinger et al., 1977a,b).
Equation 4 is integrated using an integrating factor. The trajectories for the proteins can then be generated by evaluating the solutions of the differential equations at specified time steps δt,
 |
(6) |
where ∂rG is a random position vector and ∂vG is a random velocity vector. The random position and velocity vectors result from the integration of the random accelerations on the protein. The elements of these two random vectors must be chosen in a position-velocity pairwise-fashion from a bivariate Gaussian distribution. The distribution has a zero mean, and variance and correlation coefficient given by
 |
(7) |
Note that it is assumed that δt is chosen small enough so that the deterministic forces can be approximately constant throughout the time step. For a detailed derivation of these equations and the distributions from which ∂rG and ∂vG are sampled, see Allen and Tildesley (1987) as well as Chandrasekhar (1943).
Selection of the diffusing subset of proteins
The size of the plane used to simulate the cell membrane is ∼35 viral diameters along each edge. By using a plane, the effects of curvature on the hydrodynamic motion of the virus or on the diffusion of receptors are ignored; since the size of the cell is much larger than that of the virus, we expect these effects to be relatively minor compared to other simplifications of the model, such as the assumption that the membrane is planar on superviral length-scales. Using a plane of this size requires the tracking the motion of as many as 2500 cellular proteins. To improve computational efficiency, two steps are taken. First, protein motion is not tracked until the first bond between the virus and the cell has formed. Second, an accounting procedure is used to update the position of only those molecules within a specified distance of the virus. Once a bond is formed, and once every 105 time steps thereafter, the cellular proteins within two viral diameters of the virus center projected on the cellular plane are marked. The diffusive paths of the marked proteins are the only diffusive protein paths generated. To prevent the density of the cellular receptor proteins from decreasing, every protein that diffuses outside of two diameters from the projected viral center on the plane is replaced by a protein from outside the marked region due to diffusive motion. The point of replacement is selected by choosing a point at random on the circle determined by all points on the plane that are the length Rl from the center of the projected virus center on the plane. The value of Rl is given by
 |
(8) |
where d is the viral diameter, and Rl is the expected distance that a protein could diffuse into the diffusing set of proteins in the time between the diffusing protein subset updates. A schematic diagram of the virus, the circle of diffusing proteins, and the ring on which proteins are replaced is shown in Fig. 2. The frequency with which the receptor positions are updated, the size of the region over which the receptors are tracked, and the positions at which a new protein could be introduced into the diffusing protein subset was selected so that any edge effects caused from the introduction of new receptors would be minimal (i.e., sufficiently far from the region where receptor-viral attachment binding was occurring). Occasionally, because the virus is free to move as well, a newly generated subset of diffusing cellular proteins will have a higher number of proteins than the previous set. Nothing is done to remove these additional proteins. However, no steps are taken to replace any proteins that diffuse out of the diffusing set until the number of diffusing proteins drops below the original number. If virus movement causes a reduction in the number of proteins, proteins are replaced on the ring in the same manner as if protein diffusion alone caused a reduction in the number of proteins. This method keeps the surface density of free cellular receptors within 1% of the number of cellular proteins within the subset when the first bond was formed at all times.
FIGURE 2.

Looking down on the x,y cellular plane, a schematic of the scheme for selecting which cellular receptor proteins will have diffusive paths generated. Proteins, represented by an x, within two viral diameters of the virus center will diffuse. If the number of proteins within the diffusing area decreases, proteins are replaced on the ring Rl from the center of the virus.
Flowchart for BRAD simulations
A flowchart describing the overall structure of BRAD simulations is shown in Fig. 3. First, a virus particle and cell surface is created. This is done by uniformly distributing viral attachment proteins on the surface of the virus, and uniformly distributing receptors on the cell surface. At the beginning of each time step, each bonding molecule pair is examined to determine if a bond is formed or broken. If the first bond is formed—or if the prescribed number of time steps from the last protein marking has elapsed—the cellular receptor proteins within two viral diameters of the virus center are marked so that their diffusive paths will be simulated. The number of marked proteins is counted and if it has decreased since the last marking, proteins are replaced on the ring Rl from the virus center until the count is brought back to the original number. Then the forces on the virus and each diffusing protein are evaluated and their positions and velocities updated according to Eq. 6. If the virus is unbound and only under the influence of thermal forces, the maximum distance that the particle can move before it encounters a bonding molecule or a region of deterministic forces is calculated. Then the far-field motion algorithm, based on the work of Torquato and Kim (1989), is used to update the positions and velocities of the virus. At the end of each time step, the virus is examined to see if it has moved out of the volume of interest. If the virus has moved outside of the volume of interest a new virus and cell surface are generated. Otherwise, bonding pairs are evaluated and the process repeats until a prescribed number of time steps have been taken.
FIGURE 3.

Flowchart describing the overall structure of BRAD simulations.
Bond crossover frequency
With the cellular receptors free to diffuse, it is possible for a bond to pass through another bond, unless a repulsive term is incorporated into the diffusion model to prevent this nonphysical event from occurring. The addition of the repulsive term would require the evaluation of bond-to-bond separation of each existing bond pair in each time step. Before committing the additional computational time to such an endeavor, a test was conducted to see how frequently bond crossover occurs.
To check for bond crossover, it is necessary to examine two bonds: A and B, shown in Fig. 4. The first step is to find the two points on A and B that are closest to each other. This is done by solving the equation for the scalars S, T, and R,
 |
(9) |
where Ao and Bo are the position of bonds A and B on the cellular plane respectively, and α is the direction of the bond. Equation 9 can be derived using the equations that find the point on a line closest to a point in space (Thomas and Finney, 1992). The magnitude of the direction vector is chosen so that when S or T is equal to one, the equation for the respective bond gives the position of the bond on the virus surface. Thus, physical values for S or T are those between zero and one. Equation 9 finds the position along bonds A and B that generates a vector co-linear with the normal to the plane determined by the directions of A and B. If A and B are parallel, there are an infinite number of points along A and B that are closest. In this case, S and T are set to zero. For values of S and T outside the physical range, the scalars are set equal to one for values >1 and zero for values <0. To determine the probability of bond crossing, bond B is allowed to diffuse becoming B*. In Fig. 4 the change in position is exaggerated for clarity. (The distance that a bond would diffuse over a nanosecond time step is on the order of a picometer.) Equation 9 is now solved for S* and T*. It is defined that bond crossover has occurred in the time step if the following inequality is true:
 |
(10) |
Geometrically, the inequality represented by Eq. 10 is true only if the direction of the line from the closest points on A to B is >90° from the direction of the line from the closest points on A to B*. Given that the time step is small enough, the only way for the inequality expression (Eq. 10) to hold is if bond B passed through bond A on its way to becoming bond B*. Incorporating the above mathematical steps into BRAD, a simulation was run using a protein diffusivity equal to 10−10 cm2/s. Two separate virus particles were simulated for 10−2 s. During the simulations, 3.6 × 10⁸ bound protein diffusive moves were made. Of these, 8212 of the moves resulted in bond crossover. The fraction of diffusive moves that resulted in bond crossover was 2.3 × 10⁻⁵. For >96% of the simulation time, there were ≥17 bonds between the virus and cell. In our view, the amount of bond crossover is sufficiently small that it can be neglected without the loss of major physical insight.
FIGURE 4.

Schematic of analysis used to determine bond crossover. Bond A is a virus/cell bond in the contact area. Bond B is a virus/cell bond that is about to undergo a diffusive step. Bond B* represents the new position of bond B after its diffusive step. If the line connecting the closest points on bond A and bond B points is in the opposite direction of the line connecting the closest points on bond A and bond B*, bond B has passed through bond A on its way to bond B*.
MODEL PARAMETERS
In this article, we will use a model virus similar to HIV to illustrate the value of BRAD. Kinetic rates of CD4/gp120 binding will be used. A discrepancy between HIV structure and the model virus used here is the trimerization of gp120 which will lead to steric effects not yet incorporated in the model. However, the model is illustrative of the basic principles of virus binding. The parameters used in this article are summarized in Table 1. Because spring constant data is not available for the CD4-gp120 protein-protein interaction specifically, we use spring constants consistent with other protein-protein interactions reported in the literature. A study of the effect of spring constant on this system is found in English and Hammer (2004).
TABLE 1.
Physical parameters used in the simulation
| Parameter | Value | Reference |
|---|---|---|
| Virus diameter | 90 nm | Murphy et al. (1995) |
| Length virus attachment protein | 8 nm | Murphy et al. (1995) |
| Length cellular receptor | 6.3 nm | Kwong et al. (1998) |
| Length of unstressed bond | 14.3 nm | |
| Number of virus attachment proteins on virus surface | 72 | Hlavacek et al. (1999) |
| Bond spring constant | 1.2 × 10⁻¹ N/m | Chang and Hammer (2000) |
| Transition-state spring constant | 1.1 × 10⁻¹ N/m | Chang and Hammer (2000) |
| Physiological cellular receptor density | 6.3 × 10¹¹ mol/cm2 | Dimitrov et al. (1992) |
 |
1.4 × 10⁵/s | Dimitrov et al. (1992) |
 |
3 × 10⁻⁴/s | Dimitrov et al. (1992) |
| δt | 1 ns | English and Hammer (2004) |
Diffusivity of cellular receptor proteins in the membrane
The diffusivity of proteins free to move within a cell membrane has been observed for several different protein/cell membrane systems. Fluorescence-recovery-after-photobleaching measurements of protein diffusivity within the membrane have been on the order of 10−10 cm2/s regardless of the protein examined (Eldridge et al., 1980; Schlessinger et al., 1977a,b). In this article the physiological cellular receptor diffusivity is set at 10−10 cm2/s, so that it is in agreement with many experimental observations of protein diffusivity within a membrane. Also, it is assumed that the diffusivity is not significantly affected by the surface density of cellular receptors over the range of surface density of cellular receptors examined.
RESULTS
As an illustration of the information typically gathered during a BRAD simulation with diffusible proteins, Fig. 5 depicts the accumulation of proteins underneath the virus. The duration of this simulation illustrated in Fig. 5 is 48,300 μs. Unbound proteins are represented by open circles. Bound proteins are represented by solid circles. The circles only represent the center of a protein position. They are not a space-filling representation of the proteins. Protein density and diffusivity was set at 1.6 × 10¹¹ sites/cm2 and 10−9 cm2/s, respectively. This value of the diffusivity was used for this calculation simply to illustrate how proteins accumulate under the virus; the diffusivity is 10−10 cm2/s elsewhere unless otherwise noted. The center of the virus is kept in the center of each frame. During this simulation a cluster of bound proteins developed under the virus. It is also important to note that the virus was displaced from a position of (−12.5 nm, 14.9 nm) at 100 μs to a position of (−25.3 nm, −46.0 nm) at 48,300 μs. Thus protein diffusion aids bond formation in two ways: proteins are free to diffuse into the contact area, and the virus is free to explore the surface of the cell for free proteins. Because this movement of virus and protein takes longer than bond formation, the binding is limited by the rate of protein diffusion. This quick initial binding and slow secondary binding is in agreement with simulations performed by Sild et al. (1996), who examined ligand binding to a surface.
FIGURE 5.
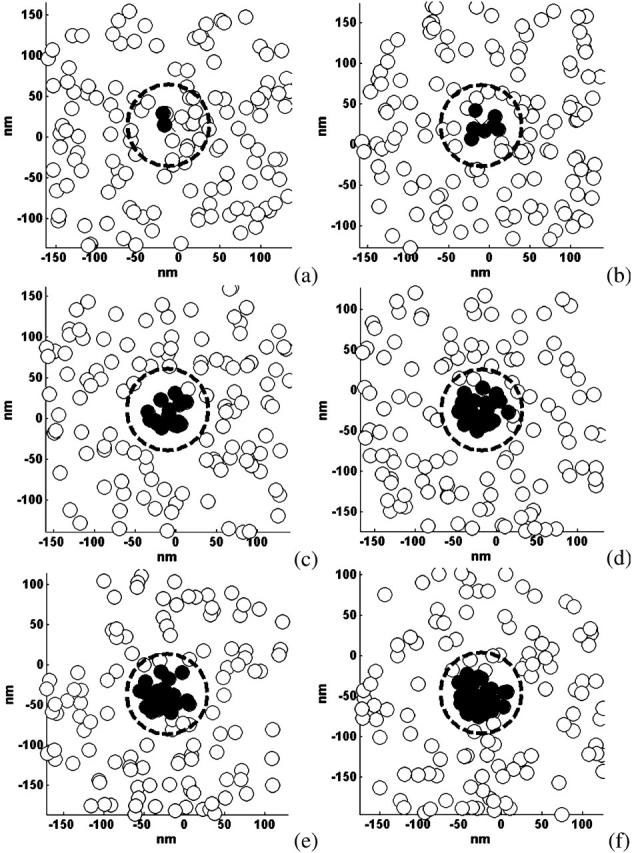
Accumulation of proteins under the virus. The figure looks down on the membrane x,y plane as proteins—unbound represented by open circles, bound represented by solid circles—diffuse underneath the virus. The center of the virus is kept in the center of the frame with the virus edge denoted by a dotted line. Frames a–f depict times 100 μs, 1000 μs, 7000 μs, 20,400 μs, 36,600 μs, and 48,300 μs, respectively. The bond numbers are 2, 7, 16, 24, 26, and 27 for frames a–f, respectively. Protein density and diffusivity was set at 1.6 × 10¹¹ sites/cm2 and 10−9 cm2/s, respectively.
Effect of protein mobility on the time to reach steady-state bond number
Fig. 6 is a plot of a typical individual trajectory for the number of bonds between the virus and cell as a function of time as the density of cell surface receptors and the receptor diffusivity is altered. The individual curves on the plot are individual realizations and not illustrations of average behavior. Times at which a binding event occurs are denoted by symbols. For most of the curves illustrated here, the cellular receptor density is one-quarter that of the physiological value given in Table 1. At this receptor density, the cellular receptor density is less than that of the viral attachment protein (VAP) density. At the cellular receptor density in Table 1, the receptor density exceeds the VAP density.
FIGURE 6.

Bond number trajectories for several parameter values. The trajectories represented with a diamond and a solid line, a square and a solid line, a triangle and a solid line, and a star and a dashed line were generated from simulations using a membrane protein density of 1.6 × 10¹¹ sites/cm2 and protein diffusivities 10−16 m2/s, 10−14 m2/s, 10−12 m2/s, and 0 m2/s, respectively. The trajectory represented with a cross and a solid line was generated using a protein density of 6.3 × 10¹¹ sites/cm2 and a membrane protein diffusivity of 10−14 m2/s.
Typically, we will refer the results of this article to those calculated previously, when receptors were fixed and immobile on the cell membrane (English and Hammer, 2004). For the same intrinsic kinetics, when the receptors are fixed in the membrane, the binding of the virus to the cell reaches steady state by 0.001 s. Allowing the membrane proteins to diffuse at 1/100th the physiological receptor diffusivity, 10−12 cm2/s, more bonds form between virus and cell at steady state, but the diffusion of the proteins limits the rate at which the binding occurs. The time required for binding to reach steady state when the receptor diffusivity is 10−12 cm2/s is ≫1 s. An increase in the receptor diffusivity leads to a decrease in the time to reach steady-state binding. At the physiological membrane protein diffusivity, 10−10 cm2/s, the diffusivity of receptors again limits the extent of binding at any time. However, the time between observed binding events is less than with the protein diffusivity of 10−12 cm2/s, and steady-state bond number can be reached by 0.4 s. By 0.4 s, all of the viral attachment proteins available for binding have been occupied; thus the steady-state level of viral-receptor binding represents the upper limit of binding possible due to the availability of viral attachment proteins. For a simulation with a protein diffusivity 100-times the physiological value, 10−8 cm2/s, binding occurs rapidly and continues to increase with time, aided by receptor diffusion, to levels exceeding that at lower diffusivities (triangles on Fig. 6); diffusion is less of an impediment to binding under these conditions. Fig. 7 displays the time required to reach steady state for each of the receptor diffusivities examined in Fig. 6 for the simulations used to generate Fig. 6—in which the cellular receptor density was 1.6 × 10¹¹ sites/cm2. Receptor diffusivities above 10−10 cm2/s do not appreciably decrease the time to steady-state binding, and at that limit the reaction becomes limited by the kinetics of receptor binding. Receptor diffusivities below 10−10 cm2/s cause a longer time to steady state, and the reaction is limited by receptor diffusion.
FIGURE 7.

Time required to reach steady-state binding as a function of the protein diffusivity. Protein density was set at 1.6 × 10¹¹ sites/cm2.
The curve illustrating the greatest binding in Fig. 6 is a simulation using the physiological diffusivity and a physiological cellular receptor density. At this receptor density, sufficient proteins are in position to form bonds with the virus, and the recruitment of additional receptors strengthens the adhesion between virus and cell, but does not change the outcome of virus binding. The additional recruitment of receptors to the virus-cell contact zone over a timescale of tenths of seconds leads to an increase of binding to steady state over this timescale, until the viral attachment proteins are saturated.
Effect of protein mobility on the mean bond number at steady state
Fig. 8 is a plot of the mean steady-state number of bonds as a function of cell surface receptor density. Data represented with diamonds were generated using BRAD where the receptor diffusivity was zero. Data represented by squares were generated using BRAD where the receptor diffusivity was 10−10 cm2/s. The error bars represent the 90% confidence interval for the mean, and a total of 30 viruses were simulated in each case. When receptors are fixed, decreasing the surface density of receptors decreases the mean steady-state bond number, since the binding of the virus is limited by the number of cell surface receptors in the contact zone, and that number is not replenished by receptor diffusivity. The mean bond number for one-eighth, one-quarter, and physiological density is 4.3, 4.8, and 7.6, respectively. These are significant changes in the mean bond number. However, when the receptors are free to move, the mean steady-state bond number is significantly higher, since receptors can accumulate within the contact zone until all the available viral attachment proteins are occupied. In addition, when the receptors can diffuse, the steady-state level of binding is independent of receptor density, since receptors will continue to enter the contact zone and bind until all the viral attachment proteins are bound. Thus, the steady-state level of binding is set by the density of viral attachment proteins when receptors are mobile.
FIGURE 8.

Mean bond number as a function of cellular receptor density. Error bars depict the 90% confidence interval. Data represented with diamonds were generated from simulations with cellular protein diffusivity set to 0. Data represented with squares were generated from simulations with cellular protein diffusivity set to 10−14 m2/s. With diffusing proteins, there is no effect of surface density on the mean bond number. Without diffusing proteins, the mean bond number decreases if the receptor surface density decreases.
Effect of protein mobility on the fraction of viruses that bind to steady state
Fig. 9 illustrates the effect of protein diffusivity on the fraction of viruses that bind to steady state. Data represented by diamonds represent the fraction of viruses bound in the absence of receptor diffusivity. Data represented by squares represent the fraction of viruses bound in the presence of receptor diffusivity. Error bars denote the 90% confidence interval for the mean. Clearly, the fraction of viruses that bind to steady state is unchanged by protein diffusion. This suggests whether the virus initially docking to the cell depends on the configuration of cell surface receptors, and that diffusivity is not sufficiently fast to affect the probability of viral docking. However, as illustrated in Fig. 8, receptor diffusivity will clearly influence the extent of receptor-mediated binding once a virus does successfully bind.
FIGURE 9.

Fraction of viruses that reach a stable bond number as a function of the surface density of cellular receptors. Points represented by squares are from the mobile protein model. Points represented by diamonds are from the immobile protein model. The error bars represent the 90% confidence interval. The effect of protein mobility on the fraction of viruses that bind is statistically insignificant. Protein diffusivity was set to 10−14 m2/s.
The role of kfo in mean bond number and fraction of viruses that bind to steady state
Values illustrated in Table 1 for the intrinsic kinetic bond formation and breakage rates,  and
and  were based upon the experimental work of Dimitrov et al. (1992) for the binding of soluble CD4 to gp120. However, to generalize our work, we anticipate that a wide variety of receptor-viral attachment proteins are responsible for virus binding, and hence we study here the sensitivity of virus binding and mean virus/cell steady-state bond number to changes in
Using a cellular receptor density of 1.6 × 10¹¹ molecules/cm2, we simulated viral binding with different values of the intrinsic bond formation rate, for cases in which the receptors were either fixed or mobile. Fig. 10 presents the effect of changing the intrinsic on-rate, displayed as the dimensionless ratio of the on-rate— —and the physiological on-rate—
 —on the mean steady-state bond number. Consistent with Fig. 8, Fig. 10 illustrates that the mean steady-state bond number is higher when the receptors are permitted to diffuse. However, Fig. 10 also shows that changing the intrinsic bond formation rate over the three orders of magnitude tested here—from 10-fold below to 100-fold above the physiological on-rate for CD4-gp120 interactions—does not significantly alter the steady-state bond number, whether the receptors are able to diffuse or are fixed. This is because over this entire range, the on-rates are sufficiently fast so that all the available viral attachment proteins are able to ligate over the timescale of the collision.
FIGURE 10.

Mean bond number as a function of the intrinsic on-rate for bond formation,  compared to the experimentally observed value,
  found in Table 1. Data represented by diamonds and squares correspond to where the proteins are fixed and mobile, respectively. There is no effect on changing
  on the mean bond number at steady state. Allowing the proteins to diffuse increases the mean bond number. Protein diffusivity was set to 10−10 cm2/s.
Fig. 11 illustrates the effect of altering the intrinsic on-rate on the fraction of viruses that are able to bind. Consistent with results presented earlier, Fig. 11 illustrates that the fraction of viruses that bind to steady state is statistically independent of whether the receptors are fixed or diffusing. However, Fig. 11 shows that the fraction of viruses bound to steady state is strongly dependent on the intrinsic on-rate. Reducing the on-rate to 1/10th the experimentally observed value decreases the fraction of viruses that bind to 3% from 33%. Two-hundred viruses were simulated with an on-rate of 1/100th the physiological value. Even though these viruses were initially placed in molecular contact with the surface, only 2 of the 200 viruses formed a bond with the surface. Both of these viruses then broke their bonds and diffused away from the surface after being bound for 1.2 μs and 480 μs.
FIGURE 11.

Fraction of viruses that bind to steady state as a function of  . The fraction of viruses that bind increases as
  increases, saturating at a value of 95% binding with
 Values of
  < 0.01
  produce no viral binding. Protein diffusion has no discernable effect on the fraction of binding viruses. Protein diffusivity was set to 10−10 cm2/s.
At the physiological on-rate, 33% of the viruses bind. Beyond this value of the on-rate, small increases in the intrinsic on-rate from the physiological on-rate produce large increases in the fraction of viruses that bind. Doubling the intrinsic on-rate raises the fraction of viruses that bind to 0.4. At 10 times the intrinsic on-rate, the fraction of viruses that bind is >0.8, and beyond this on-rate, the fraction of viruses that bind is obviously insensitive to on-rate. At 100 times' the intrinsic on-rate, 95% of viruses bind to steady state.
CONCLUSION
We have developed a new method for simulating the docking of viruses to cell surfaces. This method includes the motion of cellular receptors within the cell membrane. We believe the method offers advantages to the alternative for virus binding, equivalent site hypothesis (ESH) models, because it includes the geometry of the virus and cell, the positions of the proteins, and the diffusive motion of the virus. ESH models model the virus-cell system as a set of ordinary differential equations that assume the VAPs are free to diffuse in solution. A complete discussion of ESH models is found in our previous article (English and Hammer, 2004). In that article, we illustrated the role geometry plays in virus binding and that binding of viruses is much weaker than previously thought (English and Hammer, 2004). Here we extend BRAD by including the diffusion of cell surface receptors.
Adding cellular protein mobility in BRAD elucidates new dynamics for virus/cell binding. First, for the parameters tested, the mean bond number at steady state between the virus and cell is independent of the cellular receptor density when the receptors are able to diffuse. Diffusion of the cellular proteins into the contact zone allows all available viral binding proteins—VAPs facing the cell and near the cell virus interface—to form bonds with cellular receptors, and diffusivity ultimately leads to the effect that the density of viral attachment proteins sets the degree of binding. Second, the time required to reach the steady-state number of bonds increases when cellular receptor density decreases or when the diffusivity decreases. Third, the fraction of viruses that bind to steady state with diffusing proteins is the same as the fraction of viruses that bind to steady state with fixed proteins. This suggests that a successful virus-cell encounter is determined well before the diffusion of proteins can play a role. Frequently, viruses form a small number of bonds—fewer than three—with a cell for a short amount of time (on the order of microseconds). These bonds then break and the virus will diffuse away from the surface. The timescale of these encounters is too short for proteins to diffuse into the contact area and bind with the virus. We infer from distributions shown in our previous article, and the steady-state bond numbers observed in these simulations, that at least three bonds with the surface are required to form a stably bound virus. The time required to reach steady-state bond number decreases with increasing protein diffusivity. However, the binding reaction becomes kinetically limited at diffusivities above 10−10 cm2/s. With the kinetic parameters given in Table 1, the binding reaction becomes limited by protein diffusion below diffusivities of 10−10 cm2/s.
We did not observe a change in the number of bonds breaking with diffusing proteins. However, an increase in the number of bonds formed over time was observed. This indicates that mobile proteins ameliorate binding as additional proteins diffuse into the contact area. The proteins are not mobile enough to relieve stress placed on them by bonds fast enough to preserve the bond. It may also be possible that viral attachment proteins diffuse in the plane of the viral membrane; although we know of no direct evidence for this mobility, such motion could easily be built into future versions of BRAD.
The fraction of viruses that bind is sensitive to the intrinsic on-rate for bond formation. Small changes in on-rate around the physiological value produce large changes in the fraction of binding viruses. Virus binding is eliminated with an intrinsic on-rate <1/100th that of the physiological on-rate. At values >10-times the physiological on-rate, virus binding shows little additional increase with further on-rate increases. One can speculate on the evolutionary significance of this result. The physiological on-rate is an ideal value that allows for just the right amount of viral binding. Smaller values would not permit viruses to bind at all, and larger values do not offer any significant advantage. Likewise, previous simulations (English and Hammer, 2004) showed that VAP density strongly affects the probability of virus docking. Thus, through on-rate and VAP densities, it seems viruses have evolved efficiently dock to cell surfaces, given prevailing receptor densities.
In BRAD with diffusing membrane proteins, it is possible for bonds to pass through each other. A great deal of effort was expended to examine the frequency of such events. Because the frequency was low, we decided it was not worth the computational effort to monitor for bond crossover. However, it is a trivial extension of the program to prevent bond crossover. Equation 9 provides an easy way to find the separation of the bonds at their nearest points. This separation distance can then be used to calculate a repulsive force between the bonds, much the same way a repulsive force between the virus and cell prevents the virus from passing through the cell (English and Hammer, 2004). Further, this repulsive force may be larger if the proteins are assigned a width, as well as a length. This repulsive force is then incorporated into the equations of motion for the protein. The steric effects would work to decrease the extent of binding through forcing the dissociation of receptor-viral bonds. Though we do not believe bond crossover affects the results presented here, we plan to include such effects in future versions of BRAD as we continue to improve the methodology.
The next stage in our simulations of virus binding is to add more complexity to the viral attachment proteins. For example, gp120 is a timer, with two binding sites to two distinct viral attachment proteins. This complexity can be dealt with by using bead-spring models for the viral attachment proteins, with identifiable binding sites at different locations on the molecular backbone. This complexity will be particularly useful for simulating HIV docking, which is known to use two separate receptors (Doms and Moore, 2000). This will be a subject of future investigations using BRAD.
Acknowledgments
This work was supported by National Institutes of Health grant No. EB00256, and National Science Foundation grant No. NSF BES-0314265.
Thomas J. English's current address is 311A Towne Building/Chemical Engineering, University of Pennsylvania, Philadelphia, PA 19104.
References
- Allen, M., and D. Tildesley. 1987. Computer Simulations of Liquids. Oxford University Press, New York.
- Axelrod, D., D. E. Koppel, J. Schlessinger, E. Elson, and W. W. Webb. 1976. Mobility measurement by analysis of fluorescence photobleaching recovery kinetics. Biophys. J. 16:1055–1069. [DOI] [PMC free article] [PubMed] [Google Scholar]
- Chang, K. C., and D. A. Hammer. 2000. Adhesive dynamics simulations of sialyl-Lewisx/E-selectin-mediated rolling in a cell-free system. Biophys. J. 79:1891–1902. [DOI] [PMC free article] [PubMed] [Google Scholar]
- Chandrasekhar, S. 1943. Stochastic problems in physics and astronomy. Rev. Mod. Phys. 15:4–91. [Google Scholar]
- Doms, R. W., and J. P. Moore. 2000. HIV-1 membrane fusion: targets of opportunity. J. Cell Biol. 151:F9–F13. [DOI] [PMC free article] [PubMed] [Google Scholar]
- Dembo, M., D. C. Torney, K. Saxman, and D. Hammer. 1988. The reaction-limited kinetics of membrane-to-surface adhesion and detachment. Proc. R. Soc. Lond. B. Biol. Sci. 234:55–83. [DOI] [PubMed] [Google Scholar]
- Dimitrov, D. S., K. Hillman, J. Manischewitz, R. Blumenthal, and H. Golding. 1992. Kinetics of soluble CD4 binding to cells expressing Human Immunodeficiency Virus type-1 envelope glycoprotein. J. Virol. 66:132–138. [DOI] [PMC free article] [PubMed] [Google Scholar]
- Eldridge, C. A., E. L. Elson, and W. W. Webb. 1980. Fluorescence photobleaching recovery measurements of surface lateral mobilities on normal and SV40-transformed mouse fibroblasts. Biochemistry. 19:2075–2079. [DOI] [PubMed] [Google Scholar]
- English, T. J., and D. A. Hammer. 2004. Brownian adhesive dynamics (BRAD) for simulating the receptor-mediated binding of viruses. Biophys. J. 86:3359–3372. [DOI] [PMC free article] [PubMed] [Google Scholar]
- Hammer, D. A., and S. M. Apte. 1992. Simulation of cell rolling and adhesion on surfaces in shear flow: general results and analysis of selectin-mediated neutrophil adhesion. Biophys. J. 63:35–57. [DOI] [PMC free article] [PubMed] [Google Scholar]
- Hlavacek, W. S., C. Wofsy, and A. S. Perelson. 1999. Dissociation of HIV-1 from follicular dendritic cells during HAART: mathematical analysis. Proc. Natl. Acad. Sci. USA. 96:14681–14686. [DOI] [PMC free article] [PubMed] [Google Scholar]
- King, M. R., and D. A. Hammer. 2001. Multiparticle adhesive dynamics. Interactions between stably rolling cells. Biophys. J. 81:799–813. [DOI] [PMC free article] [PubMed] [Google Scholar]
- Koppel, D. E., D. Axelrod, J. Schlessinger, E. L. Elson, and W. W. Webb. 1976. Dynamics of fluorescence marker concentration as a probe of mobility. Biophys. J. 16:1315–1329. [DOI] [PMC free article] [PubMed] [Google Scholar]
- Kwong, P. D., R. Wyatt, J. Robinson, R. W. Sweet, J. Sodroski, and W. A. Hendrickson. 1998. Structure of an HIV gp120 envelope glycoprotein in complex with the CD4 receptor and a neutralizing human antibody. Nature. 393:648–659. [DOI] [PMC free article] [PubMed] [Google Scholar]
- Murphy, F. A., C. M. Fauquet, D. H. L. Bishop, S. A. Ghabrial, A. W. Jarvis, and G. P. Martelli. 1995. Virus Taxonomy: Classification and Nomenclature of Viruses. Sixth Report of the International Committee on Taxonomy of Viruses. Springer-Verlag, New York.
- Perelson, A. S. 1981. Receptor clustering on a cell surface. III. Theory of receptor cross-linking by multivalent ligands—description by ligand states. Math. Biosci. 53:1–39. [Google Scholar]
- Qi, S. Y., J. T. Groves, and A. K. Chakraborty. 2001. Synaptic pattern formation during cellular recognition. Proc. Natl. Acad. Sci. USA. 98:6548–6553. [DOI] [PMC free article] [PubMed] [Google Scholar]
- Schlessinger, J., D. Axelrod, D. E. Koppel, W. W. Webb, and E. L. Elson. 1977a. Lateral transport of a lipid probe and labeled proteins on a cell membrane. Science. 195:307–309. [DOI] [PubMed] [Google Scholar]
- Schlessinger, J., E. L. Elson, W. W. Webb, I. Yahra, U. Rutishauser, and G. M. Edelman. 1977b. Receptor diffusion on cell surfaces modulated by locally bound Concanavalin A. Proc. Natl. Acad. Sci. USA. 74:1110–1114. [DOI] [PMC free article] [PubMed] [Google Scholar]
- Sild, V., J. Stahlberg, G. Pettersson, and G. Johansson. 1996. Effect of potential binding site overlap to binding of cellulase to cellulose: a two-dimensional simulation. FEBS Lett. 378:51–56. [DOI] [PubMed] [Google Scholar]
- Tees, F. J., J. T. Woodward, and D. A. Hammer. 2001. Reliability theory for receptor-ligand bond dissociation. J. Chem. Phys. 114:7483–7496. [Google Scholar]
- Thomas, G. B., and R. L. Finney. 1992. Calculus and Analytic Geometry. Pearson Addison Wesley, New York.
- Torquato, S., and I. C. Kim. 1989. Efficient simulation technique to compute effective properties of heterogeneous media. Appl. Phys. Lett. 55:1847–1849. [Google Scholar]
- Wickham, T. J., R. R. Granados, H. A. Wood, D. A. Hammer, and M. L. Shuler. 1990. General analysis of receptor-mediated viral attachment to cell surfaces. Biophys. J. 58:1501–1516. [DOI] [PMC free article] [PubMed] [Google Scholar]