

Abstract
The three amino acids S65, T203, and E222 crucially determine the photophysical behavior of wild-type green fluorescent protein. We investigate the impact of four point mutations at these positions and their respective combinations on green fluorescent protein's photophysics using absorption spectroscopy, as well as steady-state and time-resolved fluorescence spectroscopy. Our results highlight the influence of the protein's hydrogen-bonding network on the equilibrium between the different chromophore states and on the efficiency of the excited-state proton transfer. The mutagenic approach allows us to separate different mechanisms responsible for fluorescence quenching, some of which were previously discussed theoretically. Our results will be useful for the development of new strategies for the generation of autofluorescent proteins with specific photophysical properties. One example presented here is a variant exhibiting uncommon blue fluorescence.
INTRODUCTION
Green fluorescent protein (GFP) of the jellyfish Aequorea victoria has become the most important marker molecule in cell biology. This importance is owed to its genetically encoded fluorescence, with the chromophore being part of the amino acid chain (Tsien, 1998). In recent years, many efforts have been made to improve and vary the properties of GFP. On the one hand, these improvements concern biochemical aspects like better expression yields at various temperatures, better folding efficiencies, and altered pKa values for the use of GFP as a pH sensor (Zimmer, 2002, and references therein). On the other hand, the manipulation of its photophysical properties like absolute spectral positions, fluorescence quantum yields, Stokes shifts, and excited-state proton transfer (ESPT) efficiencies is of high practical importance for the use of GFP in microscopy (Zimmer, 2002, and references therein). GFP mutants with new spectroscopic properties can be generated by mutating amino acids in either the chromophore or in the surrounding part of the protein. For a rational design of mutants with specific, desired properties, a detailed understanding of the chromophore's interaction with its surrounding is necessary.
A conclusive picture of the structure of the chromophore and its vicinity is obtained from x-ray structural data (Brejc et al., 1997; Wachter et al., 1998). The chromophore, a p-hydroxybenzylidene-imidazolinone built (RH) from the S65/Y66/G67 motif in a posttranslational reaction, resides in a protecting barrel-like structure of 11 β-sheets. It is connected to an intricate hydrogen-bonding network, which determines the protonation state of the chromophore's tyrosyl and which is responsible for some of the spectral peculiarities of GFP. In the neutral RH form (or A-state), the wild-type (wt) chromophore absorbs at ∼400 nm, whereas the deprotonated R− chromophore form absorbs at ∼480 nm. Excitation at the absorption maximum of either form leads to fluorescence emission centered at 510 nm. The surprisingly large shift of the emission wavelength after 400 nm excitation is caused by a fast ESPT from the chromophore's tyrosyl group to a proton acceptor, generating a deprotonated R− chromophore form (Chattoraj et al., 1996; Lossau et al., 1996). However, the emission spectra after excitation at 400 nm and 480 nm are not identical. Low-temperature experiments revealed that the respective emitting R− chromophore states are not the same (Creemers et al., 1999; Seebacher et al., 1999). Instead, emission after excitation of the RH form occurs from an intermediate I-state, which is formed after ESPT on a ps timescale and which is structurally not relaxed (Chattoraj et al., 1996; Lossau et al., 1996). In contrast, direct excitation of the deprotonated form leads to emission from the structurally equilibrated B-state. The photophysical relation and concentration-dependent equilibria between the A-, the B-, and the I-states have recently been investigated by targeted amino acid substitutions (Wiehler et al., 2003).
The many different available GFP mutants give insight into the interaction of the chromophore with its environment. From the data published to date, five amino acids in the vicinity of the chromophore appear to be crucial for the determination of its protonation state, for the B- or I-state character of the deprotonated form, but also for photophysical and photochemical parameters such as ESPT efficiencies, fluorescence lifetimes, photoconversion ability, and absolute spectral positions. In wt-GFP, these amino acids are S65, H148, T203, S205, and E222 (Fig. 1). In the past few years, many photophysical experiments have been performed on different GFP mutants. Yet, the potential of comparative studies relating mutations in the area around the chromophore to its photophysical properties has not been realized sufficiently.
FIGURE 1.
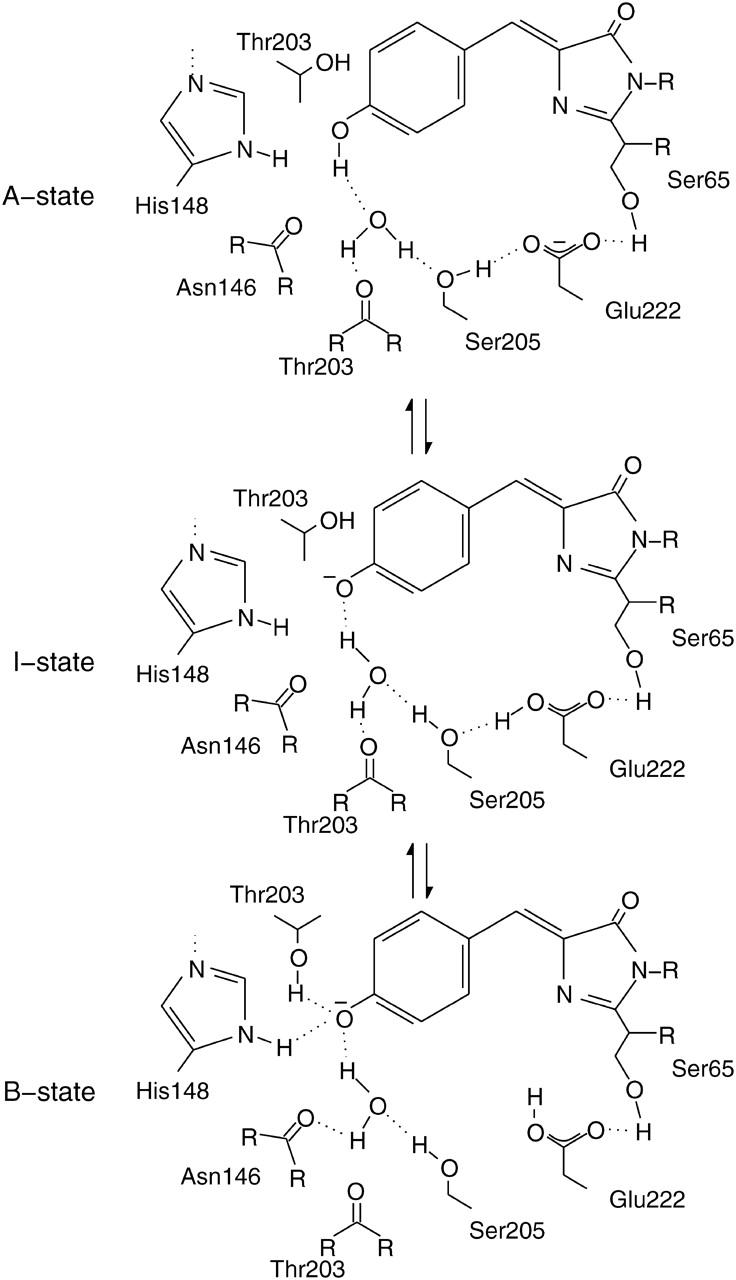
Model of the GFP chromphore in its three different states, A, B, and I (Brejc et al., 1997). Mutations in the surrounding hydrogen-bonding network influence the equilibrium between these states and are therefore responsible for spectral shifts observed in the absorbance and fluorescence spectra.
Here, we systematically investigate how the photophysics of GFP is influenced by mutations at the three functionally important positions S65, T203, and E222. These positions were chosen due to their practical and photophysical importance. Mutations at the position S65 find use in the common enhanced GFP (EGFP) and enhanced yellow fluorescent protein (YFP) variants, whereas aromatic substitutions at position T203 lead to red-shifted YFP mutants (Tsien, 1998). In contrast, E222 is the subject of a long-standing debate concerning its possible role as the final proton acceptor in ESPT (Lill and Helms, 2002) and turns out to be the decisive amino acid in recent photoconversion experiments (Bell et al., 2003; Patterson and Lippincott-Schwartz, 2002; vanThor et al., 2002; Yokoe and Meyer, 1996). We investigate not only single amino acid substitutions, but also all of their possible combinations. This approach goes beyond the scope of previous studies on autofluorescent proteins. The mutations include S65G, T203V and T203Y, and E222Q. With these mutations, we have created 12 different proteins by site-directed mutagenesis. This combinatorial approach allows us to gain previously unavailable insight into mutual dependencies and cooperative effects. In addition to the mutants obtained through point mutations, photoconverted variants in which the decarboxylation of E222 is induced are studied.
The Results and Discussion sections below are organized in the following manner. In the first part of each section, we describe the static properties of the mutants. These include thermodynamic and spectroscopic data, which are obtained from steady-state absorption and fluorescence spectroscopy. This part is then followed by the description of the results from time-resolved fluorescence experiments. The discussion of these and of the determined fluorescence quantum yields gives insight into the various decay mechanisms of the excited electronic states. Since the decay behavior of the neutral and deprotonated forms are marked by different processes, they are treated separately. In addition, ESPT, as the most important decay pathway of the neutral form, is discussed on its own.
MATERIALS AND METHODS
Samples
The A. victoria GFP gene (Chalfie et al., 1994) was used as previously described (Kummer et al., 2000). For cloning purposes, an NcoI restriction site was introduced at the 5′ end of the gene. The NcoI recognition sequence CCATGG included the start codon. Accordingly, the second residue was changed from serine to glycine. At the C-terminus of the protein, an additional glycine residue followed by a His6-tag was introduced. The mutants were constructed by site-directed mutagenesis and expressed in Escherichia coli BL21 DE3. Total soluble cytoplasmic proteins were purified twice on Ni-NTA agarose columns. SDS gel electrophoresis and silver staining were employed to cross-check for the absence of other proteins. The samples were prepared in phosphate-buffered solution at pH 7.4 (4 mM KH2PO4, 16 mM Na2HPO4, and 115 mM NaCl).
Steady-state absorption and fluorescence spectra
Steady-state absorption spectra were recorded with a standard UV-Vis spectrometer (Uvikon 943, Kontron Instruments, Munich, Germany, and 330 Spectrophotometer, PerkinElmer, Wellesley, MA) with a spectral resolution of 2 nm. Fluorescence excitation and emission spectra were measured on a Hitachi (Tokyo, Japan) 4500 fluorescence spectrometer with 2.5-nm resolution. The absorption coefficients ɛvis were evaluated by comparison to the protein absorption at λ = 280 nm (Gill and von Hippel, 1989). For the investigated GFP variants, a value of ɛUV = 20,000 M−1 cm−1 at λ = 280 nm was derived. First, we determined the extinction coefficient ɛvis at the absorption maximum of mutants in which either the neutral or the deprotonated form dominates the ground-state equilibrium. ɛvis (R−) was determined for S65G, E222Q, T203V/E222Q, T203Y/E222Q, and S65G/E222Q, and ɛvis (RH) for T203Y and T203V (Table 1 and Fig. 2). These extracted ɛvis at λmax values of the specific forms were corrected iteratively, where small amounts of the respective other chromophore states appear in the spectra. With these values, the ɛvis values of all remaining chromophore states in the 12 mutants were determined according to the mutation pattern. The populations of the different protonation forms, and thus the chromophore-form equilibrium constant K, were then derived for all 12 mutants. To verify the ɛvis values of the five mutants that showed considerable absorption of both the neutral and the deprotonated forms, the total protein concentrations were calculated based on the transferred extinction coefficients. The comparison between the protein concentrations obtained by this method and by their 280-nm ultraviolet (UV) absorption yielded deviations of <16%, indicating that the ɛvis values are determined with a reasonable accuracy. Note that since ΔG is proportional to ln K, even large errors in the extinction coefficients affect the thermodynamic data only negligibly.
TABLE 1.
Spectroscopic data of the neutral RH and the deprotonated R− forms for each of the 12 investigated mutants
| AA 203 | AA 65 | AA 222 | λabs of RH (ɛ) | λabs of R− (ɛ) | λem of RH Φfl (±SE) | λem of R− Φfl | τfl of R− ΦFl |
|---|---|---|---|---|---|---|---|
| T | S | E | 397 (21,400) | 476 (6,200) | 509 0.79 (0.04) | 505 0.80 | 3.4 0.80 |
| Q | 395 (1,400) | 477 (28,200) | 506 0.17 (0.14) | 506 0.54 | 2.5 0.57 | ||
| G | E | 395 (2,000) | 487 (38,400) | 511 0.06 (0.04) | 509 0.28 | 〈1.5〉 0.34 | |
| Q | 395 (2,600) | 479 (27,800) | 505 0.13 (0.04) | 505 0.22 | 〈1.3〉 0.29 | ||
| V | S | E | 397 (24,700) | 499 (1,700) | 511 0.75 (0.04) | 511 0.83 | 3.5 0.82 |
| Q | 395 (1,500) | 500 (52,000) | 513 0.05 (0.02) | 513 0.53 | 3.0 0.69 | ||
| G | E | 389 (8,300) | 506 (46,400) | 515 0.07 (<0.01) | 515 0.46 | 2.5 0.57 | |
| Q | 387 (13,300) | 501 (18,500) | 460 0.16 (0.01) | 513 0.18 | 〈1.4〉 0.32 | ||
| Y | S | E | 403 (18,700) | 510 (5,700) | 520 0.17 (0.01) | 525 0.83 | 4.4 0.99 |
| Q | 400 (1,500) | 511 (46,000) | 526 0.05 (0.02) | 526 0.82 | 4.2 0.93 | ||
| G | E | 397 (6,900) | 514 (39,300) | 527 0.02 (<0.01) | 526 0.75 | 3.8 0.84 | |
| Q | 399 (7,500) | 511 (33,000) | 525 0.06 (<0.01) | 525 0.66 | 3.6 0.79 |
Letters in bold print in the first three rows represent the amino acids of wt-GFP. Absorption and emission maxima λabs and λem are given in nm, extinction coefficients ɛ in l·mol−1 cm−1. The errors for the fluorescence quantum yields Φfl are large for mutants exhibiting weak RH absorbance or fluorescence. The last column gives the low-resolution fluorescence lifetimes in ns with an excitation at λexc = 470 nm and the fluorescence quantum yields Φfl for the deprotonated forms calculated according to Strickler and Berg (1962). In cases where multi-exponential decay behavior was observed, brackets denote the arithmetic mean 〈τ〉 of the lifetimes (Lossau et al., 1996). A value of Φfl = 0.80 for the fluorescence quantum yield of wt-GFP is used as a reference.
FIGURE 2.

Absorption (black line) and fluorescence spectra for the GFP variants under investigation. All data are recorded in aqueous buffer solution at room temperature with protein concentrations of 5–6 μM. Fluorescence emission spectra after excitation of the RH form (green line) were recorded with an excitation wavelength of λexc = 380 nm. For the recording of fluorescence emission spectra after excitation of R− form (blue line), λexc values of 5–15 nm below the maximum of the R− form were chosen. Fluorescence excitation spectra (red line) were recorded with a detection wavelength λdet = 530 nm for the variants carrying the mutations T203 and T203V and λdet = 540 nm for the variants with the mutation T203Y. To illustrate different fluorescence quantum yields for RH and R− forms, the excitation spectra were normalized to the maxima of the R− forms in the absorption spectra. Bold print denotes the amino acids of wt-GFP.
Photoconversion experiments
For the photoconversion experiments, samples of several GFP variants containing the wt amino acid E222 were filled into a quartz cuvette. The protein samples were irradiated for a maximum of 3 min with the light of a Xe-arc lamp (66002, Oriel, Darmstadt, Germany; 200 W, no filter). Initial irradiation of the mutant T203V for >1 h with 40 mW of the frequency-doubled output of a Ti:Sapphire laser operating at 780 nm or with the 350- to 450-nm region of the arc lamp showed only a slight (10%) reduction of the RH absorption. Several samples, especially more highly concentrated ones, turned cloudy after the photoconversion experiments. The scattering particles tended to precipitate. The precipitate was almost colorless and is ascribed to photobleached, denatured, and subsequently aggregated protein.
Time-resolved spectroscopy
Room temperature experiments
A time-correlated single-photon counting (TCSPC) setup was used for time-resolved measurements (Tables 2–4). The output of a mode-locked Ti:Sapphire laser (Tsunami, Spectra Physics, Mountain View, CA) was frequency-doubled in a BBO crystal. The resulting near-UV light was focused onto the sample. The fluorescence signal was collected in a 90° geometry with an objective lens (4×, Melles-Griot, Irvine, CA), passed through a polarizer set to the magic angle, and sent to a monochromator (H10D, Jobin-Yvon, Longjumeau, France). It was detected by a microchannel-plate photomultiplier tube (R3809U, Hamamatsu, Shizuoka, Japan). The signal served as the start signal for the TCSPC module (SPC330, Becker & Hickl, Berlin, Germany), whereas the stop signal was provided by a small part of the laser fundamental. The instrument response function (IRF) had a full width at half-maximum of 60 ps. Absorption measurements after the experiment guaranteed that photobleaching was negligible (<5%). For the determination of fluorescence quantum yields of the deprotonated chromophore forms according to the work of Strickler and Berg (1962), a commercial TCSPC setup (nF 900, Edinburgh Instruments, Livingston, UK; temporal resolution 100 ps, excitation at 470 nm) was used (Table 1).
TABLE 2.
Results from fluorescent lifetime measurements for the investigation of ESPT
| GFP mutant | λdet (nm) | τ1 (ps) | A1 (%) | τ2 (ps) | A2 (%) | τ3 (ns) | A3 (%) |
|---|---|---|---|---|---|---|---|
| T203V | 460 | 71 (12) | 68 (5) | 422 (76) | 25 (3) | 1.21 (0.20) | 7 (2) |
| 515 | 111 (33) | −5 (4) | — | — | 3.29 (0.06) | 100 (1) | |
| T203V (D2O) | 460 | 112 (11) | 79 (5) | 463 (133) | 15 (4) | 1.49 (0.22) | 6 (2) |
| 515 | 90 (19) | −56 (14) | — | — | 3.32 (0.07) | 100 (1) | |
| S65G/E222Q | 460 | — | — | 200 (180) | 37 (16) | 1.15 (0.10) | 63 (10) |
| 515 | — | — | 370 (260) | 40 (18) | 1.27 (0.26) | 60 (23) | |
| S65G/E222Q (D2O) | 460 | — | — | 200 (200) | 33 (16) | 1.14 (0.09) | 67 (19) |
| 515 | — | — | — | — | 1.06 (0.06) | 100 | |
| S65G/E222Q T = 2 K* | 445 | — | — | — | — | 2.67 (0.09) | 100 |
| 465 | — | — | — | — | 2.71 (0.11) | 100 | |
| 480 | — | — | — | — | 2.53 (0.07) | 100 | |
| 503 | — | — | — | — | 2.51 (0.08) | 100 | |
| S65G/T203V/E222Q | 460 | — | — | 432 (79) | 33 (4) | 1.38 (0.04) | 67 (3) |
| 515 | — | — | 400 (78) | 37 (3) | 1.39 (0.04) | 63 (4) | |
| S65G/T203V/E222Q (D2O) | 460 | — | — | 455 (52) | 37 (3) | 1.39 (0.03) | 63 (4) |
| 515 | — | — | 395 (90) | 36 (4) | 1.37 (0.06) | 64 (6) |
The data were collected with a TCSPC setup using an excitation wavelength λexc = 390 nm (*λexc = 420 nm). If not stated otherwise, the experiments were performed in aqueous buffer at room temperature. D2O was used as a solvent to monitor a slowdown of ESPT due to an isotope effect. Values given in parentheses represent the standard error.
TABLE 3.
Results of fluorescence lifetime measurements of the deprotonated chromophore forms with a TCSPC setup
| GFP mutant | t1 (ns) | A1 (%) | t2 (ns) | A2 (%) | 〈t〉 |
|---|---|---|---|---|---|
| wt-GFP | — | — | 3.20 (0.05) | 100 | 3.20 |
| S65G | 0.69 (0.15) | 44 (14) | 1.63 (0.21) | 56 (16) | 1.21 |
| E222Q | 0.64 (0.58) | 13 (4) | 2.48 (0.31) | 87 (17) | 2.24 |
| S65G/E222Q | 0.51 (0.15) | 39 (10) | 1.50 (0.14) | 61 (12) | 1.11 |
| T203V | — | — | 3.21 (0.05) | 100 | 3.21 |
| S65G/T203V | — | — | 2.65 (0.05) | 100 | 2.65 |
| T203V/E222Q | 0.64 (0.35) | 14 (4) | 3.42 (0.75) | 86 (16) | 3.03 |
| S65G/T203V/E222Q | 0.46 (0.17) | 51 (10) | 1.72 (0.30) | 49 (13) | 1.08 |
Excitation and detection wavelengths of λexc = 465–480 nm and λdet = 510–515 nm, respectively, were used. Values in parentheses represent the standard error.
TABLE 4.
Experimental results of TCSPC experiments probing the influence of photoconversion on fluorescence lifetimes of deprotonated chromophore forms
| GFP mutant | 〈τ〉 before photoconversion | 〈τ〉 after photoconversion |
|---|---|---|
| T203V | 3.21 | 2.22 |
| S65G/T203V | 2.65 | 1.96 |
| S65G | 1.21 | 1.11 |
Excitation and detection wavelengths of λexc = 465–470 nm and λdet = 515 nm were employed.
Low-temperature experiments
The frequency-doubled Ti:Sapphire output was focused onto a cylindrical quartz cuvette, which was mounted on a sample holder in a liquid-helium cryostat. The detection unit was the same as for the room temperature experiments, but no polarizer was used, as the rotation of the sample molecules was now frozen. It was cross-checked with wt-GFP to ensure that this omission did not affect the measured time constants. Due to reflections in the cryostat and the longer path length of the cuvette, the full width at half-maximum of the IRF was ∼125 ps.
Data analysis
For the fitting procedure, commercial reconvolution software (Fluofit, Picoquant, Berlin, Germany) on the basis of a nonlinear least-squares analysis (Levenberg-Marquardt-Algorithm) was used. The IRF was used for reconvolution fitting with exponential functions. In most cases, a sum of two exponentials was sufficient to describe the decay kinetics. The autocorrelation of residuals was checked for flatness as a control. For the determination of the parameter errors, we utilized the support plane analysis of the commercial software.
RESULTS
Ground-state equilibria between neutral and deprotonated forms
The absorption spectrum of wt-GFP is characterized by two maxima in the visible range. The short wavelength band around λmax ∼400 nm can be attributed to the neutral chromophore form (A-state), whereas the deprotonated chromophore forms are responsible for the absorption near λmax ∼480 nm (B-state) and at λmax ∼500 nm (I-state) (Chattoraj et al., 1996; Creemers et al., 1999). The relative population of the chromophore states is influenced by subtle changes of the protein structure. A preferential population of a particular protonation form can be achieved by mutagenesis (Tsien, 1998). Below, we present a quantification of the influence of amino acid substitution on the ground-state energies. It is based on the analysis of the absorption spectra of the respective proteins.
The absorption spectra of all 12 investigated proteins as well as their fluorescence excitation and emission spectra are depicted in Fig. 2. The corresponding peak maxima are tabulated in Table 1. The ground-state equilibrium constants K and the ground-state energies ΔG of the different chromophore forms in the various mutants were evaluated using the previously determined extinction coefficients (Fig. 3 a). The introduction of amino acids Y203 or V203, neither of which can build up a hydrogen-bonding bridge to the Y66-OH, destabilizes the deprotonated B-state (Kummer et al., 2000). Therefore, the neutral chromophore is favored by up to 7 kJ/mol in all T203 mutants, independent of the substitution pattern at positions 65 and 222 (Fig. 3 b). In contrast, reducing the acidity at position 222 with the substitution E222Q destabilizes the neutral chromophore and shifts the equilibrium by up to 14 kJ/mol toward the deprotonated chromophore form (Fig. 3 c). The same, if less pronounced, effect is observed for the mutation S65G. As in the case of the mutant protein S65T, the amino acid E222 is now forced into a position in which the hydrogen-bonding network is interrupted and the neutral chromophore is destabilized (Ormö et al., 1996; Wachter et al., 1998). Interestingly, instead of adding up, the equilibrium shift to the deprotonated chromophore form is weakened by the combination of both mutations S65G and E222Q.
FIGURE 3.
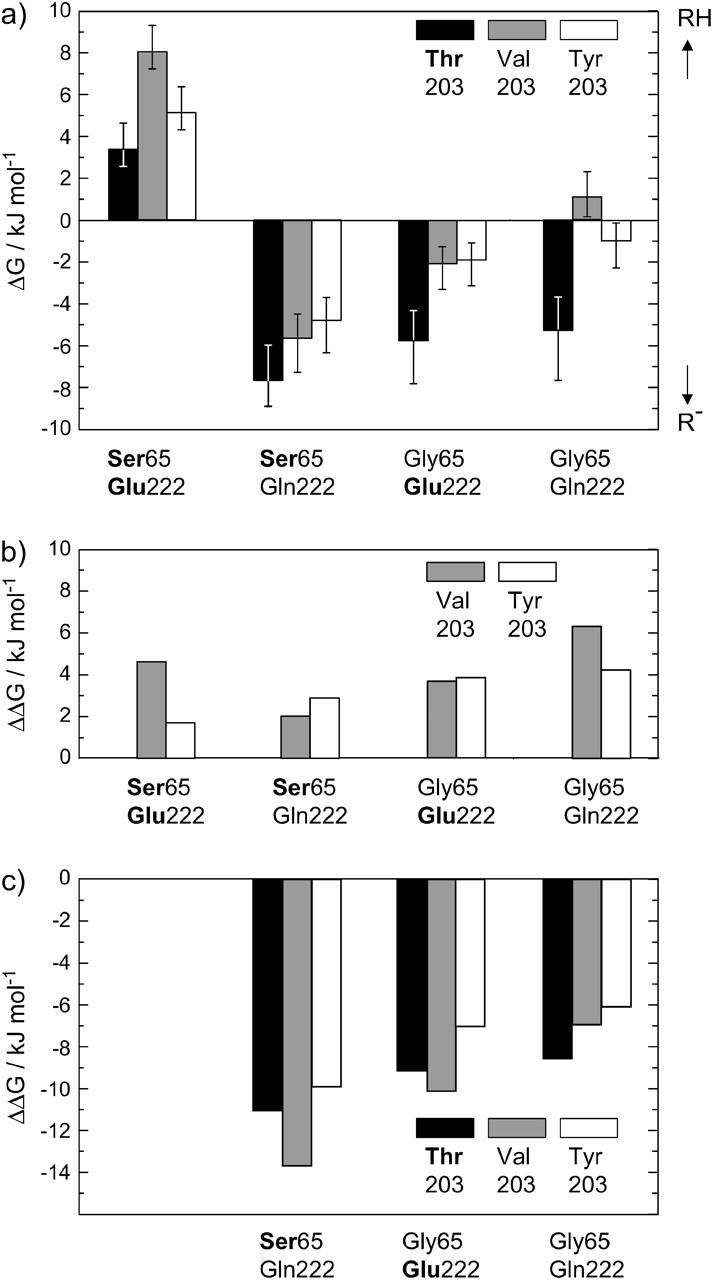
(a) ΔG values for the different chromophore states in the investigated GFP mutants, calculated from the equilibrium constant K. The error bars result from an assumed error of ±40% in the determination of K. An additional error of 50% is included for the mutants with weak RH-absorbance. Bold print denotes the amino acids of wt-GFP. (b) Energy values ΔΔG relative to the T203 variants. The removal of the hydrogen bond between Y66 and the amino acid at position 203 stabilizes the neutral chromophore. (c) Energy values ΔΔG relative to the S65/E222 variants. The perturbation of the hydrogen-bonding network between Y66 and E222 favors the deprotonated chromophore form.
The absorption spectra of all RH chromophores (Fig. 2) are broad, as is that of wt-GFP. Absorption maxima are found in the range 387–403 nm with no clear correlation to the mutation pattern (Table 1). Only the T203Y variants consistently possess absorption bands, which are slightly shifted to longer wavelengths by up to 6 nm with respect to mutants with an aliphatic amino acid at position 203. In contrast to the neutral RH form, the absorption spectra of the deprotonated R− forms are significantly influenced, especially by mutations at position 203 (Kummer et al., 2000; Wiehler et al., 2003). The T203V mutants show a maximum absorbance around 500 nm and are thus red-shifted by ∼20 nm compared to wt-GFP. In the T203Y variants, this red shift is even more pronounced and amounts to almost 30 nm compared to wt-GFP. A comparatively small red shift of the deprotonated chromophore form absorptions of at most 11 nm is achieved by the S65G replacement. However, no such effect is observed in mutants that also contain E222Q.
Steady-state fluorescence excitation and emission spectroscopy
Excited-state proton transfer
Excitation of the RH form in wt-GFP at room temperature almost exclusively leads to fluorescence emission of the I-state centered at 510 nm (Table 1 and Fig. 2). In accordance with previous investigations on wt-GFP (Chattoraj et al., 1996; Lossau et al., 1996), hardly any direct RH emission at 460 nm is detected in any of the investigated mutants. The only exceptions are the two variants, S65G/E222Q and S65G/T203V/E222Q. All other variants investigated in this work show strong fluorescence only above 500 nm. As has been explained above, this green emission originates from the deprotonated chromophore form. It can only result from efficient ESPT or from unavoidable residual direct excitation of the deprotonated chromophore form via its blue side band.
To explain the origin of the green fluorescence, we first determined the efficiency for ESPT (Fig. 4 a). We defined ΦESPT as the fraction of photons absorbed at λ = 380 nm that lead to the photochemical deprotonation of the chromophore. Since the deprotonated form as the photoproduct is fluorescent, ΦESPT could be derived by integrating the area of the emission spectra of each GFP variant excited both at the neutral and the deprotonated chromophore form and correcting for the corresponding absorption value at the excitation wavelength. Assuming similar fluorescence quantum yields for both forms, ΦESPT was then obtained as the ratio of these areas. This assumption is valid for T203V and T203Y mutants. An error was only made for T203 variants due to the coexistence of B- and I-states. The fluorescence lifetimes for the B- and the I-state differ by ∼20% (Cotlet et al., 2001; Striker et al., 1999). Thus their fluorescence quantum yields were assumed to vary by the same amount. However, larger errors than these of 20% are introduced by the weak absorbance of most T203 variants (Fig. 4, a and b). Alternatively, ΦESPT was also derived from the ratio of the absorption maximum to that of the fluorescence excitation spectrum of RH, if both spectra are normalized to each other in the respective peak of the deprotonated chromophore form (Fig. 2). Both methods were used and gave coincident values.
FIGURE 4.
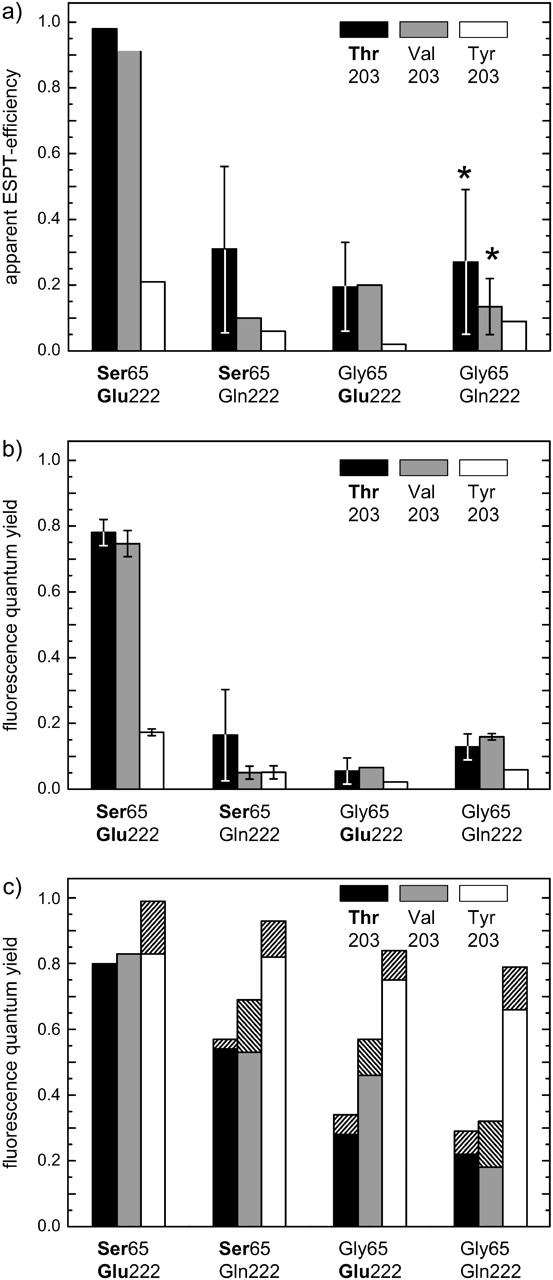
Excited-state proton transfer efficiences and quantum yields derived from the spectral data. (a) ESPT efficiencies in the GFP variants. The asterisk denotes the variants with strong blue RH fluorescence, which prevents an accurate determination of the ESPT quantum yield. Low quantum yield values might be caused by an unavoidable blue-edge excitation of the deprotonated form, by a subconformation with fast ESPT in the S65G/E222-variants like in EGFP (Cotlet et al., 2001), or by an alternative ESPT-mechanism (McAnaney et al., 2002; Winkler et al. 2002). The large error bars in a result from the weak absorbance of the neutral form or from the strong overlap of the RH and R− fluorescence emissions. (b) Fluorescence quantum yields ΦFl for the neutral form referenced to the deprotonated form in wt-GFP with ΦFl = 0.8. The large error bars in b result from weak absorbance of the neutral form. (c) Fluorescence quantum yields for the deprotonated form referenced to wt-GFP with ΦFl = 0.8. The values obtained by the Strickler-Berg relation are indicated by hatched bars (Strickler and Berg, 1962).
High ΦESPT values of >90% were only observed for wt-GFP and the single-mutation variant T203V (Fig. 4 a). The mutation T203Y led to a small ΦESPT of 21%. This is also true for E222Q as well as for S65G, both of which reduced ΦESPT significantly. Note that the values depicted in Fig. 4 a have to be seen as upper limits to the true ΦESPT since direct excitation of the deprotonated chromophore form with λexc = 380 nm could not be excluded completely. Another problem concerning the determination of ΦESPT arose for the variants with a strong RH emission, S65G/T203V/E222Q and S65G/E222Q. In this case, a distinction between the broad RH emission spectrum and the overlapping emission spectrum of the deprotonated chromophore form was difficult. For these mutants, TCSPC experiments were an alternative measure of ESPT rates and revealed that ESPT is completely shut off in these two mutants (see Origin of the strong RH fluorescence of two mutants). High fluorescence quantum yields after excitation of RH are associated with efficient ESPT (wt-GFP and T203V, Fig. 4 b). All other mutants possess fluorescence quantum yields <20% for excited RH.
Fluorescence quantum yields of the R− species
Direct excitation of the deprotonated form with wavelengths between 460 nm and 490 nm leads to fluorescence between 505 and 509 nm for the T203 variants, between 511 and 515 nm for the T203V variants, and at ∼525 nm for the T203Y-variants (Table 1). For the deprotonated chromophore form, fluorescence quantum yields ΦFl were obtained in two ways (Table 1 and Fig. 4 c). First, and conventionally, they were determined by referencing the fluorescence yield to wt-GFP, in which ΦFl was set to 0.80 (Tsien, 1998). Following Strickler and Berg (1962), the second method used the ratio of the measured fluorescence lifetimes to the calculated radiative lifetimes. From the fluorescence lifetime of wt-GFP and its fluorescence quantum yields ΦFl, the radiative lifetime was calculated to be 4.3 ns, which is slightly shorter than previously reported for EGFP (Heikal et al., 2001). Red shifts of the spectra lead to a prolongation of the radiative lifetimes. When this influence was considered and corrected for, we found that the calculated radiative lifetime of the different mutants did not vary by >7%. Both methods gave the same tendencies, although the absolute values are consistently slightly higher when calculated using the Strickler and Berg relation (Fig. 4 c).
High quantum yields are observed for the variants containing S65/E222, reduced quantum yields with E222Q mutations, a more pronounced reduction with S65G mutations, and the lowest yields with substitutions S65G and E222Q. Another trend in the data is exhibited with different amino acids at position 203. The highest quantum yields were determined for the T203Y substitution series (YFPs). In comparison, the fluorescence quantum yields for T203 and T203V variants are considerably smaller. Among the latter mutants, the T203V-containing protein variants exhibit quantum yields up to 20% higher. This tendency is even more pronounced when the longer fluorescence decay components from Table 3 are taken for fluorescence quantum yield determinations based on the Strickler and Berg relation (see Fluorescence lifetime measurements of the R− species)
Time-resolved fluorescence spectroscopy
Origin of the strong RH fluorescence of two mutants
The two mutants S65G/T203V/E222Q and S65G/E222Q show a strong blue fluorescence after excitation of RH. TCSPC measurements with an excitation at ∼390 nm were performed to find out whether this occurs due to a slowdown of ESPT. The fluorescence of the neutral chromophore was detected at 460 nm, whereas the fluorescence of its deprotonated form was detected at 515 nm. Since large isotope effects have been reported for ESPT (Chattoraj et al., 1996; Lossau et al., 1996), the influence of an H/D exchange was additionally investigated. The mutant T203V, known to exhibit a pronounced ESPT (Kummer et al., 2000), was studied as a reference. Whereas fluorescence decays slightly faster than the IRF of 60 ps could be detected, only rising components with time constants above the IRF were observable in our experiment. The TCSPC data are depicted in Table 2 and Fig. 5.
FIGURE 5.

Time-correlated single-photon counting measurements with excitation wavelengths between λexc = 385–390 nm performed to reveal the origin of the blue fluorescence. (a) A rising, isotope-sensitive component in the green fluorescence of T203V detected at λdet = 515 nm indicates ESPT. The rising components are fit by a single exponential. (b) Fluorescence lifetime measurements of S65G/T203V/E222Q with λdet = 460 nm in H2O and D2O. Similar curves are obtained for S65G/E222Q (data not shown). (c) Fluorescence lifetime measurements of S65G/T203V/E222Q with λdet = 515 nm in H2O and D2O. Similar curves are obtained for S65G/E222Q (data not shown). (d) Lifetime measurements in S65G/E222Q at 2 K with λexc = 420 nm. Neither a rising component at 503 nm nor a fast-decaying component at 445 nm is seen.
T203V. Analysis of the data of this single mutation variant by reconvolution fitting showed a triexponential decay for the RH fluorescence with time constants of ∼70 ps (68%), ∼420 ps (25%), and ∼1.2 ns (7%) (Table 2). Upon deuteration, the latter two time constants were reproduced within the error limits with somewhat smaller amplitudes, whereas the fastest detected time constant was slowed down to ∼110 ps. Under the experimental conditions chosen for the recording of the data depicted in Fig. 5 a, fluorescence at 515 nm originated from ESPT and we expected to find a rising component. A small rising component with a time constant of ∼110 ps was indeed detected in the nondeuterated sample. Although the value of this time constant was not affected by deuteration, its fraction was substantially increased as seen by the amplitude change from 5% to 56%. According to the results of McAnaney et al. (2002), this increase in the rising amplitude is compatible to a slowdown of ESPT. The fluorescence was found to decay monoexponentially with a time constant of 3.3 ns independent of the isotope exchange. The results are in good agreement with the results of Kummer et al. (2000).
S65G/T203V/E222Q and S65G/E222Q. Both variants behaved similarly (Fig. 5, b and c). The fitting of the fluorescence decay at 460 nm and 515 nm yielded two time constants that did not change upon deuteration. Also, the amplitudes were unaffected by the isotope exchange. No rising components were detected at λdet = 515 nm. The decay constants are in the range of the two slow components of the RH fluorescence in T203V, but have different amplitudes. We performed low-temperature TCSPC measurements on S65G/E222Q between 2 K and 200 K to eventually reveal fast, thermally activated components which would not be detectable at room temperature (Fig. 5 d, shown only for 2 K). Such a thermally activated rising component has been found for wt-GFP (Chattoraj et al., 1996; Lossau et al., 1996). For the mutants discussed here, however, no such decelerated component was found. In the temperature range between 2 K and 240 K, the data could be described with a monoexponential decay at λdet = 445 nm and 460 nm with a time constant of ∼2.9 ns, and at λdet = 480 nm and 503 nm with a decay constant of ∼2.6 ns. No rising component was detected at the two latter detection wavelengths.
Fluorescence lifetime measurements of the R− species
For an accurate determination of fluorescence lifetimes, we also performed TCSPC measurements of the T203 and the T203V variants with a direct excitation of the deprotonated chromophore at λexc = 465–480 nm (Table 3). The fluorescence decays of two mutants bearing the mutation T203V (T203V and S65G/T203V) could be fitted monoexponentially. Also the fluorescence of wt-GFP was fitted by a monoexponential decay with a time constant of 3.2 ns. For the other mutants studied here, a biexponential fit with clearly separated lifetimes described the decay dynamics well. The fast component (13–51%) always exhibits a decay constant of 460–690 ps, whereas the longer components decay on a time range from 1.5 to 3.4 ns.
Photoconversion
In a recent publication, Hellingwerf and coworkers have shown that wt-GFP undergoes photoconversion upon irradiation with UV light (van Thor et al., 2002). Decarboxylation of E222 has been identified as the molecular origin of the observed photoconversion (Bell et al., 2003; Patterson and Lippincott-Schwartz, 2002; van Thor et al., 2002; Yokoe and Meyer, 1996). In the context of the work described here, this chemical reaction was of interest since it removes the acidity from glutamic acid at position 222. This is comparable to the effect of the E222Q mutation, but decarboxylation additionally breaks the hydrogen-bonding network. A comparison between fluorescence lifetimes of GFP mutants before and after photoconversion was therefore assumed to give insight into the influence of steric effects on internal conversion (Table 4). To investigate these steric influences, we focused on mutants with a strong R− absorption and probed internal conversion with fluorescence lifetime measurements. The T203V variant was again used as a reference sample, because efficient photoconversion has been described for this mutant (Patterson and Lippincott-Schwartz, 2002). The effects of the photoconversion are summarized in Table 4 and Fig. 6.
FIGURE 6.

Spectral properties of GFP variants before and after photoconversion. (a) Absorption spectra of the T203V mutant. The original absorption spectrum (black line) is only slightly affected by illumination with near-UV light (350–450 nm) from the arc lamp for 1 h (shaded line). Photoconversion is induced with an additional 2 min of illumination with the integral light of the arc lamp (dotted line). (b) Absorption spectra of S65G/T203Y before (solid line) and after (dotted line) photoconversion. Reversed photoconversion of the deprotonated chromophore form is observed with UV illumination (2 min with the integral arc lamp emission). S65G and S65G/T203V behave similarily (data not shown). (c) Comparison between the fluorescence lifetime of the deprotonated chromophore form in S65G/T203V before (black line) and after (shaded line) photoconversion. Excitation and detection wavelengths were chosen as λexc = 465–470 nm and λdet = 515 nm, respectively. The faster fluorescence decay indicates a higher contribution of internal conversion in the photoproducts (cf. Table 4).
T203V. Illumination with unfiltered UV light of the arc lamp for 2 min dramatically changed the absorption spectrum (Fig. 6 a). Although initially RH was present almost exclusively, the illumination converted the protein to a predominantly deprotonated form. The ratio of both forms remained almost constant upon 2 min of additional UV irradiation. The ΦESPT of this sample was reduced, as was evident from the normalized ratio of the absorption spectrum to the fluorescence excitation spectrum (data not shown). We assigned this effect to the loss of E222 as the final proton acceptor in ESPT (Lill and Helms, 2002). Time-resolved spectroscopy of the photoconverted samples similar to the measurements described in section entitled Origin of the strong RH fluorescence of two mutants did not reveal a rising component of the fluorescence of the deprotonated chromophore form at 515 nm (data not shown). Instead, we observed a pronounced heterogeneity in decay times, which we attributed to the coexistence of nonphotoconverted, photoconverted, and denatured protein (data not shown). For this reason, no further ESPT experiments with other photoconverted GFP mutants were performed. The averaged time constant of the fluorescence decay at 515 nm is reduced from 3.2 ns (before photoconversion) to 2.2 ns (after photoconversion) for the T203V variant (Table 4).
S65G, S65G/T203V and S65G/T203Y. All three mutants behaved similarly. Unfiltered arc-lamp UV irradiation (up to 3 min) led to a strong decrease of the absorption band of the deprotonated form, whereas the neutral form's absorption band remained more or less unaffected in shape and intensity (Fig. 6 b, shown only for S65G/T203Y). For the three mutants we found that the ratio between the neutral and the deprotonated form populations was shifted toward the neutral chromophore form. This is in contrast to the published results of photoconversion experiments with other mutants, where the deprotonated chromophore form is preferentially populated after decarboxylation (Patterson and Lippincott-Schwartz, 2002).
Photoconversion interrupts the hydrogen-bonding network and its impact on the equilibrium phenomenologically compares to the mutation E222Q. Despite this similarity, the origin is probably different. Although our experiments gave evidence that the shift of the equilibrium constant K can occur in both directions (toward RH or R−), a quantification of the effect was hampered by the uncertainty about the extent of photoconversion and denaturation. Lifetime measurements on photoconverted S65G and S65G/T203V revealed shortened lifetimes compared to untreated samples (Table 4 and Fig. 6 c).
DISCUSSION
General remarks
The analysis of the influence of the different mutations on the photophysical properties of the proteins is based on the published x-ray structures. For the mutants presented here, no such x-ray structures were available so far. Therefore, it is essential to point out why the mutations investigated in this work were assumed to affect only the immediate vicinity of the chromophore while having a negligible influence on the global protein structure. In the structures available for different GFP variants, the protein scaffold is nearly identical in all cases. The only exceptions concern the amino acids surrounding the chromophore. Changes in the geometry of the chromophore's vicinity are observed for the amino acids at the positions 148, 203, and 222 (Bae et al., 2003; Brejc et al., 1997; Wachter et al., 1998). Our interest was focused on the latter two positions. With T203V and E222Q, only minimal steric mutations were introduced. We therefore assumed only minor overall geometric distortions as compared to wt-GFP. In the T203V mutants, the side chain of this amino acid cannot build a hydrogen-bonding bridge to the chromophore. A similar, noninteracting conformation has been observed as the major conformation in wt-GFP (Brejc et al., 1997). At position 222, E222Q is lacking the glutamate's acidity in the respective mutants. This substitution does not affect the capability to form hydrogen-bonding bridges via its amide group, but no syn-anti isomerization, as has been proposed for the wild-type variant (Brejc et al., 1997), is possible. We previously used this model successfully for the prediction and the generation of a mutant with a stabilized I-form phenotype (Wiehler et al., 2003). The study presented here was extended to T203Y containing YFP variants. Since x-ray structures were available for the S65G/T203Y variant (Wachter et al., 1998), we also included the S65G mutation in our investigation. Two experimental facts further support our assumption of an unchanged overall protein structure. First, it is well known that the GFP chromophores are only formed with the correct geometry of the neighboring amino acid network (Barondeau et al., 2003; Branchini et al., 1998). Our mutants have good chromophore formation efficiencies, as can be deduced from the molar extinction coefficients (Table 1). Second, the detected spectral shift of the T203Y variants, which is known to be partly due to π-stacking, can only be observed for a proper orientation of the amino acid at position 203 with respect to the chromophore.
Below, we will first discuss the influence of the various mutations on the thermodynamic stability of the chromophore forms. After this, changes in the absorption spectra of the respective proteins will be analyzed. This concerns mainly the R− species. Subsequently, we will debate the influence of mutations on the decay of electronically excited chromophore states. We will start with the decay of the R− species before turning to the discussion of ESPT which can be considered as a special case of the decay of the excited RH chromophore. Finally, the fluorescence decay of the RH forms will be discussed in light of the uncommon blue fluorescence observed for two mutants from our mutation series.
Ground-state equilibria
The conversion between the different chromophore forms in GFP is interpreted on the basis of the widely accepted three-state model (Fig. 1) (Brejc et al., 1997; Palm et al., 1997). It proposes several structural rearrangements that are necessary for the interconversion of the different chromophore states in wt-GFP. Going from the A-state to the intermediate I-state, only the hydrogen-bonding network is shifted, including the release of the phenolic proton at Y66. From there, the chromophore is locked into the B-state by the subsequent rotation of T203 and the formation of a stabilizing hydrogen bond between the T203-OH and phenolate oxygen of the deprotonated chromophore. This isomerization is supported by an additional rearrangement of H148 and a putative syn-anti isomerization of the E222 OH group (Lill and Helms, 2002). It was shown recently that in monomeric wt-GFP, the B-state is stabilized by ΔG = 3.8 kJ mol−1 over the I-state (Wiehler et al., 2003).
Our equilibrium data reveal two facts. First, it is obvious that replacing T203 with T203V or T203Y destabilizes the deprotonated form by 2–7 kJ mol−1 (Fig. 3 b). Our data are readily explained in the above-mentioned model, since in contrast to threonine, none of the substitutions chosen here can form a hydrogen bond to the phenolic OH of the chromophore's Y66 which would stabilize the B-state. Second, we observe that either removal of the OH group at position 65 or of the acidity of the amino acid at position 222 with the mutants bearing S65G or E222Q leads to a 7- to 14-kJ mol−1 stabilization of the deprotonated form (Fig. 3 c). This effect indicates that in all three S65G/E222 variants, the glutamic acid at position 222 is oriented toward the chromophore's heterocycle, as is also seen in the x-ray structure (Wachter et al., 1998). If this were not the case, the reverse protonation reaction through the hydrogen-bonding network would take place. Interestingly, with the combination of the amino acids favoring the deprotonated forms, S65G and E222Q, the effect of stabilizing the deprotonated chromophore decreases to 6–9 kJ mol−1. Presumably, the interruption of the hydrogen-bonding network by the combined mutations S65G/E222Q makes the chromophore more susceptible to external pH, i.e., the pKa value of the chromophore is raised. Similarly, the reversed photoconversion in S65G-containing mutants (Fig. 6 b) can be explained by the destruction of the hydrogen-bonding network.
Shifts in the absorption spectra
Several causes have been identified for the observed shifts in the absorption spectra of mutants as compared to wt-GFP. Large spectral shifts have been attributed to π-π interactions of Y203 with the chromophore (Weber et al., 1999), the lack of hydrogen-bonding bridges from residue 203 to Y66 (Kummer et al., 2000; Wiehler et al., 2003), and electrostatic interactions between the side chain of the amino acid at position 65 and the chromophore (Brejc et al., 1997). The comparative study presented here elucidates the different influences and the extent to which they are causing spectral shifts. The influence of the different mutations on the absorption wavelength is much larger for the deprotonated than for the neutral form. Compared to wt-GFP, red shifts in the absorption spectra are observed for the mutations T203V, T203Y, and S65G. However, the effect of the latter substitution is cancelled upon the additional introduction of E222Q. Earlier, the 20-nm red shift observed for all T203V variants was explained by the removal of a hydrogen-bonding bridge to the chromophore, which destabilizes the B-state and leads to the emergence of the I-state (Kummer et al., 2000; Wiehler et al., 2003). These absorb at λmax ∼500 nm and were previously identified as intermediates in the ESPT photocycle using low-temperature spectroscopy (Creemers et al., 1999; Seebacher et al., 1999). By the same argument, the T203Y substitution must lead to a significant I-state population. Upon introduction of T203Y, however, an additional shift of ∼10 nm is generally observed (Kummer et al., 2000). This means that only this smaller effect is due to the π-π interaction of the chromophore with the aromatic amino acid (Weber, 1999).
We now inspect the long wavelength absorption spectra of the S65G variants in more detail. The spectral red shift of these mutants closely resembles that of variants with the S65T mutation, which is present in the widely used EGFP (F64L/S65T) variant (Tsien, 1998). X-ray structures of the S65T mutant at pH 4.6 and pH 8.0 show that independent of the external pH the connection of E222 to S205 is interrupted (Elsliger et al., 1999). This bond is also missing in the B-form of wt-GFP and in the YFP structure (Brejc et al., 1997; Wachter et al., 1998). These structural observations let us assume that in variants bearing the S65G mutation the hydrogen-bonding network is interrupted in the same manner. This is also reflected in the effect of S65G on the equilibrium constant K. In a previous work, the spectral red shift of ∼14 nm with the S65T mutation was attributed to a reduced electrostatic interaction of the OH dipole in S65T with the chromophore's excited-state dipole (Brejc et al., 1997). However, electrostatic interactions can be excluded as a cause. In the S65G variants similar spectral features as in the S65T mutants are observed even without the presence of this hydroxyl group. If, in contrast, S65G is combined with E222Q, the red shift is cancelled in all cases, independent of the amino acid at position 203. An electrostatic interaction between the chromophore and the side chain of the amino acid cannot be reversed in S65G by the introduction of E222Q since there is no static dipole on glycine to interact with the excited state's dipole moment of the chromophore.
A different explanation for the spectral shift observed in EGFP is given in Fig. 1 a of Cotlet et al. (2001). There it is argued that the spectral shift is due to a shifted equilibrium between the B- and the I-states. This, however, is not supported by the lifetime measurements published in the same work. These show that the contribution of the I-state to the fluorescence decay amplitudes, revealed by the accurate global fitting of the fluorescence decay behavior at several excitation and detection wavelengths, only amounts to ∼20% instead of the ∼50% expected from the spectral deconvolution given in Fig. 1 of (Cotlet et al., 2001). A population of ∼20% for the I-state has been confirmed for wt-GFP at low concentrations (Wiehler et al., 2003). Also, the available x-ray structures for S65T variants do not support this explanation since no concurring conformations have been detected (Ormö et al., 1996). The failure of the two explanations described above prompts us to propose an alternative model in which the spectral red shift is due to a hydrogen-bonding partner to the N(2) atom of the imidazolinone ring. This has already been put forward in the case of EGFP (Tozzini et al., 2003), where the OH group of the S65T side chain is the bonding partner. Even more relevant in our case is the structure of enhanced YFP, where a direct hydrogen-bonding interaction between E222 and the heterocycle is seen (Wachter et al., 1998). Based on this observation, the red shift would be suppressed if the less acidic E222Q were introduced. This is indeed what we observe.
Excited-state relaxation
Fluorescence decay of the R− species
Apart from radiative decay, the main decay mechanism of the excited deprotonated chromophore form is believed to be internal conversion. Three different decay pathways have been considered in theoretical investigations (Weber et al., 1999). Rotation about the exocyclic methylene bond τ is unlikely to happen since this movement requires a large free volume (Fig. 7 a). It is therefore not considered in the following analysis. The other two mechanisms discussed are the single-bond rotation around φ and the so-called hula-twist motion (Weber et al., 1999). The rotation around the single-bond φ is believed to be responsible for the fast decay of the blue fluorescent protein variants bearing the Y66F mutation as well as of the neutral chromophore analog of wt-GFP in solution (Kummer et al., 2002a; Kummer et al., 2002b). This rotation will contribute significantly to the internal conversion if φ has single-bond character (Weber et al., 1999). It will, however, be locked if φ has double-bond character in the excited state (Fig. 7 a, quinoidal structure). The deprotonated chromophore can be described by two main mesomeric structures, the benzoidal and the quinoidal structure (Fig. 7 a). The benzoidal structure is preferred if the negative charge of the phenolate is stabilized by hydrogen bonds, i.e., in the T203 variant. The substitutions T203V and T203Y break such a stabilizing hydrogen bond and favor the quinoidal structure. Thus, if rotation around φ is the predominant decay mechanism for internal conversion, one would expect longer fluorescence lifetimes. This would result in higher fluorescence quantum yields for the excitation of the deprotonated chromophore form of these variants. Indeed, the described suppression of the radiationless decay mechanism is observed in a comparison of the T203 with the T203V and T203Y variants (Table 3 and Fig. 4 c). This tendency is even more pronounced in the longer decay components (Table 3). The fluorescence lifetimes are smaller by 13–45% with T203 instead of T203V. Only when compared to wt-GFP does the mutation T203V not affect the fluorescence lifetime. Better-resolved lifetime measurements on wt-GFP and on EGFP, however, showed a biexponential decay with 2.8 and 3.3 ns, and 2.7 and 3.4 ns, respectively (Cotlet et al., 2001; Striker et al., 1999). In these investigations, the longer decay components are attributed to the I-state, whereas the faster components supposedly originate from the B-state. It has been proven in a previous study that the structural difference between the B- and I-states is characterized by the rotation of the T203 amino acid (Wiehler et al., 2003), which is supported by the crystallographic data of wt-GFP (Brejc et al., 1997; Palm et al., 1997). In conclusion, our data confirm that rotation around φ is the predominant decay pathway that makes the B-state less fluorescent than the I-state in T203 variants (Fig. 7 b). If the population of the B-state is disabled, for example, by the mutation T203V, then the fluorescence quantum yield increases. As the rotation around φ also requires space, a bulky amino acid-like tyrosine or phenylalanine in close contact to Y66 reduces this radiationless pathway further (Baffour-Awuah and Zimmer, 2004).
FIGURE 7.

Chromophore forms and internal conversion pathways. (a) Benzoidal and quinoidal mesomers of the GFP chromophore in its deprotonated form. The benzoidal character is increased if the negative charge on the oxygen of Y66 is stabilized by hydrogen bonds. The benzoidal structure prevails in the neutral chromophore form. (b) The one-bond rotation around the angle φ. With increasing single-bond character of φ, this movement becomes likelier. In contrast, increasing quinoidal character as in the I-state reduces its contribution to internal conversion. (c) The hula-twist motion, which is less sensitive to the bond-order of the exocyclic bonds. However, this concerted two-bond rotation requires space near the heterocycle and is therefore probed by S65G mutations and photoconversion.
The last fluorescence quenching mechanism considered by Weber et al. (1999) is the hula-twist motion, which is predicted to be the main decay mechanism in restricted geometries (Liu and Hammond, 2002) (Fig. 7 c). The influence of the double-bond character of the two exocyclic bonds on the hula-twist mechanism has not yet been explored experimentally. As illustrated by Fig. 7 c, this concerted two-bond movement also requires space in the surrounding of the heterocycle (Weber et al., 1999). A complete cis-trans-isomerization as depicted in Fig. 7 c is not mandatory for internal conversion (Baffour-Awuah and Zimmer, 2004). The contribution of the hula-twist motion can be probed sensitively by providing space in the vicinity of the chromophore's heterocycle. The S65G and S65T substitutions have similar spectral effects. However, in contrast to the S65T variants, ΦFl and the decay times are drastically reduced in the S65G proteins. This finding could in principle be attributed to the increased probability of forming the weakly fluorescing zwitterionic state in the S65G/E222 variants due to ESPT from E222 to the heterocycle (Schwille et al., 2000; Weber et al., 1999). Two observations, however, let us conclude that steric effects are much more important. First, the tendency to faster radiationless decay is not reversed by the additional mutation E222Q. Such a reversal would be expected if a zwitterionic state resulting from the protonation of E222 were responsible for a fast decay. Second, our photoconversion experiments, in which E222 is decarboxylated, led to a reduction of the fluorescence lifetime in the investigated cases (Table 4, Fig. 6 c). Both points highlight that more available space in the heterocycle's surrounding is correlated to an increase in internal conversion. From the fact that both changes are not in direct contact to the phenolic moiety of Y66, we conclude that hula-twist is an additional decay mechanism in the S65G mutants and photoconverted proteins.
In the mutants containing an aromatic amino acid at position 203, π-π interactions can also play a role in the decay of the excited R− state. The effect of the π-π interactions between the chromophore and aromatic residues at position 203 on the fluorescence decay behavior is still unclear. Although the mutation T203Y quenches the RH fluorescence, T203F does not (Kummer et al., 2000). Differences in the π-π interactions were used as an explanation. In the deprotonated form, both variants have similar decay constants (Schwille et al., 2000). The decay times of T203V, where no π-π interaction can be present, are only slightly shorter than those of our T203Y mutants as long as S65 is maintained. If S65G is introduced additionally, the lifetimes of the deprotonated form become significantly shorter. This indicates that electronic effects alone cannot fully account for the long lifetimes and high fluorescence quantum yields in the T203Y variants. Instead, steric hindrance of the single-bond rotation and the hula-twist by the bulky Y203 seem to play an important role. This is reasonable since the respective x-ray structures show that it is a close neighbor of the exocyclic bonds of the chromophore (Wachter et al., 1998).
Our time-resolved fluorescence experiments often show biexponential decay behavior with a shorter lifetime in the subnanosecond time range (Table 3). A similar lifetime distribution is observed in the cyan fluorescing protein variant CFP, bearing the Y66W mutation (Bae et al., 2003). In this case, the two conformational populations were related to a minor and major component as found in the high-resolution x-ray structure. Both forms differ in the geometry of H148 (Seifert et al., 2002). Also in the wt-GFP structure, the poorly defined position of H148 points to two possible conformations at this position (Brejc et al., 1997). The existence of two protein conformers can explain the observation of two decay components, of which the short one arises from a structure that allows a cis-trans-isomerization of the chromophore. While this article was under review, the mutation H148D was shown to remove the biexponential decay behavior in ECFP (Rizzo et al., 2004), supporting our interpretation of the origin of the decay heterogeneity.
Excited-state proton transfer
Theoretical investigations, as well as crystallographic data, give a strong indication that E222 is the final proton acceptor in the ESPT photocycle of wt-GFP (Lill and Helms, 2002), although alternative ESPT pathways might exist (Hanson et al., 2002; McAnaney et al., 2002).
Our fluorescence excitation spectra reveal that ESPT is most efficient in wt-GFP and T203V (Fig. 4 a). In all other combinations, the ΦESPT is small to zero. The four variants with the mutation T203Y have the lowest ESPT efficiency among all 12 mutants. This effect of T203Y was explained earlier by an additional decay mechanism in excited RH, which is considerably faster than ESPT and therefore competes with the fluorescence (Kummer et al., 2000).
ESPT competes with radiative decay from fluorescence of RH and internal conversion as a radiationless decay mechanism. Therefore, if ESPT is slowed down or completely shut off, enhanced blue fluorescence emission of RH is expected. One may thus pose the question whether a deceleration of ESPT is responsible for the significant blue room temperature fluorescence originating from excited RH, which is observed for two mutants from our series. It is strongest for S65G/T203V/E222Q and, due to a weaker population of the neutral chromophore state, less pronounced in S65G/E222Q. Strong blue RH fluorescence could be due to a slowdown of ESPT. Therefore, TCSPC measurements monitoring the green fluorescence after near-UV excitation at λexc ∼390 nm (Table 2 and Fig. 5) were performed. With this process, direct excitation of the deprotonated chromophore form was minimized, and most of the green fluorescence should arise from ESPT. Thus, the detection of a rising component at λdet ∼510 nm after excitation at 390 nm was expected. It could, however, be hidden under the green fluorescence of R−, which overlaps spectrally with the blue fluorescence of RH (McAnaney et al., 2002). Therefore, the detection of green fluorescence is complementary to the detection of blue fluorescence at 460 nm, where the time constants of ESPT can be deduced from the decay behavior. The appearance of such components would further be shifted to longer times in a deuteration experiment (Chattoraj et al., 1996; Lossau et al., 1996; McAnaney et al., 2002). However, no isotope-sensitive component is observed (Fig. 5). We conclude that no ESPT takes place in these proteins. Instead, the observed green fluorescence after excitation with near-UV light is due to the direct excitation of the deprotonated form in the blue wing of its absorption band. Whether cross-well excitation (Winkler et al., 2002) could also explain the occurrence of green fluorescence after excitation at ∼390 nm cannot be answered by our experiments.
It turns out that significant ESPT is only observed if the deprotonated E222 is connected to S205 via a hydrogen-bonding bridge, i.e., an intact hydrogen-bonding network between Y66 and E222. Our experiments confirm the role of the deprotonated E222 as the final proton acceptor in ESPT of GFP. The small ESPT efficiency in EGFP (Cotlet et al., 2001) can thus be attributed to a small fraction of proteins with a hydrogen bond between S205 and E222 (Fig. 4 a). Also, the small ΦESPT observed for some of the mutants described here might be due to a structural heterogeneity or to an alternative ESPT mechanism, as has been proposed recently (McAnaney et al., 2002).
Fluorescence decay of RH
The decay behavior of the weakly fluorescent RH in EGFP and related S65T mutants has been investigated by several research groups (Cotlet et al., 2001; Heikal et al., 2001; Volkmer et al., 2000). Their measurements with one- and two-photon excitation unambiguously showed a fast fluorescence decay of RH with a time component of ∼250 ps at 460 nm and no corresponding rise at 510 nm. A comparable time constant was also detected in wt-GFP (Kummer et al., 1998). In T203V, we detected a slightly slower minor component at 460 nm (Table 2) that is not sensitive to isotope exchange. It is therefore unlikely that this time constant is coupled to an ESPT. A decay with a time constant three to four times longer is observed in the strongly blue fluorescent variants with the combined S65G/E222Q mutations (Table 2 and Fig. 5 b). Dominant blue fluorescence was observed in very few GFP variants (Hanson et al., 2002). Only the S65G/E222Q/T203V mutant exhibits a blue fluorescence spectrum after excitation of RH. It is similar to the one deduced from blue fluorescent protein (Winkler et al., 2002). All other variants with a noticeable population of the neutral chromophore that were examined here and in other studies exhibit only a very weak blue fluorescence. The reason is that the blue fluorescence decay of all our mutants, except for the S65G/E222Q ones, exhibits a short component around 250 ps or less, which is not determined by ESPT. This is also true for the deGFP variants at pH 5.6, described in Hanson et al. (2002) and McAnaney et al. (2002).
The question arises by what mechanism their blue fluorescence is quenched. One possible explanation is a proton shuffle from E222 to the imidazolinone moiety in the excited state. This would lead to a cationic chromophore prone to fast internal conversion (Weber et al., 1999). However, because no direct connection between the heterocycle and E222 is seen either in the x-ray structures of S65T or in the minor wild-type structure, this is a rather unrealistic scenario. A second explanation for the strong blue fluorescence in the S65G/E222Q mutants and its quenching in other GFP variants is the tighter packing of the protein backbone. This leads to a reduced internal conversion of the excited RH. The amino acid E222Q has the capability to form one more hydrogen bond than E222. This bond can increase the friction for rotational movement of the chromophore, which is a prerequisite for any internal conversion (IC) mechanism. Recent experiments with an isolated GFP model chromophore in solvents with varying viscosities have confirmed the strong dependence of internal conversion on the solvent viscosity (Litvinenko et al., 2002; Kummer et al., 2002a). However, the observed trend in the RH fluorescence quantum yield is contrary to that of the deprotonated forms (Fig. 4, b and c). We therefore exclude microviscosity differences as an explanation of the observed variations in the blue fluorescence of RH.
Since the explanations presented above fail, we suggest an alternative decay mechanism. In this model, an initial electron transfer from residue E222 to the chromophore takes place upon excitation with 400 nm light. This hypothesis is based on the well-known photoconversion behavior of the E222 variants. Both wt-GFP and the mutant T203V can be decarboxylated under illumination with ∼400 nm light. This decarboxylation supposedly follows a Kolbe mechanism with an initial electron transfer step (Bell et al., 2003) leading to a chromophore radical with altered photophysical properties. Thus, the electron transfer can be assumed to present an efficient quenching mechanism for the blue fluorescence. The presence of E222, however, is a prerequisite for this electron transfer to take place. For the verification of this hypothesis, transient absorption experiments should be performed, since they can detect transient, nonfluorescing species with an altered absorption spectrum. Transient-absorption measurements concerning this issue, however, either were not yet successful on GFP variants with the Y66 chromophore or were performed on variants with very different chromophores (Kummer et al., 1998). Our model would readily explain why just the isoelectronic and isosteric change from –COOH in E222 to –CO(NH2) in E222Q can have such a strong effect on the fluorescence lifetimes.
It is finally instructive to compare the fluorescence lifetimes of RH species to those of the R− species. The blue fluorescence observed in S65G/E222Q and S65G/T203V/E222Q decays with a lifetime of ∼1.2 ns. This decay time is only slightly smaller than those of the long components of the corresponding deprotonated chromophore forms, which are more reliable for a comparison due to the cancelled contribution of the structural heterogeneity (cf. Fluorescence decay of the R− species). From what has been said above, fluorescence quenching by an electron transfer must be insignificant in this case. The observed lifetimes do not, however, represent the radiative lifetime limit. Instead, IC processes still occur and quench the blue fluorescence. The important role of IC as a quenching mechanism is underlined by the increasing lifetimes measured from S65G/E222Q, S65G/T203V/E222Q (RH) < S65G/E222Q (R−) < S65G/T203V/E222Q (R−) (Tables 2 and 3). In this series, the contribution of the hula-twist motion is assumed to be fairly similar (Fig. 7 c); the fluorescence decay is then modulated by the extent to which the one-bond rotation around φ contributes to IC pathways. The single-bond character is largest, if the contribution of the benzoidal structure is largest. This is achieved if the negative charge is neutralized on Y66-OH (Fig. 7 a).
CONCLUSION
In our contribution, we report a systematic investigation of the influence of point mutations on the photophysical properties of GFP. Due to their practical importance and because of their known pronounced influence, the positions S65, T203, and E222 were chosen as mutagenesis targets. The wt-amino acids were replaced with S65G, T203V, and T203Y, as well as with E222Q. Altogether, a manifold of 12 proteins was investigated. In addition, photoconversion experiments were performed in which E222 was removed by decarboxylation. As spectroscopic techniques, steady-state, and time-resolved fluorescence absorption and emission spectroscopy at room as well as at cryogenic temperature were employed. For GFP, this presents the first systematic spectroscopic study of a combinatorial manifold of mutants. Our approach allows us to explain the causes of interesting point mutations, but also cooperative effects on important GFP properties like the stability of the three different neutral and deprotonated ground-state forms, the absolute spectral positions of the respective transitions from these states, the ESPT between them, and the obtainable fluorescence quantum yields. From our experiments, the following picture arises: For the stabilization of the neutral chromophore RH form at neutral pH, the presence of an acidic side group at position 222 with a hydrogen-bonding network to position 66 is necessary. However, the amino acid at position 65 determines whether the amino acid at position 222 can adopt a conformation allowing it to participate in this hydrogen-bonding network. S65 prevents binding of E222 to the imidazolinone of the chromophore. If, on the other hand, the deprotonated form of the chromophore is preferentially populated, its B- or I-state nature is determined by the existence of a hydrogen bond of the amino acid at position 203 to the oxygen of Y66. This leads to a 20-nm red shift of the absorption. Upon introduction of an aromatic amino acid at position 203, an additional red shift of 10 nm is observed. Our results confirm that only this smaller portion of the red shift is due to π-π interactions. Besides studying systematic changes in the static ground-state equilibria, we also explored the influence of mutations on the photodynamic equilibria between the different chromophore forms, namely the excited-state proton transfer and the fluorescence quantum yields. It turns out that the existence of the S65 and E222 and an intact hydrogen-bonding network are prerequisite for efficient ESPT in wt-GFP. This also confirms that E222 is the final proton acceptor in ESPT. Our time-resolved experiments imply that a hula-twist motion is an internal conversion pathway important as a quenching mechanism in autofluorescent proteins. Its contribution depends on the steric hindrance in the vicinity of the heterocycle and can be increased by the S65G mutation or photoconversion. As a second important IC mechanism, the rotation around the exocyclic bond φ is revealed, which can be reduced by increasing the quinoidal character of the chromophore. This movement also requires space, but around Y66. Hence, high fluorescence quantum yields in autofluorescent proteins can be realized with deprotonated chromophore forms and bulky substituents such as T203Y. These additionally stabilize the I-state with their preference for the quinoidal chromophore form. As a consequence, the single-mutation variant T203Y shows a very long fluorescence lifetime of 4.4 ns near the radiative limit. Finally, we addressed the question of what mechanism quenches the blue fluorescence of the RH chromophore where ESPT is inhibited and argue that this is most likely due to quenching by electron transfer. It can be suppressed by the mutation S65G/E222Q, which leads to variants exhibiting strong blue fluorescence without modification of the chromophore at position 66. Mutants with blue fluorescence have been proposed as ratiometric pH sensors (Hanson et al., 2002).
Acknowledgments
G.J. and A.Z. thank C. Bräuchle for continuous support and A. Kummer for bringing the influence of electronic effects to our attention. The authors also thank B. Steipe for his helpful comment in the initial phase of this work, and Catherine Sullivan for careful proofreading.
Financial support was given by Sonderforschungsbereich 533 of the German Science Foundation (DFG).
Gregor Jung and Jens Wiehler contributed equally to this work.
Jens Wiehler's present address is Biomax Informatics AG, Lochhamer Str. 9, 82152 Martinsried, Germany.
Gregor Jung's present address is Biophysical Chemistry, Saarland University, Building 9.2, D-66123 Saarbrücken, Germany.
Andreas Zumbusch's present address is Dept. of Physics and Astronomy, University College London, Gower Street, London WC1E 6BT, UK.
References
- Bae, J. H., M. Rubini, G. Jung, G. Wiegand, M. H. J. Seifert, M. K. Azim, J. S. Kim, A. Zumbusch, T. Holak, L. Moroder, R. Huber, and N. Budisa. 2003. Expansion of the genetic code enables design of a novel “gold” class of green fluorescent proteins. J. Mol. Biol. 328:1071–1081. [DOI] [PubMed] [Google Scholar]
- Baffour-Awuah, N., and M. Zimmer. 2004. Hula-twisting in green fluorescent protein. Chem. Phys. 303:7–11. [Google Scholar]
- Barondeau, D. P., C. D. Putnam, C. J. Kassmann, J. A. Tainer, and E. D. Getzoff. 2003. Mechanism and energetics of green fluorescent protein chromophore synthesis revealed by trapped intermediate structures. Proc. Natl. Acad. Sci. USA. 100:12111–12116. [DOI] [PMC free article] [PubMed] [Google Scholar]
- Bell, A. F., D. Stoner-Ma, R. M. Wachter, and P. J. Tonge. 2003. Light-driven decarboxylation of wild-type green fluorescent protein. J. Am. Chem. Soc. 125:6919–6926. [DOI] [PubMed] [Google Scholar]
- Branchini, B. R., A. R. Nemser, and M. Zimmer. 1998. A computational analysis of the unique protein-induced tight turn that results in posttranslational chromophore formation in green fluorescent protein. J. Am. Chem. Soc. 120:1–6. [Google Scholar]
- Brejc, K., T. K. Sixma, P. A. Kitts, S. R. Kahn, R. Y. Tsien, M. Ormö, and S. J. Remington. 1997. Structural basis for dual excitation and photoisomerization of the Aequorea victoria green fluorescent protein. Proc. Natl. Acad. Sci. USA. 94:2306–2311. [DOI] [PMC free article] [PubMed] [Google Scholar]
- Chalfie, M., Y. Tu, G. Euskirchen, W. W. Ward, and D. C. Prasher. 1994. Green fluorescent protein as a marker for gene expression. Science. 263:802–805. [DOI] [PubMed] [Google Scholar]
- Chattoraj, M., B. A. King, G. A. Bublitz, and S. G. Boxer. 1996. Ultra-fast excited state dynamics in green fluorescent protein: Multiple states and proton transfer. Proc. Natl. Acad. Sci. USA. 93:8362–8367. [DOI] [PMC free article] [PubMed] [Google Scholar]
- Cotlet, M., J. Hofkens, M. Maus, T. Gensch, M. van der Auweraer, J. Michiels, G. Dirix, M. Van Guyse, J. Vanderleyden, A. J. W. G. Visser, and F. C. De Schryver. 2001. Excited-state dynamics in the enhanced green fluorescent protein mutant probed by picosecond time-resolved single photon counting spectroscopy. J. Phys. Chem. B. 105:4999–5006. [Google Scholar]
- Creemers, T. M. H., A. J. Lock, V. Subramaniam, T. Jovin, and S. Völker. 1999. Three photoconvertible forms of green fluorescent protein identified by spectral hole-burning. Nat. Struct. Biol. 6:557–560. [DOI] [PubMed] [Google Scholar]
- Elsliger, M. A., R. M. Wachter, G. T. Hanson, K. Kallio, and S. J. Remington. 1999. Structural and spectral response of green fluorescent protein variants to changes in pH. Biochemistry. 38:5296–5301. [DOI] [PubMed] [Google Scholar]
- Gill, S., and P. H. von Hippel. 1989. Calculation of protein extinction coefficients from amino acid sequence data. Anal. Biochem. 182:319–326. [DOI] [PubMed] [Google Scholar]
- Hanson, G. T., T. B. McAnaney, E. S. Park, M. E. P. Rendell, D. K. Yarbrough, S. Chu, L. Xi, S. G. Boxer, M. H. Montrose, and S. J. Remington. 2002. Green fluorescent protein variants as ratiometric dual emission pH sensors. 1. Structural characterization and preliminary application. Biochemistry. 41:15477–15488. [DOI] [PubMed] [Google Scholar]
- Heikal, A., S. T. Hess, and W. W. Webb. 2001. Multiphoton molecular spectroscopy and excited-state dynamics of enhanced green fluorescent protein (EGFP): acid-base specifity. Chem. Phys. 274:37–55. [Google Scholar]
- Kummer, A. D., C. Kompa, H. Lossau, F. Pöllinger-Dammer, M. E. Michel-Beyerle, C. M. Silva, E. J. Bylina, W. J. Coleman, M. M. Yang, and D. C. Youvan. 1998. Dramatic reduction in fluorescence quantum yield in mutants of green fluorescent protein due to fast internal conversion. Chem. Phys. 237:183–193. [Google Scholar]
- Kummer, A. D., C. Kompa, H. Niwa, T. Hirano, S. Kojima, and M. E. Michel-Beyerle. 2002a. Viscosity-dependent fluorescence decay of the GFP chromophore in solution due to fast internal conversion. J. Phys. Chem. 106:7557–7559. [Google Scholar]
- Kummer, A., J. Wiehler, H. Rehaber, C. Kompa, B. Steipe, and M. E. Michel-Beyerle. 2000. Effects of threonine 203 replacements on excited-state dynamics and fluorescence properties of the green fluorescent protein (GFP). J. Phys. Chem. B. 104:4791–4798. [Google Scholar]
- Kummer, A. D., J. Wiehler, T. A. Schüttrigkeit, B. W. Berger, B. Steipe, and M.-E. Michel-Beyerle. 2002b. Picosecond time-resolved fluorescence from blue-emitting chromophore variants Y66F and Y66H of the green fluorescent protein. ChemBioChem. 3:659–663. [DOI] [PubMed] [Google Scholar]
- Lill, M. A., and V. Helms. 2002. Proton shuttle in green fluorescent protein studied by dynamic simulations. Proc. Natl. Acad. Sci. USA. 99:2778–2781. [DOI] [PMC free article] [PubMed] [Google Scholar]
- Litvinenko, K. L., N. M. Webber, and S. R. Meech. 2003. Internal conversion in the chromophore of the green fluorescent protein: Temperature dependence and isoviscosity analysis. J. Phys. Chem. A. 107:2616–2623. [Google Scholar]
- Liu, R. S. H., and G. S. Hammond. 2000. The case of medium-dependent dual mechanisms for photoisomerization: one-bond-flip and hula-twist. Proc. Natl. Acad. Sci. USA. 97:11153–11158. [DOI] [PMC free article] [PubMed] [Google Scholar]
- Lossau, H., A. Kummer, R. Heinecke, F. Poellinger-Dammer, C. Kompa, G. Bieser, T. Jonsson, C. M. Silva, M. M. Yang, D. C. Youvan, and M. E. Michel-Beyerle. 1996. Time resolved spectroscopy of wild type and mutant green fluorescent proteins reveals excited state deprotonation consistent with fluorophore-protein interactions. Chem. Phys. 213:1–16. [Google Scholar]
- McAnaney, T. N., E. S. Park, G. T. Hanson, S. J. Remington, and S. G. Boxer. 2002. Green fluorescent protein variants as ratiometric dual emission pH sensors. 2. Excited-state dynamics. Biochemistry. 41:15489–15494. [DOI] [PubMed] [Google Scholar]
- Ormö, M., A. B. Cubitt, K. Kallio, L. A. Gross, R. Y. Tsien, and S. J. Remington. 1996. Crystal structure of the Aequorea victoria green fluorescent protein. Science. 273:1392–1395. [DOI] [PubMed] [Google Scholar]
- Palm, G. J., A. Zdanov, G. A. Gaitanaris, R. Stauber, G. N. Pavlakis, and A. Wlodawer. 1997. The structural basis for spectral variations in green fluorescent protein. Nat. Struct. Biol. 4:361–365. [DOI] [PubMed] [Google Scholar]
- Patterson, G. H., and J. Lippincott-Schwartz. 2002. A photoactivatable GFP for selective photolabeling of proteins and cells. Science. 297:1873–1877. [DOI] [PubMed] [Google Scholar]
- Rizzo, M. A., G. H. Springer, B. Granada, and D. W. Piston. 2004. An improved cyan fluorescent protein variant useful for FRET. Nat. Biotechnol. 22:445–449. [DOI] [PubMed] [Google Scholar]
- Schwille, P., S. Kummer, A. A. Heikal, W. E. Moerner, and W. W. Webb. 2000. Fluorescence correlation spectroscopy reveals fast optical excitation-driven intramolecular dynamics of yellow fluorescent proteins. Proc. Natl. Acad. Sci. USA. 97:151–156. [DOI] [PMC free article] [PubMed] [Google Scholar]
- Seebacher, C., F. W. Deeg, C. Bräuchle, J. Wiehler, and B. Steipe. 1999. Stable low-temperature photoproducts and hole-burning of green fluorescent protein. J. Phys. Chem. B. 103:7728–7732. [Google Scholar]
- Seifert, M. H. J., D. Ksiazek, K. Azim, P. Smialowski, N. Budisa, and T. A. Holak. 2002. Slow exchange in the chromophore of a green fluorescent protein variant. J. Am. Chem. Soc. 124:7932–7942. [DOI] [PubMed] [Google Scholar]
- Strickler, S. J., and R. A. Berg. 1962. Relationship between absorption intensity and fluorescence lifetime of molecules. J. Chem. Phys. 37:814–822. [Google Scholar]
- Striker, G., V. Subramaniam, C. A. M. Seidel, and A. Volkmer. 1999. Photochromicity and fluorescence lifetimes in green fluorescent protein. J. Phys. Chem. B. 103:8612–8617. [Google Scholar]
- Tozzini, V., A. R. Bizzarri, V. Pellegrini, R. Nifosi, P. Giannozzi, A. Iuliano, S. Cannistraro, and F. Beltram. 2003. The low frequency vibrational modes of green fluorescent proteins. Chem. Phys. 287:33–42. [Google Scholar]
- Tsien, R. Y. 1998. The green fluorescent protein. Annu. Rev. Biochem. 67:509–544. [DOI] [PubMed] [Google Scholar]
- van Thor, J. J., T. Gensch, K. J. Hellingwerf, and L. N. Johnson. 2002. Phototransformation of green fluorescent protein with UV and visible light leads to decarboxylation of glutamate 222. Nat. Struct. Biol. 9:37–41. [DOI] [PubMed] [Google Scholar]
- Volkmer, A., V. Subramaniam, D. J. S. Birch, and T. M. Jovin. 2000. One- and two-photon excited fluorescence lifetimes and anisotropy decays of green fluorescent proteins. Biophys. J. 78:1589–1598. [DOI] [PMC free article] [PubMed] [Google Scholar]
- Wachter, R. M., M.-A. Elsliger, K. Kallio, G. T. Hanson, and S. J. Remington. 1998. Structural basis of spectral shifts in the yellow-emission variants (YFPs) of green fluorescent protein. Structure. 6:1267–1277. [DOI] [PubMed] [Google Scholar]
- Weber, W., V. Helms, J. A. McCammon, and P. W. Langhoff. 1999. Shedding light on the dark and weakly fluorescent states in green fluorescent proteins. Proc. Natl. Acad. Sci. USA. 96:6177–6182. [DOI] [PMC free article] [PubMed] [Google Scholar]
- Wiehler, J., G. Jung, C. Seebacher, A. Zumbusch, and B. Steipe. 2003. Mutagenic stabilization of the photocycle intermediate of the green fluorescent protein. ChemBioChem. 4:1164–1171. [DOI] [PubMed] [Google Scholar]
- Winkler, K., J. Lindner, V. Subramaniam, T. M. Jovin, and P. Vöhringer. 2002. Ultrafast dynamics in the excited state of green fluorescent protein (wt) studied by frequency-resolved femtosecond pump-probe spectroscopy. Phys. Chem. Chem. Phys. 4:1072–1081. [Google Scholar]
- Yokoe, H., and T. Meyer. 1996. Spatial dynamics of GFP-tagged proteins investigated by local fluorescence enhancement. Nat. Biotechnol. 14:1252–1256. [DOI] [PubMed] [Google Scholar]
- Zimmer, M. 2002. Green fluorescent protein (GFP): Application, structure, and related photophysical behavior. Chem. Rev. 102:759–782. [DOI] [PubMed] [Google Scholar]