

Abstract
A coarse-grained molecular model is presented for the study of the equilibrium conformation and titration behavior of chondroitin (CH), chondroitin sulfate (CS), and hyaluronic acid (HA)—glycosaminoglycans (GAGs) that play a central role in determining the structure and biomechanical properties of the extracellular matrix of articular cartilage. Systematic coarse-graining from an all-atom description of the disaccharide building blocks retains the polyelectrolytes' specific chemical properties while enabling the simulation of high molecular weight chains that are inaccessible to all-atom representations. Results are presented for the characteristic ratio, the ionic strength-dependent persistence length, the pH-dependent expansion factor for the end-to-end distance, and the titration behavior of the GAGs. Although 4-sulfation of the N-acetyl-D-galactosamine residue is found to increase significantly the intrinsic stiffness of CH with respect to 6-sulfation, only small differences in the titration behavior of the two sulfated forms of CH are found. Persistence length expressions are presented for each type of GAG using a macroscopic (wormlike chain-based) and a microscopic (bond vector correlation-based) definition. Model predictions agree quantitatively with experimental conformation and titration measurements, which support use of the model in the investigation of equilibrium solution properties of GAGs.
INTRODUCTION
Proteoglycans are high molecular weight comb biopolymers that play a fundamental role in determining the biomechanical, biochemical, and structural properties of the extracellular matrix (ECM) of tissues including articular cartilage, the central nervous system, and the corneal stroma (Hascall and Hascall, 1981; Iozzo, 1998; Morgenstern et al., 2002; Roughley and Lee, 1994; Watanabe et al., 1998; Wight and Merrilees, 2004). They also play an important role as cell surface receptors and co-receptors, mediating cell-cell signaling, recognition, and binding (Couchman, 2003; Nakato and Kimata, 2002; Rauch et al., 2001; Selva and Perrimon, 2001; Stallcup, 2002; Yoneda and Couchman, 2003). Proteoglycans consist of a linear core protein main chain with branching linear glycosaminoglycan (GAG) side chains that are covalently attached to trifunctional branch points along the main chain. The term GAG encompasses a class of anionic polysaccharides that includes chondroitin (CH) and its sulfated form chondroitin sulfate (CS), hyaluronic acid (HA), dermatan sulfate, keratan sulfate, and heparan sulfate.
Of particular interest is aggrecan, the predominant proteoglycan found in articular cartilage and the primary determinant of its compressive mechanical properties (Buschmann and Grodzinsky, 1995). A single aggrecan molecule consists of ∼100 CS-GAGs (each 10–30 kDa, which corresponds to 20–60 disaccharide units with a 200–600 Å contour length) O-linked to serine residues at serine-glycine residue pairs on the ∼300 kDa core protein (∼4000 Å contour length), as well as ∼60 smaller keratan sulfate oligosaccharides of considerably lower molecular weight (Fig. 1) (Doege et al., 1991; Roughley and Lee, 1994).
FIGURE 1.

Schematic (left) and AFM image (right) of a single aggrecan molecule, illustrating the core protein main chain and the grafted GAG side chains (cp, core protein; CS, chondroitin sulfate; KS, keratan sulfate; N, N-terminal domain; C, carboxy-terminal domain; G1, globular domain 1; G2, globular domain 2; G3, globular domain 3; and IGD, interglobular domain). Figures courtesy of Laurel Ng (Ng et al., 2003).
With the aid of link protein, aggrecan associates noncovalently at its G1 domain with high molecular weight HA to form supramolecular aggregates, which serve to retain aggrecan in the ECM. The high concentration of aggrecan in cartilage generates a hydrating osmotic swelling pressure in equilibrium that is opposed by tensile stresses in the surrounding elastic collagen network (Maroudas, 1976). The interplay of these effects imparts unique biomechanical properties to the tissue, namely a low coefficient of sliding friction even under substantial compressive loads, protecting bone ends from wear during joint locomotion.
Interestingly, the sulfation type (4- versus 6-sulfation of N-acetyl-D-galactosamine in CS), sulfation pattern (statistical distribution of sulfates in CS), the molecular weight of CS, and the spacing between CS branch points on the core protein of aggrecan vary significantly with disease (osteoarthritis or rheumatoid arthritis), age, depth within the cartilage layer, and anatomical site (Bayliss et al., 1999; Hardingham, 1998; Lewis et al., 1999; Ng et al., 2003; Plaas et al., 1997, 1998; Platt et al., 1998; Roughley and Lee, 1994; Sauerland et al., 2003). For these reasons of direct biological relevance, it is of interest to characterize and understand the relationships between the chemical composition of these biopolymers and their properties in physiological solution, including their equilibrium conformation, osmotic pressure, and titration behavior.
Molecular simulation provides a useful, controlled setting in which to carry out a systematic investigation in this regard, particularly because of the vast size of the parameter space of interest (e.g., sulfation type, sulfation pattern, polymer molecular weight and concentration, bath pH, and ionic strength). The use of a conventional all-atom model in this endeavor, however, is entirely precluded by computational limitations for even a single GAG of biologically relevant molecular weight, much less for aggrecan in concentrated solution. As an alternative, we have utilized systematic coarse-graining to develop a model that enables the prediction of these properties in a computationally efficient manner.
The model is similar in spirit to previously developed models for polysaccharides including pullulan, xythan, cellulose, laminaran, and HA (Cleland, 1971, 1984; Perico et al., 1999). In these models, only the glycosidic linkage torsion angle degrees of freedom are retained, because they represent the predominant portion of the conformational flexibility of polysaccharides. Explicit atom models of isolated disaccharides are used to generate pretabulated potentials of mean force for the glycosidic torsions, or the corresponding statistical weights required for rotational isomeric state theory, either of which may be used directly to compute polysaccharide-specific conformational properties corresponding to the unperturbed, θ-state.
In the present work we go beyond these θ-state modeling studies by including electrostatic interactions between nonadjacent (nonbonded) monosaccharides, which are essential to investigating the properties of GAGs in physiological solution. Hydrophobic and attractive van der Waals nonbonded interactions are ignored for the most part because electrostatic effects have been shown to dominate in determining GAG conformational and thermodynamic properties at the ionic strengths considered (≤1 M) (Buschmann and Grodzinsky, 1995; Reed and Reed, 1991). Nevertheless, a simple model for steric nonbonded interactions is used to reaffirm this assumption. Finally, the variable protonation state of the carboxylate group present on D-glucuronic acid is taken into account using a titration model previously developed for macromolecules and applied to HA (Beroza et al., 1991; Cleland, 1984; Reed and Reed, 1992; Ullner and Jönsson, 1996).
Although the coarse-grained model is generally applicable to any GAG, it is applied here to CH, CS, and HA because of our interest in aggrecan and articular cartilage. In the current work we study their properties in infinitely dilute solution as a first step toward understanding their chemical composition-solution property relationships, as well as to validate our methodology. In separate work we investigate the conformation and osmotic pressure of CS and aggrecan at finite, physiological concentrations to gain a more comprehensive, as well as physiologically relevant, understanding of their properties.
The article is organized as follows. We first define the coarse-grained model topology and energetics, which are decomposed into bonded monosaccharide interactions occurring across single glycosidic linkages and nonbonded monosaccharide interactions occurring between nonadjacent monomers. The titration model used to simulate the variable protonation state of the carboxylate groups is then described, as well as the Metropolis Monte Carlo algorithm used to generate equilibrium distributions in conformation-protonation space. The characteristic ratio, persistence length, and radius of gyration for fully ionized GAGs are presented first, followed by titration curves for CH, C4S, and C6S, and the pH-dependent expansion factor for the end-to-end distance for CH and C4S. Comparison is made with existing experimental data for the persistence length, radius of gyration, and titration curves for HA and for the end-to-end distance for C4S and C6S.
MODEL DEFINITION
Chondroitin is a linear (unbranched) polysaccharide consisting of repeating disaccharide units of D-glucuronic acid (GlcUA) and N-acetyl-D-galactosamine (GalNAc), alternately linked in β1,3 and β1,4 glycosidic linkages (Fig. 2). Chondroitin sulfates in aggrecan typically consist of 20–60 CH disaccharides that are sulfated at either the 4- or 6-carbon of the GalNAc residue, denoted C4S or C6S, respectively (Fig. 2). HA is similar in chemical structure to CH, consisting of repeating disaccharide units of D-glucuronic acid and N-acetyl-D-glucosamine (GlcNAc), but is typically of very high molecular weight, ranging from 105 to 106 Da, equivalent to ∼250–2500 disaccharide repeat units, and is not sulfated. For ease of notation, A, B, C, D, and E may be used to refer to the monosaccharide units, GlcUA, GalNAc, GalNAc4S, GalNAc6S, and GlcNAc, respectively, when appropriate. For example, the chondroitin disaccharide, GlcUAβ1,3GalNAc, is then simply denoted AB.
FIGURE 2.

Disaccharide repeat units of CH, C4S, C6S, and HA.
Topology
Following previous polysaccharide modeling studies (Brant and Goebel, 1975; Perico et al., 1999), the coarse-grained model backbone is defined by the sequence of chemical and virtual bonds depicted in Fig. 3.
FIGURE 3.

Definition of the coarse-grained model bonded backbone structure (thick solid lines) based on the all-atom disaccharide representation for (top) β1,3 and (bottom) β1,4 linkages.
Each monosaccharide unit (A–E) consists of three backbone sites that coincide with atoms CJ, C1, O1, where J = 4 for unit A and J = 3 for units B–E. Additional center of charge, VQ, and center of geometry, VG, sites (not shown in Fig. 3) are used to model nonbonded electrostatic and steric interactions, respectively, between nonadjacent monosaccharides, where the instantaneous center of charge of a discrete charge distribution is  and the center of geometry is
  where qi is the charge of atom i, ri is its position, N is the number of atoms, and V is used to denote the fact that the center of charge and center of geometry sites are virtual in that they do not correspond to real atoms. Virtual bonds are defined between the real atom C1 and the virtual sites, VQ and VG, to define internal coordinates for the sites. All bond lengths, valence angles, and torsion angles in the model are treated as rigid, except for the glycosidic torsion angles, which predominate polysaccharide conformational flexibility (Brant and Goebel, 1975; Cleland, 1971; Perico et al., 1999; Rodriguez-Carvajal et al., 2003).
The assumption of rigid internal degrees of freedom (excluding the glycosidic torsions) is justified only if each monosaccharide resides in a single, stable ring conformation in solution at room temperature (e.g., 4C1 or 1C4 chair). Here, we use Cremer-Pople ring puckering parameters to quantify the equilibrium distribution of monosaccharide conformations and justify the approximation. The three puckering parameters (QCP, θCP, and φCP), provide a quantitative measure of the instantaneous conformation of six-membered pyranose rings, where QCP denotes the total puckering amplitude and the angles θCP (0° ≤ θCP ≤ 180°) and φCP (0° ≤ φCP < 360°) are polar and azimuthal angles, respectively, that denote a point on a sphere of radius QCP. The 4C1 and 1C4 chair conformations correspond to the poles θCP = 0°, 180°, and the flexible boat and skew-boat conformations correspond to the equator, where θCP = 90° (Cremer and Pople, 1975). Equilibrium, room-temperature all-atom simulations of solvated disaccharides were performed and the corresponding probability distributions of the puckering parameters analyzed. For each monosaccharide, the probability distributions of QCP and θCP were unimodal with 〈θCP〉 near 0°, indicative of a 4C1 chair conformation, irrespective of whether the monosaccharide was at the reducing or nonreducing terminus (Supplementary Material, Table 1).
Having confirmed the stability of the monosaccharide chair conformations and having defined the coarse-grained model topology, we next determined the actual values of the fixed internal degrees of freedom to be used in the model. The values of the fixed degrees of freedom were equated with their corresponding mean values calculated from the all-atom simulations of isolated, solvated disaccharides and are presented in Supplementary Material, Table 2.
Bonded energy
The conformational energy of successive glycosidic linkage torsion angles are assumed to be independent in the high ionic strength limit, which implies that short-ranged specific chemical interactions (e.g., hydrogen bonding) occur only across single glycosidic linkages. This assumption is justified by the presence of the nearly rigid intervening sugar monomers that provide spatial separation between successive linkages and has been used previously in polysaccharide modeling studies (Brant and Christ, 1990; Perico et al., 1999). Neighboring torsion angles, φ and ψ, within a given glycosidic linkage, however, are typically highly interdependent and were treated as such. Simple inversion of the Boltzmann distribution was used to compute and tabulate potentials of mean force (PMFs) for the glycosidic torsion angles from equilibrium probability distributions obtained from the solvated disaccharide simulations,  where α and β refer to the monosaccharide identities A, B, C, D, or E, kB is the Boltzmann constant, and T is absolute temperature (Tschöp et al., 1998). The eight different PMFs computed for the GAGs modeled (AB, AC, AD, and AE for the β1,3 linkage; BA, CA, DA, and EA for the β1,4 linkage) are provided as Supplementary Material. The tabulated free energies were employed in the coarse-grained simulations and implicitly included all direct and indirect interactions occurring across a single glycosidic linkage, including the exo-anomeric effect, van der Waals, hydrogen bond, and solvent-mediated electrostatic interactions, as well as the conformational entropy of the internal disaccharide degrees of freedom. The total bonded free energy of a GAG consisting of N monosaccharide units in a conformation specified by the set of glycosidic torsions {φ,ψ} is given by
 |
(1) |
where a single summation is performed over all glycosidic linkages and  and
and  denote the identities of monosaccharide numbers i and i + 1, respectively (i.e., α, β = A, B, C, D, or E).
In general,  depends on environmental conditions including temperature, pH, and ionic strength. Because our interest is limited to room temperature conditions, we only tested the effects of pH and ionic strength on
  by repeating each disaccharide simulation: 1), with a protonated carboxylate group (the sulfate group is a strong acid and is therefore assumed to be ionized at all relevant pH values); and 2), at 1 M ionic strength using an all-atom Debye-Hückel interaction energy that we implemented in the user-defined energy subroutine in CHARMM (Brooks et al., 1983). Results suggested that each
  is insensitive to both the protonation state of the carboxylate group and the ionic strength, purportedly due to the dominance of covalent (e.g., the exo-anomeric effect) and hydrogen bond interactions occurring across the glycosidic linkages (Almond et al., 1997). Accordingly, the generally solvent-dependent
  were assumed to be independent of pH and ionic strength in the coarse-grained model, despite the acknowledged limitations present in the implicit solvent model employed. Of course, other than in disaccharides, the glycosidic torsion angle distribution functions, Pαβ(φ,ψ), will generally depend both on ionic strength and pH in the coarse-grained model because of electrostatic and steric interactions occurring between nonneighboring (i.e., nonbonded) monosaccharides.
Two alternative approaches in place of the room temperature simulations used to compute  were also investigated. These were: 1), treating each monosaccharide as rigid in its minimum energy conformation and stepping incrementally through (φ,ψ)-space to compute the disaccharide energy at each grid point; and 2), performing the same procedure as in 1, followed by a constrained glycosidic torsion angle energy minimization at each grid point to obtain a local energy minimum. In each of these approaches, the conformational entropy of the non-(φ,ψ) internal degrees of freedom was neglected because a single conformer replaced the ensemble averages used to extract the PMFs from the room temperature disaccharide simulations. The first approach proved inadequate due to the steric overlap of bulky side groups in neighboring monosaccharides, which artificially precluded normally accessible regions of (φ,ψ)-space. Energy minimization employed in the second approach relieved the steric overlap problem encountered in procedure 1, above. However, appreciably different energy surfaces were obtained with respect to the finite temperature simulations, presumably due to the effects of conformational entropy of the non-(φ,ψ) degrees of freedom included in the latter. For this reason, we opted to employ the finite-temperature simulation approach to computing
Nonbonded energy
Electrostatic interactions
A single charge site (VQ) was defined for each charged monosaccharide (A, C, and D) by computing its mean center of charge (defined in Topology, above) from the explicit atom disaccharide simulations and defining its mean virtual bond length, valence angle, and dihedral torsion angle (Supplementary Material, Table 2). Aqueous electrolyte-mediated electrostatic interactions between nonadjacent, negatively charged monosaccharides were modeled using the Debye-Hückel interaction potential applied to the center of charge site (VQ) assuming zero ionic radius,
 |
(2) |
where z denotes the valence of the monosaccharide charge site, which is either 0 or 1 for the sugars considered. κ = (8πλBNAcs)1/2 is the inverse Debye length, NA is Avogadro's number, cs is the reservoir molar ionic strength of the fully dissociated 1:1 electrolyte (note that the contribution to cs due to the reservoir of hydrogen ions and their conjugate base must be included when the titration model is used), r is the distance of separation between the monosaccharide centers of charge, and all charge sites have been assumed to have charge −e (monovalent sulfate and carboxylate groups), where e is the electron charge. λB ≡ e2/ɛkBT is the Bjerrum length, defined to be the distance at which the Coulombic interaction energy of two monovalent charges embedded in a uniform dielectric medium is equal to kBT (λB = 7.14 Å in water at 298 K), and  is the dielectric permittivity.
The Debye-Hückel (or Yukawa) interaction potential in Eq. 2 is based on the (linearized) Poisson-Boltzmann equation and therefore implicitly assumes spatial uniformity of the electrochemical potentials of the electrolyte species, which in turn are assumed to be in osmotic equilibrium with a reservoir of fixed ionic strength. The interaction potential further assumes that:
Linearized Poisson-Boltzmann theory is valid, and therefore that the condition, |eψ(r)/kBT| ≪ 1, is satisfied throughout space because linearization has been carried out around the reference, reservoir electrostatic potential (Bathe et al., 2004; Deserno and von Grünberg, 2002).
The monosaccharide charge distributions are well-approximated by their centers of charge, which neglects monopole–dipole and higher order contributions to the electrostatic energy.
Monosaccharides have a dielectric permittivity equal to that of water, and they do not exclude mobile ions from their molecular domain.
This last assumption inherently ignores any GAG desolvation energy and is the reason why the self-energy of the polyelectrolyte charge sites has been omitted from Eq. 2 (it is a constant that is unaffected by GAG conformation). Of course, this approximation will be best for GAG conformations in which the charge sites remain solvent-exposed. Assumption 3 also ignores any focusing/defocusing of electrostatic field lines that may be induced by the low GAG dielectric, which could render the Debye-Hückel interaction energy in Eq. 2 invalid (Bathe, 2004; Skolnick and Fixman, 1978).
Despite the numerous approximations inherent in the Debye-Hückel potential, it has enjoyed considerable success in the polyelectrolyte modeling community. It has the attractive feature that it captures the essential physics to first-order—namely, screened electrostatic interactions between polyelectrolyte charge groups, while being transparently simple in form without any adjustable parameters. Alternative electrostatic energy models include the Generalized-Born model (Qiu et al., 1997; Schaefer and Karplus, 1996; Still et al., 1990) or tabulated solutions to the continuum Poisson-Boltzmann equation for pairwise interacting monosaccharides. Each of those approaches is considerably more complex and computationally expensive than the Debye-Hückel potential, however, and is not warranted in our view in an initial attempt at developing a coarse-grained model for GAGs.
Steric interactions
Steric interactions between nonadjacent monosaccharides were modeled using a repulsive Lennard-Jones (LJ) potential applied to the center of geometry site (VG) defined in Topology, above. The repulsive LJ potential corresponding to monosaccharide pair αβ is
 |
(3) |
where  is the cutoff radius, and
  and
and  are the van der Waals energy and radius parameters, respectively. The LJ radius,
  was equated with the radius of a sphere obtained by equating the volume of the sphere with the volume inside the molecular surface of monosaccharide α, which was calculated using a 1.4 Å radius spherical probe (
 = 3.29, 3.56, 3.66, 3.66, and 3.56 Å for α = A, B, C, D, and E, respectively). The LJ energy parameter,
  was taken to be the value for carbon–carbon interactions (0.15 kcal/mol = 0.253 kBT at 298 K), though CS conformational and osmotic pressure results were found to be insensitive to the precise value of
  within a factor of 2 at ionic strengths ≥0.15 M. The Lorentz-Berthelot mixing rules were used to obtain the remaining LJ parameters,
  and
and 
Accounting for bonded and nonbonded monosaccharide interactions, the free energy of GAG in a conformation defined by the set of glycosidic torsion angles {φ,ψ} is given by
 |
(4) |
where the first summation is carried out over all glycosidic linkages and the double summation is over all pairs of monosaccharides, excluding nearest-neighbors, whose interactions are accounted for in  The LJ potential remains deactivated throughout the Results section, below, for reasons of computational efficiency, except in Effect of Steric Interactions. In that isolated section, the potential is activated in a few select test cases to justify the assumption that electrostatic interactions dominate in determining the conformation of GAGs under the conditions examined in this work, as previously assumed a priori by Reed and Reed (1991) for HA.
According to the Manning criterion (Manning, 1969), if the equivalent line charge density of a polyelectrolyte, ξ ≡ λB/d, is greater than unity, where d is the intercharge spacing, monovalent counterions will condense on the polyelectrolyte until its effective charge density is reduced to unity. Although CH and HA have equivalent line charge densities of 0.7 (assuming an intercharge spacing equal to the approximate disaccharide repeat unit length of 10 Å and a Bjerrum length of 7 Å) and therefore meet the criterion for full ionization, CS has an equivalent line charge density of 1.4 and would therefore be partially deionized according to Manning's criterion. Manning's criterion is strictly applicable to an idealized line of point charges, however, and does not account for the molecular details of a real polyelectrolyte or its counterions (e.g., low dielectric, salt exclusion, atomic partial charge distribution, counterion desolvation, etc.). Unlike DNA, which has a very high bare charge density of 4.2, CS has a bare charge density that is close enough to the borderline case of 1 that we decided to assume it remains fully ionized rather than renormalize its charge density. More detailed analyses involving all-atom GAG models and either the continuum nonlinear Poisson-Boltzmann equation or explicit solvent simulations would provide further insight into the degree of counterion condensation present in CS, if any, but are beyond the scope of the present study.
In physiological solution, the effects of divalent cations (e.g., Ca2+) on GAG conformation and thermodynamics may also be relevant. Divalent cations may bind specifically to GAG charge sites, thereby reducing the effective charge density of the polyelectrolyte, as well as altering its local bonded interactions. Each of these effects may in turn affect GAG conformation (Rodriguez-Carvajal et al., 2003). Additionally, unbound divalent cations may induce an effective attraction between negatively charged polyelectrolytes due to mobile ion correlations, which are not captured by the mean-field Poisson-Boltzmann and Debye-Hückel theories (Akesson and Jönsson, 1991; Deserno et al., 2000; Svensson et al., 1990; Tang et al., 1996). Although the specific binding of Ca2+ to CS and HA has been considered both experimentally (Cael et al., 1978; Sheehan and Atkins, 1983; Winter and Arnott, 1977) and theoretically (Rodriguez-Carvajal et al., 2003), those studies limited their investigations of divalent ion effects to the polysaccharide fiber state. Indeed, experimental studies on the conformation of CS and HA in solution have focused primarily on the effects of 1:1 salts. For this reason, as well as the associated theoretical challenges posed by the modeling of divalent ions, we leave their consideration to future work despite their potential biological significance. The effects of different monovalent cations (e.g., K+ versus Na+) on GAG conformation are expected to be of lesser importance, and are not considered here.
Titration
Unlike isolated monoacids, titrating groups in polyacids are spatially constrained by connectivity of the polymer backbone. This forces them to interact electrostatically and leads to markedly different titration behavior from their isolated monoacid counterparts. In particular, unfavorable electrostatic interaction between two anionic titrating groups in a polyacid may be relieved by protonation of one or both groups. This effect tends to shift their dissociation equilibrium toward the associated (protonated) state and manifests itself in an apparent acidity that increases with increasing degree of ionization of the polyacid. Adding complexity to the picture, ionic screening and polymer conformational flexibility mediate the strength of intramolecular electrostatic interactions and thus the titration behavior.
The titration of macromolecules has been modeled and studied previously using discrete site models for proteins and nucleic acids (Antosiewicz et al., 1996; Bashford and Karplus, 1990; Beroza et al., 1991; Hill, 1956; Tanford, 1957; Tanford and Kirkwood, 1957; Yang et al., 1993) as well as for polyelectrolytes (Jönsson et al., 1996; Sassi et al., 1992; Ullner and Jönsson, 1996), such as HA (Cleland, 1984; Reed and Reed, 1992). The apparent acidity of a polyacid is calculated by defining an apparent dissociation constant, pKapp that, unlike for monoacids, is a function of the average overall degree of ionization of the polyacid,  where αi is the ionization state (0 or 1 for deionized or ionized, respectively) of the ith titratable site in a polyacid with P titrating sites and brackets are used to denote esemble averaging,
 |
(5) |
To model GAG titration, we follow Reed and Reed (1992) and Ullner and Woodward (2000) and employ a semi-grand canonical ensemble in which the chemical species are the titrating sites corresponding to the weak acid carboxylate groups in GlcUA residues. The strongly acidic sulfate groups in CS are assumed to remain fully ionized at all relevant values of pH (Cleland, 1991). The carboxylate center of charge site (VQ) is assumed to have a variable state of protonation, x ∈ {0,1}, where x denotes the number of protons bound to the site. For a GAG consisting of N monosaccharides in a conformation specified by {φ,ψ}, the free energy associated with a subset of P titrating sites in protonation state {xP} may be written (Beroza et al., 1991; Reed and Reed, 1992; Ullner and Jönsson, 1996) as
 |
(6) |
where the single summation runs over all titrating sites, the double summation accounts for the electrostatic interaction of each titrating site with all other charged sites in the GAG, including nearest-neighbors and nontitrating sites (i.e., GalNAc4S and GalNAc6S), and  is the total chemical potential associated with protonation of site i. μH+ = −kBT ln(10)pH is the free energy change of protonation associated with removal of a hydrogen ion from the reservoir of fixed pH and
  is the intrinsic free energy change associated with protonating site i in an otherwise electrically neutral molecule (Beroza et al., 1991).
As pointed out by Beroza et al. (1991),  is a constant in rigid macromolecules that accounts for free energy contributions due to solvation, electrostatic interactions of the site with the fixed charge on the macromolecule, and standard-state quantum mechanical bonding effects. In conformationally flexible macromolecules such as those considered here, however,
  will in general be a function of conformation. Despite this complicating factor, we follow previous investigators (Kundrotas and Karshikoff, 2002; Reed and Reed, 1992; Ullner and Jönsson, 1996) in treating
  as an ensemble-average quantity that is associated with the experimentally measured intrinsic dissociation constant, pKint, and subsequently assume it to be conformation-independent.
Cleland et al. (1982) investigated the titration behavior of HA using potentiometric titration and found pKint = 2.9 ± 0.1. In this study we assume that GlcUA has the same pKint in CH and CS as in HA, which is justified for CH because it is nearly identical chemically to HA, differing only in the stereochemistry of the hydroxyl group at the C4 of GlcNAc in HA. Similarly, the assumption is justified for CS because the effects of the sulfate groups on altering the titration behavior of GlcUA in CH are, within the approximations inherent in the Debye-Hückel interaction potential, fully accounted for by the electrostatic interactions contained in Eq. 6.
SIMULATION PROTOCOL
All-atom disaccharide and coarse-grained model simulations were performed at room temperature (298 K) assuming infinitely dilute conditions (isolated molecules) using the Metropolis Monte Carlo algorithm. All-atom and fully ionized coarse-grained model simulations were carried out in the canonical ensemble, whereas titration simulations using the coarse-grained model were performed in the semi-grand canonical ensemble described earlier. Conformation and protonation state-altering moves were accepted according to the standard Metropolis criterion, r ≤ min{1,e−βΔF}, where r is a pseudo-random deviate between 0 and 1 and ΔF ≡ Fnew − Fold is the difference in free energy between the new and old conformation or protonation states, as calculated using Eqs. 4 and 6, respectively.
All-atom disaccharide simulations
All-atom simulations of isolated disaccharides were performed using CHARMM (Ver. 27a2) (Brooks et al., 1983) employing the all-atom polysaccharide force field provided with Quanta98 by Accelrys (San Diego, CA). Explicit bond length, valence angle, and improper and dihedral torsion-angle terms were included, where 1–4 electrostatic interactions scaled by 0.5 were included in the torsion energy term, consistent with the current CHARMM force field. Atom-based nonbonded interactions were calculated without cutoffs and included van der Waals and Coulombic interactions with a dielectric permittivity equal to that of water (ɛ = 78.5). The Monte Carlo move set consisted of torsion angle moves applied to all torsion angles and Cartesian displacement moves applied to all atoms, where the move types were performed with equal frequency and were randomly selected at each move to satisfy detailed balance. 106 total moves were used for equilibration followed by 3 × 10⁷ total moves to compute equilibrium averages, requiring ∼6 h on a single 700-MHz Intel Pentium III processor. The number of MC moves used was found to be more than sufficient to generate the limiting equilibrium PMFs, as determined from visual comparison with PMFs generated from simulations using 1/10 and 1/100 as many MC moves.
Although it has been demonstrated that an explicit solvent model is required to capture the fine details of the conformation of HA oligosaccharides (Almond et al., 1997, 1998, 2000), the overall distributions of glycosidic linkage conformations predicted by explicit solvent and this rather coarse implicit solvent model have been shown to be similar (Almond et al., 1997), justifying use of the latter to generate the coarse-grained model PMFs. One benefit of employing an implicit solvent model is that complete sampling of conformation space is ensured because very long simulations may be performed (relatively small number of degrees of freedom) and the sampling efficiency of the solute degrees of freedom is high due to the absence of solvent molecules. More recent implicit solvent models, such as Generalized-Born with a solvent-accessible surface area term (Schaefer and Karplus, 1996), were not employed due to their lack of prevalence in the polysaccharide modeling community and the corresponding lack of a well-validated parameter set for saccharides.
Coarse-grained model simulations
Trial GAG conformations were generated using the pivot move, in which a glycosidic torsion angle was selected at random and changed by a random amount between [−Δtormax, Δtormax], where Δtormax was adjusted on the fly to maintain an acceptance ratio of 40–60%. The pivot algorithm was first introduced by Lal (1969) and later shown to be highly effective for the simulation of self-avoiding random walks by Madras and Sokal (1988). 106 cycles were used to equilibrate the molecule followed by 106 cycles to compute equilibrium properties. Each cycle consisted of N pivot moves, where N was equal to the number of glycosidic linkages in the GAG. A nonbond cutoff of three Debye lengths was used and the Debye-Hückel energy was shifted to equal zero at the cutoff.
To simulate GAG titration, single carboxylate site (de)protonation moves were performed in addition to the conformation-altering pivot move—modeling the exchange of protons with a bulk hydrogen ion reservoir of fixed pH (and hence hydrogen ion chemical potential). The (de)protonation moves were accepted according to the same Metropolis criterion as the pivot move, where the free energy of a trial state is now given by Eq. 6. (De)protonation and pivot moves were selected at random to satisfy detailed balance and were performed with a relative frequency of P:1, where P is the number of titrating sites in the molecule. 25 × 106 cycles were used to equilibrate the molecule followed by 50 × 106 cycles to compute averages, where a cycle here consists of N pivot moves +N × P (de)protonation moves. Unlike previous Monte Carlo simulations of macromolecule titration, in which strong coupling between titrating sites required intramolecular proton exchange moves (Beroza et al., 1991), efficient sampling was achieved in the present study using single site-bulk exchange moves.
Simulation times for fully ionized and titratable GAGs ranged from 1 to 5 days on a single 700-MHz Intel Pentium III processor, depending on GAG molecular weight and the ionic strength. Simulations of up to 2048 monosaccharides were performed, although results from up to only 512 monosaccharides are presented here. These are molecular weights that would be inaccessible using a conventional all-atom representation of GAGs.
RESULTS
Glycosidic torsion angle PMFs
The glycosidic torsion angle PMFs, computed from all-atom disaccharide simulations, are shown in Fig. 4 for each disaccharide (CH, C4S, C6S, and HA) and linkage type (β1,3 and β1,4) investigated. Contour lines of constant energy are drawn in increments of kBT above the minimum energy conformation, which is denoted by an “x”. The PMFs for the β1,4 linkages are highly similar across all disaccharide types (Fig. 4, B, D, F, and H). The reason for the similarities is that the chemical perturbations at the C4 and C6 of GlcNAc and GalNAc are located distal to the β1,4 linkage region (see Fig. 2) and thus do not influence specific trans-glycosidic interactions. Moreover, as noted in Model Definition, above, the influence of Coulombic repulsion between the sulfate and carboxylate groups in C4S and C6S is negligible on the flexibility of the linkages.
FIGURE 4.

Glycosidic torsion angle potentials of mean force for the various disaccharides and linkage types. (A) CH β1,3; (B) CH β1,4; (C) C4S β1,3; (D) C4S β1,4; (E) C6S β1,3; (F) C6S β1,4; (G) HA β1,3; and (H) HA β1,4. Contours of constant energy are drawn in increments of kBT above the minimum, denoted by a cross symbol. Conventional H-bond definitions are used for the glycosidic linkage torsion angles, φ and ψ (Appendix A).
Turning to the β1,3 linkages, the CH and C6S PMFs are similar because the sulfate group in C6S is located distal from the linkage region (compare Fig. 5, A and C). The PMF for CH is notably different from that of HA, however, which has a smaller minimum energy well (Fig. 4, A and G). The observed difference is a consequence of the different stereochemistry of the hydroxyl group at the C4 position in GlcNAc and GalNAc, which interacts with the ring oxygen on GlcUA via hydrogen bonding (Almond et al., 1997). The most significant difference in the β1,3 PMFs, however, is seen for C4S, in which the sulfate group is located proximal to the β1,3 linkage (Fig. 4 C). The sulfate group is capable of making direct van der Waals contact with the ring oxygen of the neighboring GlcUA residue, thereby significantly restricting the flexibility of the C4S β1,3 linkage with respect to CH and C6S (compare Fig. 5, A–C). The reduction in flexibility is illustrated by the considerable narrowing of the contour lines around the minimum energy point in Fig. 4 C relative to Fig. 4, A and E.
FIGURE 5.

Minimum free energy disaccharide conformations for (A) CH β1,3; (B) C4S β1,3; and (C) C6S β1,3 (images rendered using Visual Molecular Dynamics, version 1.8.2; Humphrey et al., 1996).
Characteristic ratio
The characteristic ratio, CN, is a standard measure of the effects of local chemical structure and bonded interactions on the overall dimensions of a polymer in its θ-state. It is defined as the dimensionless ratio of the mean-square unperturbed end-to-end distance of the real chain, 〈r2〉0, to the hypothetical mean-square end-to-end distance of an equivalent Gaussian chain,
 |
(7) |
where N is the number of bonds in the chain, bv is the root-mean-square bond length, and the subscript v denotes “virtual” because we utilize the conventional glycosidic oxygen-to-glycosidic oxygen virtual bond definition (Brant and Goebel, 1975; Cleland, 1971) in analyzing the conformation of GAGs in this study. Utilizing this definition, each virtual bond is rigid in the current model and spans a single monosaccharide (bv = 5.2 Å for monosaccharide units A, B, C, D, and E). The room temperature unperturbed state is achieved in the context of the current model by switching off all nonbonded interactions.
The dependence of CN on chain length is shown in Fig. 6 for up to 512 monosaccharides for CH, C4S, C6S, and HA. CN necessarily attains a limiting value at long chain lengths,  because it does not contain the effects of excluded volume (Table 1). The model predicts that CN is considerably larger for C4S than for the other GAGs, with a limiting value of C∞ that is ∼40% larger. There are two contributions to CN in the current model: the bonded backbone chemical structure and the glycosidic torsion PMFs. The fact that the bonded backbone chemical structures of the GAGs are highly similar (Supplementary Material, Table 2) suggests that it is the lack of flexibility present in the β1,3 PMF of C4S that leads to the observed differences. The effect on C∞ of the sulfate group at the C6 position of GalNAc in C6S is minor because of its distal location from the β1,3 and β1,4 linkage regions. Interestingly, the CN value of HA is similar to the CN values of CH and C6S, despite the notable differences in the β1,3 PMF of HA. This result is attributable to the fact that the flexibility of the β1,3 linkage of HA is similar to CH, unlike C4S. To ensure that the foregoing conclusions regarding CN are insensitive to our choice of virtual bonds, the preceding calculations were repeated using the n (= 3N) backbone virtual bonds of the coarse-grained model (Fig. 3). The results obtained were qualitatively similar, although clearly the numerical values of Cn were not equivalent to those of CN.
FIGURE 6.

Unperturbed characteristic ratios, CN, versus chain length for each GAG studied. Statistical error bars are smaller than the symbols.
TABLE 1.
Limiting GAG characteristic ratios, C∞, and intrinsic persistence lengths, a0
| GAG | C∞ | a0 (Å) |
|---|---|---|
| HA | 28 | 71 ± 3 |
| CH | 27 | 70 ± 4 |
| C4S | 38 | 96 ± 6 |
| C6S | 28 | 71 ± 4 |
Persistence length
The persistence length, a, of a polyelectrolyte may be decomposed into two contributions: intrinsic, a0, and electrostatic, ae. The value a0 is strictly defined to be equal to the persistence length of the polyelectrolyte in the limit of infinite ionic strength,  Like CN, a0 is attributable to the bonded chain structure and short-range nonelectrostatic interactions. As its name implies, ae is due to electrostatic interactions occurring along the backbone chain, which lead to additional stiffening of the backbone chain (Odijk, 1977; Skolnick and Fixman, 1977). The total persistence length may be computed “microscopically” from the chain structure using (Flory, 1988),
 |
(8) |
where b1 is the first (virtual) bond vector in the chain, b1 is its root-mean-square magnitude, and Ree is the end-to-end vector. For polymers in the θ-state, a0(=a) and CN both necessarily attain limiting values with increasing molecular weight due to the absence of excluded volume effects and are related in the high molecular weight limit by C∞ = (2a0/bv)−1, (Table 1). For polymers and polyelectrolytes that are not in the θ-state, however, long-range interactions will result in excluded volume effects that will cause a to increase with increasing molecular weight. This artifact leads to the observation of an apparent persistence length that is greater than the true persistence length, the latter of which is due solely to local interactions along the backbone chain. For this reason, it is important to exercise care in computing the persistence length of polymers that are not in the θ-state, such as the polyelectrolytes considered here at finite ionic strength.
For each GAG and ionic strength studied, a attains a plateau for L ≈ 4–6a (e.g., Fig. 7, CH), where L denotes the contour length, assumed to be 10 Å per disaccharide for each of the GAGs studied (the fully extended end-to-end distance results in contour lengths per disaccharide ranging from 9.1 to 9.5 Å, depending on the type of GAG; we employ 10 Å for simplicity and to be consistent with previous theoretical and experimental studies of HA, see Buhler and Boue, 2004; Cleland, 1971; Reed and Reed, 1992). This result is intuitive because for contour lengths on the order of several persistence lengths, the chain will remain relatively extended, ensuring that long-range interactions where the chain folds back on itself are absent. At the same time, the chain will be long enough so that tangent vector correlations with the first bond vector will have decayed to zero, ensuring a converged microscopic persistence length in Eq. 8.
FIGURE 7.

Chain length and ionic strength dependence of the microscopic persistence length, a, of CH (computed using Eq. 8). The functional dependence of a on chain length and ionic strength was qualitatively similar for C4S, C6S, and HA.
The following expressions were obtained by a least-squares fit of the data for persistence length versus ionic strength,
 |
(9) |
where a is in units of Å, cs is in mM, R2 > 0.99 for each fit, and persistence length data for N = 128 and 256 sugars were used for (HA, CH) and (C4S, C6S), respectively, because those lengths corresponded to the shortest chains for which a had reached a plateau, thereby minimizing the statistical error present in its estimated value.
As an alternative to the microscopic definition in Eq. 8, the persistence length may be inferred “macroscopically” from the mean-square radius of gyration using the wormlike chain model,
 |
(10) |
The macroscopic approach is the one typically taken experimentally because the radius of gyration is usually the relevant observable (e.g., scattering experiments). Solutions to Eq. 10 for HA and CH (128-sugars) and C4S and C6S (256 sugars) yield (R2 > 0.99),
 |
(11) |
Although the intrinsic persistence lengths and salt concentration exponents are similar in Eqs. 9 and 11, significant differences exist between the numerical prefactors multiplying the ionic strength-dependent terms.
Insight into the origin of these differences may be gained by examining the orientational correlation function, Ck ≡ 〈b1 · bk/|b1 ‖ bk|〉, which measures the rate of decay of (virtual) bond vector correlations along the backbone chain, and the first bond in the chain has been taken as the reference bond. The orientational correlation function for a continuous wormlike chain is defined to decay at a constant exponential rate,  where s denotes the contour length separating two tangent vectors—its discrete analog is the freely rotating chain, for which
Inspection of Ck for CH demonstrates that there are two distinct rates of decay for these GAGs (Fig. 8): a fast rate of decay that is short-ranged ( 15 bonds) and a slow rate of decay that is longer-ranged (>15 bonds). The microscopic persistence length in Eq. 8 is related to the orientational correlation function by
  and therefore inherently “averages” over these variable rates of decay to arrive at the persistence length. Alternatively, the macroscopic persistence length is obtained by employing the wormlike chain expression in Eq. 10, which assumes a constant exponential rate of decay in Ck. For these reasons, there is no a priori reason to expect that the two approaches to computing the persistence length will yield the same result. Indeed, different persistence length definitions have been shown to yield quantitatively different results for polyelectrolytes due to their non-wormlike behavior (Ullner, 2003; Ullner and Woodward, 2002). Although it is our view that the specific persistence length definition employed in the study of GAG structure is merely a matter of preference, based on the foregoing results the same definition should clearly be used when comparing experimental and theoretical persistence length results.
FIGURE 8.

Orientational correlation function for CH (128 sugars). The functional dependence of Ck on bond number (k) and ionic strength was qualitatively similar for C4S, C6S, and HA. Statistical error bars are omitted for clarity and the maximum absolute statistical error is 0.05.
Comparison with experiment and theory: Fully ionized conformation
Unlike the persistence length, the radius of gyration has been measured as a function of ionic strength by a number of groups and is therefore a useful quantity with which to validate the coarse-grained model. In Table 2, we compare the radius of gyration, s, of HA predicted by the coarse-grained model with experimental data obtained from light scattering (Esquenet and Buhler, 2002; Fouissac et al., 1992; Hayashi et al., 1995) and viscometry (Hayashi et al., 1995) (ionic strengths 0.01–0.5 M added monovalent salt and molecular weights 69–130 kDa). Although overall agreement between the theoretical and experimental results for HA is reasonable, there are considerable deviations that are as large as 30% in some cases. Upon closer inspection of the data, however, one notes that the model underpredicts s with respect to one set of data (Fouissac et al., 1992) and overpredicts s with respect to the second set (Hayashi et al., 1995). Indeed, a comparison of the data of Fouissac et al. (1992) with those of Hayashi et al. (1995) demonstrates that disagreement between the two studies is of the same order as the deviations present in our model predictions, rendering a rigorous comparison difficult, yet indicating consistency between the model and the range of experimental results.
TABLE 2.
Experimental and theoretical root-mean-square radius of gyration, s, for HA
| MW (kDa)
|
[NaCl] (M)
|
s (Å)
|
Difference (%)
|
||
|---|---|---|---|---|---|
| Experimental | Theoretical | Reference | |||
| 130 | 0.01 | 557 | 388 ± 12 | −30 | Fouissac et al. (1992) |
| 130 | 0.06 | 444 | 331 ± 12 | −26 | Fouissac et al. (1992) |
| 130 | 0.3 | 424 | 302 ± 15 | −29 | Fouissac et al. (1992) |
| 104 | 0.5 | 228 | 234 ± 10 | 3 | Hayashi et al. (1995) |
| 69 | 0.5 | 173 | 207 ± 10 | 20 | Hayashi et al. (1995) |
| 85 | 0.1 | 270 ± 20 | 250 ± 9 | −7 | Esquenet and Buhler (2002) |
Theoretical predictions of the root-mean-square end-to-end distance, r, for C4S and C6S are in good agreement with the only known experimental conformation data (Table 3), although r is somewhat overpredicted in the case of C4S. This casts some doubt on the relatively large characteristic ratio observed for that GAG, although additional experimental data are required to draw any firm conclusions in this regard.
TABLE 3.
Experimental and theoretical root-mean-square end-to-end distance, r, for C4S and C6S
| MW (kDa)
|
r (Å)
|
Difference (%)
|
||||
|---|---|---|---|---|---|---|
| GAG | [NaCl] | Experimental | Theoretical | Reference | ||
| C4S | 27 | 0.2 | 273 | 324 ± 25 | 19 | Tanaka (1978) |
| C6S | 44 | 0.2 | 408 | 396 ± 21 | −3 | Tanaka (1978) |
Additional comparison with experiment may be made for the intrinsic persistence length, which has been measured experimentally for HA by a number of groups. Values range from as low as 40 Å to as high as 90 Å in the quoted “high ionic strength limit” in those studies, which utilize ionic strengths of 0.1–1 M (Table 4). Although those values bracket the coarse-grained model prediction of 71 or 72 Å, depending on whether the microscopic or macroscopic approach to computing the persistence length is used, respectively, it is not strictly correct to compare those values directly. The reason is that at 0.1 M salt the electrostatic persistence length is still significant because the Debye length is ∼10 Å, the nearest-neighbor spacing between carboxylate groups on the backbone chain. If, instead, Eqs. 9 and 11 are employed, values are obtained that range from 82–111 Å and 85–119 Å, respectively, between 1–0.1 M. Thus, at the lower ionic strength of 0.1 M the model predicts the persistence length of HA to exceed somewhat the experimental value of 90 Å found by Buhler and Boue (2004), but it considerably overpredicts the lower estimates of 40 Å. Once again, a lack of consensus in the experimental literature renders a rigorous validation of the coarse-grained model difficult. However, the model results are certainly consistent with the available data.
TABLE 4.
HA experimental persistence lengths
| [NaCl] (M) | aexp (Å) | Experimental method | Reference |
|---|---|---|---|
| 0.2 | 40 | SAXS | Cleland (1977) |
| 0.5 | 40 | Viscometry | Cleland (1977) |
| 1.0 | 90 | Light scattering | Ghosh et al. (1990) |
| 0.3 | 80 | Light scattering | Fouissac et al. (1992) |
| 0.2 | 42 | Viscometry | Hayashi et al. (1995) |
| 0.5 | 41 | Viscometry, light scattering | Hayashi et al. (1995) |
| 0.1 | 90 | Neutron and light scattering | Buhler and Boue (2004) |
With regard to the electrostatic persistence length of polyelectrolytes, even after several decades of investigation there is still no consensus on its behavior (Everaers et al., 2002; Manghi and Netz, 2004; Ullner, 2003). For flexible polyelectrolytes such as those considered here, however, for which the intrinsic and electrostatic persistence lengths are of the same order (this is true for ionic strengths ≲0.1 M for the GAGs considered), theoretical studies have reported the electrostatic persistence length to be ∝ κ−1.2 (Ullner, 2003; Ullner et al., 1997; Ullner and Woodward, 2002), or in some cases, ∝ κ−1 (Reed and Reed, 1991), which has also been found experimentally by some groups (Ghosh et al., 1990; Reed et al., 1991). This is in contrast to the Odijk-Skolnick-Fixman scaling of κ−2, which applies to stiff polyelectrolytes for which ae ≪ a0 (Odijk, 1977; Skolnick and Fixman, 1977). The κ−1.2 dependence for flexible polyelectrolytes is in good agreement with the theoretical scalings presented in Eqs. 9 and 11, which range from ∝ κ−1.12 to κ−1.34. In contrast to the combined theoretical and experimental studies of Reed and Reed (1991) and Reed et al. (1991), however, we do not find ae ∝ ξ for ξ ≤ 1, as demonstrated by the prefactors in Eqs. 9 and 11. These prefactors increase by considerably more than a factor of 2 when the linear charge density is doubled in going from CH to C4S or C6S. Unfortunately, the source of this discrepancy is not known at the present time and merits further investigation.
Titration
Theoretical titration curves at physiological ionic strength (0.15 M NaCl) demonstrate the effect of changes in pH on α, the average degree of ionization of GlcUA in CH, C4S, and C6S (40 disaccharides each; see Fig. 9 A). As α increases, further dissociation becomes increasingly difficult due to unfavorable anionic–anionic electrostatic interactions, as demonstrated by the increasing shift in the apparent acidity, ΔpKapp ≡ pKapp − pKint (Fig. 9 B). ΔpKapp is significantly larger in C4S and C6S than in CH due to the presence of the sulfate groups in the former, which interact unfavorably with ionized carboxylate groups and shift the equilibrium toward the associated, or protonated, state. Interestingly, the titration behavior observed for the 4- and 6-sulfated forms of chondroitin are very similar, except for a very small shift of ∼0.04 pK units of C4S over C6S (Fig. 9 B). That difference has been confirmed using carboxylate-sulfate group radial distribution functions to be a result of the shorter mean first-neighbor distances present in C4S than in C6S (Bathe, 2004).
FIGURE 9.
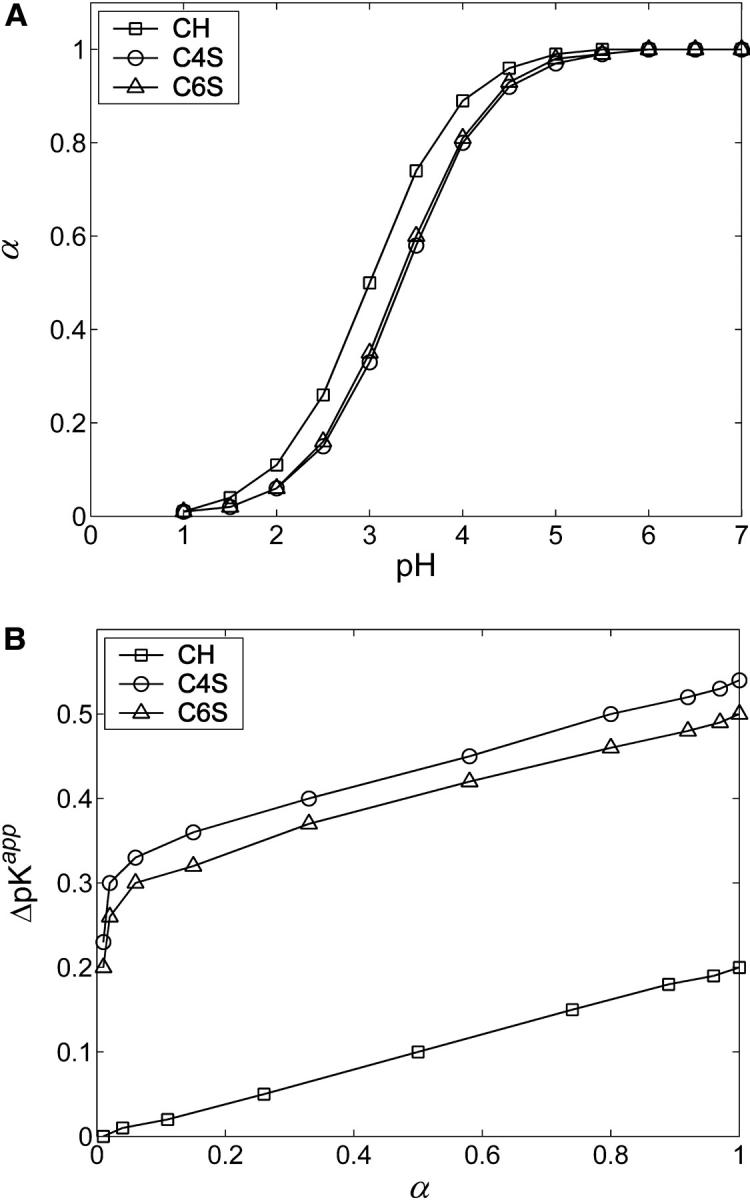
Theoretical titration curves of 40-disaccharide GAGs (CH, C4S, and C6S) at physiological ionic strength (0.15 M). Statistical error bars are smaller than the symbols.
For any given GAG type, the strength and range of electrostatic interactions between charged groups increase with decreasing ionic strength, shifting the titration curve toward lower α at all values of pH (Fig. 10). In contrast, at the highest ionic strength considered, 1 M, the Debye length is reduced to ∼3 Å, effectively screening even nearest-neighbor electrostatic interactions. In that limit, the titration curve nearly reproduces the Langmuir isotherm of GlcUA in HA or CH, with pKint = 2.9.
FIGURE 10.
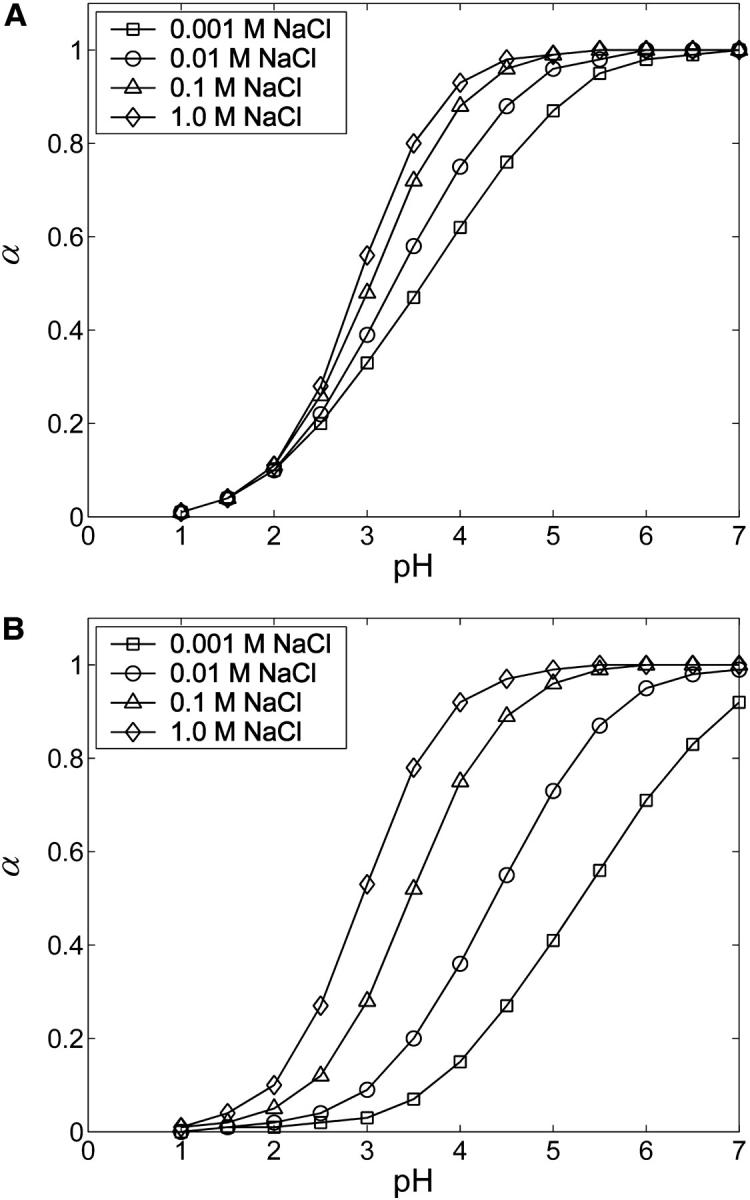
Ionic strength dependence of titration curves for (A) CH and (B) C4S. Statistical error bars are smaller than the symbols.
Effect of pH on conformation
In the limit of infinite ionic strength and with the LJ potential deactivated, GAG conformation is determined exclusively by the bonded structure and glycosidic PMFs because nonbonded interactions are absent. In that limit, the coarse-grained model predicts that pH does not affect GAG conformation, because the bonded PMFs were assumed to be independent of pH.
For finite ionic strengths, however, nonbonded electrostatic interactions are present and GAG conformation is affected by both ionic strength and pH, because ionic strength mediates the strength of electrostatic interactions and pH affects the protonation state of the carboxylate group on GlcUA. At any ionic strength, decreasing the pH from its physiological value of ≈7 causes the carboxylate groups' dissociation equilibrium to shift toward the protonated, or deionized state. A lower degree of ionization in turn affects GAG conformation by decreasing intramolecular electrostatic repulsion, which shifts the equilibrium conformational distribution of states to more compact conformations due to the disordering effects of entropy. Of course, the effects of pH on conformation are weaker for higher ionic strengths because electrostatic interactions are more highly screened in those cases.
The expansion factor of the root-mean-square end-to-end distance,  for CH (Fig. 11 A) and C4S (Fig. 11 B) demonstrates the aforementioned effects, where
  Å2 and
  Å2 for the 40-disaccharide CH and C4S considered, respectively. At the highest ionic strength of 1 M, the level of pH has only a minor effect on GAG conformation because electrostatic interactions are highly screened. Long-range nonbonded interactions are also absent because the contour length for the 40-disaccharide GAGs studied, L ∼400 Å, is only ∼6a0 for CH and 4a0 for C4S, implying that the chains adopt rather extended conformations. For this reason, CH and C4S retain their unperturbed conformation (αr = 1) at 1 M ionic strength for the values of pH examined. As the ionic strength is progressively lowered, however, GAG conformation is increasingly affected by pH, as anticipated. Interestingly, at the lowest ionic strength considered (0.001 M), αr reaches a plateau at high pH in the case of CH but not C4S, because in the latter, full ionization (α = 1) has not been achieved by pH = 7 (Fig. 10 B and Fig. 11 B).
FIGURE 11.
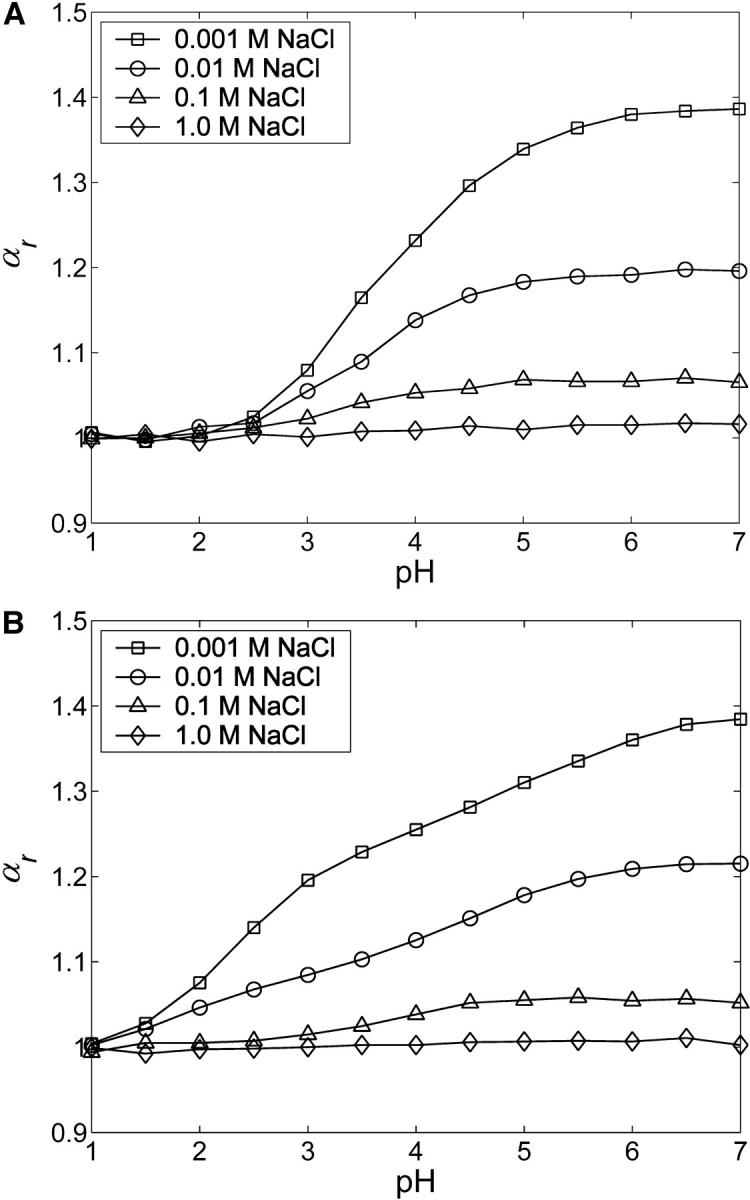
Dependence of the expansion factor, αr, on pH at different NaCl ionic strengths for 40-disaccharide (A) CH and (B) C4S. Statistical error bars are smaller than the symbols.
As a final point of interest, note that the expansion factor curves for C4S at different ionic strengths all converge to the same value at pH = 1, despite the fact that the sulfate groups remain fully ionized (Fig. 11 B). The physical reason for this observation is that at low pH the hydrogen ion and its complementary base contribute significantly to the Debye-Hückel screening. For example, at pH = 2 they contribute 0.01 M ionic strength and at pH = 1 they contribute 0.1 M. Thus, at pH = 1 the 0.001 M NaCl and 0.01 M NaCl curves actually have net ionic strengths of 0.101 M and 0.110 M, respectively, which leads to approximately the same Debye-Hückel screening and hence αr in Fig. 11 B.
Comparison with experiment: titration
Cleland et al. (1982) employed potentiometric titration (as well as various theoretical approaches, including a discrete site Monte Carlo model similar to the one developed here; Cleland, 1984) to study the titration properties of HA. He found that ΔpKapp depended linearly on α for ionic strengths >0.001 M, a result that is reproduced by the coarse-grained model (Bathe, 2004; see also Fig. 9 B). In Fig. 12, we compare the theoretically predicted slope of ΔpKapp versus α as a function of ionic strength for HA (80 sugars or 15 kDa, confirmed to represent the long chain limit for these results) with experimental data of Cleland et al. (1982) for 240 kDa HA.
FIGURE 12.

Slopes of experimental (Cleland et al., 1982) and coarse-grained model HA titration curves as a function of ionic strength.
Despite good overall agreement, the model tends to overpredict the experimental values at low ionic strengths and underpredict them at high ionic strength. The disagreement at low ionic strength may be attributed to the overestimation of electrostatic interactions by the Debye-Hückel potential, which is a linear theory that tends to underestimate the effects of counterion screening. Disagreement at high ionic strengths may also be attributed to error in the electrostatic energy function employed, but for different reasons. At high ionic strengths, only short-range electrostatic interactions contribute to ΔpKapp. The failure of the model to account for short length-scale molecular details such as the low dielectric and salt exclusion properties of the GAG domain thereby gain in importance, and are the likely source of discrepancy between the model and experiment in that regime.
Effect of steric interactions
The role of long-ranged, nonelectrostatic interactions (e.g., steric and hydrophobic) in determining equilibrium GAG properties will in general depend on GAG molecular weight and concentration, ionic strength, and pH. In previous theoretical investigations of GAG conformation (Reed and Reed, 1991) and titration (Reed and Reed, 1992) it was assumed that intra- and intermolecular electrostatic interactions dominated nonelectrostatic interactions, and they were therefore absent from the model used. Although good agreement with experiment was obtained in those studies, it is desirable to compare results obtained both with and without nonelectrostatic interactions to confirm that agreement was not serendipitous.
To test the effect of steric interactions on GAG conformation in this study, we turned on the repulsive LJ potential in the coarse-grained model and recalculated GAG conformation in the cases when it would be most affected by steric interactions. For the fully ionized model this corresponds to the GAG with the lowest charge density at the highest ionic strength and molecular weight considered, namely the 128-monosaccharide CH-GAG at 1 M ionic strength. Differences between the LJ-Debye-Hückel model and the Debye-Hückel-only model were less than 2, 3, and 4% for the radius of gyration, end-to-end distance, and microscopic persistence length, respectively. For the titration model, we recomputed the end-to-end distance for the 80-monosaccharide CH-GAG at 1 M NaCl as a function of pH with the LJ potential activated and found that even at a pH of 1, when α ≈ 0, its conformation was unaffected (<2% difference in r). The negligible effect of steric interactions on GAG conformation are attributed to the fact that the molecules considered remain relatively extended under these solvent conditions, excluding the possibility for long-range interactions where the chain folds back on itself.
These results justify the use of a purely electrostatic nonbonded interaction model for GAGs under the conditions examined in this study. Although stronger justification could be obtained by employing an attractive interaction potential to model hydrophobic and attractive van der Waals interactions, which would tend to perturb the conformation further from the LJ-Debye-Hückel case, an investigation of that sort is reserved for future work.
CONCLUSIONS AND OUTLOOK
A coarse-grained model is developed to enable the prediction of equilibrium solution properties of high molecular weight GAGs using molecular simulation. The model is used to investigate the conformation and titration behavior at infinite dilution of CH, C4S, C6S, and HA—GAGs that play a central role in determining the structure and biomechanical properties of the ECM of articular cartilage. Comparison with experimental radius of gyration, end-to-end distance, and titration data suggests that the model is quantitatively predictive as well as computationally efficient, despite the absence of any adjustable parameters.
Interestingly, 6-sulfation is found not to affect the intrinsic stiffness of CH, as measured by C∞, whereas 4-sulfation is found to have a considerable effect. This finding is attributed to the proximity of the sulfate group in C4S to the β1,3 linkage, where it sterically hinders linkage flexibility by interacting with the ring oxygen of GlcUA. In contrast, the sulfate group in C6S is distal from both the β1,3 and β1,4 linkages so that it does not significantly affect glycosidic linkage flexibility with respect to CH. Our finding for C4S is consistent with a recent study by Rodriguez-Carvajal et al. (2003) but our result for C6S is in contradiction with that work, in which C6S was found to be more flexible than CH. Additional theoretical investigations using an explicit-solvent model should be pursued to attempt to resolve this discrepancy.
Expressions for the true persistence lengths (i.e., in the absence of long-range excluded volume effects) of the GAGs as a function of ionic strength are presented, utilizing microscopic, bond vector-based, and macroscopic, wormlike chain-based definitions. Although the measures yield similar intrinsic persistence lengths and ionic strength dependencies for the electrostatic persistence length of each GAG, the prefactor multiplying the ionic strength in the latter exhibits significant differences. An analysis of bond vector correlation functions attributes this discrepancy to the non-wormlike chain behavior of the GAGs at short length scales.
GAG titration curves demonstrate that whereas sulfation considerably increases the apparent acidity of the carboxylate group present on GlcUA in CH, as previously observed by Cleland (1991) among others, different types of sulfation (C4 versus C6) do not exhibit significant differences in titration behavior. Finally, pH is found to have a pronounced effect on GAG conformation, particularly at ionic strengths <1 M, as expected due to the reduction of intramolecular electrostatic repulsion that is caused by protonation of GlcUA.
Although infinitely dilute GAG solution properties such as those studied here are of interest to cartilage biomechanics and biology, ultimately we are concerned with concentrated solutions of aggrecan, the predominant proteoglycan present in the ECM of articular cartilage. Toward that end, we are currently using the coarse-grained model to investigate the osmotic pressure and conformation of CS at physiological concentrations. Although aggrecan is of primary interest, we view the study of its chemical constituent GAGs as an important step toward a complete understanding of its emergent properties and characteristic attributes. Additionally, this hierarchical investigative approach enables the controlled, successive validation of the developed coarse-grained model under various solution conditions.
SUPPLEMENTARY MATERIAL
An online supplement to this article can be found by visiting BJ Online at http://www.biophysj.org.
Supplementary Material
Acknowledgments
Useful discussions with Dr. Anna Plaas are gratefully acknowledged.
We acknowledge funding from the Department of Defense in the form of a National Defense Science and Engineering Graduate Fellowship (to M.B.) and from the National Institutes of Health (No. GM065418 to B.T. and No. AR33236 to A.J.G.).
APPENDIX A
Two definitions for the glycosidic torsion angles are utilized in this study:
The conventional hydrogen bond definition, φH ≡ (H1–C1–O1–CJ′) and ψH ≡ (C1–O1–CJ′–HJ′), which is advocated by the IUPAC-IUB (Moss, 1971), where a prime denotes an atom belonging to the reducing sugar and J′ = 3′ or 4′ depending on the linkage type; and
A definition based on the virtual bonds in the coarse-grained model, namely φV ≡ (CI–C1–O1–CJ′) and ψV ≡ (C1–O1–CJ′–C1′), where I = 3 when J′ = 4′ and I = 4 when J′ = 3′.
To be consistent with convention we employ the first definition for the presentation of results from this point forward. To afford the most accurate mapping from the all-atom model to the coarse-grained model, however, we employed the virtual bond definition to define the coarse-grained model topology and the glycosidic torsion angle potentials of mean force. Glycosidic torsion angle results computed using the coarse-grained model may be subsequently transformed to the hydrogen bond definition for purposes of presentation using the following torsion angle offsets that were computed as ensemble averages from the all-atom disaccharide simulations: Δφ ≡ 〈φH〉 − 〈φV〉 and Δψ ≡ 〈ψH〉 − 〈ψV〉 (Table 5).
TABLE 5.
Offsets in hydrogen bond and virtual bond glycosidic torsion angle definitions
| Monosaccharide | Δφ (degrees) | Δψ (degrees) |
|---|---|---|
| GlcUA | 234.9 | 174.9 |
| GlcNAc | 175.5 | 126.9 |
| GalNAc | 174.4 | 126.1 |
| GalNAc4S | 174.7 | 125.3 |
| GalNAc6S | 174.5 | 126.3 |
References
- Akesson, T., and B. Jönsson. 1991. Monte Carlo simulations of colloidal stability: beyond the Poisson-Boltzmann approximation. Electrochim. Acta. 36:1723–1727. [Google Scholar]
- Almond, A., A. Brass, and J. K. Sheehan. 1998. Dynamic exchange between stabilized conformations predicted for hyaluronan tetrasaccharides: comparison of molecular dynamics simulations with available NMR data. Glycobiology. 8:973–980. [DOI] [PubMed] [Google Scholar]
- Almond, A., A. Brass, and J. K. Sheehan. 2000. Oligosaccharides as model systems for understanding water-biopolymer interaction: hydrated dynamics of a hyaluronan decamer. J. Phys. Chem. B. 104:5634–5640. [Google Scholar]
- Almond, A., J. K. Sheehan, and A. Brass. 1997. Molecular dynamics simulations of the two disaccharides of hyaluronan in aqueous solution. Glycobiology. 7:597–604. [DOI] [PubMed] [Google Scholar]
- Antosiewicz, J., J. M. Briggs, A. H. Elcock, M. K. Gilson, and J. A. McCammon. 1996. Computing ionization states of proteins with a detailed charge model. J. Comput. Chem. 17:1633–1644. [Google Scholar]
- Bashford, D., and M. Karplus. 1990. pKa's of ionizable groups in proteins—atomic detail from a continuum electrostatic model. Biochemistry. 29:10219–10225. [DOI] [PubMed] [Google Scholar]
- Bathe, M. 2004. Inverse Monte Carlo simulation of biomolecular conformation and coarse-grained molecular modeling of chondroitin sulfate conformation, titration, and osmotic pressure. Ph.D. thesis. Massachusetts Institute of Technology, Cambridge, MA.
- Bathe, M., A. J. Grodzinsky, B. Tidor, and G. C. Rutledge. 2004. Optimal linearized Poisson-Boltzmann theory applied to the simulation of flexible polyelectrolytes in solution. J. Chem. Phys. 121:7557–7561. [DOI] [PubMed] [Google Scholar]
- Bayliss, M. T., D. Osborne, S. Woodhouse, and C. Davidson. 1999. Sulfation of chondroitin sulfate in human articular cartilage—the effect of age, topographical position, and zone of cartilage on tissue composition. J. Biol. Chem. 274:15892–15900. [DOI] [PubMed] [Google Scholar]
- Beroza, P., D. R. Fredkin, M. Y. Okamura, and G. Feher. 1991. Protonation of interacting residues in a protein by a Monte Carlo method: application to lysozyme and the photosynthetic reaction center of Rhodobacter sphaeroides. Proc. Natl. Acad. Sci. USA. 88:5804–5808. [DOI] [PMC free article] [PubMed] [Google Scholar]
- Brant, D. A., and M. D. Christ. 1990. Realistic conformational modeling of carbohydrates. In Computer Modeling of Carbohydrate Molecules. A.D. French and J.W. Brady, editors. Washington, DC. 42–68.
- Brant, D. A., and K. D. Goebel. 1975. General treatment of configurational statistics of polysaccharides. Macromolecules. 8:522–530. [DOI] [PubMed] [Google Scholar]
- Brooks, B. R., R. E. Bruccoleri, B. D. Olafson, D. J. States, S. Swaminathan, and M. Karplus. 1983. CHARMM—a program for macromolecular energy, minimization, and dynamics calculations. J. Comput. Chem. 4:187–217. [Google Scholar]
- Buhler, E., and F. Boue. 2004. Chain persistence length and structure in hyaluronan solutions: ionic strength dependence for a model semirigid polyelectrolyte. Macromolecules. 37:1600–1610. [Google Scholar]
- Buschmann, M. D., and A. J. Grodzinsky. 1995. A molecular-model of proteoglycan-associated electrostatic forces in cartilage mechanics. J. Biomech. Eng. Trans. ASME. 117:179–192. [DOI] [PubMed] [Google Scholar]
- Cael, J. J., W. T. Winter, and S. Arnott. 1978. Calcium chondroitin 4-sulfate: molecular conformation and organization of polysaccharide chains in a proteoglycan. J. Mol. Biol. 125:21–42. [DOI] [PubMed] [Google Scholar]
- Cleland, R. L. 1971. Ionic polysaccharides. V. Conformational studies of hyaluronic acid, cellulose, and laminaran. Biopolymers. 10:1925–1948. [Google Scholar]
- Cleland, R. L. 1977. Persistence length of hyaluronic acid: estimate from small-angle x-ray scattering and intrinsic viscosity. Arch. Biochem. Biophys. 180:57–68. [DOI] [PubMed] [Google Scholar]
- Cleland, R. L. 1984. Theory of potentiometric titration of polyelectrolytes: a discrete-site model for hyaluronic acid. Macromolecules. 17:634–645. [Google Scholar]
- Cleland, R. L. 1991. Electrophoretic mobility of wormlike chains. I. Experiment: hyaluronate and chondroitin 4-sulfate. Macromolecules. 24:4386–4390. [Google Scholar]
- Cleland, R. L., J. L. Wang, and D. M. Detweiler. 1982. Polyelectrolyte properties of sodium hyaluronate. II. Potentiometric titration of hyaluronic acid. Macromolecules. 15:386–395. [Google Scholar]
- Couchman, J. R. 2003. Syndecans: proteoglycan regulators of cell-surface microdomains? Nat. Rev. Mol. Cell Biol. 4:926–937. [DOI] [PubMed] [Google Scholar]
- Cremer, D., and J. A. Pople. 1975. General definition of ring puckering coordinates. J. Am. Chem. Soc. 97:1354–1358. [Google Scholar]
- Deserno, M., C. Holm, and S. May. 2000. Fraction of condensed counterions around a charged rod: comparison of Poisson-Boltzmann theory and computer simulations. Macromolecules. 33:199–206. [Google Scholar]
- Deserno, M., and H. H. von Grünberg. 2002. Osmotic pressure of charged colloidal suspensions: a unified approach to linearized Poisson-Boltzmann theory. Phys. Rev. E. 66(1):art. no. 011401. [DOI] [PubMed]
- Doege, K. J., M. Sasaki, T. Kimura, and Y. Yamada. 1991. Complete coding sequence and deduced primary structure of the human cartilage large aggregating proteoglycan, aggrecan human-specific repeats, and additional alternatively spliced forms. J. Biol. Chem. 266:894–902. [PubMed] [Google Scholar]
- Esquenet, C., and E. Buhler. 2002. Aggregation behavior in semidilute rigid and semirigid polysaccharide solutions. Macromolecules. 35:3708–3716. [Google Scholar]
- Everaers, R., A. Milchev, and V. Yamakov. 2002. The electrostatic persistence length of polymers beyond the OSF limit. Eur. Phys. J. E. 8:3–14. [DOI] [PubMed] [Google Scholar]
- Flory, P. J. 1988. Statistical Mechanics of Chain Molecules. Oxford University Press, New York.
- Fouissac, E., M. Milas, M. Rinaudo, and R. Borsali. 1992. Influence of the ionic strength on the dimensions of sodium hyaluronate. Macromolecules. 25:5613–5617. [Google Scholar]
- Ghosh, S., L. Xiao, C. E. Reed, and W. F. Reed. 1990. Apparent persistence lengths and diffusion behavior of high molecular weight hyaluronate. Biopolymers. 30:1101–1112. [Google Scholar]
- Hardingham, T. 1998. Chondroitin sulfate and joint disease. Osteoarthritis Cartilage. 6:3–5. [DOI] [PubMed] [Google Scholar]
- Hascall, V. C., and G. K. Hascall. 1981. Proteoglycans. In Cell Biology of Extracellular Matrix. Plenum Press, New York. 39–63.
- Hayashi, K., K. Tsutsumi, F. Nakajima, T. Norisuye, and A. Teramoto. 1995. Chain stiffness and excluded volume effects in solutions of sodium hyaluronate at high ionic strength. Macromolecules. 28:3824–3830. [Google Scholar]
- Hill, T. L. 1956. Titration curves and ion binding on proteins, nucleic acids, and other macromolecules with a random distribution of binding sites of several types. J. Am. Chem. Soc. 78:5527–5529. [Google Scholar]
- Humphrey, W., A. Dalke, and K. Schulten. 1996. VMD: visual molecular dynamics. J. Mol. Graph. 14:33–38. [DOI] [PubMed] [Google Scholar]
- Iozzo, R. V. 1998. Matrix proteoglycans: from molecular design to cellular function. Annu. Rev. Biochem. 67:609–652. [DOI] [PubMed] [Google Scholar]
- Jönsson, B., M. Ullner, C. Peterson, O. Sommelius, and B. Söderberg. 1996. Titrating polyelectrolytes—variational calculations and Monte Carlo simulations. J. Phys. Chem. 100:409–417. [Google Scholar]
- Kundrotas, P. J., and A. Karshikoff. 2002. Model for calculation of electrostatic interactions in unfolded proteins. Phys. Rev. E. 6501(1):art. no.-011901. [DOI] [PubMed]
- Lal, M. 1969. Monte Carlo computer simulation of chain molecules. I. Mol. Phys. 17:57–64. [Google Scholar]
- Lewis, S., M. Crossman, J. Flannelly, C. Belcher, M. Doherty, M. T. Bayliss, and R. M. Mason. 1999. Chondroitin sulphation patterns in synovial fluid in osteoarthritis subsets. Ann. Rheum. Dis. 58:441–445. [DOI] [PMC free article] [PubMed] [Google Scholar]
- Madras, N., and A. D. Sokal. 1988. The pivot algorithm: a highly efficient Monte Carlo method for the self-avoiding walk. J. Stat. Phys. 50:109–186. [Google Scholar]
- Manghi, M., and R. R. Netz. 2004. Variational theory for a single polyelectrolyte chain revisited. Eur. Phys. J. E. 14:67–77. [DOI] [PubMed] [Google Scholar]
- Manning, G. S. 1969. Limiting laws and counterion condensation in polyelectrolyte solutions. I. Colligative properties. J. Chem. Phys. 51:924–930. [Google Scholar]
- Maroudas, A. 1976. Balance between swelling pressure and collagen tension in normal and degenerate cartilage. Nature. 260:808–809. [DOI] [PubMed] [Google Scholar]
- Morgenstern, D. A., R. A. Asher, and J. W. Fawcett. 2002. Chondroitin sulphate proteoglycans in the CNS injury response. In Spinal Cord Trauma: Regeneration, Neural Repair and Functional Recovery. Elsevier, Dordrecht, The Netherlands. 313–332. [DOI] [PubMed]
- Moss, G. P. 1971. Nomenclature, IUPAC-IUB. Arch. Biochem. Biophys. 145:405–436. [Google Scholar]
- Nakato, H., and K. Kimata. 2002. Heparan sulfate fine structure and specificity of proteoglycan functions. Biochim. Biophys. Acta. 1573:312–318. [DOI] [PubMed] [Google Scholar]
- Ng, L., A. J. Grodzinsky, P. Patwari, J. Sandy, A. Plaas, and C. Ortiz. 2003. Individual cartilage aggrecan macromolecules and their constituent glycosaminoglycans visualized via atomic force microscopy. J. Struct. Biol. 143:242–257. [DOI] [PubMed] [Google Scholar]
- Odijk, T. 1977. Polyelectrolytes near rod limit. J. Polym. Sci. Part Polym. Phys. 15:477–483. [Google Scholar]
- Perico, A., M. Mormino, R. Urbani, A. Cesaro, E. Tylianakis, P. Dais, and D. A. Brant. 1999. Local dynamics of carbohydrates. I. Dynamics of simple glycans with different chain linkages. J. Phys. Chem. B. 103:8162–8171. [Google Scholar]
- Plaas, A. H. K., L. A. West, S. Wong-Palms, and F. R. T. Nelson. 1998. Glycosaminoglycan sulfation in human osteoarthritis: disease-related alterations at the nonreducing termini of chondroitin and dermatan sulfate. J. Biol. Chem. 273:12642–12649. [DOI] [PubMed] [Google Scholar]
- Plaas, A. H. K., S. Wong-Palms, P. J. Roughley, R. J. Midura, and V. C. Hascall. 1997. Chemical and immunological assay of the nonreducing terminal residues of chondroitin sulfate from human aggrecan. J. Biol. Chem. 272:20603–20610. [DOI] [PubMed] [Google Scholar]
- Platt, D., J. L. E. Bird, and M. T. Bayliss. 1998. Ageing of equine articular cartilage: structure and composition of aggrecan and decorin. Equine Vet. J. 30:43–52. [DOI] [PubMed] [Google Scholar]
- Qiu, D., P. S. Shenkin, F. P. Hollinger, and W. C. Still. 1997. The GB/SA continuum model for solvation. A fast analytical method for the calculation of approximate Born radii. J. Phys. Chem. A. 101:3005–3014. [Google Scholar]
- Rauch, U., K. Feng, and X. H. Zhou. 2001. Neurocan: a brain chondroitin sulfate proteoglycan. Cell. Mol. Life Sci. 58:1842–1856. [DOI] [PMC free article] [PubMed] [Google Scholar]
- Reed, C. E., and W. F. Reed. 1991. Monte Carlo electrostatic persistence lengths compared with experiment and theory. J. Chem. Phys. 94:8479–8486. [Google Scholar]
- Reed, C. E., and W. F. Reed. 1992. Monte Carlo study of titration of linear polyelectrolytes. J. Chem. Phys. 96:1609–1620. [Google Scholar]
- Reed, W. F., S. Ghosh, G. Medjahdi, and J. Francois. 1991. Dependence of polyelectrolyte apparent persistence lengths, viscosity, and diffusion on ionic strength and linear charge density. Macromolecules. 24:6189–6198. [Google Scholar]
- Rodriguez-Carvajal, M. A., A. Imberty, and S. Perez. 2003. Conformational behavior of chondroitin and chondroitin sulfate in relation to their physical properties as inferred by molecular modeling. Biopolymers. 69:15–28. [DOI] [PubMed] [Google Scholar]
- Roughley, P. J., and E. R. Lee. 1994. Cartilage proteoglycans—structure and potential functions. Microsc. Res. Tech. 28:385–397. [DOI] [PubMed] [Google Scholar]
- Sassi, A. P., S. Beltran, H. H. Hooper, H. W. Blanch, J. Prausnitz, and R. A. Siegel. 1992. Monte Carlo simulations of hydrophobic weak polyelectrolytes: titration properties and pH-induced structural transitions for polymers containing weak electrolytes. J. Chem. Phys. 97:8767–8774. [Google Scholar]
- Sauerland, K., A. H. K. Plaas, R. X. Raiss, and J. Steinmeyer. 2003. The sulfation pattern of chondroitin sulfate from articular cartilage explants in response to mechanical loading. Biochim. Biophys. Acta. 1638:241–248. [DOI] [PubMed] [Google Scholar]
- Schaefer, M., and M. Karplus. 1996. A comprehensive analytical treatment of continuum electrostatics. J. Phys. Chem. 100:1578–1599. [Google Scholar]
- Selva, E. M., and N. Perrimon. 2001. Role of heparan sulfate proteoglycans in cell signaling and cancer. Adv. Cancer Res. 83:67–80. [DOI] [PubMed] [Google Scholar]
- Sheehan, J. K., and E. D. T. Atkins. 1983. X-ray fiber diffraction study of conformational changes in hyaluronate induced in the presence of sodium, potassium and calcium cations. Int. J. Biol. Macromol. 5:215–221. [Google Scholar]
- Skolnick, J., and M. Fixman. 1977. Electrostatic persistence length of a wormlike polyelectrolyte. Macromolecules. 10:944–948. [Google Scholar]
- Skolnick, J., and M. Fixman. 1978. Charge interactions in cylindrical polyelectrolytes. Macromolecules. 11:867–871. [Google Scholar]
- Stallcup, W. B. 2002. The NG2 proteoglycan: past insights and future prospects. J. Neurocytol. 31:423–435. [DOI] [PubMed] [Google Scholar]
- Still, W. C., A. Tempczyk, R. C. Hawley, and T. Hendrickson. 1990. Semianalytical treatment of solvation for molecular mechanics and dynamics. J. Am. Chem. Soc. 112:6127–6129. [Google Scholar]
- Svensson, B., B. Jönsson, and C. E. Woodward. 1990. Monte Carlo simulations of an electric double-layer. J. Phys. Chem. 94:2105–2113. [Google Scholar]
- Tanaka, K. 1978. Physicochemical properties of chondroitin sulfate. II. Molecular weight dependence of intrinsic viscosity and sedimentation coefficient, and analysis as a semi-flexible coil. J. Biochem. (Tokyo). 83:655–659. [DOI] [PubMed] [Google Scholar]
- Tanford, C. 1957. Theory of protein titration curves. II. Calculations for simple models at low ionic strength. J. Am. Chem. Soc. 79:5340–5347. [Google Scholar]
- Tanford, C., and J. G. Kirkwood. 1957. Theory of protein titration curves. I. General equations for impenetrable spheres. J. Am. Chem. Soc. 79:5333–5339. [Google Scholar]
- Tang, J. X., S. E. Wong, P. T. Tran, and P. A. Janmey. 1996. Counterion-induced bundle formation of rodlike polyelectrolytes. Phys. Chem. Chem. Phys. 100:796–806. [Google Scholar]
- Tschöp, W., K. Kremer, J. Batoulis, T. Burger, and O. Hahn. 1998. Simulation of polymer melts. I. Coarse-graining procedure for polycarbonates. Acta Polymerica. 49:61–74. [Google Scholar]
- Ullner, M. 2003. Comments on the scaling behavior of flexible polyelectrolytes within the Debye-Hückel approximation. J. Phys. Chem. B. 107:8097–8110. [Google Scholar]
- Ullner, M., and B. Jönsson. 1996. A Monte Carlo study of titrating polyelectrolytes in the presence of salt. Macromolecules. 29:6645–6655. [Google Scholar]
- Ullner, M., B. Jönsson, C. Peterson, O. Sommelius, and B. Söderberg. 1997. The electrostatic persistence length calculated from Monte Carlo, variational and perturbation methods. J. Chem. Phys. 107:1279–1287. [Google Scholar]
- Ullner, M., and C. E. Woodward. 2000. Simulations of the titration of linear polyelectrolytes with explicit simple ions: comparisons with screened Coulomb models and experiments. Macromolecules. 33:7144–7156. [Google Scholar]
- Ullner, M., and C. E. Woodward. 2002. Orientational correlation function and persistence lengths of flexible polyelectrolytes. Macromolecules. 35:1437–1445. [Google Scholar]
- Watanabe, H., Y. Yamada, and K. Kimata. 1998. Roles of aggrecan, a large chondroitin sulfate proteoglycan, in cartilage structure and function. J. Biochem. (Tokyo). 124:687–693. [DOI] [PubMed] [Google Scholar]
- Wight, T. N., and M. J. Merrilees. 2004. Proteoglycans in atherosclerosis and restenosis—key roles for versican. Circ. Res. 94:1158–1167. [DOI] [PubMed] [Google Scholar]
- Winter, W. T., and S. Arnott. 1977. Hyaluronic acid: role of divalent cations in conformation and packing. J. Mol. Biol. 117:761–784. [DOI] [PubMed] [Google Scholar]
- Yang, A. S., M. R. Gunner, R. Sampogna, K. Sharp, and B. Honig. 1993. On the calculation of pKas in proteins. Proteins Struct. Funct. Genetics. 15:252–265. [DOI] [PubMed] [Google Scholar]
- Yoneda, A., and J. R. Couchman. 2003. Regulation of cytoskeletal organization by syndecan transmembrane proteoglycans. Matrix Biol. 22:25–33. [DOI] [PubMed] [Google Scholar]
Associated Data
This section collects any data citations, data availability statements, or supplementary materials included in this article.