

Abstract
Proton binding plays a critical role in protein structure and function. We report pKa calculations for three aspartates in two proteins, using a linear response approach, as well as a “standard” Poisson-Boltzmann approach. Averaging over conformations from the two endpoints of the proton-binding reaction, the protein's atomic degrees of freedom are explicitly modeled. Treating macroscopically the protein's electronic polarizability and the solvent, a meaningful model is obtained, without adjustable parameters. It reproduces qualitatively the electrostatic potentials, proton-binding free energies, Marcus reorganization free energies, and pKa shifts from explicit solvent molecular dynamics simulations, and the pKa shifts from experiment. For thioredoxin Asp-26, which has a large pKa upshift, we correctly capture the balance between unfavorable carboxylate desolvation and favorable interactions with a nearby lysine; similarly for RNase A Asp-14, which has a large pKa downshift. For the unshifted thioredoxin Asp-20, desolvation by the protein cavity is overestimated by 2.9 pKa units; several effects could explain this. “Standard” Poisson-Boltzmann methods sidestep this problem by using a large, ad hoc protein dielectric; but protein charge-charge interactions are then incorrectly downscaled, giving an unbalanced description of the reaction and a large error for the shifted pKa values of Asp-26 and Asp-14.
INTRODUCTION
The accurate determination of amino acid pKa values in proteins is of fundamental interest in biophysical chemistry. Knowledge of the pKa values of residues in the active site of an enzyme helps identify potential proton donors and acceptors, and contributes to our understanding of the reaction mechanism (Warshel, 1981; Raquet et al., 1997; Nielsen and McCammon, 2003). The stability of proteins (Yang and Honig, 1993; Swietnicki et al., 1997; Schaefer and Karplus, 1997; van Vlijmen et al., 1998; Morikis et al., 2001) and protein-ligand complexes (Mackerell et al., 1995) depends on the ionization state of titratable residues. pKa and redox potential shifts provide information on the strength of electrostatic interactions in the protein interior (Sternberg et al., 1987; Varadarajan et al., 1989). Furthermore, theoretical calculations of protein properties often depend strongly on assumptions about the ionization state of titratable groups (Simonson, 2003).
The ionization state of titratable amino acids in solution is known from experiment. However, in a folded protein, the pKa values can be shifted with respect to the solution values. The shifts are caused by a combination of factors, including the loss of interactions with the aqueous environment, interactions with the protein's charged and polar groups, and structural reorganization of the protein in response to proton binding (Warshel, 1987; Sham et al., 1997; Schutz and Warshel, 2001; Simonson et al., 1999, 2004). These factors compete with each other, making it difficult to predict the direction and magnitude of a particular pKa shift.
Theoretical methods to calculate protein pKa values have been the focus of considerable efforts in the past two decades (Warshel, 1981, 1987; Warshel et al., 1984; Warshel and Russell, 1985; Bashford and Karplus, 1990; Gilson, 1993; Yang and Honig, 1993; Antosiewicz et al., 1996; Beroza and Case, 1996; Schaefer and Karplus, 1997; Schaefer et al., 1998; Sham et al., 1997; Mehler and Guarnieri, 1999; Georgescu et al., 2002; Nielsen and McCammon, 2003; Simonson et al., 2004; Warwicker, 1999, 2004). Several models that use very different assumptions (including a “null” model) have had a roughly comparable success, so that the underlying physics remains partly unclear and controversial. A widely used approach treats the protein as a low-dielectric cavity immersed in a high-dielectric solvent, and determines the electrostatic free energy at various ionization states by solving the Poisson-Boltzmann (PB) equation (Warwicker and Watson, 1982; Davis and McCammon, 1990; Honig and Nicholls, 1995). In applications of these models to pKa calculations, it is customary to treat the protein dielectric constant as an adjustable parameter, which accounts for protein structural reorganization upon a change in the ionization state (proton binding or release), as well as for nonelectrostatic effects such as van der Waals interactions, or the change in the protein conformational entropy upon proton binding. The meaning of the protein dielectric constant and many of the approximations involved in continuum electrostatic calculations have been discussed in detail (Fröhlich, 1949; Warshel et al., 1984; Sham et al., 1997, 1998; Schutz and Warshel, 2001; Simonson, 2003; Simonson and Perahia, 1995a; Simonson et al., 1999; Smith et al., 1993; Krishtalik et al., 1997; Nakamura, 1996). A difficulty is the consistent parameterization of these models. For example, most current implementations use molecular mechanics charge sets, which have been painstakingly parameterized to reproduce equilibrium electrostatic potentials in combination with a protein dielectric constant of 1 (Cornell et al., 1995; Jorgensen and Tirado-Rives, 1988; Mackerell et al., 1998). This can pose a problem for pKa calculations in which protein reorganization plays a large role. The reorganization requires a protein dielectric significantly >1 (Fröhlich, 1949; Sham et al., 1997; Smith et al., 1993; Simonson and Perahia, 1995a; Simonson et al., 1999), which is then inconsistent with the charge set.
The idea of estimating pKa values by a linear response approximation (LRA), using structures corresponding to the states before and after ionization, was proposed by Warshel (Lee et al., 1992, 1993; Sham et al., 1997). In this work, we analyze several proton-binding reactions with a simple, LRA method, which combines molecular dynamics simulations with continuum electrostatics. Our method is equivalent to the LRA method of Warshel, in that it expresses the protonation free energy as an electrostatic interaction energy between the inserted charge and the permanent and induced charges of the system, averaged over the equilibrium states before and after proton binding (see Eq. 7). The LRA expression (Eq. 7) is derived from a two-step decomposition of the charge insertion free energy, introduced originally by Marcus (1956) in the context of electron transfer theory, and applied recently to study dielectric relaxation in the enzyme aspartyl-tRNA synthetase (Simonson et al., 1999; Archontis and Simonson, 2001). The solvent and the electronic polarization of the protein are treated by a dielectric continuum model (Warwicker and Watson, 1982), whereas the atomic reorganization of the protein is described explicitly, by averaging explicitly over conformations that are representative of the two endpoint states (Lee et al., 1992, 1993; Sham et al., 1997; Aqvist et al., 2002). We refer to the method used in this work as PB/LRA. Closely related linear response methods for free-energy calculations have been introduced in the past (Del Buono et al., 1994; Aqvist et al., 2002), and have been used successfully to calculate binding free energies in several receptor-ligand systems (Aqvist, 1991; Aqvist et al., 2002; Florian et al., 2002, 2003; Jorgensen, 2004). This PB/LRA method was also employed by Eberini et al. for pKa calculations in apo- and holo-β-lactoglobulin (Eberini et al., 2004) (see below).
The optimum protein dielectric constant for continuum pKa calculations depends on the details of the model. In particular, it depends on which microscopic effects are represented explicitly and which are represented implicitly (Fröhlich, 1949; Lee et al., 1992, 1993; Sham et al., 1997; Schutz and Warshel, 2001; Simonson, 2003; Simonson and Perahia, 1995a; Eberini et al., 2004; Krishtalik et al., 1997). By averaging over the two protein states before and after protonation, we account explicitly for the atomic rearrangements in response to proton binding. As a result, we expect the best results to be obtained with a protein dielectric εp = 1 or 2, depending on whether electronic polarization is considered explicitly or not (Fröhlich, 1949). Despite this expectation, a larger dielectric constant may still be needed. Eberini et al. employed the PB/LRA method and a continuum model to calculate the pKa of a Glu residue in apo- and holo-β-lactoglobulin (Eberini et al., 2004). Even though the protein relaxation was explicitly accounted for by averaging over the end states, it was found that εp ≈ 8 was needed to reproduce the experimental pKa. Proton binding to this particular Glu was associated with large conformational rearrangements in the apo form of the enzyme and changes in the solvent exposure of the titratable Glu. The authors speculated that the high dielectric constant might compensate for limited sampling of the protein conformations in the two end states and/or deviations from linear response. In the work presented here, atomic reorganization of the protein is modeled explicitly, whereas electronic polarization is modeled implicitly. The best results are indeed obtained with a protein dielectric εp of 1 or 2.
We use the PB/LRA method to compute the pKa shifts of three carboxylates in two proteins. Two of the carboxylates correspond to interior residues, with high pKa shifts; Asp-26 in thioredoxin, with a large pKa of 7.5 (Langstemo et al., 1991) and Asp-14 in ribonuclease A, with a low pKa of 2.0 (Forsyth et al., 2002). As discussed by Warshel (Schutz and Warshel, 2001), such interior residues represent the proper benchmarks to test the accuracy of a pKa calculation. The third carboxylate is the solvent-exposed Asp-20 in thioredoxin, with an unshifted pKa of 4.0 (Forsyth et al., 2002). The chosen residues titrate approximately independently of surrounding ionizable groups; i.e., the ionization state of the other groups can be assumed fixed whereas the carboxylate under study binds a proton at a pH close to its pKa (Dillet et al., 1998; Simonson et al., 2004); this simplifies the analysis.
The results are compared to experiment and to a recent calculation of the same pKa shifts by molecular dynamics free energy (MDFE) simulations in explicit solvent (Simonson et al., 2004). Importantly, the comparison to MDFE includes the electrostatic potentials, the reorganization free energies, the protonation free energies, and the pKa shifts. Semiquantitative agreement with MDFE and with the experimental pKa shifts is obtained using a low, physically reasonable value of the protein dielectric constant (1 or 2). In two out of three cases, the method actually yields better agreement with experiment than do the MDFE simulations (Simonson et al., 2004), probably because of a superior treatment of electronic polarizability. Agreement with experiment is rather poor for the unshifted Asp-20 case. Nevertheless, in all three cases, the method yields insights into the mechanisms that determine the pKa.
A detailed group decomposition of the free energy is used to identify important contributions to the pKa shifts. We also compute the reorganization, or relaxation free energies in response to ionization (the second step in the Marcus free-energy decomposition) (Marcus, 1956; Krishtalik et al., 1997; Sharp, 1998; Simonson et al., 1999; Archontis and Simonson, 2001), even though they are not needed to calculate the pKa values. The relaxation free energy and the total free energy are linked (Simonson et al., 1999), so that the relaxation data place a constraint on the protein dielectric constant that can be used in a physically meaningful way for the pKa values. This reduces our reliance on fitting to the experimental data and makes the model more predictive. We show that, although the pKa values are best calculated with a protein dielectric of 1 or 2, the protein reorganization free energy is reproduced using a protein dielectric of 2–8. This difference is not surprising, because the present pKa calculations model the protein atomic reorganization explicitly, whereas the reorganization calculations model it implicitly. This result also agrees with our earlier studies (Simonson et al., 1999; Archontis and Simonson, 2001) and those of Krishtalik et al. (1997).
We also compare our results to a “standard” PB protocol that uses a single protein endpoint structure (Bashford and Karplus, 1990; Yang and Honig, 1993; Antosiewicz et al., 1996; Raquet et al., 1997; Warwicker, 1999, 2004). Because it does not include the protein relaxation explicitly, the “standard” method yields pKa shifts that depend strongly on the structural model assumed for the protein. When a low dielectric value is used for the protein (εp = 2–4), the method fails in all three carboxylate calculations. When the protein dielectric is increased to εp ≈ 20, the “standard” method yields pKa shifts in reasonable agreement with experiment for two cases, thanks to a fortunate compensation of errors, even though this high dielectric value is shown to be unphysical for these systems.
The following two sections present the theoretical derivation of the PB/LRA method and the details of the numerical calculations. Results are presented next; the last section is a discussion.
THEORY
Proton binding as a charge insertion process
The quantity of interest is the double free-energy difference ΔΔG between the protonation free energies when the side chain is part of the protein, and when the same chemical group is alone in aqueous solution (Warshel, 1981, 1987; Bashford and Karplus, 1990). ΔΔG is proportional to the difference between the pKa of the side chain in the protein, pKa,prot, and that of the chemical group in solution, pKa,model:
 |
(1) |
where q is the charge of the ionized form of the titratable residue. The proton binding is modeled in this work as the insertion of a set of point charges {Δqi} onto selected aspartate side-chain atoms (Warshel, 1987; Bashford and Karplus, 1990). The compound employed as a model of the chemical group in solution is an aspartic acid molecule with N-acetyl and N-methylamide blocking groups (Fig. 1 A). Its pKa is known experimentally to be ∼4. We denote by “AspH”/“Asp” the protonated/unprotonated states and by “midpoint” the fictitious intermediate state where the Asp carboxylate carries a net charge of −1/2. The partial charges used for each charge state are shown in Fig. 1.
FIGURE 1.
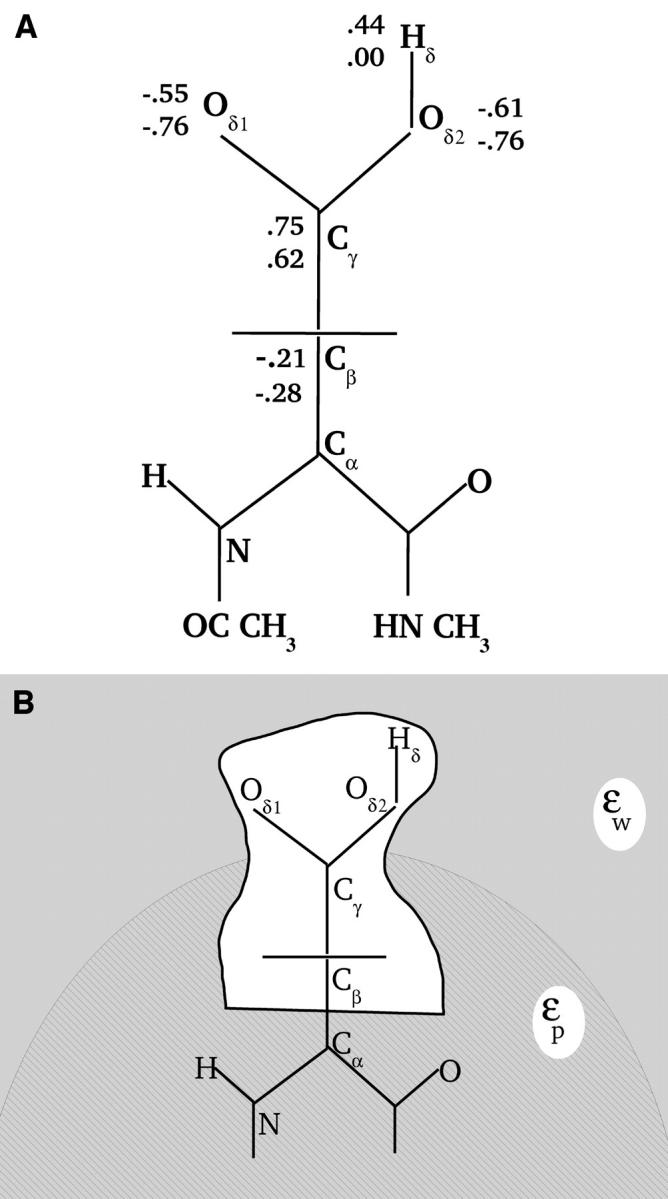
(A) Schematic representation of the model compound (2N-acetyl-1N-methyl-aspartic acid 1-amide), showing the partial charges at the ionized (bottom values) and protonated state (top values). Charges unaffected by ionization are not shown. (B) Schematic view of the titrating side chain, surrounded by the protein (hatched) and solvent (shaded) dielectric media. Fragment A corresponds to the inner, white region (see “Decomposing the free energy into two components”).
In the continuum dielectric framework used here, both the protein and the surrounding aqueous solution will be treated as uniform dielectric media. The titratable side chain, however, is treated as a cavity (Fig. 1 B). This is consistent with our earlier work (Simonson et al., 1999; Archontis and Simonson, 2001; Hoefinger and Simonson, 2001) and with the continuum models commonly used in quantum chemistry (Cramer and Truhlar, 1999). It differs from the usual continuum approach, which embeds the side chain directly within the protein dielectric. A side-chain cavity is essential to obtain reasonable values for the protonation free energy (as compared to MDFE for example). However, it has a rather small effect on the double free-energy difference ΔΔG between protein and model compound, which is the experimentally relevant quantity. Indeed, the cavity contributions largely cancel when the model compound result is subtracted, so that this treatment gives a similar result for ΔΔG to the usual, “embedded side-chain” approach.
Decomposing the free energy into two components
In the context of electron transfer theory, Marcus introduced a decomposition of the charging free energy (Marcus, 1964) that is physically illuminating and leads to a practical method for pKa calculation (Sham et al., 1997). The transformation of the system from its initial, “reactant” state to its final, “product” state can be decomposed into a “static” and a “relaxation” step (Fig. 2) (Marcus, 1956). The free-energy change ΔG can be written
 |
(2) |
where  and
and  are the static and relaxation free energies, and the superscript designates the starting, reactant state. In the case where a single point charge is inserted at a position “0”, the static term
  is given by
 |
(3) |
where  is the equilibrium electrostatic potential at the insertion site “0” in the reactant state.
FIGURE 2.

Schematic representation of the reactant and product free-energy surfaces, showing the Marcus two-step reaction pathway. The curves shown correspond to the Asp-20 free-energy components, obtained with  (static) and
  (relaxation).
The reverse transformation can be carried out by inserting the charge −q into the “product state” at the same site. The corresponding free-energy change ΔG′ can be written
 |
(4) |
with
 |
(5) |
The continuum model is almost always assumed to be linear (Marcus, 1964; Bashford and Karplus, 1990; Honig and Nicholls, 1995; Roux and Simonson, 1999). Under this assumption, the relaxation free energy is the same in the reactant and product states (Sham et al., 1997; Simonson et al., 1999; Simonson, 2002):
 |
(6) |
Combining Eqs. 2, 4, and 6, we obtain for the total free-energy change:
 |
(7) |
Equation 7 is identical to the linear response approximation method of Warshel (Lee et al., 1992, 1993), and is the basis of the linear interaction energy method of Aqvist (e.g., Eq. 3 of Aqvist et al., 2002). It shows that the total electrostatic free-energy change can be calculated by averaging the interaction energies between the inserted charge and the permanent and induced charges of the reactant and product states. It has been used for pKa calculations in several proteins (Sham et al., 1997; Eberini et al., 2004), and for binding free-energy calculations in several receptor-ligand systems (Aqvist, 1991; Florian et al., 2002, 2003; Jorgensen, 2004). In earlier work, we used it to study dielectric relaxation in response to charge insertion in the active site of the enzyme aspartyl-tRNA synthetase (Simonson et al., 1999; Archontis and Simonson, 2001).
Under the linear response approximation, the average of the reactant and product static terms in Eq. 7 is exactly equal to the static term of the fictitious “midpoint” state, in which a charge of q/2 has been introduced. Thus, we can write
 |
(8) |
Generalizing these results to the insertion of several charges is straightforward (see, e.g., Simonson et al., 1999 for details). The charges are inserted onto a set of atoms that constitute a chemical fragment “A”. Denoting Δqi the charge inserted onto atom i, Eqs. 7 and 8 take the general form
 |
(9) |
 |
(10) |
where  is the equilibrium electrostatic potential at the insertion site i in the state “xxx”. In this work, the Asp carboxylate protonation is modeled by the introduction of a total charge q = +1 onto the side-chain carboxylate atoms (Fig. 1).
Equations 9 and 10 express the free-energy change ΔG in terms of the equilibrium electrostatic potentials of the reactant, product, or midpoint states at the charge insertion sites. To evaluate these potentials for a particular protein structure, we solve the Poisson equation numerically, using dielectric values  and εw = 80, respectively, for the protein and the solvent. The potentials are averaged over several hundred protein structures, generated by molecular dynamics (MD) simulations of the protein in a box of water, with the aspartate of interest in the appropriate charge state (reactant, product, or midpoint state; see Numerical Methods).
Importantly, the linear response assumption also leads to a direct relation between the static and relaxation free-energy components (pointed out in a slightly different context by Marcus, 1965; Muegge et al., 1997):
 |
(11) |
By comparing the relaxation free energy calculated directly (see below) and by Eq. 11, we can verify the self-consistency of our analysis (Simonson et al., 1999).
Selection of protein dielectric values
The pKa values calculated from Eqs. 9 and 10 depend strongly on the protein dielectric constant,  As discussed by Warshel (Lee et al., 1992, 1993; Sham et al., 1997; Schutz and Warshel, 2001) and others (Simonson, 2003; Simonson and Perahia, 1995a; Eberini et al., 2004; Krishtalik et al., 1997), the choice of
  depends, in turn, on the nature of the microscopic effects that are explicitly modeled. By averaging over the two protein states, before and after protonation, this PB/LRA method accounts explicitly for the atomic rearrangements in response to proton binding. As a result, we expect the best results will be obtained with a protein dielectric εp = 1 or 2. Still, a larger dielectric constant may be needed even in this case (see, e.g., Eberini et al., 2004 where a PB/LRA method with
  was used), to account for factors such as limited sampling of the protein end states or deviations from linear response.
In this work, we use four criteria to determine the optimum  The first is to reproduce approximately the known experimental pKa values. This is satisfied with
  The second is to choose a value consistent with the molecular mechanics charge set used here (Mackerell et al., 1998). The molecular mechanics charges are designed to reproduce the equilibrium electrostatic potential with a dielectric constant of 1; the contribution of electronic polarization is included implicitly in the partial charges. The equilibrium structures used here were generated from MD simulations using this same charge set and a protein dielectric of 1 (Simonson et al., 2004). The implicit description can sometimes underestimate the effects of electronic polarization; see Simonson et al. (2004) for an example. Therefore, a value of
  between 1 and 2 appears plausible. The third criterion is to reproduce, at least qualitatively, the individual protonation free energies obtained by MDFE for the protein and the model compound. This is more stringent than simply reproducing the difference ΔΔG between the protein and the model compound. The fourth criterion is a consistency condition that must be obeyed by any linear response model, including a dielectric continuum model. Indeed, the static and relaxation free-energy components are linked directly by Eq. 11, and indirectly by Eqs. 2, 3, and 9. These relations place constraints on the model, and help delimit which values of
  are physically meaningful. This criterion has been mostly ignored in previous applications. It requires that we consider in more detail the relaxation free-energy component and that we distinguish between two different protein dielectric constants (Krishtalik et al., 1997; Simonson et al., 1999).
More about the relaxation free energy
If the system obeys linear response, and if the electrostatic potentials are available for either the midpoint state or for both endpoint states, the total free-energy change ΔG can be obtained without ever calculating the relaxation terms (they cancel in Eqs. 7–10). Nevertheless, their calculation helps constrain the values of the dielectric constant  that are physically meaningful. They also provide valuable information about the dielectric behavior of the system, because they directly measure its polarizability in response to the charge insertion (Simonson et al., 1991, 1999; Simonson and Perahia, 1995b; Archontis and Simonson, 2001; Simonson, 2002). Therefore, we also evaluate the relaxation free energies for different ionization states of the Asp side-chain carboxylate, using a range of values
  for the protein dielectric.
In the dielectric continuum framework, relaxation in response to the introduced charge is modeled by a redistribution of polarization charge at the protein-solvent boundary, determined by the dielectric constants of the solvent, εw = 80 and of the protein,  For any state “xxx” (reactant or product), one can show (Simonson et al., 1999) that the relaxation free energy
  is identical to the usual Born self-energy of the inserted charges {Δqi}, given by
 |
(12) |
Here,  is the reaction potential on the site i in state “xxx”, due to the charges {Δqi}.
Because the Poisson equation is linear, one might expect that our PB/LRA model would obey linear response by construction, and  and
and  would automatically agree. This is not necessarily true, because the free energies depend on the protein structure, which could vary in a nonlinear manner. However, in practice, it is true to a good approximation.
NUMERICAL METHODS
To obtain the electrostatic potentials appearing in Eqs. 9 and 10, we performed finite-difference Poisson calculations for a large number of equilibrium structures (50–200) for each charge state of the Asp side chain being considered. The structures were taken from molecular dynamics simulations of each charge state, described elsewhere (Simonson et al., 2004). The protein and solvent were treated as two homogeneous dielectric media. The reacting side chain was treated as a cavity (of dielectric unity). The protein-solvent and protein-cavity dielectric boundaries were defined by the molecular surface of the protein and the reacting side chain, respectively, constructed using atomic radii from the CHARMM22 force field, with the exception of the hydrogen radii, which were set to 1.0 Å (Mohan et al., 1992; Simonson and Brünger, 1994). The probe sphere for the surface construction was 2 Å. With this probe radius, the protein has no internal cavities (other than the reacting side-chain cavity). The solvent dielectric was set to 80 (unless otherwise mentioned). The value of the protein dielectric,  was varied between 1 and 4. The permanent charges on the protein atoms were taken from the CHARMM22 molecular mechanics force field (Mackerell et al., 1998). The finite-difference Poisson equation was solved in two steps. The first step utilized a cubic-grid spacing of 0.8–1.0 Å, and the second, focusing step a spacing of 0.25–0.30 Å. The calculations were done partly with the UHBD program and partly with the MEAD program (Madura et al., 1995; Bashford, 1997). In particular, MEAD allows calculations with three distinct dielectric media (cavity, protein, solvent).
When calculating the electrostatic potential  at a charge insertion site i (Eqs. 9 and 10), a contribution due to preexisting charge at the same site is subtracted; this “self” contribution exactly cancels when the free energy for the model compound is subtracted. For comparison to molecular dynamics free-energy results, we also subtract interactions between site i and protein atoms that are separated from i by one or two covalent bonds (Mackerell et al., 1998). This has essentially no effect on the computed pKa shifts, but it allows a direct comparison with the MDFE free-energy derivatives (below).
Unless otherwise mentioned, all the calculations were done assuming zero ionic strength, so that in fact the Poisson equation was solved, rather than the Poisson-Boltzmann equation. Nevertheless, we always refer to the “PB/LRA” method. A subset of Asp-20 calculations was done with the experimental ionic strength (100 mM monovalent salt concentration) (Forsyth et al., 2002); this has a very small effect on the free energies.
Calculations with some alternate solvent treatments are reported in Supplementary Material. These include calculations involving 1–3 explicit water molecules, and calculations with different solvent dielectric constants.
RESULTS
We calculate the protonation free energies, relative to a model aspartate compound in solution, of three aspartate side chains in two different proteins: Asp-26 in thioredoxin, Asp-14 in RNase A, and Asp-20 in thioredoxin. The protonation free energies have also been calculated by MDFE simulations with an explicit solvent representation and two different force fields (CHARMM and AMBER), as well as by MDFE with two different implicit solvent (generalized Born) representations. These calculations were presented in detail elsewhere (Simonson et al., 2004). The CHARMM MDFE runs employed the same atomic charges and radii used here.
To validate the method and the interpretation, we compare the ΔΔG from PB/LRA both to experiment and to the CHARMM explicit solvent MDFE runs. In addition, we compare the PB/LRA static free energies and protonation free energies to the explicit solvent MDFE runs. We perform two types of component analyses: group decompositions, which reveal the most important stabilizing interactions, and separate calculations of the relaxation free energies, which provide a measure of the protein polarizability and allow a consistency test of the continuum model. Finally, we compare this PB/LRA method to a more “standard” PB protocol that employs structures from a single endpoint of the protonation reaction. We present the results for each aspartate side chain separately. We begin by the model compound, to illustrate the calculation of the static and protonation free energies. Asp-26 is then discussed in detail, and Asp-14 more briefly. Asp-20, with its unshifted pKa, presents unexpected difficulties and is described last.
The model compound
To determine the tendency of each Asp to be protonated, we must first consider the model compound in solution: an aspartic acid molecule with N-acetyl and N-methylamide blocking groups (Fig. 1), whose experimental pKa is 4.0 (Forsyth et al., 2002). To calculate the static terms entering in the free-energy expressions, Eqs. 9 and 10, we need the equilibrium electrostatic potentials  at the charge insertion sites (i = Cβ, Cγ, Oδ1, Oδ2, Hδ; Fig. 1). Calculations are performed for three different equilibrium states: xxx = reactant, product, and midpoint. Direct interaction energies between the inserted charges Δqi and prior charges at the same site i are omitted. We also report the corresponding static free energies from the CHARMM MDFE runs. The MDFE values are identical to the free-energy derivatives (with respect to a charging parameter λ) reported in Table 1 of Simonson et al. (2004). The signs correspond to the direction ASP → ASPH, i.e., the direction of Asp protonation.
TABLE 1.
Static free energies from PB/LRA and MDFE
| Residue* | State |  |
 |
MDFE† |
|---|---|---|---|---|
| ASP | 95.5(0.3) | 116.8(0.3) | 124.2(2.2) | |
| Thioredoxin Asp-26 | Midpoint | 50.5(0.7) | 59.5(0.4) | 44.8(2.0) |
| ASPH | 28.7(0.4) | 10.7(0.3) | −16.6(4.6) | |
| ASP | 130.0(0.8) | 136.1(0.5) | 142.3(2.4) | |
| RNase A Asp-14 | Midpoint | 70.0(0.7) | 67.4(0.3) | 56.8(3.2) |
| ASPH | 11.5(1.0) | 0.3(0.6) | −17.9(4.2) | |
| ASP | 131.9(0.5) | 136.8(0.2) | 143.5(0.8) | |
| Thioredoxin Asp-20 | Midpoint | 60.5(0.3) | 63.0(0.1) | 57.0(1.2) |
| ASPH | −9.3(0.3) | −9.6(0.1) | −19.0(0.4) | |
| ASP | 139.6(0.4) | 143.3(0.2) | 144.6(1.4) | |
| Model‡ | Midpoint | 66.4(0.1) | 67.7(0.1) | 58.4(0.8) |
| ASPH | −6.0(0.2) | −7.8(0.1) | −19.3(1.4) |
Free energies in kcal/mol. The signs correspond to the ASP → ASPH direction (protonation). The protein dielectric constant is  Mean values over 100–200 MD structures are reported. The statistical uncertainty of the PB static free energies (in parentheses) was determined by the method of Flyvbjerg and Petersen (1989). A correction has been added to the static terms to permit comparison with the MDFE derivatives (see text; it is, respectively, +2.0, −1.0, and −4.1 kcal/mol at the protonated (ASPH), midpoint, and charged (ASP) end state).
Free-energy derivatives from a molecular dynamics free-energy simulation (MDFE) starting from the ionized state ASP (“backward” run); see Table 1 in (Simonson et al., 2004).
The model compound (Fig. 1) is an aspartic acid with N-acetyl and N-methylamide blocking groups.
The static free energies are given in Table 1. With a solute dielectric constant of  the static free-energy ranges from +139.6 (charged, reactant state) to −6.0 kcal/mol (neutral, product state). Using the static free-energy values and Eqs. 9 and 10, we can compute the protonation free energy. The results are listed in Table 2, along with the result from MDFE simulations of the same system with the CHARMM force field (Simonson et al., 2004). The pathways “2-point” and “1-point”, respectively, are described by Eqs. 9 and 10. A compound pathway, represented by “3-point”, involves all three states (“reactant”, “midpoint”, and “product”) and is described by Eq. 9. For the model compound, all pathways yield the same value (+66.5 kcal/mol), indicating that linear response is accurately satisfied (as expected for a small molecule in aqueous solution). This value is somewhat more positive than the corresponding CHARMM MDFE estimate (+60.5 kcal/mol).
TABLE 2.
Protonation free energies from PB/LRA and MDFE
| Residue* | Pathway† |  |
 |
MDFE‡ |
|---|---|---|---|---|
| 2-point | 62.1(0.3) | 63.8(0.2) | – | |
| Thioredoxin Asp-26 | 1-point | 50.5(0.7) | 59.5(0.4) | – |
| 3-point | 56.3(0.4) | 61.7(0.2) | 49.3(1.6) | |
| RNase A Asp-14 | 3-point | 70.3(0.5) | 67.8(0.2) | 59.4(2.0) |
| Thioredoxin Asp-20 | 3-point | 60.8(0.2) | 63.3(0.1) | 59.6(0.6) |
| Model | 3-point | 66.5(0.1) | 67.7(0.1) | 60.5(0.6) |
Free energies in kcal/mol. The protein dielectric constant is  Mean values over 100–200 MD structures are reported. Statistical uncertainty in parentheses.
The “2-point”, “1-point” values correspond, respectively, to Eqs. 9 and 10. The “3-point” values are obtained by applying Eq. 9 twice, to connect the “reactant”, “midpoint”, and “product” states.
From Simonson et al. (2004).
Setting  the solute backbone is treated as a bulk dielectric medium, whose polarizability corresponds roughly to the electronic polarizability of a peptide group. We continue to treat the titrating side-chain moiety as a cavity (with a dielectric of one). With this scheme, the static free energies shift slightly (Table 1). The protonation free energy (Table 2) becomes +67.7 kcal/mol, slightly more positive than before (as expected, because of the additional polarizability). As noted in Numerical Methods, treating the side chain as a cavity is consistent with quantum chemistry practice, but differs from the usual PB methods for proteins, which “embed” the side chain directly in the protein dielectric medium. This cavity method is essential to obtain static free energies and protonation free energies in fair agreement with MDFE. It has only a small effect on the experimentally relevant pKa shifts, however, because of cancellation between the cavity contributions in the protein and the model compound (see below).
Thioredoxin Asp-26
Static free energies
In Table 1, we report the static free energies for Asp-26 in different charge states, using a protein dielectric  Because atomic reorganization is explicitly accounted for in our method,
  is the physically realistic range (Fröhlich, 1949). When
  the ionizable side chain forms a small cavity within the protein.
With  the static free energy varies from 95.5 kcal/mol (ionized state) to 28.7 kcal/mol (protonated state). Agreement with the explicit solvent MDFE simulations is fair. The larger value in the ionized state originates from favorable interactions between the charged Asp-26 carboxylate and nearby protein groups (particularly Lys-57), and from solvent polarized by Asp-26 itself. In the protonated state, the interactions between Asp-26 and the surrounding groups are weaker and the static free-energy term is much smaller.
Agreement between the midpoint value and the average of the two endpoints is a necessary condition for the system to obey linear response (Eq. 8). In the MD simulations of thioredoxin presented in Simonson et al. (2004), it was observed that the protonated Asp-26 χ2 side chain occupies two conformers (proton pointing into the pocket or toward the solvent), which become equivalent at the ionized end state. As shown in Simonson et al. (2004), the presence of the two conformers leads to a significant deviation from linear response for the protein, although the solvent presumably still responds as a linear medium. This LRA model allows for a protein response that is piecewise linear, with different slopes in the first and second halves of the reaction (see below).
With  the static terms vary between 116.8 kcal/mol (ionized state) and 10.7 kcal/mol (protonated state), and the midpoint value is 59.5 kcal/mol (Table 1).
Protonation free energy
Using the static free-energy values and Eqs. 9 and 10, we can compute the protonation free energy for Asp-26. The results are listed in Table 2, along with the result from MDFE simulations of the same system with the CHARMM force field (Simonson et al., 2004).
The PB/LRA protonation free energies from the three pathways differ somewhat, and are consistently more negative than the corresponding CHARMM MDFE values. If the response to ionization were rigorously linear, all the pathways should give the same result. In fact, with  the estimated free-energy change ranges from 50.5 to 62.1 kcal/mol (Table 2). The variability arises because the midpoint static term is very different from the average over the charged- and neutral-state static terms (see Table 1); this indicates a nonlinearity in the protein dielectric response, already noted in the MDFE study (Simonson et al., 2004). We recall that in this PB/LRA model, protein atomic reorganization is included explicitly by considering the two endpoint states and the midpoint state. The “3-point” pathway, which uses conformations for all three states, explicitly allows for the possibility that the protein response may be piecewise linear, with different slopes in the first and second halves of the reaction; this is exactly the behavior observed in the earlier MDFE simulations. Therefore, this is presumably the most reliable pathway for Asp-26, giving a protonation free energy of 56.3 kcal/mol. Most of the discrepancy between PB/LRA and MDFE will cancel when the model compound result is subtracted (below).
With  all the protein reorganization is included in the atomic rearrangements between the endpoint structures. In fact, electronic polarizability may play a role in the pKa shift. The CHARMM atomic charge set is meant to include electronic polarization implicitly (Mackerell et al., 1998), in a mean field way. This average treatment may underestimate local effects in some cases, so that a larger value of
  may be appropriate. With
  the Asp-26 protonation free energy increases to 61.7 kcal/mol.
Relative protonation free energy and pKa shift
The protonation free energies with respect to the model compound, and the corresponding pKa shifts are reported in Table 3. With  and using the 3-point pathway (expected to be the most reliable one), the protonation free energy of Asp-26 relative to the model compound is ΔΔG = −10.2 kcal/mol. This is higher (in absolute value) than experiment, which gives −4.8 kcal/mol, but in very good agreement with MDFE (especially the more reliable, “backward” MDFE run (Simonson et al., 2004)). Like PB/LRA with
  the MDFE method models atomic reorganization of the protein explicitly, but has no explicit electronic polarization.
TABLE 3.
PB/LRA free energies relative to the model compound
| Residue* |  |
 |
MDFE† | Exp. |
|---|---|---|---|---|
| Thioredoxin Asp-26 | −10.2(0.4) | −6.0(0.2) | −10.9(1.8) | −4.8‡ |
| RNase A Asp14§ | 4.9(0.5) | 0.7(0.2) | 0.0(2.1) | >2.7¶ |
| Thioredoxin Asp-20 | −5.7(0.2) | −4.4(0.1) | −0.9(0.8) | 0.0¶ |
Free energies in kcal/mol. The protein dielectric constant is  Mean values over 100–200 MD structures are reported. Statistical uncertainty in parentheses. All values correspond to the 3-point pathway.
From Simonson et al. (2004).
From Langstemo et al. (1991).
A correction of +1.1 kcal/mol ( ) and +0.6 kcal/mol (
 ) has been added to the PB values, to take into account the protonation of other, solvent-exposed carboxylates (see text).
From Forsyth et al. (2002).
With  electronic polarizability is explicitly included. PB/LRA then gives ΔΔG = −6.0 kcal/mol, in good agreement with experiment.
Group decomposition of the static free energy
The static free energy depends strongly on the state (protonated, ionized, or “midpoint”). To understand this dependency, we decompose the static terms into contributions from selected protein residues (Table 4). Calculations were done with 
TABLE 4.
Thioredoxin Asp-26 group contributions to the PB static free energy
| Group* | ASPH | Midpoint | ASP |
|---|---|---|---|
| Asp-9 | −1.9(0.2) | −2.1(0.3) | −2.1(0.3) |
| Asp-43 | −2.4(1.4) | −2.9(0.7) | −1.2(0.5) |
| Lys-57 | 13.2(3.9) | 14.8(3.9) | 44.4(3.8) |
| Asp-26a† | 5.3(0.5) | 16.9(0.9) | 30.5(1.3) |
| Asp-26b‡ | 4.1(1.5) | 6.6(1.4) | 6.0(1.4) |
| Total | 28.7 | 50.5 | 95.5 |
Free energies in kcal/mol. The signs correspond to the ASP → ASPH direction (protonation). Standard deviation along the MD trajectories in parentheses.
Contribution due to the reaction field induced by source charges at the insertion sites.
Contribution from Asp-26, excluding the source charges.
The main difference between the protonated (ASPH) and ionized (ASP) static terms arises from the Asp-26 self-energy term (“Asp-26a”) and from nearby Lys-57. The Asp-26a term corresponds to the reaction field on Asp-26 due to solvent polarized by its own carboxylate. In agreement with linear response, this term is proportional in each state (ASPH, midpoint, ASP) to the Asp-26 charge in that state. In contrast, the contribution of Lys-57 is fairly constant in the neutral (13.2) and midpoint states (14.8 kcal/mol), becoming much more positive (44.4 kcal/mol) in the charged state. Lys-57 forms a salt bridge with Asp-26 in the charged state; this interaction is completely absent in the protonated and midpoint structures (see Figs. 4 and 5 in Simonson et al., 2004).
RNase Asp-14
We have also calculated the protonation free energy for Asp-14 in a different protein, ribonuclease A. The PB static free energies are listed in Table 1. With  they vary from 130.0 kcal/mol (ionized state) to 7.7 kcal/mol (neutral state). The midpoint value (70.0 kcal/mol) is close to the average over the endpoints (68.9 kcal/mol), indicating that this protonation reaction is well described by linear response.
The protonation free energy, consequently, has a very small dependency on the choice of pathway (not shown). With  the protonation free energy is estimated to be between 70.0 and 70.7 kcal/mol, significantly more positive than the corresponding MDFE value (59.4 kcal/mol). The 3-point value is 70.3 kcal/mol (see Table 2). With
  the protonation free energy is 67.8 kcal/mol.
The experimental pKa for Asp-14 is 2, two units below the model compound, and corresponding to an experimental relative protonation free energy of 2.7 kcal/mol. With  the relative protonation free energy of Asp-14 is estimated here to be 3.8 kcal/mol. With
  it is 0.1 kcal/mol, in poor agreement with experiment. However, the ribonuclease simulations were done with all the protein carboxylates ionized except for Asp-14 (Simonson et al., 2004). These groups are solvent exposed and distant from Asp-14, and it was assumed that their protonation state would not affect the results strongly. In fact, implicit solvent (generalized Born) simulations showed (Simonson et al., 2004) that when the other carboxylates are protonated, the Asp-14 protonation free-energy changes by 1.1 kcal/mol. Including this correction, with
  the Asp-14 PB/LRA protonation free energy increases to 4.9 kcal/mol (see Table 3). With
  it becomes 0.7 kcal/mol (the correction scales with
  ). The MDFE calculation yielded a relative protonation free energy of 0 kcal/mol, i.e., a zero pKa shift. The PB/LRA results with either
  are somewhat more accurate. A dielectric of
  would give perfect agreement with experiment.
A group decomposition of the RNase Asp-14 free energies is given in Table 5, with  The most important contributions come from Asp-14, His-48, Arg-33, and Tyr-25. In the crystal structure (determined at a pH of 5.2), Asp-14 is ionized and interacts with His-48 and Arg-33. In the MD simulations, Asp-14 makes a hydrogen bond to His-48 and forms a solvent-separated interaction with Arg-33. In accord with these observations, the contributions of His-48 and Arg-33 to the PB static term are significant, with His-48 having the larger value. Both contributions decrease by 12–13 kcal/mol in the neutral Asp-14 state, indicating a weakening of interactions upon Asp-14 protonation.
TABLE 5.
RNase Asp-14 group contributions to the PB static free energy
| Group* | ASPH | ASP |
|---|---|---|
| His-48 | 18.1(4.1) | 29.7(5.7) |
| Arg-33 | 9.0(2.4) | 21.9(4.8) |
| Tyr-25 | 3.6(3.7) | 9.6(3.5) |
| His-12 | 1.2(0.5) | 2.0(0.5) |
| Ser-16 | 1.0(0.9) | 1.8(1.1) |
| Glu-49 | −1.5(0.3) | −2.2(0.3) |
| Thr-82 | −1.9(0.4) | −2.0(0.5) |
| Ala-19 | −2.3(0.7) | −2.2(1.5) |
| Asp-14a† | 1.2(1.2) | 80.7(10.9) |
| Asp-14b‡ | −2.5(1.1) | −2.9(0.9) |
| Total | 6.4 | 131.0 |
Free energies in kcal/mol. The signs correspond to the ASP → ASPH direction (protonation). Standard deviation along the MD trajectories in parentheses.
Contribution due to the reaction field induced by the source charges at the insertion sites.
Contribution from Asp-14, excluding the source charges.
Thioredoxin Asp-20
Asp-20 is completely exposed to the solvent and has an experimental pKa shift of zero. This should be an “easy” case for pKa calculations. In fact, it poses specific problems.
The PB static free energies are listed in Table 1. With  the static terms are 131.9 and −9.3 kcal/mol, respectively, for the charged and neutral states. The midpoint value (60.5 kcal/mol) is close to the average over the endpoints (61.3 kcal/mol). With
  the static free energies in the ionized and half-ionized states are more positive. The qualitative agreement with the MDFE results is very good.
Given the linear dependence of the PB static values on the Asp-20 charge, the protonation free energy is almost independent of the pathway (not shown). With  the average over all pathways is ΔG = 60.8 kcal/mol (Table 2). The relative protonation free energy with respect to the model is −5.7 kcal/mol (Table 3). The experimental result is 0 kcal/mol. The corresponding estimate from MDFE is −0.9 kcal/mol. Thus, with
  the PB/LRA method incorrectly predicts a large upwards pKa shift.
To take into account the experimental ionic strength, 100 mM monovalent salt concentration, we also solved the Poisson-Boltzmann equation for the protein in this case. This increases the protonation free energy by ∼0.5 kcal/mol, improving the agreement with experiment very slightly.
Decomposition into contributions from all protein residues (Table 6) shows that the Asp-20 carboxylate itself accounts almost entirely for the static PB free-energy values, by polarizing the surrounding solvent. This is because Asp-20 is extensively solvated, and its electrostatic interactions with other protein residues are largely screened. This allows us to explain the underestimated protonation free energy and the incorrect pKa shift with  Considering the midpoint, for example, the static free energy of 60.5 kcal/mol is 5.9 kcal/mol weaker than for the model compound (Table 1). This difference is about the same as the error in the protonation free energy. It indicates that the half-charged Asp-20 carboxylate polarizes its surroundings more strongly in the model compound than in the protein. Because the solvent properties are the same in the two cases, it is the protein that must account for the discrepancy. In fact, the protein polarization by Asp-20 is underestimated. Indeed, with
  electronic polarization is underestimated (because the MD charges only include it in a mean field sense; Mackerell et al., 1998). This effect was less evident for Asp-26 and Asp-14 (above), where the protein polarization was dominated by atomic rearrangements.
TABLE 6.
Thioredoxin Asp-20 group contributions to the PB static free energy
| Group* | ASPH | ASP |
|---|---|---|
| Asp-20a† | −6.3(1.3) | 133.6(2.9) |
| Asp-20b‡ | −0.3(0.7) | 0.7(1.5) |
| Asp-15 | −0.6(0.1) | −0.5(0.1) |
| Gly-21 | −0.8(0.2) | −0.7(0.7) |
| Lys-82 | 0.6(0.2) | 0.6(0.2) |
| Ala-19 | 0.3(0.7) | 0.6(0.5) |
| Total | −9.3 | 131.9 |
Free energies in kcal/mol. The signs correspond to the ASP → ASPH direction (protonation). Standard deviation along the MD trajectories in parentheses.
Contribution due to the reaction field induced by the source charges at the insertion sites.
Contribution from Asp-20, excluding the source charges.
Taking  the protonation free energy increases to 63.3 kcal/mol and ΔΔG increases to −4.4 kcal/mol, or −3.9 kcal/mol, including the effect of ionic strength. This is still rather far from the experimental value of zero.
These results raise the question: why does MDFE successfully predict a small pKa shift for Asp-20? The MDFE calculations use the same charges and the same conformations as the PB/LRA calculations; therefore, they must underpolarize the protein to the same extent. To produce its larger protonation free energy, MDFE must overpolarize the solvent around thioredoxin, compared to the solvent around the model compound. This compensation of errors between protein and solvent polarization makes the MDFE calculation more robust than PB/LRA for this case.
This suggests that in the PB/LRA calculation, the macroscopic treatment of solvent polarization in the vicinity of Asp-20 may be inaccurate. We discuss in Supplementary Material some variants of the model that use slightly different solvent treatments. Some of these improve the agreement with experiment slightly, but they do not change the basic picture described here. Notice that for Asp-26, MDFE with explicit solvent led to an even larger error of 6.1 kcal/mol (Simonson et al., 2004).
An obvious way to increase the Asp-20 protonation free energy is to increase the protein dielectric  Warshel and co-workers (Warshel et al., 1984) have shown that the use of a large dielectric constant for charge-charge interactions is expected to work well in cases of protein surface groups. This has been empirically confirmed by several pKa calculations from various groups. However, we emphasize again that because the present PB/LRA method treats protein reorganization explicitly, the physically realistic range is
  ; see Fröhlich for a definitive discussion (Fröhlich, 1949).
Relaxation free energies
Following the two-step Marcus procedure, the charging free energy can be decomposed into a static and a relaxation step; see Eqs. 2 and 4. If linear response holds, the relaxation free energies are independent of the state; they cancel from Eqs. 9 and 10, and are not needed for ΔG. Nevertheless, the relaxation free energies are of interest. They help characterize the dielectric response to proton binding (Simonson and Perahia, 1995b; Simonson et al., 1999; Archontis and Simonson, 2001). In addition, the static and relaxation free energies are linked (Eq. 11). Thus, the relaxation data serve as an additional guide in choosing the optimum protein dielectric constant for the pKa calculations.
To calculate the relaxation free energies, we perform PB calculations for several values of the protein dielectric constant  and apply Eq. 12. The results are summarized in Table 7. The relaxation values depend strongly on the protein dielectric constant
  As discussed above and elsewhere (Simonson et al., 1999; Archontis and Simonson, 2001; Krishtalik et al., 1997), different values will normally be appropriate for
  and
and  Optimal values can be determined from the linear response consistency relation, Eq. 11. Moderate values of
  are optimal here. Larger values of 20 or 80, say, are not appropriate.
TABLE 7.
Relaxation free energies
 * *
|
 † †
|
||||||
|---|---|---|---|---|---|---|---|
| 1.0 | 2.0 | 3.0 | 4.0 | 8.0 |  |
 |
|
| Asp-26 | −15.3(1.9) | −45.7(0.9) | −55.9(0.5) | −61.2(0.2) | – | −56.1 | −36.3 |
| Asp-14 | −44.7(6.2) | −60.4(3.6) | – | −68.3(1.8) | −72.2(0.8) | −71.0 | −62.3 |
| Asp-20 | −72.8(1.7) | −75.4(1.1) | −75.8(0.0) | −76.2(0.7) | – | −76.3 | −73.9 |
Free energies in kcal/mol. The relaxation free energies were calculated by Eq. 12. Values underlined indicate which dielectric constants 
 give agreement (in the sense of Eq. 11, with “reac” ≡ ASP and “prod” ≡ ASPH) between static and relaxation free energies. Statistical uncertainty in parentheses. Results for the two endpoints ASP, ASPH agree within the uncertainty, so that a single average value is reported for both states.
We first discuss Asp-26. The relaxation free energy depends very weakly on the charge state, in accord with linear response (not shown). A dependency could arise if, e.g., the location of the side chain in the protein, or the overall shape of the protein dielectric cavity changed abruptly with the Asp carboxylate charge state. The prediction of the linear response formula (Eq. 11) is also shown in Table 7 for various values of  When
When  is used, consistency between the static and relaxation terms is best satisfied with a relaxation dielectric constant
  (values underlined). When
  is used, consistency between the static and relaxation terms is best satisfied with a lower relaxation dielectric constant
  The difference is expected, because the first scheme corresponds to a protein that has explicit electronic polarizability (
 ), so that the relaxation free energy is enhanced.
In the case of RNase Asp-14, the optimum relaxation dielectric constant is  when
when  When
When  relaxation is enhanced, and the best
In the case of Asp-20, when  is used, consistency between the static and relaxation terms is best satisfied with a relaxation dielectric constant
  In this case, ΔGr is very weakly sensitive to
  because Asp-20 is solvent exposed, and the relaxation is largely dominated by solvent.
The range of  values found here for all three Asp side chains,
  is similar to that found for two positions in the active site of the enzyme aspartyl-tRNA synthetase (Simonson et al., 1999; Archontis and Simonson, 2001). It is consistent with theoretical estimates of reorganization free energies in cytochrome c (Simonson and Perahia, 1995b; Simonson, 2002; Muegge et al., 1997), and with calculations of the average dielectric constant of several proteins (King et al., 1991; Smith et al., 1993; Simonson and Perahia, 1995a; Pitera et al., 2001; Simonson, 2003). It is also consistent with the polarizability measured by several experimental techniques, including dielectric dispersion by dry protein powders (Bone and Pethig, 1985), Stokes shift measurements for a probe bound in the active site of chymotrypsin (Mertz and Krishtalik, 2000), and Stark shifts of chromophores in the photosynthetic reaction center (Steffen et al., 1994).
Comparison to a “standard” pKa protocol
It is important to compare our pKa results with a PB protocol that is widely used for the calculation of pKa shifts (Bashford and Karplus, 1990; Raquet et al., 1997; Yang and Honig, 1993; Antosiewicz et al., 1996; Warwicker, 1999, 2004). In this “standard” protocol, a single protein structure is used, corresponding to one or the other of the ionization states of the residue of interest. For an Asp, a crystal structure with the Asp side chain in the ionized state is typical. Because the same atomic coordinates are used for both states, the protein structural relaxation is not taken into account explicitly, but only implicitly via the redistribution of polarization charge, governed by the protein and solvent dielectric constants. To obtain the protonation free energy of the same group in solution, analogous PB calculations are performed for a model compound (Fig. 1), embedded in a high-dielectric medium (the solvent).
We emphasize that this method can be implemented by simply adding the static and relaxation free energies computed here for either one of the endpoint structures. The constraint with the “standard” method is to use the same protein dielectric for both components:
 |
(13) |
(even though we have already seen that this is not physically realistic with this CHARMM22 charge set). Some of the data are available in Tables 1 and 7; to explore other dielectric values, additional calculations were done. With this method, we computed the pKa shifts of Asp-26, Asp-14, and Asp-20. In each case, two sets of calculations were done using, respectively, structures for the ionized or the protonated Asp state. The structures are the same ones used for the PB/LRA calculations above.
The results are given in Table 8. They vary with the protein dielectric constant as expected, but have also a striking dependence on the structural model assumed for the protein. Dielectric constants of 2–4 yield poor results in all cases. For Asp-26 the relative free energies are −8 and +4 kcal/mol, respectively, when protonated or ionized structures are used with εp = 4. The corresponding pKa shifts are 5.8 and −2.8; the experimental value is 3.5. Increasing the protein dielectric constant to 20, the pKa shifts become 1.4 and −0.7, respectively; i.e., they converge toward zero, but deviate considerably from the experimental result.
TABLE 8.
pKa shifts with the “standard” PB protocol
| εp = 2* | εp = 4 | εp = 20 | MDFE† | Experiment | ||
|---|---|---|---|---|---|---|
| ΔGs, protonated state‡ | −8 | −8 | −8 | −19 | – | |
| ΔGs, ionized state‡ | 143 | 144 | 144 | 145 | – | |
| Model | ΔGr | −78 | −79 | −79 | −82§ | – |
| ΔG | 70/65¶ | 71/65 | 71/65 | 61 | – | |
| ΔGs, protonated state‡ | 11 | 2 | −6 | −17 | – | |
| ΔGs, ionized state‡ | 117 | 130 | 141 | 124 | – | |
| Thioredoxin | ΔGr | −46 | −61 | −75 | −70§ | – |
| Asp-26 | ΔG | 57/71 | 63/69 | 69/66 | 49 | – |
| ΔΔG‖ | −13/6 | −8/4 | −2/1 | −11 | −4.8 | |
| ΔpKa | 9.6/−4.3 | 5.8/−2.8 | 1.4/−0.7 | 8 | 3.5 | |
| ΔpKa** | – | 3.5/−3.7 | 0.0/−1.4 | 8 | 3.5 | |
| ΔGs, protonated state‡ | 0 | −4 | −7 | −18 | – | |
| ΔGs, ionized state‡ | 136 | 138 | 140 | 142 | – | |
| RNase A | ΔGr | −60 | −68 | −75 | −80§ | – |
| Asp-14 | ΔG | 60/76 | 64/70 | 68/65 | 59 | – |
| ΔΔG‖ | −10/11 | −7/5 | −3/0 | 0 | >2.7 | |
| ΔpKa | 7.2/−8.0 | 5.0/−3.6 | 2.2/0 | 0.0 | <−2.0 | |
| ΔpKa** | – | 0.4/−5.6 | −0.7/−2.0 | 0.0 | <−2.0 | |
| ΔGs, protonated state‡ | −10 | −9 | −9 | −19 | – | |
| ΔGs, ionized state‡ | 137 | 138 | 140 | 144 | – | |
| Thioredoxin | ΔGr | −75 | −76 | −77 | −81§ | – |
| Asp-20 | ΔG | 65/62 | 67/62 | 68/63 | 60 | – |
| ΔΔG‖ | −5/−3 | −4/−3 | −3/−2 | −1 | 0.0 | |
| ΔpKa | 3.6/2.2 | 2.9/2.2 | 2.2/1.4 | 0.7 | 0.0 | |
| ΔpKa** | – | 1.7/1.2 | 0.8/0.7 | 0.7 | 0.0 |
Free energies in kcal/mol. The signs correspond to the direction ASP → ASPH (protonation).
From Simonson et al. (2004).
Results averaged over 50–60 structures, taken from MD trajectories (with explicit solvent) of the corresponding state.
From Eq. 10.
Throughout the table, x/y denote results using structures from the protonated/ionized state.
The double differences were calculated using the same states (e.g., subtracting the protonated model/compound from the protonated protein value).
The side chain is embedded directly in the protein medium; there is no side-chain cavity (see text).
A similar dependency on the protein structure is observed for Asp-14. With a protein dielectric of 4, the free energy is −7 kcal/mol when structures of the protonated endpoint are used and 5 kcal/mol when structures of the ionized endpoint are used. Increasing the protein dielectric to εp = 20, the free energies become −3 and 0, respectively. The experimental result is for Asp-14 protonation is 2.7 kcal/mol (−2 pKa units).
In the case of the solvent-exposed Asp-20, the pKa shifts computed with the two sets of structures are more similar. Agreement with experiment is fair when a high protein dielectric of 20 is used.
In the continuum dielectric framework used here, the titratable side chain is treated as a cavity within the protein medium (Fig. 1 B). This differs from the usual approach, which embeds the side chain directly within the protein dielectric. A side-chain cavity is essential to obtain reasonable values for the protonation free energy (compared to MDFE). Results are also reported in Table 8 using an “embedded” side chain. As expected, the effect of the side-chain cavity on the pKa shifts is much smaller than on the absolute protonation free energies (because the cavity contributions largely cancel when the model compound result is subtracted). However, it is not negligible, especially for Asp-14. Overall, the pKa shifts of the “standard” protocol are slightly better without the side-chain cavity (but the absolute ionization free energies are far worse, as they scale approximately with the side-chain dielectric value; not shown).
The poor performance of the standard protocol in the case of thioredoxin Asp-26 is due, indirectly, to the large structural rearrangements of the protein upon ionization. As discussed above, when Asp-26 is ionized, it forms a stable salt bridge with Lys-57. In the “protonated” structures used in the calculations of Table 8, the Lys-57–Asp-26 salt bridge is absent, and the average Lys-57 Nζ–Asp-26 Cγ distance is 6.8 Å. In these structures, the positive electrostatic potential at the Asp-26 carboxylate is smaller, and elimination of the Asp-26 charge is favored. Because the “standard” method uses the same protein structure for the two charge states, the protein relaxation upon ionization is modeled implicitly via the dielectric constant. A rather large value is needed to reflect the reorganization. But this large dielectric is not compatible with the atomic charges employed; the result is that the charge-charge interactions within the protein are not accurately described, and the model is unbalanced. With this method, the protonated endpoint structures predict that the protonated state is stable; the ionized endpoint structures predict that the ionized state is stable. The same behavior was observed by Bashford and co-workers (Dillet et al., 1998), and by Sharp and collaborators (Langsetmo et al., 1991).
In summary, the “standard” protocol cannot predict the Asp-26 and Asp-14 pKa shifts with confidence. Warshel and co-workers (Warshel et al., 1984) have shown that any model with a large dielectric constant for charge-charge interactions is expected to work well in cases of surface groups. Indeed, the standard protocol requires a very high dielectric constant (>20) to reproduce the Asp-20 behavior. From our PB/LRA analysis, this dielectric value is unphysical, because it is consistent neither with the atomic charge set, nor with the magnitude of dielectric relaxation in these systems, which corresponds to  (Table 7). It reproduces the behavior of Asp-20 because, as εp becomes large, the “standard” PB model becomes more and more like the “null” model (which assumes all pKa shifts to be zero). A high dielectric constant, has been used by several other workers as an empirical attempt to compensate for factors that a more “physical” dielectric constant does not account for properly. (Antosiewicz et al., 1994, 1996; Eberini et al., 2004).
The large dielectric constant reproduces the Asp-14 behavior because of a fortunate compensation of errors, by underestimating the static free-energy component and overestimating the relaxation component. This compensation of errors is expected to occur about half the time; viz., whenever the relaxation and static free-energy components for a given side chain have the opposite sign (see, e.g., the behavior of Asp-26 when the protonated structures are used). When they have the same sign, the “standard” protocol is likely to fail for side chains with a significantly shifted pKa. The sign of the static component depends on which endpoint is used as the reactant state, whereas the relaxation component is always negative. Therefore, the “standard” protocol may appear successful for a particular shifted pKa if one makes a fortunate choice of reactant state. It will be successful for unshifted pKa values if εp is sufficiently large. In both cases, however, the description of proton binding is at least partly unphysical.
DISCUSSION
Competing interactions determine the shifted pKa values
The sign and magnitude of the pKa shift of a particular titratable group is determined by the free energy to transfer it into the low-dielectric protein cavity, and by its interactions with polar residues in the protein (Sham et al., 1997; Simonson et al., 2004). In this work, we have gained insight into these competing factors for two buried and one solvent-exposed titratable group, by extensively comparing implicit (PB/LRA) and explicit (MDFE) treatments of selected degrees of freedom.
The first factor—side-chain desolvation—always opposes ionization. It is closely related to the reaction field contribution to the static free energy; i.e., the “Asp-26a” entry (respectively, Asp-14a, Asp-20a) in Tables 4–6. Its magnitude varies strongly with the extent of side-chain burial; e.g., from 30 kcal/mol for Asp-26 to 134 kcal/mol for Asp-20 (the numbers correspond to protonation, i.e., the more positive values favor ionization). The second factor may promote (e.g., Asp-26, Asp-14), not affect (Asp-20), or disfavor ionization, depending on the protein and the titratable group. The relative magnitude of the two factors depends on the particular case. In the systems studied here, Asp-26 has a raised pKa because the desolvation free energy is not fully compensated by the stabilizing interaction of ionized Asp-26 with Lys-57; Asp-14 has a lowered pKa thanks to its interactions with positive amino acids (Table 5).
Assessment of PB/LRA
“Standard” continuum methods for pKa values have faced several major difficulties. The protein dielectric properties vary from one titratable site to another, and are not accurately described by a uniform dielectric constant. For example, the three sites considered here correspond to relaxation dielectric constants  What is equally important is that it is dangerous to use a molecular mechanics charge set, optimized for a protein dielectric of 1 or 2, to describe a proton-binding reaction that involves significant protein reorganization. The most striking symptom of this problem is the enormous dependency of the results, in unfavorable cases, on the structural model employed. Thus, for thioredoxin Asp-26, structures corresponding to a protonated Asp-26 or an ionized Asp give completely different results. A third difficulty is the use of imperfect parameter sets; indeed, PB calculations have a strong dependency on the detailed atomic charges and radii. It is often possible to “fix” these problems by adjusting the protein dielectric constant and tolerating a few very poor predictions. The most popular strategy is to choose a model close to the null model, by setting the protein dielectric to a high value of 20, or even 80 (Warwicker, 1999). The model preserves the spatial distribution of positive and negative side chains, but purposely ignores the lower protein polarizability. With this choice, a large protein relaxation and a large screening of electrostatic interactions are built into the model. The risk is then to obtain a physically unbalanced model, with a good performance for solvent-exposed residues (where charge-charge interactions are less significant), and a limited predictive capability for buried residues (Warshel et al., 1984; Schutz and Warshel, 2001; Warwicker, 2004).
Of course, several more sophisticated PB approaches have been developed that avoid some of these difficulties. A microenvironment analysis of each titratable site can be used to account for dielectric heterogeneity (Warwicker, 2004). Several groups have included explicit conformational reorganization of selected protein side chains in the model (You and Bashford, 1995; Beroza and Case, 1996; Alexov and Gunner, 1999; Georgescu et al., 2002). This has been quite successful. Others have used MDFE with a generalized Born solvent model (Simonson et al., 2004; Lee et al., 2003; Feig and Brooks, 2004), or MD coupled with a continuum electrostatics approach (Baptista et al., 1997; Dlugosz and Antosiewicz, 2004). These latter methods represent atomic reorganization of the protein explicitly, similar to the PB/LRA method used here. PB/LRA accomplishes this by averaging over structures that are representative of both endpoint states (and possibly the midpoint state). This is a difficult and expensive operation, because we rarely have structural models for both states ahead of time, so we must generate them, e.g., by MD simulations. Electronic reorganization is represented implicitly; partly through the molecular mechanics charge sets, and partly by setting the protein dielectric  to a value between 1 and 2. A larger value would imply a double counting of the protein's atomic reorganization, which is theoretically incorrect. Nevertheless, it may be needed in certain cases to account for effects such as insufficient sampling of the endpoint states, or deviations from linear response; see, e.g., Eberini et al. (2004).
With the PB/LRA method, we have studied three very different Asp side chains: two buried ones, with an upward (Asp-26) or a downward (Asp-14) pKa shift, and an exposed one (Asp-20), with an unshifted pKa. In the two “difficult” cases of partly buried amino acids, the titratable groups interact strongly with proximal residues and ionization causes significant protein rearrangements. In these cases, PB/LRA yields pKa shifts in rather good agreement with the experimental values. The only parameter adjustment is the setting of  to a value between 1 and 2, the physically acceptable range. A reasonable rule of thumb is probably to take the average of the results with
  and
and  and view the half-difference as a fair uncertainty estimate. The results calculated with this rule of thumb are summarized in Table 9. This table also reports the predictions of the standard protocol (with εp = 20) and the MDFE results.
TABLE 9.
Summary of pKa shifts, calculated with PB/LRA, the “standard” PB protocol and MDFE
| Standard‡
|
||||||
|---|---|---|---|---|---|---|
| Residue | Pathway* | PB/LRA† | Cavity | No cavity§ | MDFE | Experiment |
| Thioredoxin Asp-26 | 3-point | 5.8(1.5) | 1.4/−0.7¶ | 0.0/−1.4 | 7.8 | 3.5 |
| RNase Asp-14 | 3-point | −1.4(1.5) | 2.2/0.0 | −0.7/−2.0 | 0.0 | <−2.0 |
| Thioredoxin Asp-20 | 3-point | 3.7(0.4) | 2.2/1.4 | 0.8/0.7 | 0.6 | 0.0 |
The pathways have been explained in Table 2 and refer to the PB/LRA entries.
The PB/LRA values correspond to averages of the results with  and
and 
Using a protein dielectric of 20.
The side chain is embedded directly in the protein medium (see “Comparison to a standard pKa protocol”).
Throughout the table, x/y denote results using structures from the protonated/ionized state.
Importantly, with the PB/LRA method, we also reproduce qualitatively the electrostatic potentials, the protonation free energies, and the Marcus reorganization free energies from the explicit solvent MDFE simulations. This is considerably more demanding than just fitting pKa shifts, and it gives confidence that the PB/LRA model captures much of the physics of proton binding and of the resulting dielectric relaxation.
The unshifted carboxylate, Asp-20, turns out to be surprisingly difficult. The PB/LRA approach overestimates the desolvation of Asp-20 by the protein by ∼3.9 kcal/mol (2.9 pKa units). This could be “corrected” by increasing the protein dielectric to a value >2, as done in Eberini et al. (2004). Unfortunately, this would amount to counting the protein atomic reorganization twice. Another possibility is that solvent close to Asp-20 is more strongly ordered than in the bulk, as was found for water close to lipid bilayers (Stern and Feller, 2003). It may then be appropriate in some cases to increase the local solvent dielectric. It is also possible that charge rearrangements in the Asp-20 side chain (ignored here) play a role; i.e., the carboxylate charge distribution could be slightly different in the protein environment and in the model compound. Alternatively, the atomic radii could be dependent on the charge state, as observed for small molecules in water (Bader and Berne, 1995). Finally, the structures generated by MD do not allow for explicit electronic polarizability, and the “a posteriori” correction applied here may be insufficient. Indeed, we “add back” the polarizability by combining the MD conformations with a protein dielectric constant of 2. But conformations that are the most sensitive to polarizability are presumably underrepresented from the outset. Reweighting the conformations with an umbrella sampling method might improve the results (Ceccarelli and Marchi, 2003).
Comparison to a “standard” pKa protocol
The most widely used method for pKa calculations in proteins is the “standard” protocol described above. It was applied here to all three Asp side chains, using a wide range of protein dielectric constants (1–20). It gives reasonable pKa shifts for two out of three cases (Table 9) when a high protein dielectric constant is used (εp = 20).
It is striking that with the standard protocol, the residue that requires the highest protein dielectric constant (Asp-20) is precisely the one whose ionization produces the smallest structural reorganization of the protein, as shown clearly by the MDFE data (Simonson et al., 2004), the PB/LRA component analysis (Table 6), and the relaxation analysis (Table 7). We have shown that for Asp-20, the continuum model overestimates the desolvation free energy in the protein environment. In other words, the protein cavity has too pronounced an effect, unless an artificially high protein dielectric is used. A high εp reduces the desolvation penalty by enhancing the relaxation free energy. It also downscales incorrectly the interactions of the ionized side chain with other protein residues. But for Asp-20, these interactions are very weak in the first place (see e.g., Table 6). With εp = 80, the desolvation penalty is zero and the model is very similar to the null model (zero pKa shifts for all side chains).
As has been pointed out by Warshel (Warshel et al., 1984; Schutz and Warshel, 2001), it is important to test the accuracy of a pKa method by calculations on interesting cases, such as partly buried active site residues with anomolous pKa values (Asp-26, Asp-14). In these cases, interactions of the titratable groups with other charged residues are expected to be both large and strongly state dependent; that is, the titratable groups and their environment reorganize substantially in response to ionization. The reduction of the desolvation penalty must be paid for by a loss of accuracy for the static free-energy component. If εp is chosen >2, we have shown that interactions between the ionized side chain and the rest of the protein are incorrectly downscaled. A better route to improve the “standard” method is to correct the unphysical features of the model that are responsible for the exaggerated desolvation. We have seen that a low protein dielectric constant is physically correct for Asp-20; therefore, other features of the model must be fixed, such as the Asp-20 charge distribution in the protein, the extent of solvent ordering, or the statistical weights of the sampled conformations (Ceccarelli and Marchi, 2003). Alternatively, as a heuristic solution, a high protein dielectric can be used for the relaxation free energy; but it is crucial then to use a much lower protein dielectric for the static free energy, so as not to “break” the description of protein-protein interactions in the “difficult” cases (Asp-26, Asp-14). The use of different protein dielectric constants for the static and relaxation free-energy components (Krishtalik et al., 1997; Sharp, 1998; Simonson et al., 1999; Archontis and Simonson, 2001) may appear complicated. But such a two-dielectric procedure would be a more physical route than the “standard” one for the three Asp side chains considered here.
CONCLUSION
Calculating and understanding pKa shifts in proteins remains an important challenge for theoretical biophysics. The ionization free energy of a titrating side chain depends on the desolvation penalty to transfer a net charge from solution into the protein cavity, and on the interactions between the transferred charge and polar residues in the protein. The relative magnitude of these two factors depends on the geometry of the particular protein, the location of the amino acid with respect to the protein-solvent interface, and the protein structural reorganization upon ionization. A theoretical method has to account correctly for all these factors to be accurate and yield correct insights.
In this work, we have used a dielectric continuum method to study proton binding in three proteins. The method, PB/LRA, uses linear response theory along with a decomposition of the charge insertion free energy into static and relaxation components, borrowed from electron transfer theory (Marcus, 1956; Simonson et al., 1999). It accounts microscopically for the protein atomic reorganization, by averaging the static free-energy component over equilibrium structures of the protein before and after proton binding, generated by MD simulations. It accounts macroscopically for the protein's electronic polarizability.
The method is applied to three aspartate side chains in two proteins. Two are buried in the protein interior, with significant pKa shifts; one is solvent exposed, with an unshifted pKa. The method produces pKa shifts in reasonable agreement with experiment in two out of three cases. Importantly, it also reproduces semiquantitatively the electrostatic potentials, the protonation free energies, the Marcus reorganization free energies, and the pKa shifts from MD with explicit solvent, essentially without adjustable parameters. This gives confidence that the PB/LRA method captures much of the physics of proton binding, and the resulting dielectric relaxation. For the buried cases, the method captures correctly the balance between protein reorganization, unfavorable desolvation, and favorable interactions of the Asp carboxylate with proximal protein residues. For the unshifted thioredoxin Asp-20, desolvation is overestimated, possibly due to charge rearrangement on the Asp side chain, bias in the MD conformations, or underestimated local solvent ordering. More work is needed to explore these factors.
A more “standard” Poisson-Boltzmann pKa protocol does not account explicitly for the protein structural reorganization. When applied to the same systems, it yields pKa shifts that depend strongly on the structural model assumed for the protein. Furthermore, it requires a large protein dielectric constant (≈20) to yield reasonable results in two out of three cases. This large protein dielectric is unphysical because it is inconsistent with the atomic charge set and the actual magnitude of the protein dielectric relaxation.
The PB/LRA method is probably not suitable for large-scale applications involving many titrating groups. Indeed, it requires equilibrium structures for the protein before and after proton binding, which is computationally demanding, as most of the structures have to be generated by MD simulations. Nevertheless, for the analysis of electrostatic interactions and dielectric relaxation in proteins, this method represents a middle path between experiment, theory, explicit solvent simulations, and simpler continuum models.
SUPPLEMENTARY MATERIALS
An online supplement to this article can be found by visiting BJ Online at http://www.biophysj.org.
Supplementary Material
Acknowledgments
We thank Martin Karplus for discussions and the CHARMM program. We thank Don Bashford for the MEAD program and help using it. We thank an anonymous referee for many useful comments.
Support was provided by the Egide program ZENON between Cyprus and France (to G.A. and T.S.). The PB calculations were performed on a Linux cluster at the University of Cyprus (UC), and were financed in part by UC and the Cyprus Research Promotion Foundation, through the programs “DNA oxidative repair by DNA photolyase: insights from molecular dynamics simulations and electron transfer calculations” (UC) and “Study of compstatin, important inhibitor of autoimmune system with high accuracy molecular simulations” (RPF/ERYAN/0603) to G.A. The MD simulations were performed at the Supercomputer Center CINES of the French Ministry of Research (grant to T.S.).
References
-
Alexov, E., and M. Gunner. 1999. Calculated protein and proton motions coupled to electron transfer: electron transfer from
 to QB in bacterial photosynthetic reaction centers. Biochemistry. 38:8253–8270. [DOI] [PubMed] [Google Scholar]
 - Antosiewicz, J., J. A. McCammon, and M. K. Gilson. 1994. Prediction of pH-dependent properties of proteins. J. Mol. Biol. 238:415–436. [DOI] [PubMed] [Google Scholar]
- Antosiewicz, J., J. A. McCammon, and M. K. Gilson. 1996. The determinants of pKas in proteins. Biochemistry. 35:7819–7833. [DOI] [PubMed] [Google Scholar]
- Aqvist, J. 1991. Calculation of absolute binding free energies for charged ligands and effects of long-range electrostatic interactions. J. Comput. Chem. 17:1587–1597. [Google Scholar]
- Aqvist, J., V. B. Luzhkov, and B. O. Brandsal. 2002. Ligand binding affinities from MD simulations. Acc. Chem. Res. 35:358–365. [DOI] [PubMed] [Google Scholar]
- Archontis, G., and T. Simonson. 2001. Dielectric relaxation in an enzyme active site: molecular dynamics simulations interpreted with a macroscopic continuum model. J. Am. Chem. Soc. 123:11047–11056. [DOI] [PubMed] [Google Scholar]
- Bader, J. S., and B. Berne. 1995. Solvation energies and electronic spectra in polar, polarizable media: simulation tests of dielectric continuum theory. J. Chem. Phys. 104:1293–1308. [Google Scholar]
- Baptista, A. M., P. J. Martel, and S. B. Petersen. 1997. Simulation of protein conformational freedom as a function of pH: constant pH molecular dynamics using implicit titration. Proteins. 27:523–544. [PubMed] [Google Scholar]
- Bashford, D. 1997. An object-oriented programming suite for electrostatic effects in biological molecules. In Scientific Computing in Object-Oriented Parallel Environments, Vol. 1343. Lecture Notes in Computer Science. ISCOPE97. Y. Ishikawa, R. R. Oldehoeft, J. V. W. Reynders, and M. Tholburn, editors. Springer, Berlin, Germany.
- Bashford, D., and M. Karplus. 1990. pKas of ionizable groups in proteins: atomic detail from a continuum electrostatic model. Biochemistry. 29:10219–10225. [DOI] [PubMed] [Google Scholar]
- Beroza, P., and D. Case. 1996. Including sidechain flexibility in continuum electrostatics calculations of protein titration. J. Phys. Chem. 100:20156–20163. [Google Scholar]
- Bone, S., and R. Pethig. 1985. Dielectric studies of protein hydration and hydration-induced flexibility. J. Mol. Biol. 181:323–326. [DOI] [PubMed] [Google Scholar]
- Ceccarelli, M., and M. Marchi. 2003. Simulation and modeling of the Rhodobacter spaeroides bacterial reaction center. J. Phys. Chem. B. 107:1423–1431. [Google Scholar]
- Cornell, W., P. Cieplak, C. Bayly, I. Gould, K. Merz, D. Ferguson, D. Spellmeyer, T. Fox, J. Caldwell, and P. Kollman. 1995. A second generation force field for the simulation of proteins, nucleic acids, and organic molecules. J. Am. Chem. Soc. 117:5179–5197. [Google Scholar]
- Cramer, C., and D. Truhlar. 1999. Implicit solvent models: equilibria, structure, spectra, and dynamics. Chem. Rev. 99:2161–2200. [DOI] [PubMed] [Google Scholar]
- Davis, M. E., and J. A. McCammon. 1990. Electrostatics in biomolecular structure and dynamics. Chem. Rev. 90:509–521. [Google Scholar]
- Del Buono, G., F. Figueirido, and R. Levy. 1994. Intrinsic pKas of ionizable residues in proteins: an explicit solvent calculation for lysozyme. Proteins. 20:85–97. [DOI] [PubMed] [Google Scholar]
- Dillet, V., H. J. Dyson, and D. Bashford. 1998. Calculations of electrostatic interactions and pKas in the active site of Escherichia coli thioredoxin. Biochemistry. 37:10298–10306. [DOI] [PubMed] [Google Scholar]
- Dlugosz, M., and J. Antosiewicz. 2004. Constant-pH molecular dynamics simulations: a test case of succinic acid. Chem. Phys. 302:161–170. [Google Scholar]
- Eberini, I., A. Baptista, E. Gianazza, F. Fraternali, and T. Beringhelli. 2004. Reorganization in apo- and holo-β-lactoglobulin upon protonation of Glu89: molecular dynamics and pKa calculations. Proteins. 54:744–758. [DOI] [PubMed] [Google Scholar]
- Feig, M., and C. L. Brooks III. 2004. Recent advances in the development and application of implicit solvent models in biomolecule simulations. Curr. Opin. Struct. Biol. 14:217–224. [DOI] [PubMed] [Google Scholar]
- Florian, J., M. Goodman, and A. Warshel. 2002. Theoretical investigation of the binding free energies and key substrate-recognition components of the replication fidelity of human DNA polymerase β. J. Phys. Chem. B. 106:5739–5753. [Google Scholar]
- Florian, J., M. Goodman, and A. Warshel. 2003. Computer simulation studies of the fidelity of DNA polymerases. Biopolymers. 68:286–299. [DOI] [PubMed] [Google Scholar]
- Flyvbjerg, H., and H. Petersen. 1989. Error estimates on averages of correlated data. J. Chem. Phys. 91:461–466. [Google Scholar]
- Forsyth, W., J. Antonisiewicz, and A. Robertson. 2002. Empirical relationships between protein structure and carboxyl pKα values in proteins. Proteins. 48:388–403. [DOI] [PubMed] [Google Scholar]
- Fröhlich, H. 1949. Theory of Dielectrics. Clarendon Press, Oxford, UK.
- Georgescu, E., E. Alexov, and M. Gunner. 2002. Combining conformational flexibility and continuum electrostatics for calculating pKas in proteins. Biophys. J. 83:1731–1748. [DOI] [PMC free article] [PubMed] [Google Scholar]
- Gilson, M. K. 1993. Multiple-site titration and molecular modeling: two rapid methods for computing energies and forces for ionizable groups in proteins. Proteins. 15:266–282. [DOI] [PubMed] [Google Scholar]
- Hoefinger, S., and T. Simonson. 2001. Dielectric relaxation in proteins: a continuum electrostatics model incorporating dielectric heterogeneity of the protein and time-dependent charges. J. Comput. Chem. 22:290–305. [Google Scholar]
- Honig, B., and A. Nicholls. 1995. Classical electrostatics in biology and chemistry. Science. 268:1144–1149. [DOI] [PubMed] [Google Scholar]
- Jorgensen, W. L. 2004. The many roles of computation in drug discovery. Science. 303:1813–1818. [DOI] [PubMed] [Google Scholar]
- Jorgensen, W. L., and J. Tirado-Rives. 1988. The OPLS potential function for proteins, energy minimization for crystals of cyclic peptides and crambin. J. Am. Chem. Soc. 110:1657–1666. [DOI] [PubMed] [Google Scholar]
- King, G., F. Lee, and A. Warshel. 1991. Microscopic simulations of macroscopic dielectric constants of solvated proteins. J. Chem. Phys. 95:4366–4377. [Google Scholar]
- Krishtalik, L., A. Kuznetsov, and E. Mertz. 1997. Electrostatics of proteins: description in terms of two dielectric constants simultaneously. Proteins. 28:174–182. [PubMed] [Google Scholar]
- Langstemo, K., J. Fuchs, and C. Woodward. 1991. The conserved, buried aspartic acid in oxidized Escherichia coli thioredoxin has a pKa of 7.5. Its titration produces a related shift in global stability. Biochemistry. 30:7603–7609. [DOI] [PubMed] [Google Scholar]
- Langsetmo, K., J. A. Fuchs, C. Woodward, and K. A. Sharp. 1991. Linkage of thioredoxin stability to titration of ionized groups with perturbed pKa. Biochemistry. 30:7609–7614. [DOI] [PubMed] [Google Scholar]
- Lee, F., Z. Chu, M. B. Bolger, and A. Warshel. 1992. Calculations of antibody-antigen interactions: microscopic and semi-microscopic evaluation of the free energies of binding of phosphorylcholine analogues to McPC603. Protein Eng. 5:215–228. [DOI] [PubMed] [Google Scholar]
- Lee, F., Z. Chu, and A. Warshel. 1993. Microscopic and semimicroscopic calculations of electrostatic energies in proteins by the Polaris and Enzymix programs. J. Comput. Chem. 14:161–185. [Google Scholar]
- Lee, M., F. Salsbury, and C. L. Brooks. 2003. Constant pH molecular dynamics using continuous titration coordinates. Proteins. 56:731–752. [DOI] [PubMed] [Google Scholar]
- Mackerell, A. D., D. Bashford, M. Bellott, R. Dunbrack, J. Evanseck, M. Field, S. Fischer, J. Gao, H. Guo, S. Ha, D. Joseph, L. Kuchnir, et al. 1998. An all-atom empirical potential for molecular modelling and dynamics study of proteins. J. Phys. Chem. B. 102:3586–3616. [DOI] [PubMed] [Google Scholar]
- Mackerell, A. M., M. S. Sommer, and M. Karplus. 1995. pH dependence of binding reactions from free energy simulations and macroscopic continuum electrostatic calculations: application to 2′GMP/3′GMP binding to ribonuclease T1 and implications for catalysis. J. Mol. Biol. 247:774–807. [DOI] [PubMed] [Google Scholar]
- Madura, J., J. Briggs, R. Wade, M. Davis, B. Luty, A. Ilin, J. Antosiewicz, M. Gilson, B. Baheri, L. Scott, and J. McCammon. 1995. Electrostatics and diffusion of molecules in solution: simulations with the University of Houston Brownian dynamics program. Comput. Phys. Commun. 91:57–95. [Google Scholar]
- Marcus, R. 1956. Electrostatic free energy and other properties of states having nonequilibrium polarization. J. Chem. Phys. 24:979–989. [Google Scholar]
- Marcus, R. 1964. Chemical and electro-chemical electron transfer theory. Annu. Rev. Phys. Chem. 15:155–196. [Google Scholar]
- Marcus, R. 1965. On the theory of shifts and broadening of electronic spectra of polar solutes in polar media. J. Chem. Phys. 43:1261–1274. [Google Scholar]
- Mehler, E., and F. Guarnieri. 1999. A self-consistent, microenvironment modulated screened potential approximation to calculate pH-dependent electrostatic effects in proteins. Biophys. J. 77:3–22. [DOI] [PMC free article] [PubMed] [Google Scholar]
- Mertz, E., and L. Krishtalik. 2000. Low dielectric response in enzyme active site. Proc. Natl. Acad. Sci. USA. 97:2081–2086. [DOI] [PMC free article] [PubMed] [Google Scholar]
- Mohan, V., M. Davis, J. A. McCammon, and B. M. Pettitt. 1992. Continuum model calculations of solvation free energies: accurate evaluation of electrostatic contributions. J. Phys. Chem. 96:6428–6431. [Google Scholar]
- Morikis, D., A. H. Elcock, P. A. Jennings, and J. A. McCammon. 2001. Native state conformational dynamics of GART: a regulatory pH-dependent coil-helix transition examined by electrostatic calculations. Protein Sci. 10:2363–2378. [DOI] [PMC free article] [PubMed] [Google Scholar]
- Muegge, I., P. X. Qi, A. J. Wand, Z. T. Chu, and A. Warshel. 1997. Reorganization energy of cytochrome c revisited. J. Phys. Chem. B. 101:825–836. [Google Scholar]
- Nakamura, H. 1996. Roles of electrostatic interactions in proteins. Q. Rev. Biophys. 29:1–90. [DOI] [PubMed] [Google Scholar]
- Nielsen, J. E., and J. A. McCammon. 2003. Calculating pKa values in enzyme active sites. Protein Sci. 12:1894–1901. [DOI] [PMC free article] [PubMed] [Google Scholar]
- Pitera, J., M. Falta, and W. van Gunsteren. 2001. Dielectric properties of proteins from simulations: the effects of solvent, ligands, pH, and temperature. Biophys. J. 80:2546–2555. [DOI] [PMC free article] [PubMed] [Google Scholar]
- Raquet, X., V. Lounnas, J. Lamotte-Brasseur, J. Frere, and R. Wade. 1997. pKa calculations for class a β-lactamases: methodological and mechanistic implications. Biophys. J. 73:2416–2426. [DOI] [PMC free article] [PubMed] [Google Scholar]
- Roux, B., and T. Simonson. 1999. Implicit solvent models. Biophys. Chem. 78:1–20. [DOI] [PubMed] [Google Scholar]
- Schaefer, M., and M. Karplus. 1997. pH-dependence of protein stability: absolute electrostatic free energy differences between conformations. J. Phys. Chem. B. 101:1663–1683. [Google Scholar]
- Schaefer, M., H. v. Vlijmen, and M. Karplus. 1998. Electrostatic contributions to molecular free energies in solution. Adv. Protein Chem. 51:1–57. [DOI] [PubMed] [Google Scholar]
- Schutz, C. N., and A. Warshel. 2001. What are the dielectric constants of proteins and how to validate electrostatic models? Proteins. 44:400–417. [DOI] [PubMed] [Google Scholar]
- Sham, Y. Y., Z. T. Chu, and A. Warshel. 1997. Consistent calculations of pKas of ionizable residues in proteins: semi-microscopic and microscopic approaches. J. Phys. Chem. B. 101:4458–4472. [Google Scholar]
- Sham, Y. Y., I. Muegge, and A. Warshel. 1998. The effect of protein relaxation on charge-charge interactions and dielectric constants of proteins. Biophys. J. 74:1744–1753. [DOI] [PMC free article] [PubMed] [Google Scholar]
- Sharp, K. 1998. Calculation of electron transfer reorganization energies using the finite-difference Poisson-Boltzmann model. Biophys. J. 73:1241–1250. [DOI] [PMC free article] [PubMed] [Google Scholar]
- Simonson, T. 2002. Gaussian fluctuations and linear response in an electron transfer protein. Proc. Natl. Acad. Sci. USA. 99:6544–6549. [DOI] [PMC free article] [PubMed] [Google Scholar]
- Simonson, T. 2003. Electrostatics and dynamics of proteins. Rep. Prog. Phys. 66:737–787. [Google Scholar]
- Simonson, T., G. Archontis, and M. Karplus. 1999. A Poisson-Boltzmann study of charge insertion in an enzyme active site: the effect of dielectric relaxation. J. Phys. Chem. B. 103:6142–6156. [Google Scholar]
- Simonson, T., and A. T. Brünger. 1994. Solvation free energies estimated from macroscopic continuum theory: an accuracy assessment. J. Phys. Chem. 98:4683–4694. [Google Scholar]
- Simonson, T., J. Carlsson, and D. Case. 2004. Proton binding to proteins: pKa calculations with explicit and implicit solvent models. J. Am. Chem. Soc. 126:4167–4180. [DOI] [PubMed] [Google Scholar]
- Simonson, T., and D. Perahia. 1995a. Internal and interfacial dielectric properties of cytochrome c from molecular dynamics simulations in aqueous solution. Proc. Natl. Acad. Sci. USA. 92:1082–1086. [DOI] [PMC free article] [PubMed] [Google Scholar]
- Simonson, T., and D. Perahia. 1995b. Microscopic dielectric properties of cytochrome c from molecular dynamics simulations in aqueous solution. J. Am. Chem. Soc. 117:7987–8000. [DOI] [PMC free article] [PubMed] [Google Scholar]
- Simonson, T., D. Perahia, and A. T. Brünger. 1991. Microscopic theory of the dielectric properties of proteins. Biophys. J. 59:670–690. [DOI] [PMC free article] [PubMed] [Google Scholar]
- Smith, P., R. Brunne, A. Mark, and W. F. van Gunsteren. 1993. The dielectric constant of trypsin inhibitor and lysozyme calculated from molecular dynamics simulations. J. Phys. Chem. 97:2009–2014. [Google Scholar]
- Steffen, M., K. Lao, and S. Boxer. 1994. Dielectric asymmetry in the photosynthetic reaction center. Science. 264:810–816. [DOI] [PubMed] [Google Scholar]
- Stern, H., and S. Feller. 2003. Calculation of the dielectric permittivity profile of a nonuniform system: application to a lipid bilayer simulation. J. Chem. Phys. 118:3401–3412. [Google Scholar]
- Sternberg, M., F. Hayes, A. Russell, P. Thomas, and A. Fersht. 1987. Prediction of electrostatic effects of engineering of protein charges. Nature. 330:86–88. [DOI] [PubMed] [Google Scholar]
- Swietnicki, W. R., R. Petersen, P. Gambetti, and W. K. Suerwicz. 1997. pH-dependent stability and conformation of the recombinant human prion protein PrP(90–231). J. Biochem. (Tokyo). 272:27517–27520. [DOI] [PubMed] [Google Scholar]
- van Vlijmen, H., S. Curry, M. Schaefer, and M. Karplus. 1998. Titration calculations of foot-and-mouth disease virus and their stabilities as a function of pH. J. Mol. Biol. 275:295–308. [DOI] [PubMed] [Google Scholar]
- Varadarajan, R., T. Zewert, H. Gray, and S. Boxer. 1989. Effects of buried ionizable amino acids on the reduction potential of recombinant hemoglobin. Science. 243:69–72. [DOI] [PubMed] [Google Scholar]
- Warshel, A. 1981. Calculations of enzymic reactions: calculations of pKa, proton transfer reactions, and general acid catalysis reactions in enzymes. Biochemistry. 20:3167–3177. [DOI] [PubMed] [Google Scholar]
- Warshel, A. 1987. What about protein polarity? Nature. 330:15–17. [DOI] [PubMed] [Google Scholar]
- Warshel, A., and S. T. Russell. 1985. Calculations of electrostatic interactions in biological systems and in solutions. Q. Rev. Biophys. 17:283–422. [DOI] [PubMed] [Google Scholar]
- Warshel, A., S. T. Russell, and A. K. Churg. 1984. Macroscopic models for studies of electrostatic interactions in proteins: limitations and applicability. Proc. Natl. Acad. Sci. USA. 81:4785–4789. [DOI] [PMC free article] [PubMed] [Google Scholar]
- Warwicker, J. 1999. Simplified methods for pKa and acid pH-dependent stability estimation in proteins: removing dielectric and counterion boundaries. Protein Sci. 8:418–425. [DOI] [PMC free article] [PubMed] [Google Scholar]
- Warwicker, J. 2004. Improved pKa calculations through flexibility based sampling of a water-dominated interaction scheme. Protein Sci. 13:2793–2805. [DOI] [PMC free article] [PubMed] [Google Scholar]
- Warwicker, J., and H. Watson. 1982. Calculation of the electrostatic potential in the active site cleft due to α helix dipoles. J. Mol. Biol. 157:671–679. [DOI] [PubMed] [Google Scholar]
- Yang, A., and B. Honig. 1993. On the pH dependence of protein stability. J. Mol. Biol. 231:459–474. [DOI] [PubMed] [Google Scholar]
- You, T., and D. Bashford. 1995. Conformation and hydrogen ion titration of proteins: a continuum electrostatic model with conformational flexibility. Biophys. J. 69:1721–1733. [DOI] [PMC free article] [PubMed] [Google Scholar]
Associated Data
This section collects any data citations, data availability statements, or supplementary materials included in this article.