

Abstract
Molecular dynamics simulations were performed on a two-component lipid bilayer system in the liquid crystalline phase at constant pressure and constant temperature. The lipid bilayers were composed of a mixture of neutral galactosylceramide (GalCer) and charged dipalmitoylphosphatidylglycerol (DPPG) lipid molecules. Two lipid bilayer systems were prepared with GalCer:DPPG ratio 9:1 (10%-DPPG system) and 3:1 (25%-DPPG system). The 10%-DPPG system represents a collapsed state lipid bilayer, with a narrow water space between the bilayers, and the 25%-DPPG system represents an expanded state with a fluid space of ≈10 nm. The number of lipid molecules used in each simulation was 1024, and the length of the production run simulation was 10 ns. The simulations were validated by comparing the results with experimental data for several important aspects of the bilayer structure and dynamics. Deuterium order parameters obtained from 2H NMR experiments for DPPG chains are in a very good agreement with those obtained from molecular dynamics simulations. The surface area per GalCer lipid molecule was estimated to be 0.608 ± 0.011 nm2. From the simulated electron density profiles, the bilayer thickness defined as the distance between the phosphorus peaks across the bilayer was calculated to be 4.21 nm. Both simulation systems revealed a tendency for cooperative bilayer undulations, as expected in the liquid crystalline phase. The interaction of water with the GalCer and DPPG oxygen atoms results in a strong water ordering in a spherical hydration shell and the formation of hydrogen bonds (H-bonds). Each GalCer lipid molecule makes 8.6 ± 0.1 H-bonds with the surrounding water, whereas each DPPG lipid molecule makes 8.3 ± 0.1 H-bonds. The number of water molecules per GalCer or DPPG in the hydration shell was estimated to be 10–11 from an analysis of the radial distribution functions. The formation of the intermolecular hydrogen bonds was observed between hydroxyl groups from the opposing GalCer sugar headgroups, giving an energy of adhesion in the range between −1.0 and −3.4 erg/cm2. We suggest that this value is the contribution of the hydrogen-bond component to the net adhesion energy between GalCer bilayers in the liquid crystalline phase.
INTRODUCTION
In biological processes interactions between cells play an important role. Understanding the underlying mechanisms of these interactions can provide information about how cells function and therefore is a subject of considerable research activity. Much progress has been achieved in understanding the role of glycosphingolipids in cell signaling (Ballou et al., 1996; Bektas and Spiegel, 2004; Blitterswijk et al., 2003; Boggs et al., 2004; Bucior and Burger, 2004; Hakomori, 2004; Hoekstra et al., 2003) and the importance of glycosphingolipids in the formation of a compact myelin structure is well-established experimentally (Bosio et al., 1996; Coetzee et al., 1996; Gourier et al., 2004; Pincet et al., 2001). In recent years, evidence has been accumulated indicating that the presence of sphingolipids stimulates the formation of lipid domains in plasma membranes (Denny et al., 2004; Hsueh et al., 2002; Simons and Ikonen, 1997; Xu et al., 2001). The roles of these domains have been implicated in signal transduction across the plasma membrane and in the process of protein and lipid sorting, which takes place in intracellular membranes (Ballou et al., 1996; Degroote et al., 2004; Hoekstra et al., 2003; Simons and Ikonen, 1997). Galactosylceramide (GalCer) belongs to the simplest class of glycosphingolipid since its headgroup consists of a single saccharide moiety. GalCer is one of the major components in the lipid bilayer of the myelin membrane of the central and peripheral nervous systems (Weigandt, 1985). Natural and synthetic glycosphingolipids exhibit a complex time-dependent hydration behavior and a high gel to liquid crystalline phase transition temperature in the range of 70–90°C (Haas and Shipley, 1995; Maggio et al., 1985; Moore et al., 1997).
The present work was motivated by the observation of a strong attractive force between uncharged GalCer bilayers across the aqueous solution (Kulkarni et al., 1999) and the ability of this system to form a compact (collapsed) state with an extremely narrow water space between the opposing lipid bilayers. In that study the information about the structure and adhesion energy between gel-phase GalCer bilayers was obtained by applying x-ray diffraction/osmotic stress techniques. The energy of adhesion between GalCer bilayers was estimated to be −1.5 erg/cm2.
The strong attractive interactions observed between GalCer lipid bilayers in the gel phase (Kulkarni et al., 1999) should also operate between GalCer bilayers in a liquid crystalline phase. Support for this statement comes from a number of publications. Liquid crystalline ditridecanoylphosphatidylcholine bilayers containing 30 mol % lactosyl ceramide (LacCer) molecules show a strong adhesion between the bilayers (Yu et al., 1998). The observed intermembrane adhesion was explained by the formation of hydrogen bonds between the carbohydrate headgroups. In micropipette studies the liquid crystalline glycolipids (digalactosyl diacyl glycerol) exhibited much stronger adhesion with energies that were an order-of-magnitude greater than those found for phosphatidylethanolamine lipids (Evans and Needham, 1987).
On a biological scale, an adhesion energy equal to −1.5 erg/cm2 is a large value, implying the existence of some attractive mechanism in addition to the van der Waals interaction. It is believed that short-range interactions, such as hydrogen bonding between carbohydrates, play a major role in the glycolipid adhesion event (Boggs, 1986; Boggs et al., 2004; Bucior and Burger, 2004; Gourier et al., 2004; Hakomori, 1984, 2004). A similar mechanism was suggested for hydrated phosphatidylethanolamine lipids (McIntosh and Simon, 1996). This mechanism involves direct hydrogen-bond formation between a  group in one bilayer and the
  in the opposite bilayer. Short-range interactions might also arise because of the polarization of water molecules (commonly called a hydration interaction; Rand et al., 1988). It has been proposed that both attractive and repulsive hydration forces contribute to the net interbilayer interaction (Rand and Parsegian, 1989). The attractive contribution was defined as the ability of the two opposing lipid headgroups to form hydrogen-bonded water bridges. The possibility of the indirect hydrogen-bond formation between phosphocholine molecules via water molecules has been studied using molecular dynamics (MD) simulations (Pasenkiewicz-Gierula et al., 1997).
Short-range interactions between the lipid bilayers are always present, but are very difficult to evaluate experimentally. MD simulations can provide unique detailed information about the structure and dynamics of lipid membranes. However, due to the uncertainties in the force-field parameters, a comparison of the simulated results with experimental data is essential. Once the results are verified, computer simulations can help in the interpretation of the experimental data based on the trajectories of individual atoms.
In this work MD simulations and 2H NMR techniques were used to investigate the structure and dynamics of the GalCer:DPPG lipid bilayer in water in its liquid crystalline phase. The goal of this investigation is to develop experimentally verified computer models, which can be used in future simulations. To achieve this goal, we prepared and simulated two systems of GalCer:DPPG lipid mixtures containing different amounts of water. We used the liquid crystalline phase of the GalCer:DPPG lipid bilayers to compare the order parameter profiles of the dipalmitoylphosphatidylglycerol (DPPG) hydrocarbon chains obtained from MD simulations and 2H NMR experiments. The results of these simulations are also compared with the available experimental data: area per lipid, electron density profiles, and lipid chain conformations. A number of important structural parameters such as the bilayer thickness and the thickness of the hydrocarbon chain region, the mean number of C-D bonds in gauche conformations per lipid chain, and the lipid hydration number were obtained from the simulations.
Natural cerebrosides have a distribution of fatty acid chain lengths varying from 12 to 26 carbons (O'Brien and Rouser, 1964). In the present computer models, the GalCer is represented by the cerebroside lipid molecule having 18 carbons in the hydroxylated fatty acid chain. This particular lipid molecule is representative of natural cerebrosides, since it occurs rather abundantly (≈20%) in myelin membranes (O'Brien and Rouser, 1964).
MATERIALS AND METHODS
2H NMR
Sample preparation
Natural bovine brain cerebrosides composed of GalCer and the sodium salt of 1,2-dipalmitoyl-sn-glycero-3-phosphoglycerol deuterated in carbon positions 1-16 (di-16:0 DPPG d62) on the acyl chains were purchased from Avanti Polar Lipids (Alabaster, AL).
2H NMR measurements were performed on unoriented bilayers composed of GalCer:DPPG lipid mixtures. Initially DPPG and GalCer were dissolved separately in 2:1 chloroform:methanol and then mixed. The solvent was evaporated under a gentle nitrogen gas stream and then under reduced pressure for at least 10 h. The dry lipid mixture was fully hydrated at room temperature in excess (85% by weight) pH7 buffer, which contained 100 mM NaCl and 20 mM HEPES. The sample was frozen rapidly in liquid nitrogen, then thawed and vortexed at room temperature to get a uniform distribution of lipids throughout the sample. To remove excess water, the sample was centrifuged (4000 rpm, 5 min) at room temperature and the upper aqueous phase was gently removed. Only the hydrated pellet was used for NMR measurements. Two samples were prepared: a fully hydrated GalCer bilayer containing 10 mol % DPPG, and a fully hydrated GalCer bilayer containing 25 mol % DPPG.
Spectroscopy
The 2H NMR spectra were recorded at a Larmor frequency of 44.667 MHz on a homebuilt spectrometer at 80°C, which corresponds to the liquid crystalline phase of the samples. A quadrupole echo pulse sequence (90°)y-τqe-(90°)x-t-FID (90° pulse of 2.2 μs, τqe = 50 μs) with phase cycling was used to obtain the spectra. A recycle delay of ∼10 times the spin-lattice relaxation time was applied. After the second pulse, 2048 data points were collected using quadrature detection with a dwell time of 5 μs and a resulting spectral width of 200 kHz. Fourier transformation starting at the peak of the echo was applied without line broadening.
Deuterium order parameters from NMR experiments
In the case of an axially symmetric lipid motion, the ith C-D bond segment yields two symmetric resonance peaks with a quadrupole splitting of
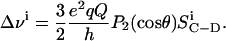 |
(1) |
In this equation, e2qQ/h is the static quadrupole coupling constant (167 kHz for a C-D bond; Davis, 1983), P2(cos θ) = 1/2(3 cos2 θ – 1) is the second rank Legendre polynomial, and θ is the angle between the bilayer normal and the static magnetic field. The value  is the C-D bond order parameter defined as (Seelig and Seelig, 1974)
 |
(2) |
where φi = φi(t) is the angle between the C-D bond vector and the bilayer normal at a time t. The angular brackets indicate a time average.
The measured 2H NMR spectrum is a powder pattern, because all orientations θ of the C-D bond vector, with respect to the magnetic field, are allowed. In this so-called Pake-powder spectrum (Davis, 1983), the separation between the symmetrical intense horns, denoted as the quadrupolar splitting of the ith C-D bond, is
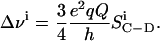 |
(3) |
A dePaking procedure (Bloom et al., 1981) can be applied to de-convolve the measured spectrum into subspectra (dePaked spectra) and obtain the order parameters for each C-D bond along the hydrocarbon chain. The dePaking procedure (Klose et al., 1999; Schäfer et al., 1995, 1998; Sternin et al., 2001a,b) that utilizes the Tikhonov Regularization algorithm (Groetsch, 1984) has been used. The deuterium order parameter profiles SC–D(n) (n is the position of the C-D bond along the lipid chain) for DPPG hydrocarbon chains were obtained from the dePaked spectra, assuming a monotonic decrease of the SC–D(n) along the chains following the procedure outlined by Sternin et al. (1988).
MD simulation
Force field
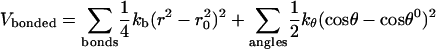
Computer simulations were performed using the 45A3 (Schuler et al., 2001) force field. This force field is a modified version of GROMOS96 with an improved set of van der Waals parameters, which better reproduces the density and area per lipid in a liquid crystalline bilayer (Chandrasekhar et al., 2003; Schuler et al., 2001). The bonded interactions in the GROMOS96 force field are given by
 |
(4) |
 |
(5) |
where kb, kθ, kφ, and kξ are force constants for bonds, angles, dihedrals, and improper dihedrals; n is the dihedral multiplicity; and r0, θ0, φ0, and ξ0 are equilibrium values for the bond lengths, angles, and dihedral and improper dihedral angles. Nonbonded interactions between atoms i and j are represented as
 |
(6) |
where qi, qj are the partial charges on atoms i, j; Aij, and Bij are the Lennard-Jones parameters; and rij is the distance between atoms i and j. The van der Waals parameters between different atoms were calculated using the combination rules Aij = (AiiAjj)2 and 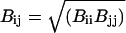 (Jorgensen et al., 1984).
Molecular topologies for GalCer and DPPG lipid molecules were developed to be compatible with the GROMOS96 force field. The topology files for the water molecule and the sodium ion were taken from the GROMOS96 database. Partial atomic charges for the GalCer and DPPG lipid molecules were derived based on ab initio quantum mechanical calculations. Firstly, the values of the electrostatic potential were calculated at the Hartree-Fock self-consistent field level with the 6-31Gd basis set at the points selected according to the Merz-Singh-Kollman scheme using the GAUSSIAN98 program. The partial atomic charges were obtained from these calculations by a least-square fitting to the electrostatic potential. The fitting procedure was performed using the RESP program (Bayly et al., 1993). The charges on the hydrogen atoms were added to their carbons in CH, CH2, and CH3 groups to form united atoms. The charge groups (Schuler et al., 2001) were selected as shown in Fig. 1. The atom types and partial atomic charges for the GalCer and DPPG lipid molecules used in computer simulations are listed in Tables 1 and 2.
FIGURE 1.

Molecular structures of DPPG and GalCer molecules with the atom names and charge groups used in the simulations. Numbers shown in italics refer to the order parameter calculations.
TABLE 1.
Atom types and charges for the DPPG lipid molecule used in the MD simulations
| Atom name | Atom type | Charge |
|---|---|---|
| H1 | H | 0.480053 |
| O2 | OA | −0.697421 |
| C3 | CH2L | 0.217368 |
| C4 | CH1L | 0.257724 |
| O5 | OA | −0.697421 |
| H6 | H | 0.439697 |
| C7 | CH2L | 0.091711 |
| O8 | OA | −0.408864 |
| P9 | P | 1.243417 |
| O10 | OM | −0.804328 |
| O11 | OM | −0.804328 |
| O12 | OA | −0.317608 |
| C13 | CH2L | 0.086967 |
| C14 | CH1L | 0.179114 |
| O15 | OA | −0.480634 |
| C16 | C | 0.824652 |
| O17 | O | −0.610099 |
| C18 | CH2L | 0.021667 |
| C19 | CH2L | −0.021667 |
| C33 | CH2L | 0.266081 |
| O34 | OA | −0.480634 |
| C35 | C | 0.824652 |
| O36 | O | −0.610099 |
| C37 | CH2L | 0.022832 |
| C38 | CH2L | −0.022832 |
| C20-C30, C39-C50 | CH2L | 0 |
| C32, C51 | CH3L | 0 |
TABLE 2.
Atom types and charges for the GalCer lipid molecule used in the MD simulations
| Atom name | Atom type | Charge |
|---|---|---|
| C6 | CH2L | 0.196304 |
| O6 | OA | −0.612944 |
| H6 | H | 0.416641 |
| C2 | CH1L | 0.171134 |
| O2 | OA | −0.612944 |
| H2 | H | 0.44181 |
| C4 | CH1L | 0.207987 |
| O4 | OA | −0.612944 |
| H4 | H | 0.404957 |
| C3 | CH1L | 0.187455 |
| O3 | OA | −0.612944 |
| H3 | H | 0.425489 |
| C5 | CH1L | 0.213274 |
| O5 | OA | −0.359297 |
| C1 | CH1L | 0.227574 |
| O1 | OA | −0.210196 |
| C7 | CH2L | 0.128645 |
| C8 | CH1L | 0.272562 |
| N1 | NE | −0.462555 |
| H1 | H | 0.263592 |
| C26 | C | 0.522444 |
| O8 | O | −0.596044 |
| C27 | CH1L | 0.21128 |
| O44 | OA | −0.612944 |
| H44 | H | 0.401664 |
| C9 | CH1L | 0.198709 |
| O7 | OA | −0.612944 |
| H7 | H | 0.414235 |
| C10 | CH1L | −0.019751 |
| C11 | CH1L | −0.038491 |
| C12 | CH2L | 0.058242 |
| C28 | CH2L | −0.031898 |
| C29 | CH2L | 0.031898 |
| C13-C23,C30-C42 | CH2L | 0 |
| C24,C43 | CH3L | 0 |
Simulation conditions
The integration of the equations of motion was performed with a time step of 2 fs using the leapfrog algorithm (Hockney, 1970). The LINCS algorithm (Hess et al., 1997) was used to constrain the length of all bonds. Periodic boundary conditions were applied along the three space dimensions to generate an infinite multilamellar system. A constant pressure of 1 bar was maintained using the Berendsen coupling method (Berendsen et al., 1984), scaling all directions separately with a time constant of 1.0 ps. The area compressibility was 6.0 × 10⁻⁵ bar−1 (Lindahl and Edholm, 2000b). A temperature of 80°C was maintained constant with the Berendsen coupling method (Berendsen et al., 1984) using a time constant of 0.1 ps. The gel-to-liquid crystalline phase transition temperature for DPPG is 41°C (Wohlgemuth et al., 1980) and for GalCer is 70°C (Maggio et al., 1985), therefore for the simulations the temperature of 80°C was chosen to ensure that the GalCer:DPPG lipid mixture was in a liquid crystalline phase. A twin-range cutoff of 1.0 nm/1.4 nm was applied for the van der Waals and Coulomb interactions. The interactions within 1.4 nm were recalculated every seven steps during the neighbor list update.
To examine the influence of the cutoff on the long-range Coulomb interactions we performed a simulation of the 25%-DPPG system using the particle-mesh Ewald method (Darden and Pedersen, 1993). The simulation was carried out for 4 ns starting from the equilibrated structure. As can be seen in Figs. 2 and 3 during the 4-ns simulation run, no significant changes were detected in the potential energy, area per lipid, and chain order parameters as compared to the simulation with a twin-range cutoff. This result disagrees with recently published investigations (Anezo et al., 2003; Patra et al., 2003). A possible explanation for the difference is the large size of the present simulation and the relatively short time of the particle-mesh Ewald test (4 ns).
FIGURE 2.

The potential energy as a function of time during 10 ns of the production run simulations.
FIGURE 3.

The area per lipid as a function of time during 10 ns of the production run simulations. The average area per lipid is 0.603 ± 0.004 nm2 in the 10%-DPPG system and 0.590 ± 0.004 nm2 in the 25%-DPPG system.
Deuterium order parameters from MD simulation
Because a united atom model was used for the CH, CH2, and CH3 groups in these simulations, the positions of the hydrogen atoms required for calculations of the C-D order parameters were not available directly. The value SC–D(n) were obtained from computer simulations using the program g_order from the GROMACS package, which determines SC–D(n) from the Cn–Cn–1 and Cn–Cn+1 vectors following the procedure defined by Egberts et al. (1994).
Computational details
Computer simulations of the lipid bilayer were carried out using the SHARCNET (http://www.sharcnet.ca) high-performance computer facility located at the University of Guelph Computer Center. Using 20 Compaq Alpha ES40 processors interconnected by a Quadrics network, 17 h/ns were required for the 10%-DPPG system, whereas 40 h/ns were required for the 25%-DPPG system. Simulations and analysis were performed using the GROMACS molecular dynamics package, Ver. 3.1.4. (Lindahl et al., 2001). Molecular structures were examined using the visual molecular dynamics program (http://www.ks.uiuc.edu/research/vmd).
RESULTS AND DISCUSSIONS
Preparation and equilibration of the simulation systems
Initial structure
The initial structure of the lipid bilayer in the liquid crystalline state was prepared starting with the x-ray crystal structure of the GalCer lipid molecule determined by Pascher and Sundell (1977). Starting from the atomic coordinates of the two GalCer crystal conformers, a 16a × 16b array was prepared by arranging GalCer molecules according to the symmetry of the crystal structure. The array contained 512 GalCer lipid molecules and represented a single monolayer. This monolayer was then used as the input for a short MD simulation run to break the crystal structure of the lipid chains. The temperature of the system was raised to 510 K for 20 ps (Takaoka et al., 2000), which effectively reduced the tilt of the GalCer lipid chains to nearly 0°. During this simulation the positions of the central carbon in the lipid backbone were fixed. Next, the GalCer-bilayer was constructed from two monolayers by rotating one of the monolayers by 180° and then adjusting the interlayer separation so that there was no overlap of adjacent lipid chains. At this step the energy of the system was minimized by using a steepest-descent algorithm to avoid close contacts between the opposing hydrocarbon chains.
The GalCer-bilayer was then used to prepare a lipid mixture of GalCer and DPPG lipid molecules. A number of the GalCer lipid molecules were randomly selected in each monolayer and transformed into DPPG by changing the atom names in the GalCer molecule to the atom names in the DPPG molecule; a few extra carbon atoms in the GalCer hydrocarbon chains were removed. Since the DPPG lipid molecule carries a negative charge, an equal number of sodium ions were added to the system as counterions. To complete the lipid transformation, the energy of the system was minimized by applying the steepest-descent algorithm. After this procedure, two simulation systems of the GalCer:DPPG lipid mixtures with the ratios of 9:1 (10%-DPPG system) and 3:1 (25%-DPPG system) were prepared.
The simple point-charge water model (Berendsen et al., 1981) was used to solvate the lipid bilayer. Water molecules were placed in the simulation system by using the genbox program from the GROMACS package, which fills all free space in the box including the hydrophobic chain region. The water molecules appearing in the hydrophobic region were removed from the simulation system. It takes up to 20 ns for water molecules to move out into the water region on their own (Takaoka et al., 2000). The number of water molecules added to the simulation boxes for the two systems was different. The system containing the GalCer:DPPG lipid mixture with the ratio 9:1 represents the bilayer in a collapsed state with 11 water molecules per lipid (Harvey and Symons, 1978; Kulkarni et al., 1999), and the system with the ratio 3:1 represents the bilayer in an expanded state with 49.7 water molecules per lipid (Kulkarni et al., 1999).
The final systems were composed of 922 GalCer, 102 DPPG, 102 sodium ions, and 11,849 water molecules for a total of 95,000 atoms in the 10%-DPPG system, and 768 GalCer, 256 DPPG, 256 sodium ions, and 50,963 water molecules for a total of 210,000 atoms in the 25%-DPPG system.
Equilibration
The potential energy, surface area per lipid, and volume per lipid were monitored to judge whether the systems had reached equilibrium. The first two nanoseconds in each simulation were discarded since this time period was considered the equilibration period for the systems. After the equilibration the trajectories were saved every 6 ps and the production run simulation was 10 ns in length for each system.
Fig. 2 shows the total potential energy as a function of time during the production run simulations. As seen, the total potential energy was stable with a standard deviation of <3%. The individual terms of the potential energy function (not shown) were also stable over the entire course of these simulations.
Fig. 3 shows the surface area per lipid as a function of time during the production run simulations. There were some oscillations of the area per lipid about the average values in both systems. The equilibrated box dimensions were 17.60 × 17.49 × 5.71 nm3 for the 10%-DPPG system, and 17.46 × 17.31 × 9.92 nm3 for the 25%-DPPG system.
In Fig. 4, snapshots of the simulation systems are presented at the end of the simulations. In both systems the lipid hydrocarbon chains are disordered, as expected in a liquid crystalline state bilayer. The density of the hydrocarbon chains is lower in the middle of the bilayer, which is consistent with the fact that the methyl groups at the ends of the hydrocarbon chains occupy substantially more volume per group than the methylene groups (Nagle and Wiener, 1988). Water molecules penetrate deep into the lipid headgroup region and a few water molecules were found to go in and out of the hydrophobic bilayer region in the course of the computer simulation. These observations are in agreement with experiments (Subezynski et al., 1994; Weaver et al., 1984) and previous MD simulations of phospholipid bilayers in the liquid crystalline phase (Chiu et al., 1995; Marrink and Berendsen, 1994; Takaoka et al., 2000; Tu et al., 1995). The sodium ions exhibit a wide distribution of positions in the water region in accordance with previous MD simulations of charged lipid bilayers (Cascales et al., 1996a,b; Cascales and de la Torre, 1997). Both systems show a tendency for bilayer undulations. This type of collective bilayer movement is a characteristic feature of lipid bilayer dynamics (Israelachvili and McGuiggan, 1988; Israelachvili and Wennerström, 1992; Singer and Nicolson, 1972). Bilayer undulations were observed and analyzed by Lindahl and Edholm (2000a) in an MD simulation of 1024 DPPC lipid molecules arranged in a bilayer in its liquid crystalline phase.
FIGURE 4.

Snapshots of the complete systems at the end of the simulations in the 10%-DPPG system (top panel) and the 25%-DPPG system (bottom panel). (Color code: the headgroups of GalCer are white; the headgroups of DPPG are blue; the hydrocarbon chains of GalCer are dark yellow; the hydrocarbon chains of DPPG are lighter yellow; the red spheres are sodium ions; and the water oxygen atoms are gray.)
Static properties
Area per lipid
One of the central parameters in describing the lipid bilayer is the area per lipid, A. The area per lipid shown in Fig. 3 was calculated by dividing the area of the simulation box in x,y-plane by the total number of lipids in a monolayer. This method gives a correct value of A only if the simulated lipid bilayer is a one-component system, but for a two-component lipid bilayer this method might lead to significant uncertainties for an individual bilayer component (Petrache et al., 1997). The area per GalCer lipid molecule was obtained from a separate computer simulation of the pure GalCer bilayer. This simulation was performed at the same temperature and under the same conditions as the simulations of the GalCer:DPPG lipid mixtures. The simulation system was composed of 1024 GalCer lipid molecules and 50,963 water molecules. The length of the production run simulation of the pure GalCer bilayer reached 5 ns and the calculated area was AGalCer = 0.608 ± 0.011 nm2. The starting area per GalCer molecule in the crystal structure was 0.519 nm2 (Pascher and Sundell, 1977). From the simulations of the GalCer:DPPG lipid mixtures the average values of the surface area (Aav) were obtained, which were 0.603 ± 0.004 nm2 and 0.590 ± 0.004 nm2 for the 10%-DPPG system and the 25%-DPPG system, respectively. Based on these results, the conclusion is that the area per lipid calculated from the pure-GalCer simulation and simulations of the GalCer:DPPG lipid mixtures are the same within the error limits. These results also suggest that the area per DPPG molecule at 80°C does not differ significantly from the area per GalCer molecule. As a point of reference, in a pure DMPG bilayer in its liquid crystalline phase, the area per lipid headgroup was 0.62 ± 0.02 nm2 (Marra, 1986).
Using x-ray diffraction, Reiss-Husson (1967) determined the surface area per GalCer molecule in a pure GalCer bilayer to be 0.67 nm2 at 72°C. The value of the area per GalCer lipid obtained from our computer simulation (0.608 ± 0.011 nm2) is lower than the above mentioned experimental values (0.67 nm2). The experimental method used to determine AGalCer was based on the weighing of the known amounts of water and lipid and determining the bilayer period using x-ray diffraction analysis. There are systematic errors associated with this method that are difficult to estimate, as can be judged by the range of values quoted for a liquid crystalline DPPC lipid bilayer (0.57 nm2–0.709 nm2; Nagle and Wiener, 1988). It has been noted that this method tends to overestimate the A-value due to the systematic error introduced by the lipid bilayer undulations in the liquid crystalline phase (Nagle and Tristram-Nagle, 2000).
Electron density profiles and the bilayer thickness
Electron density profiles were obtained by calculating the electron density in 0.05-nm-thick slices perpendicular to the bilayer normal (z-direction of the simulation boxes) and averaged over all frames in the production run trajectory.
The profiles for the 10%-DPPG system are plotted in Fig. 5, a and b, and profiles for the 25%-DPPG system are plotted in Fig. 5, c and d. Fig. 5, a and c, shows the profiles for the entire DPPG, water, and sodium ions as well as the contributions from the DPPG headgroup (phosphate P9), chain methyl groups (carbons C32, C51), and the glycerol ester groups (carbons C16, C35). In both simulation systems the two peaks in the overall DPPG profiles coincide with the glycerol ester carbons (C16, C35). The dip in the middle of the bilayer corresponds to the methyl carbons (C32, C51) located at the end of the DPPG hydrocarbon chains. The region between the dip and the peaks is occupied by the methylene groups and the region at the outer edges of each profile is filled with the bulk water between opposing bilayers. Water molecules were found to surround the headgroups and to penetrate the hydrocarbon region up to the ester carbons. This observation is consistent with previous experiments (Blume et al., 1988; Wong and Mantsch, 1988) and simulations (Berger et al., 1997; Chiu et al.,1995; Marrink et al., 1993; Tu et al., 1995; Zubrzycki et al., 2000). The maximum of the sodium ion distribution is localized near the phosphorus atoms and its density decreases in the bulk water region. The ions were found to penetrate into the DPPG headgroup region up to the lipid backbone, but not into the lipid hydrocarbon region. Fig. 5, b and d, shows the profiles for the whole GalCer lipid molecule and the contributions of the selected groups: namely the methyl groups (carbons C24, C43), the ester group (carbon C26), the carbon C10, and the oxygen O1. The two peaks in the GalCer profile coincide with the location of the ester carbon C26 and carbon C10, and the valley in the bilayer center corresponds to the methyl carbons (C24, C43) at the end of GalCer chains.
FIGURE 5.

Electron density profiles from the MD simulation for the 10%-DPPG system are shown in a and b, and for the 25%-DPPG system in c and d. The orientation of the water dipole about the bilayer normal (〈cos(θ)〉) with z = 0 corresponds to the location of the bilayer center is shown in e. The electron density profiles are included in a and b for the entire DPPG molecule, the water molecules, the sodium ions, and the following selected atoms: P9, C16, C35, C32, and C51, and in c and d for the entire GalCer molecule and the following selected atoms: O1, C10, C26, C24, and C43. The symbol dh denotes the hydrocarbon chain region, the plus or minus symbols denote the regions with opposite orientations of the water dipole.
From the density profiles in Fig. 5, a and c, the thickness of the lipid hydrocarbon region, dh, can be measured as the distance between the two symmetrical peaks of the C16 or C35 profile. The dh was found to be 3.48 ± 0.05 nm and 3.28 ± 0.05 nm for the 10%-DPPG and 25%-DPPG systems, respectively. From these values the average chain length was determined to be 〈L〉 = 1.74 nm (half of dh) for the 10%-DPPG system and 1.64 nm for the 25%-DPPG system. To estimate the bilayer thickness, we measured the distance between the two symmetrical peaks corresponding to the positions of the phosphorus atoms (P9) in the opposing bilayer leaflets. For both simulated systems this distance was 4.21 ± 0.05 nm. It is of interest to compare this value with the 4.19 ± 0.06 nm, read from the experimental electron density profiles for the liquid crystalline DPPC lipid bilayer at room temperature (McIntosh and Simon, 1986).
Comparing the overall DPPG and GalCer profiles for the 10%-DPPG and 25%-DPPG systems, one can notice that the dip in the middle of the bilayer is slightly sharper and deeper in the 25%-DPPG system (Fig. 5, c and d) than in the 10%-DPPG system (Fig. 5, a and b). At the first glance, this might indicate that the hydrocarbon chains in 10%-DPPG system were more disordered than in the 25%-DPPG system. However, the thickness of the hydrocarbon region is smaller in the 25%-DPPG system, which is indicative of greater disorder in the chain region. A larger percentage of trans-gauche isomerization leads to shorter effective chain lengths in general.
Lipid-water interface: hydrogen-bond formation
The spherically averaged radial distribution functions (RDF values) of the oxygen atoms in the water molecules surrounding the lipid oxygen atoms of the GalCer and DPPG molecules were calculated using the equation
 |
(7) |
where N(r) is the number of atoms in a spherical shell at distance r and thickness δr from a reference oxygen atom. The value ρ is the number of atoms-per-unit volume of the computing box.
The RDF values calculated for the DPPG and GalCer oxygen atoms in 25%-DPPG system were used as a representative data set and are displayed in Fig. 6. The RDF values have the typical shape seen previously in other lipid bilayer simulations (Cascales and de la Torre, 1997; Liu and Brady, 1996; Marrink and Berendsen, 1994; Pasenkiewicz-Gierula et al., 1997) with peaks and valleys reflecting a non-uniform distribution of water density. The characteristic peaks represent the hydration shells formed by water molecules around the lipid oxygen atoms. Fig. 6 (top) shows the RDF values calculated for the hydroxyl oxygens (O2, O5), ester (O8, O12) and non-ester (O10, O11) phosphate oxygens on the DPPG headgroup, and for the acyl (O15, O34) and carbonyl oxygens (O17, O36) at the beginning of the DPPG hydrocarbon chains. Fig. 6 (bottom) shows the RDF values calculated for the hydroxyl sugar oxygens (O2, O3, O4, O6) and the ring sugar oxygen (O5) on the GalCer headgroup, for the carbonyl (O8) and hydroxyl oxygens (O7, O44) at the GalCer fatty acid and sphingosine chains.
FIGURE 6.

Radial distribution functions for the water oxygens around the lipid oxygens of DPPG and GalCer lipid molecules. For the DPPG molecule the RDF values of the following oxygens are shown: hydroxyl oxygens, O2, O5; headgroup ester oxygens, O8, O12; headgroup non-ester oxygens, O10, O11; acyl oxygens, O15, O34; and carbonyl oxygens, O17, O36. For the GalCer molecule the RDF values of the following oxygens are shown: hydroxyl sugar oxygens, O2, O3, O4, O6; the ring sugar oxygen, O5; carbonyl oxygen, O8; hydroxyl oxygens, O7, O44; and oxygen O1.
The RDF values for the DPPG oxygen atoms revealed that the ordering of the water molecules is largest (peaks at ≈0.27–0.28 nm) around the hydroxyl oxygens, non-ester phosphate oxygens in the headgroup region, and around the carbonyl oxygens. The acyl oxygens of the ester linkage between the fatty acid chains and the glycerol show no contribution to the hydration. This is in agreement with the results obtained from MD simulations of DMPC (Pasenkiewicz-Gierula et al., 1997) and DPPC (Marrink and Berendsen, 1994) lipid bilayers in water. There is also a weak and broad second peak in the RDF of DPPG oxygens O2, O5, O10, O11 in the region between 0.4 and 0.6 nm. Second peaks in the RDF of lipid-water pairs were also detected in the previous MD simulation of DPPC in water (Marrink and Berendsen, 1994) and were interpreted as the second hydration shells of water around the lipid headgroups. For GalCer oxygen atoms, the primary hydration shells are clearly defined for all oxygens, except for the O5 sugar ring oxygen and O1 oxygen. The primary hydration shells of the GalCer hydroxyl oxygens are located between 0.27 and 0.28 nm. This is in agreement with the data from the MD simulation of sugar molecules in aqueous solution by Liu and Brady (1996). As in the case of DPPG, a second set of RDF peaks are also observed for some GalCer oxygens. The second peak in the water density around the sugar hydroxyl oxygens is very broad and located in the range from 0.4 to 0.6 nm. However, due to the regular ring structure of the sugar unit there is an alternative explanation for the second RDF peak in case of sugar hydroxyl oxygens (Liu and Brady, 1996). As the hydroxyl groups in the sugar ring are periodically repeating with a repeat period of ∼0.3 nm, the RDF of water around hydroxyl groups is expected to have an oscillatory behavior with the second RDF peak of any sugar hydroxyl oxygen arising from the primary hydration shells of its closest neighboring sugar hydroxyl oxygens. Therefore, the strong peak observed in the RDF of oxygen O5 centered at 0.58 nm originates from the primary hydration shells of the hydroxyl oxygens.
The results obtained from the RDF values are consistent with the fact that the lipids can form H-bonds with water. The number of H-bonds can be calculated on the basis of the following geometrical criteria (Pasenkiewicz-Gierula et al., 1997): the distance between the water oxygen and the lipid oxygen must be ≤0.325 nm and the angle between the lipid oxygen, water oxygen, and one of the hydrogen bonds of the water must be ≤35°. Table 3 lists the number of hydrogen bonds formed by the individual oxygen atoms in DPPG and GalCer lipid molecules with the surrounding water. Each GalCer molecule makes 8.6 ± 0.1 H-bonds with water and each DPPG molecule 8.3 ± 0.1 H-bonds. Table 3 compares the number of H-bonds between individual DPPG oxygens and water with those numbers reported in literature for DMPC (Pasenkiewicz-Gierula et al., 1997) and DLPE (Berkowitz and Raghavan, 1991). The non-ester phosphate oxygens are involved in most of the hydrogen bonding, whereas the ester phosphate lipid oxygens show only a minor contribution. The difference in the H-bond numbers for individual lipid oxygens of DPPG and DMPC molecules can be explained by the high temperature of the present simulation. The total number of H-bonds for the DPPG molecule (8.3 ± 0.1) is large as compared to that for the DMPC molecule (4.5 ± 0.2) due to the contribution from the PG-headgroup oxygens (O2 and O5), which make, on average, 1.8 + 1.7 = 3.5 extra H-bonds. The formation of the H-bonds between GalCer or DPPG lipid molecules and water provides strong support for the experimental data indicating the existence of a significant water-lipid interaction (Boggs, 1986; Lee et al., 1986; Rand et al., 1988; Skarjune and Oldfield, 1982).
TABLE 3.
The number of H-bonds between the DPPG or GalCer oxygen atoms and the water molecules determined from the present simulation; for comparison, the data for DMPC (Pasenkiewicz-Gierula et al., 1997) and DLPE (Berkowitz and Raghavan, 1991) are given
| No. of H-bonds
|
No. of H-bonds GalCer*
|
||||
|---|---|---|---|---|---|
| Lipid oxygen | DPPG* | DMPC | DLPE | Lipid oxygen | |
| Headgroup O2 | 1.8 | — | — | Sugar O2 | 1.3 |
| Headgroup O5 | 1.7 | — | — | O3 | 1.6 |
| Non-ester phosphate O10 | 1.4 | 1.7 | — | O4 | 1.3 |
| Non-ester phosphate O11 | 1.4 | 1.8 | — | O6 | 1.5 |
| Ester phosphate O8 | 0.3 | 0.1 | — | Hydroxyl O7 | 0.9 |
| Ester phosphate O12 | 0.2 | 0.2 | — | O8 | 0.7 |
| Carbonyl O17 | 0.8 | 0.4 | — | O44 | 0.9 |
| Carbonyl O36 | 0.7 | 0.3 | — | Sugar-ring O5 | 0.2 |
| — | Connecting O1 | 0.2 | |||
| Total no. H-bonds with water | 8.3 ± 0.1 | 4.5 ± 0.2 | 3–3.5 | Total no. H-bonds with water | 8.6 ± 0.1 |
Our simulation.
The number of bound water molecules per lipid molecule was obtained from an analysis of the RDF values displayed in Fig. 6 by calculating the cumulative number of water molecules within the first hydration shell. The average number of bounded water molecules was 10–11 per DPPG or GalCer molecule. From NMR measurements it was estimated that 10–11 waters are required to hydrate the sugar molecule (Harvey and Symons, 1978), whereas 10–16 waters are required to hydrate the phospholipids (Borle and Seelig, 1983). Our data are within the range obtained in the above mentioned experiments.
A number of experimental studies (Borle and Seelig, 1983; Rand et al., 1988) as well as the theoretical work of Marceljia and Radic (1976) suggest that water molecules are ordered near the lipid headgroups. To demonstrate the effect of water ordering in the present simulations, the orientational profile of the water dipole along the bilayer normal (z-direction) was calculated. Fig. 5 e plots 〈cos(θ)〉 for the water dipole as a function of the z coordinate in 25%-DPPG system. The electron density profiles show that the hydrocarbon chain region extends from −1.6 nm to 1.6 nm. The peaks centered at −2.5 nm and 2.5 nm in the 〈cos(θ)〉 plot coincide with the positions of the lipid headgroups and indicate that ordering of the water dipoles takes place in this region. These water molecules are ordered by the hydrogen bonding with the lipid oxygens. There are two regions with different signs of 〈cos(θ)〉, denoted with plus (+) and minus (−) symbols. These regions correspond to the opposite orientations of the water dipole in the two interfacial regions (Arnold et al., 1983).
Intermolecular H-bonds
The formation of the intermolecular H-bonding between the hydroxyl groups from the opposing GalCer sugar units was observed in the 10%-DPPG system where there is a narrow water layer between the lipid bilayers. Using the g_hbond program from the GROMACS package and the geometrical criteria described above, the number of sugar-sugar intermolecular H-bonds as a function of time was calculated. The main contribution to the intermolecular H-bonding was from the opposing GalCer sugar headgroups, whereas other hydroxyl groups as well as the nitrogen atom play minor roles. Based on the results, the average number of the intermolecular H-bonds formed between hydroxyl sugar groups was 15. Assuming that each H-bond contributes 3–10 kcal/mol (Joesten and Schaad, 1974), the energy of adhesion due to the direct H-bonding between opposing GalCer sugar headgroups was estimated to be in the range between −1.0 and −3.4 erg/cm2. Considering the possibility of the indirect H-bonding via water bridges (Marceljia and Radic, 1976; Rand et al., 1988), it is expected that the actual adhesion due to the interbilayer H-bonding is even greater than this estimate.
It is of interest to compare the simulated and experimentally measured adhesion energies. The net adhesion energy between GalCer bilayers in the gel phase measured with the x-ray diffraction/osmotic stress techniques was determined to be −1.5 erg/cm2 (Kulkarni et al., 1999). For bilayers composed of a mixture of ditridecanoylphosphatidylcholine containing 30 mol % LacCer in its liquid crystalline phase, the adhesion force was determined to be −3.5 ± 0.5 mN/m (Yu et al., 1998), which corresponds to an adhesion energy of −0.56 ± 0.08 erg/cm2 (Marra and Israelachvili, 1985). Unfortunately, experimental data is available only for the net adhesion energy, which includes contributions from the interbilayer H-bonding, van der Waals, electrostatic, and other interactions. The present simulations do not allow us to determine the net adhesion energy. However, the H-bond energy obtained from our MD simulations is similar to the experimentally measured net adhesion between GalCer bilayers or LacCer bilayers, suggesting that H-bonding is one of the main components of the interaction energy.
Because of the fast axial reorientation and lateral diffusion of the GalCer molecules in the liquid crystalline phase, the intermolecular H-bonds between the GalCer molecules cannot have a long lifetime. In addition, thermal fluctuations of the bilayer thickness in the liquid phase give rise to steric repulsion (Israelachvili and Wennerström, 1992), which might weaken the strong attractive contribution due to the H-bond adhesion. To satisfy the dynamic nature of the lipid molecules, the H-bonds between two GalCer molecules must be easily broken and then re-formed with other GalCer molecules. Interestingly, it has been noted that the lifetime of the H-bonds in water should be on the order of 10−11 s (Boggs, 1986). In the gel phase, where bilayer fluctuations are suppressed and the molecules have a more restricted motion, one would expect the intermolecular hydrogen-bond lifetime to be longer. The presence of the H-bonding is thought to be responsible for the high temperature of the gel to the liquid crystalline phase transition. It has been estimated that one H-bond for every 40 molecules results in an increase in phase transition temperature of ∼12°C (Nagle, 1976). Natural sphingolipids have a high transition temperature in the range of 70°C–90°C (Haas and Shipley, 1995; Moore et al., 1997), suggesting that intermolecular hydrogen bonding occurs in the presence of water and stabilizes the gel phase relative to the liquid crystalline phase. At physiological temperature, the myelin membranes are considered to be liquid crystalline or possibly raftlike liquid-ordered (J. Boggs, personal communication). Although no experimental evidence is available to prove it, one can expect that the myelin membranes would be more ordered than most biological membranes due to the high content of sphingolipids and cholesterol. If phase separation of the sphingolipids were to occur, some gel phase domains might form. The question of the strength and duration of the hydrogen bonds between carbohydrates in the gel and the liquid-crystalline phases could possibly be answered from future MD simulations.
Lipid chain order
Conformational analysis
One measure of the disorder in the lipid bilayer is the mean number of gauche conformations per lipid hydrocarbon chain, ng. The conformation is assigned gauche+ (g+) if it has a dihedral angle in the range 120 ± 60°; gauche− (g−) with a dihedral angle in the range −120 ± 60°; and trans with a dihedral angle in the range 0 ± 60°.
For the liquid crystalline DPPC bilayer, ng is in the range from 3.6 to 4.2 (at 48°C) based on the IR spectroscopy (Mendelsohn et al., 1989) and 3–6 (at 50°C) from 2H NMR measurements by Seelig and Seelig (1974). The ng from the present simulations is 6.17 and 5.85 for the sn1 and sn2 chains of the DPPG molecule, respectively, and 4.44 and 4.76 for the sphingo and fatty acid chains of the GalCer molecule, respectively (see Table 4). The fact that ng for the DPPG molecules is close to the high end of the experimental range can be explained by the high temperature of the present simulation. Table 4 also shows that the percentage of trans conformations in both the DPPG and GalCer molecules decreases toward the terminal methyl group of the lipid hydrocarbon chains, as expected from the increasing disorder along the chains.
TABLE 4.
Statistics of the lipid chain conformations from present MD simulations and comparison with experimental data: 2H NMR (Seelig and Seelig, 1974) and IR (Mendelsohn et al., 1989) studies
| Lipid | Chain, dihedral | % trans | ng* | ng, 2H NMR, DPPC | ng, IR, DPPC |
|---|---|---|---|---|---|
| DPPG | sn1, C35-C37-C38-C39 | 61 | Sn1: 6.17 | 3–6 | 3.6–4.2 |
| sn1, C48-C49-C50-C51 | 44 | ||||
| sn2, C16-C18-C19-C20 | 64 | Sn2: 5.85 | 3–6 | 3.6–4.2 | |
| sn2, C29-C30-C31-C32 | 46 | ||||
| GalCer | Sphingo, C10-C11-C12-C13 | 80 | Spingo chain: 4.44 | — | — |
| Sphingo, C21-C22-C23-C24 | 46 | ||||
| Fatty acid, C27-C28-C29-C30 | 89 | Fatty acid chain: 4.76 | — | — | |
| Fatty acid, C40-C41-C42-C43 | 43 |
Our simulation.
Comparison of the SC–D obtained from 2H NMR experiments and MD simulations
Experimentally determined deuterium order parameter profiles of the DPPG palmitoyl chains were obtained from the dePaked spectra based on the measured 2H NMR spectra, according to the procedure described in Materials and Methods.
In Fig. 7 the measured 2H NMR spectra and the corresponding dePaked spectra are shown. The two 2H NMR spectra exhibit characteristic Pake-powder patterns with a difference between the maximum values of the quadrupole splitting of 27.9 kHz and 25.3 kHz. From the dePaked spectra the order parameters for each carbon along the DPPG palmitoyl chains were assigned.
FIGURE 7.

Experimental 2H NMR and dePaked spectra of fully deuterated palmitoyl chains of DPPG, obtained from the two unoriented samples with different DPPG content. (a) 90 mol % GalCer plus 10 mol % DPPG and (b) 75 mol % GalCer plus 25 mol % DPPG. The tickmarks on the dePaked spectra represent the assigned order parameters as described in the text. The carbons are labeled starting from the lipid backbone.
Fig. 8 compares the simulated and experimental order parameter profiles SC–D(n) of the DPPG palmitoyl chains in the 10%-DPPG and the 25%-DPPG systems. The profiles obtained from MD simulations are the result of averaging over the sn1 and sn2 palmitoyl chains and over the 10 ns of the production run simulation. The averaging over the two lipid chains was necessary to allow a direct comparison with experiments. The simulated and the experimental profiles exhibit similar smooth characteristic patterns. A relatively broad plateau stretches over the first 5–6 methylene groups followed by a monotonic decrease in the order parameters approaching the methyl group. The decrease in the profiles is due to the greater motional freedom of methylene groups toward the end of the hydrocarbon chains. Under our experimental conditions, the quadrupole splittings of the first six methylene groups of the palmitoyl chains could not be resolved and we cannot unambiguously determine the order parameter values associated with these carbons. Therefore, for the first six carbons in the plateau region, the average values equal to 〈0.23〉 (the 10%-DPPG system) and 〈0.22〉 (the 25%-DPPG system) were assigned.
FIGURE 8.

Comparison of simulated and experimental deuterium order parameters for palmitoyl chains of DPPG in the 10%-DPPG system (top panel) and the 25%-DPPG system (bottom panel). In the experimental order parameter profiles the marked region represents unresolved values. The error bars are smaller than the size of the plotting symbols.
The agreement between simulation and experiment is very good. Both simulations yield slightly higher-order parameter values in the central region, whereas in the end region the agreement is within experimental error (carbons C13, C14 in the 10%-DPPG system, carbon C15 in the 25%-DPPG system). The average deviation from the experimental values for the 10%-DPPG system and for the 25%-DPPG system are 0.007, 0.019, i.e., 3.6% and 9.4%, respectively. This result suggests that both simulations are able to reproduce the average structure of the DPPG hydrocarbon chains, especially when the differences in the conformation statistics and time averaging between experimental and simulation data are taken into consideration.
The MD simulations allowed us to perform a more detailed analysis of the order parameters. The order parameter profiles shown in Fig. 9 were calculated for each chain of the DPPG and GalCer molecules. Simulations predict slightly higher-order parameter values for the GalCer chains than for the DPPG chains in the plateau region. In the plateau region, the order parameter values alternate between odd and even carbon numbers. This behavior, known as the odd-even effect, was previously observed in a study of a phospholipid bilayers (Douliez et al., 1995, 1996). The results from our MD simulation show that in the DPPG molecule, only the sn2 chains show the alternating behavior in the plateau region, whereas the sn1 chain demonstrates a smooth profile. This observation supports the idea that the two hydrocarbon chains of the phospholipid are not equivalent. The difference between the two lipid chains became evident when 2H NMR experiments were performed on selectively deuterated hydrocarbon lipid chains (Seelig and Seelig, 1974). The use of two perdeuterated lipid chains does not allow the observation of the difference between the two chains. A comparison of the order parameter profiles obtained for DPPG palmitoyl chains in the 10%-DPPG and the 25%-DPPG systems (Fig. 9) suggests that the lipid-chain order/disorder has little connection with the collapsed-expanded system transition.
FIGURE 9.

Simulated deuterium order profiles for DPPG hydrocarbon chains (top panel) and for GalCer hydrocarbon chains (bottom panel).
It should be noted that 2H NMR measurements were performed using natural cerebrosides. Naturally occurring cerebrosides are often highly asymmetric with a distribution of the fatty acid chain length ranging from 12 to 26 carbons (O'Brien and Rouser, 1964). The predominant α-hydroxylated fatty acid is 18 or 24 carbons long without any double bond (C18h:0 and C24h:0). The nonhydroxylated fatty acid contains mostly 24 carbons with one unsaturated carbon bond (C24:1). The sphingosine chain is only 18 carbons long and penetrates into the bilayer to a depth of 13 or 14 carbons (Dahlen and Pascher, 1979). This accumulation of the long fatty chain cerebrosides in natural membranes has important consequences. The chain asymmetry may lead to the formation of regions interdigitating across the bilayer or to the protrusion of the carbohydrate headgroup above the membrane surface and also to a partial exposure of the acyl chain region. The latter may result in an increased interaction between the bilayers across the water region and possibly greater intermolecular hydrogen bonding could occur. The effect of hydroxylation of the long fatty acid chain may also promote the adhesion by its participation in hydrogen bonding. In the present computer model the cerebrosides are represented by GalCer lipid molecules having a C18h:0 fatty acid chain. The chains of the GalCer lipid may not be sufficiently asymmetric in the chain length to observe the effect of chain interdigitation. Therefore, in the future it would be of interest to create a computer model with GalCer molecules having a distribution of long fatty chain lengths to reproduce a natural asymmetry of the chains. Such a simulation would help to resolve the question about the chain interdigitation and/or the possible difference in the number of hydrogen bonds across the water region.
CONCLUSIONS
Force-field topologies have been developed for the GalCer and DPPG molecules that are compatible with the GROMOS96 force field. Using this force field, two large bilayer systems of GalCer:DPPG lipid mixtures in the compact (collapsed) and expanded states have been simulated. This is the first MD simulation of the lipid mixture composed of glyco- (GalCer) and phospho- (DPPG) lipids. Both simulations were successful and yield results that agree with experimental observables, such as the deuterium order parameters of the lipid chains, the surface area per lipid, the bilayer thickness, and the thickness of the chain region. It would be of interest to further compare the electron density profiles obtained from our MD simulations with those from detailed diffraction experiments.
The interaction of water with the GalCer and DPPG oxygen atoms resulted in a strong water ordering via a spherical hydration shell and the formation of H-bonds. The computer simulations suggest that each GalCer lipid molecule makes 8.6 ± 0.1 H-bonds with water and each DPPG lipid molecule 8.3 ± 0.1. From the RDF values the number of water molecules required to hydrate the lipid was calculated to be 10–11 per GalCer or DPPG lipid molecule. The formation of H-bonds provides strong support for the experimentally observed lipid-water interactions.
New information was obtained in this study regarding the origin of the large adhesion energy between GalCer bilayers. We found that the main difference between the collapsed and expanded state bilayers was the formation of the direct H-bonds between hydroxyl groups from the opposing GalCer lipid molecules in the collapsed state. By calculating the number of H-bonds between opposing bilayers in the collapsed state system, the energy of adhesion due to sugar-sugar H-bonding was estimated to be in the range between −1.0 and −3.4 erg/cm2. We suggest that this value is the contribution of the H-bond component of the net adhesion energy between GalCer bilayers in the liquid crystalline phase.
A detailed investigation of the dynamics of GalCer:DPPG lipid bilayer on a longer timescale is currently in progress.
Acknowledgments
The major part of our MD simulations was performed using the SHARCNET facilities located at the University of Guelph computer center.
References
- Anezo, C., A. H. de Vries, H.-D. Holtje, D. P. Tieleman, and S.-J. Marrink. 2003. Methodological issues in lipid bilayer simulations. J. Phys. Chem. B. 107:9424–9433. [Google Scholar]
- Arnold, K., L. Pratsch, and K. Gawrisch. 1983. Effect of poly(ethyleneglycol) on phospholipid hydration and polarity of the external phase. Biochim. Biophys. Acta. 728:121–128. [DOI] [PubMed] [Google Scholar]
- Ballou, L. R., S. J. K. Laulederkind, E. F. Rosloniec, and R. Raghow. 1996. Ceramide signaling and the immune response. Biochim. Biophys. Acta. 1301:273–287. [DOI] [PubMed] [Google Scholar]
- Bayly, C. I., P. Cieplak, W. D. Cornell, and P. A. Kollman. 1993. A well-behaved electrostatic potential based method using charge restraints for deriving atomic charges: the RESP model. J. Phys. Chem. 97:10269–10280. [Google Scholar]
- Bektas, M., and S. Spiegel. 2004. Glycosphingolipids and cell death. Glycoconj. J. 20:39–47. [DOI] [PubMed] [Google Scholar]
- Berendsen, H. J. C., J. P. M. Postma, W. F. Gunsteren, and J. Hermans. 1981. Interaction models for water in relation to protein hydration. In Intermolecular Forces. B. Pullman. Reidel, Dordrecht, The Netherlands, 331–342.
- Berendsen, H. J. C., J. P. M. Postma, A. DiNola, and J. R. Haak. 1984. Molecular dynamics with coupling to an external bath. J. Chem. Phys. 81:3684–3690. [Google Scholar]
- Berger, O., O. Edholm, and F. Jähnig. 1997. Molecular dynamics simulations of a fluid bilayer of dipalmitoylphosphatidylcholine at full hydration, constant pressure and constant temperature. Biophys. J. 72:2002–2013. [DOI] [PMC free article] [PubMed] [Google Scholar]
- Berkowitz, M. L., and K. Raghavan. 1991. Computer simulation of a water/membrane interface. Langmuir. 7:1042–1044. [Google Scholar]
- Blitterswijk, W. J., A. H. Van Der Luit, R. J. Veldman, M. Verheij, and J. Borst. 2003. Ceramide: second messenger or modulator of membrane structure. Biochem. J. 369:199–211. [DOI] [PMC free article] [PubMed] [Google Scholar]
- Bloom, M., J. H. Davis, and A. L. MacKay. 1981. Direct determination of the oriented sample NMR spectrum from the powder spectrum for systems with local axial symmetry. Chem. Phys. Lett. 80:198–202. [Google Scholar]
- Blume, A., W. Hübner, and G. Messner. 1988. Fourier transform infrared spectroscopy of 13C=O-labeled phospholipids hydrogen bonding to carbonyl groups. Biochemistry. 27:8239–8249. [DOI] [PubMed] [Google Scholar]
- Boggs, J. M. 1986. Lipid intermolecular hydrogen bonding: influence on structural organization and membrane function. Biochim. Biophys. Acta. 906:353–404. [DOI] [PubMed] [Google Scholar]
- Boggs, J. M., H. Wang, W. Gao, D. N. Arvanitis, Y. Gong, and W. Min. 2004. A glycosynapse in myelin? Glycoconj. J. 21:97–110. [DOI] [PubMed] [Google Scholar]
- Borle, F., and J. Seelig. 1983. Hydration of Escherichia coli lipids. Deuerium T1 relaxation time studies of phosphatidylglycerol, phosphatidylethanolamine and phosphatidylcholine. Biochim. Biophys. Acta. 735:131–136. [DOI] [PubMed] [Google Scholar]
- Bosio, A., E. Binczek, and W. Stoffel. 1996. Functional breakdown of the lipid bilayer of the myelin membrane in central and peripheral nervous system by disrupted galactocerebroside synthesis. Proc. Natl. Acad. Sci. USA. 93:13280–13285. [DOI] [PMC free article] [PubMed] [Google Scholar]
- Bucior, I., and M. M. Burger. 2004. Carbohydrate-carbohydrate interaction as a major force initiating cell-cell recognition. Glycoconj. J. 21:111–123. [DOI] [PubMed] [Google Scholar]
- Cascales, J. J. L., J. G. de la Torre, S. J. Marrink, and H. J. C. Berendsen. 1996a. Molecular dynamics simulation of a charged biological membrane. J. Chem. Phys. 104:2713–2720. [Google Scholar]
- Cascales, J. J. L., H. J. C. Berendsen, and J. G. de la Torre. 1996b. Molecular dynamics simulation of water between two charged layers of dipalmitoylphosphatidylserine. J. Phys. Chem. 100:8621–8627. [Google Scholar]
- Cascales, J. J. L., and J. G. de la Torre. 1997. Effect of lithium and sodium ions on a charged membrane of dipalmitoylphosphatidylserine: a study by molecular dynamics simulation. Biochim. Biophys. Acta. 1330:145–156. [DOI] [PubMed] [Google Scholar]
- Chandrasekhar, I., M. Kastenholz, R. D. Lins, C. Oostenbrink, L. D. Schuler, D. P. Tieleman, and W. F. van Gunsteren. 2003. A consistent potential energy parameter set for lipids: dipalmitoylphosphatidylcholine as a benchmark of the GROMOS96 45a3 force field. Eur. Biophys. J. 32:67–77. [DOI] [PubMed] [Google Scholar]
- Chiu, S. W., M. Clark, V. Balaji, S. Subramaniam, H. L. Scott, and E. Jakobsson. 1995. Incorporation of surface tension into molecular dynamics simulation of an interface: a fluid phase lipid bilayer membrane. Biophys. J. 69:1230–1245. [DOI] [PMC free article] [PubMed] [Google Scholar]
- Coetzee, T., N. Fujita, J. Dupree, R. Shi, A. Blight, K. Suzuki, K. Suzuki, and B. Popko. 1996. Myelination in the absence of galactocerebroside and sulfatide: normal structure with abnormal function and regional instability. Cell. 86:209–219. [DOI] [PubMed] [Google Scholar]
- Dahlen, B., and I. Pascher. 1979. Molecular arrangements in sphingolipids. Chem. Phys. Lipids. 24:119–133. [DOI] [PubMed] [Google Scholar]
- Darden, T., and L. G. Pedersen. 1993. Particle mesh Ewald: an N–log(N) method for Ewald sums in large systems. J. Chem. Phys. 98:10089–10092. [Google Scholar]
- Davis, J. H. 1983. The description of membrane lipid conformation, order and dynamics by 2H-NMR. Biochim. Biophys. Acta. 737:117–171. [DOI] [PubMed] [Google Scholar]
- Degroote, S., J. Wolthoorn, and G. van Meer. 2004. The cell biology of glycosphingolipids. Semin. Cell Dev. Biol. 15:375–387. [DOI] [PubMed] [Google Scholar]
- Denny, P. W., D. Goulding, M. A. J. Ferguson, and D. F. Smith. 2004. Sphingolipid-free Leishmania are defective in membrane trafficking, differentiation and infectivity. Mol. Microbiol. 52:313–327. [DOI] [PubMed] [Google Scholar]
- Douliez, J. P., A. Leonard, and E. J. Dufourc. 1995. Restatement of order parameter in biomembranes: calculation of C–C bond order parameters from C-D quadrupole splittings. Biophys. J. 68:1727–1739. [DOI] [PMC free article] [PubMed] [Google Scholar]
- Douliez, J. P., A. Leonard, and E. J. Dufourc. 1996. Conformational order of DMPC sn-1 versus sn-2 chains and membrane thickness: an approach to molecular protrusion by solid state 2H NMR and neutron diffraction. J. Phys. Chem. 100:18450–18457. [Google Scholar]
- Egberts, E., S. Marrink, and H. J. C. Berendsen. 1994. Molecular dynamics simulation of a phospholipid membrane. Eur. Biophys. J. 22:423–436. [DOI] [PubMed] [Google Scholar]
- Evans, E., and D. Needham. 1987. Physical properties of surfactant bilayer membranes: thermal transitions, elesticity, rigidity, cohesion, and colloidal interactions. J. Phys. Chem. 91:4219–4228. [Google Scholar]
- Haas, N. S., and G. G. Shipley. 1995. Structure and properties of n-palmitoylgalactosylsphingosine (cerebroside). Biochim. Biophys. Acta. 1240:133–141. [DOI] [PubMed] [Google Scholar]
- Hakomori, S. 1984. Tumor-associated carbohydrate antigens. Annu. Rev. Immunol. 2:103–126. [DOI] [PubMed] [Google Scholar]
- Hakomori, S. 2004. Carbohydrate-to-carbohydrate interaction, through glycosynapse, as a basis of cell recognition and membrane organization. Glycoconj. J. 21:125–137. [DOI] [PubMed] [Google Scholar]
- Gourier, C., F. Pincet, E. Perez, Y. Zhang, J.-M. Mallet, and P. Sinay. 2004. Specific and nonspecific interactions involving LeX determinant quantified by lipid vesicle micromanipulation. Glycoconj. J. 21:165–174. [DOI] [PubMed] [Google Scholar]
- Groetsch, C. W. 1984. The Theory of Tikhonov Regularization for Fredholm Equations of the First Kind. Pitman Advanced Publication Program, Boston, MA.
- Harvey, J. M., and M. C. R. Symons. 1978. The hydration of monosaccharides—an NMR study. J. Solution Chem. 7:571–586. [Google Scholar]
- Hess, B., H. Bekker, H. J. C. Berendsen, and J. G. E. M. Fraaije. 1997. LINCS: a linear constraint solver for molecular simulations. J. Comp. Chem. 18:1463–1472. [Google Scholar]
- Hockney, R. W. 1970. The potential calculation and some applications. Methods Comp. Phys. 9:136–211. [Google Scholar]
- Hoekstra, D., O. Maier, J. M. van der Wouden, T. Slimane, and S. C. D. van Ijzendoorn. 2003. Membrane dynamics and cell polarity: the role of sphingolipids. J. Lipid Res. 44:869–877. [DOI] [PubMed] [Google Scholar]
- Hsueh, Y. W., R. Giles, N. Kitson, and J. Thewalt. 2002. The effects of ceramide on phosphatidylcholine membranes: a deuterium NMR study. Biophys. J. 82:3089–3095. [DOI] [PMC free article] [PubMed] [Google Scholar]
- Israelachvili, J., and P. McGuiggan. 1988. Forces between surfaces in liquids. Science. 241:795–800. [DOI] [PubMed] [Google Scholar]
- Israelachvili, J. N., and H. Wennerström. 1992. Entropic forces between amphiphilic surfaces in liquids. J. Phys. Chem. 96:520–531. [Google Scholar]
- Joesten, M. D., and L. J. Schaad. 1974. Hydrogen Bonding. Marcel Dekker, New York.
- Jorgensen, W. L., J. D. Madura, and C. J. Swenson. 1984. Optimized intermolecular potential functions for liquid hydrocarbons. J. Am. Chem. Soc. 106:6638–6646. [Google Scholar]
- Klose, G., B. Mädler, H. Schäfer, and K. Schneider. 1999. Structural characterization of POPC and C12E4 in their mixed membranes at reduced hydration by solid state 2H NMR. J. Phys. Chem. B. 103:3022–3029. [Google Scholar]
- Kulkarni, K., D. S. Snyder, and T. J. McIntosh. 1999. Adhesion between cerebroside bilayers. Biochemistry. 38:15264–15271. [DOI] [PubMed] [Google Scholar]
- Lee, D. C., I. R. Miller, and D. Chapman. 1986. An infrared spectroscopic study of metastable and stable forms of hydrated cerebroside bilayers. Biochim. Biophys. Acta. 859:266–270. [DOI] [PubMed] [Google Scholar]
- Lindahl, E., and O. Edholm. 2000a. Mesoscopic undulations and thickness fluctuations in lipid bilayers from molecular dynamics simulations. Biophys. J. 79:426–433. [DOI] [PMC free article] [PubMed] [Google Scholar]
- Lindahl, E., and O. Edholm. 2000b. Spatial and energetic-entropic decomposition of surface tension in lipid bilayer from molecular dynamics simulations. J. Chem. Phys. 113:3882–3893. [Google Scholar]
- Lindahl, E., B. Hess, and D. van der Spoel. 2001. GROMACS 3.0: a package for molecular simulation and trajectory analysis. J. Mol. Modeling. 7:306–317. [Google Scholar]
- Liu, Q., and J. W. Brady. 1996. Anisotropic solvent structuring in aqueous sugar solutions. J. Am. Chem. Soc. 118:12276–12286. [Google Scholar]
- Maggio, B., T. Ariga, J. M. Sturtevant, and R. K. Yu. 1985. Thermotropic behavior of glycosphingolipids in aqueous dispersions. Biochemistry. 24:1084–1092. [DOI] [PubMed] [Google Scholar]
- Marceljia, S., and N. Radic. 1976. Repulsion of interfaces due to boundary water. Chem. Phys. Lett. 42:129–130. [Google Scholar]
- Marra, J., and J. Israelachvili. 1985. Direct measurements of forces between phosphatidylcholine and phosphatidylethanolamine bilayers in aqueous electrolyte solutions. Biochemistry. 24:4608–4618. [DOI] [PubMed] [Google Scholar]
- Marra, J. 1986. Direct measurement of the interaction between phosphatidylglycerol bilayers in aqueous electrolyte solutions. Biophys. J. 50:815–825. [DOI] [PMC free article] [PubMed] [Google Scholar]
- Marrink, S. J., M. Berkowitz, and H. J. C. Berendsen. 1993. Molecular dynamics simulation of a membrane/water interface: the ordering of the water and its relation to the hydration force. Langmuir. 9:3122–3131. [Google Scholar]
- Marrink, S., and H. J. C. Berendsen. 1994. Simulation of water transport through a lipid membrane. J. Phys. Chem. 98:4155–4168. [Google Scholar]
- McIntosh, T. J., and S. A. Simon. 1986. Hydration force and bilayer deformation: a reevaluation. Biochemistry. 25:4058–4066. [DOI] [PubMed] [Google Scholar]
- McIntosh, T., and S. Simon. 1996. Adhesion between phosphatidylethanolamine bilayers. Langmuir. 12:1622–1630. [Google Scholar]
- Mendelsohn, R., M. A. Davies, J. W. Brauner, H. F. Schuster, and R. A. Dluhy. 1989. Quantitative determination of conformational disorder in the acyl chains of phospholipid bilayers by infrared spectroscopy. Biochemistry. 28:8934–8939. [DOI] [PubMed] [Google Scholar]
- Moore, D. J., M. E. Rerek, and R. Mendelsohm. 1997. FTIR spectroscopy studies of the conformational order and phase behavior of ceramide. J. Phys. Chem. B. 101:8933–8940. [Google Scholar]
- Nagle, J. F. 1976. Theory of lipid monolayer and bilayer phase transitions: effect of headgroup interactions. J. Membr. Biol. 27:233–250. [DOI] [PubMed] [Google Scholar]
- Nagle, J. F., and M. C. Wiener. 1988. Structure of fully hydrated bilayer dispersion. Biochim. Biophys. Acta. 942:1–10. [DOI] [PubMed] [Google Scholar]
- Nagle, J. F., and S. Tristram-Nagle. 2000. Lipid bilayer structure. Curr. Opinions Struct. Biol. 10:474–480. [DOI] [PMC free article] [PubMed] [Google Scholar]
- O'Brien, J., and G. Rouser. 1964. The fatty acid composition of brain sphingolipids: sphingomyelin, ceramide, cerebroside, and cerebroside sulfate. J. Lipid Res. 5:339–342. [PubMed] [Google Scholar]
- Pascher, I., and S. Sundell. 1977. Molecular arrangements in sphingolipids. The crystal structure of cerebroside. Chem. Phys. Lipids. 20:175–191. [DOI] [PubMed] [Google Scholar]
- Pasenkiewicz-Gierula, M., Y. Takaoka, H. Miyagawa, K. Kitamura, and A. Kusumi. 1997. Hydrogen bonding of water to phosphatidylcholine in the membrane as studied by a molecular dynamics simulation: location, geometry, and lipid-lipid bridging via hydrogen-bonded water. J. Phys. Chem. A. 101:3677–3691. [Google Scholar]
- Patra, M., M. Karttunen, M. T. Hyvönen, E. Falck, P. Lindqvist, and I. Vattulainen. 2003. Molecular dynamics simulations of lipid bilayers: major artifacts due to truncating electrostatic interactions. Biophys. J. 84:3636–3645. [DOI] [PMC free article] [PubMed] [Google Scholar]
- Petrache, H. I., S. E. Feller, and J. Nagle. 1997. Determination of component volumes of lipid bilayers from simulations. Biophys. J. 70:2237–2242. [DOI] [PMC free article] [PubMed] [Google Scholar]
- Pincet, F., T. Le Bouar, Y. Zhang, J. Esnault, J.-M. Mallet, E. Perez, and P. Sinay. 2001. Ultraweak sugar-sugar interactions for transient cell adhesion. Biophys. J. 80:1354–1358. [DOI] [PMC free article] [PubMed] [Google Scholar]
- Rand, R. P., N. Fuller, V. A. Parsegian, and D. C. Rau. 1988. Variation in hydration forces between neutral phospholipid bilayers: evidence for hydration attraction. Biochemistry. 27:7711–7722. [DOI] [PubMed] [Google Scholar]
- Rand, R. P., and V. A. Parsegian. 1989. Hydration forces between phospholipid bilayers. Biochim. Biophys. Acta. 988:351–376. [Google Scholar]
- Reiss-Husson, F. 1967. Structures of the liquid-crystalline phases of different phospholipids, monoglycerides and sphingolipids in the anhydrous form and in the presence of water. J. Mol. Biol. 25:363–382. [DOI] [PubMed] [Google Scholar]
- Schäfer, H., B. Mädler, and F. Volke. 1995. De-Pake-ing of NMR powder spectra by nonnegative least-squares analysis with Tikhonov regularization. J. Magn. Reson. 116:145–149. [Google Scholar]
- Schäfer, H., B. Mädler, and E. Sternin. 1998. Determination of orientational order parameters from 2H NMR spectra of magnetically spatially oriented lipid bilayers. Biophys. J. 74:1007–1014. [DOI] [PMC free article] [PubMed] [Google Scholar]
- Schuler, L. D., X. Daura, and W. F. van Gunsteren. 2001. An improved GROMOS96 force field for aliphatic hydrocarbons in the condensed phase. J. Comp. Chem. 22:1205–1218. [Google Scholar]
- Seelig, A., and J. Seelig. 1974. The dynamic structure of fatty acyl chains in a phospholipid bilayer measured by deuterium magnetic resonance. Biochemistry. 13:4839–4845. [DOI] [PubMed] [Google Scholar]
- Simons, K., and E. Ikonen. 1997. Functional rafts in cell membranes. Nature. 387:569–572. [DOI] [PubMed] [Google Scholar]
- Singer, S., and G. L. Nicolson. 1972. The fluid mosaic model of the structure of cell membranes. Science. 172:720–731. [DOI] [PubMed] [Google Scholar]
- Skarjune, R., and E. Oldfield. 1982. Physical studies of cell surface and cell membrane structure. Deuterium nuclear magnetic resonance studies of n-palmitoylglucosylceramide (cerebroside) head group structure. Biochemistry. 21:3154–3160. [DOI] [PubMed] [Google Scholar]
- Sternin, E., B. Fine, M. Bloom, C. P. S. Tilcock, K. F. Wong, and P. R. Cullis. 1988. Acyl chain orientational order in the hexagonal HII phase of phospholipid-water dispersions. Biophys. J. 54:689–694. [DOI] [PMC free article] [PubMed] [Google Scholar]
- Sternin, E., D. Nizza, and K. Gawrisch. 2001a. Temperature dependence of DMPC/DHPC mixing in a bicellar solution and its structural implications. Langmuir. 17:2610–2616. [Google Scholar]
- Sternin, E., H. Schäfer, I. V. Polozov, and K. Gawrisch. 2001b. Simultaneous determination of orientational and order parameter distributions from NMR spectra of partially oriented model membranes. J. Magn. Reson. 149:110–113. [DOI] [PubMed] [Google Scholar]
- Subezynski, W. K., A. Wisniewska, J. Yin, J. S. Hyde, and A. Kusumi. 1994. Hydrophobic barriers of lipid bilayer membranes formed by reduction of water penetration by alkyl chain unsaturation and cholesterol. Biochemistry. 33:7670–7681. [DOI] [PubMed] [Google Scholar]
- Takaoka, Y., M. Pasenkiewicz-Gierula, H. Miyagawa, K. Kitamura, Y. Tamura, and A. Kusumi. 2000. Molecular dynamics generation of nonarbitrary membrane models reveals lipid orientational correlations. Biophys. J. 79:3118–3138. [DOI] [PMC free article] [PubMed] [Google Scholar]
- Tu, K., D. J. Tobias, and M. L. Klein. 1995. Constant pressure and temperature molecular dynamics simulation of a fully hydrated liquid crystalline phase dipalmitoylphoshatidylcholine bilayer. Biophys. J. 69:2558–2562. [DOI] [PMC free article] [PubMed] [Google Scholar]
- Weaver, J. C., K. T. Powell, R. A. Mintzer, S. R. Sloan, and H. Ling. 1984. The diffusive permeability of bilayer membranes; the contribution of transient aqueous pores. Bioelectr. Bioenerg. 12:405–412. [Google Scholar]
- Weigandt, H. 1985. Glycolipids. Elsevier, Amsterdam, The Netherlands.
- Wohlgemuth, R., N. Waespe-Sarcevic, and J. Seelig. 1980. Bilayers of phosphatidylglycerol. A deuterium and phosphorus nuclear magnetic resonance study of the head-group region. Biochemistry. 19:3315–3321. [DOI] [PubMed] [Google Scholar]
- Wong, P. T. T., and H. H. Mantsch. 1988. High-pressure infrared spectroscopic evidence of water binding sites in 1,2-diacyl phospholipids. Chem. Phys. Lipids. 46:213–224. [Google Scholar]
- Xu, X., R. Bittman, G. Duportail, D. Heissler, C. Vilcheze, and E. London. 2001. Effect of the structure of natural sterols and sphingolipids on the formation of ordered sphingolipid/sterol domains (rafts). J. Biol. Chem. 276:33540–33546. [DOI] [PubMed] [Google Scholar]
- Yu, Z. W., T. L. Calvert, and D. Leckband. 1998. Molecular forces between membranes displaying neutral glycosphingolipids: evidence for carbohydrate attraction. Biochemistry. 37:1540–1550. [DOI] [PubMed] [Google Scholar]
- Zubrzycki, I. Z., Y. Xu, M. Madrid, and P. Tang. 2000. Molecular dynamics simulations of a fully hydrated dimyristoylphosphatidylcholine membrane in a liquid-crystalline phase. J. Chem. Phys. 112:3437–3441. [Google Scholar]