

Abstract
We successfully demonstrate the effectiveness of two-photon fluorescence cross-correlation spectroscopy (TPCCS) to study the complex binding stoichiometry of calmodulin (CaM) and Ca2+/CaM-dependent protein kinase II (CaMKII). Practical considerations are made for developing an intracellular cross-correlation assay, including characterization of the fluorescent molecules involved, calibration procedures of the setup, and optimal measurement conditions. Potential pitfalls and artifacts are discussed, and the complex stoichiometry of the molecular system is accounted for by a new experimental and theoretical framework for TPCCS. Our tailored model accommodates up to 12 red-labeled CaMs binding to a single green-labeled dodecameric CaMKII holoenzyme and accounts for the probability distributions of bound ligand as well as the respective changes in fluorescence emission upon binding. The model was experimentally demonstrated both in solution and in living cells by analyzing the binding of Alexa 633(C2)CaM to eGFP-CaMKII under different biochemical conditions known to induce the basal, activated, and autophosphorylated forms of the enzyme. Key binding parameters, such as binding degree, concentrations of reactants, and binding affinities, were determined under varying conditions with certain assumptions. TPCCS thus offers the unique ability to test our biochemical understanding of protein dynamics in the intracellular milieu.
INTRODUCTION
This study is devoted to performing quantitative analysis of binding interactions between Ca2+/calmodulin-dependent protein kinase II (CaMKII) and calmodulin (CaM) using dual-color two-photon cross-correlation analysis (TPCCS), thereby demonstrating, for the first time, the full analytical power of this ultrasensitive technique in living cells. CaMKII is a ubiquitous mediator of Ca2+-dependent signaling and regulates cellular functions, such as synaptic plasticity, gene expression, and neurotransmission (Hudmon and Schulman, 2002). CaMKII assembles into multimeric holoenzymes containing 12 subunits (Kolodziej et al., 2000), each of which individually binds to its regulator, the Ca2+-receptor, CaM (Yamauchi, et al., 1989).
Each subunit can exist in multiple functional states that differ in their activity. In its basal state, CaMKII is kept inactive by the presence of an intrinsic autoinhibitory domain. Binding Ca2+/CaM to the autoinhibitory domain produces a fully active state, which allows the kinase to phosphorylate substrates as well as itself. Ca2+/CaM-dependent autophosphorylation of Thr286 (within the autoinhibitory domain of the subunit) produces a new state of the kinase in which CaM becomes essentially trapped, allowing it to remain fully active for many seconds even when Ca2+ levels have dropped below those initially required for activation (Meyer et al., 1992; Putkey and Waxham, 1996). Each of these states can be captured under different in vitro biochemical conditions. Since a range of kinase activity can be elicited by varying the CaM occupancy per holoenzyme, quantitating the degree of binding and binding affinities both in vitro and in cells would reveal information about CaMKII's input and output properties due to its oligomeric structure.
Dual-color fluorescence cross-correlation spectroscopy (FCCS) allows us access to these parameters by following molecular interactions between two differently labeled species. For the case of two binding partners, the presence of coincident signal fluctuations in two distinct emission channels indicates concomitant movement, which confirms binding between the two species. FCCS provides a viable alternative to the current standard of Förster resonance energy transfer (FRET) without distances or protein dimension constraints for the fluorescent labeling. Cross-correlation is also more versatile than FRET for issues of signaling, since it can measure interactions between molecules on different sides of the plasma membrane (Larson et al., 2004), co-localization of different cargos in endocytic vesicles (Bacia et al., 2002), and now binding of molecules with complex binding stoichiometry.
Here we apply fluorescence cross-correlation spectroscopy to understanding the binding dynamics of CaMKII and CaM both in solution and in living cells. For simplicity and stability of the setup along with biological benefits (Kim et al., 2004; Berland et al., 1995; Schwille et al., 1999), two-photon excitation (TPE) was utilized. Practical considerations for assay development, including characterization of the molecules involved, calibration of the setup, and optimal measurement conditions, are described along with warnings about potential pitfalls and artifacts. Moreover, we offer an extension of the basic cross-correlation theory to deal with complex binding stoichiometry (Weidemann et al., 2002). This concept is formalized into a new model for quantitative evaluation of cross-correlation experiments to determine key binding parameters, such as binding degree, total and free concentrations of reactants, and binding affinities, and experimentally demonstrated by analyzing the binding of multiple A633(C2)CaM to a multivalent eGFP-CaMKII holoenzyme both in vitro and in living cells.
THEORY
Theoretical concept of cross-correlation
The correlation function employed in fluorescence correlation spectroscopy (Eigen and Rigler, 1994; Elson and Magde, 1974; Magde, et al., 1972) is defined by
 |
(1) |
where δF = F(t) − 〈F〉 and 〈…〉 denotes a temporal mean.
Autocorrelation employs only one fluorescence signal (a = b) to analyze, for instance, diffusive behavior. Cross-correlation (a ≠ b; Gab = G×) looks for common features in two spectrally distinct emissions. By probing coincident attendance of distinct fluorophores in the volume element, it provides more specific analysis of molecular binding and unbinding than conventional autocorrelation analysis (Rarbach et al., 2001; Schwille, 2001).
The experimentally obtained FCS curves are commonly evaluated by nonlinear least squares fitting to analytical functions. For the simple case of a detection profile that can be approximated by a squared Gaussian distribution (for two-photon excitation) and for only one species of freely diffusing particles, the correlation curve is fitted to the following time-dependent correlation decay function M(τ) multiplied by an amplitude G(0),
 |
(2) |
where  r0 and z0 are the characteristic lateral and axial detection volume dimensions, and
  is defined as the average lateral diffusion time for a molecule with diffusion coefficient D. In the case of only one diffusing species, a molecular brightness parameter η in kHz counts per molecule can be experimentally determined by multiplying the average photon count rate 〈F〉 by G(0). When correlation curves are obtained from mixtures of independently diffusing species i with different diffusion coefficients Di (corresponding to different diffusion times τDi), fitting with linear combinations of Mi(τ) is required.
Correlation curve amplitudes for populations with mixed species
The relative contributions of the Mi(τ) and the overall amplitudes of the auto- and cross-correlation curves in the case of mixed species depend on the concentrations Ci and the molecular brightnesses ηi of the species involved. For two detection channels, green g and red r, one must distinguish the brightness of a species i in the green channel, ηi,g, from the brightness of that same species detected in the red channel, ηi,r. Ideally, single-labeled species have a non-zero brightness only in one channel, and only double-labeled species exhibit non-zero brightnesses in both channels.
Generally, if the species i with concentrations Ci and brightnesses ηi,g in the green channel and ηi,r in the red channel contribute to the fluorescence fluctuations, the correlation amplitudes arise from the weighted sums of the different species contributions (see Eq. 17.11 in Schwille, 2001),
 |
(3a) |
 |
(3b) |
 |
(3c) |
where Veff is the effective detection volume size,
 |
(4) |
which is determined from a calibration measurement.
The simple 1:1 binding case
For the simplest binding case, molecules of a green species G with molecular brightness ηG (detected only in the green channel) and molecules of a red species R with molecular brightness ηR (detected only in the red channel) engage in a binding reaction of 1:1 stoichiometry, forming the species GR. It is assumed that there is no spectral cross-talk for an idealized setup and no changes in brightnesses occur upon binding, so that the brightness of GR in the green channel is ηG, and in the red channel ηR. The autocorrelation amplitudes of the green and the red channel, Gg and Gr, and the cross-correlation amplitude G× then become independent of molecular brightnesses,
 |
(5a) |
 |
(5b) |
 |
(5c) |
where CGR is the concentration of bound molecules, CR,t = CR + CGR is the total concentration of red-fluorescent molecules, and CG,t = CG + CGR is the total concentration of green molecules.
In this standard cross-correlation assay, the maximum value that the cross-correlation amplitude can reach in the case of maximum binding equals the lower of the two autocorrelation amplitudes (Kohl, et al., 2002). This can be immediately verified from the expressions in Eq. 5, a–c, by setting the concentration of bound (CGR) equal to the lower one of the total concentrations. For example, red excess (CR,t > CG,t) and full binding (CGR = CG,t) result in the red autocorrelation curve being lower than the green, Gr(0) < Gg(0), and the cross-correlation amplitude reaching the red autocorrelation amplitude, G×(0)/Gr(0) = 1. It follows from the expressions in Eq. 5, a–c, that, in this simple cross-correlation assay, the absolute concentration of bound species is directly determined from the correlation amplitudes,
 |
(6) |
The 1:n full binding case
Here, however, we follow a reaction where a uniformly labeled partner A (eGFP-CaMKII oligomer) binds up to n single-labeled ligands B (Alexa 633(C2)CaM), forming complexes ranging between 1:1 and 1:n ligand stoichiometry (AB1, AB2, … , ABn). The number n of potential binding sites for our case is 12 (Kolodziej et al., 2000). It is assumed that binding is equivalent and independent (no cooperativity), since no physical model exists to support otherwise. We show that the cross-correlation amplitude can well exceed the lower autocorrelation amplitude obtained in this case.
We defer the treatment of all possible stoichiometries (arbitrary degrees of binding) to the next section and now consider only the limiting case of full binding. In this special case, the final reaction product contains two molecular species: 1), fully saturated bound species ABn and 2), excess free ligand B. The contrary case, where the multi-binding-site molecule A would be in excess, cannot be treated in this simplified manner, since it does not give rise to a single, fully bound species. We have chosen the multi-binding-site partner A to be labeled with green fluorescence (G) and the ligand B to possess a red-fluorescent label (R). The rationale for this choice is that—despite the use of a spectrally well-separated dye pair—cross-talk artifacts could still hamper the analysis if the green ligand was in excess. However, these issues are conveniently minimized when the red-labeled ligand is in excess.
In the simple full binding case, CABn represents the concentration of the fully bound species and CB the concentration of excess free ligand. The molecular brightnesses (in kHz/molecule) of the bound species ABn is ηG in the green channel and ηRn in the red channel. The brightness of the free ligand in the red channel is ηR. According to the general expressions in Eq. 3, b and c, the autocorrelation amplitude in the red detection channel is then represented by
 |
(7) |
and the cross-correlation amplitude by
 |
(8) |
The relative cross-correlation then yields
 |
(9) |
When there is only fully bound ABn with no free ligand B in excess, then  and
and  meaning that the relative cross-correlation amplitude equals 1, the same as in the simple 1:1 binding case. However, when the ligand is in large free excess (
 ), then
 |
(10) |
Consequently, if the brightness ηRn of ABn is larger than ηR, the relative cross-correlation will actually exceed unity. In the absence of quenching or FRET, ηRn = n · ηR; and the relative cross-correlation directly reflects the number of binding sites,
 |
(11) |
When we consider that the red fluorescence emission changes upon binding, a correction factor qR must be introduced, so that ηRn = qR · n · ηR. The relative cross-correlation amplitude then becomes
 |
(12) |
If the fluorescence emission is reduced by quenching upon binding, then qR < 1 and the relative cross-correlation amplitude will be less than n. On the other hand, if the emission is enhanced by Förster resonance energy transfer (FRET), then qR > 1 and the relative cross-correlation amplitude may even increase beyond n.
The simple limiting full-binding case can be experimentally realized if the concentrations of the reactants can be chosen at will (i.e., as in an in vitro experiment) and if the Kd is low enough to achieve full binding within the limits of detection (Fig. 4 B). Other cases, however, require a more general treatment that accounts for incomplete binding.
FIGURE 4.

Monitoring complex binding stoichiometry of eGFP-CaMKII and A633(C2)CaM. Steady-state dual-color TPCCS measurements were obtained from the same reaction of A633(C2)CaM and eGFP-CaMKII in buffer solution under elevated Ca2+ (A), elevated Ca2+ and MgATP (B), and Ca2+-free (C) conditions. In the top panels, autocorrelation curves of the higher concentration of ligand, A633CaM (red), and respective cross-correlation curves (black) are shown; in the middle panel the corresponding autocorrelation curves of eGFP-CaMKII are plotted. The bottom panels show the binding distribution for each case, the average degree of binding Θ, and the dissociation constant Kd derived from the amplitudes of the measured correlation curves above assuming high affinity binding (Kd < 200 nM, see text) for Case (B). *Assumption based on literature value Kd <0.02 nM (Meyer et al., 1992).
The general 1:n binding case
The binding distribution
In the general case of a binding reaction between a molecule A with n binding sites (eGFP-CaMKII oligomer) and a ligand B (Alexa 633(C2)CaM), all complex stoichiometries have to be taken into account. For i = 1 to n, Ci represents the concentrations of these different bound complexes ABi, and Ci=0 represents the concentration CA of free A (= AB0). Assuming independent and equivalent binding, the concentrations of ABi are given by the binomial distribution (see Eq. 15.43 in van Holde et al., 1998),
 |
(13) |
where k represents the single site binding constant k = 1/Kd, and CB is the concentration of free ligand. Considering that the total concentration of all free and complexed A, CA,t, is given by
 |
(14) |
CA can be eliminated from Eq. 13 and rewritten as
 |
(15) |
These expressions for the concentrations of all fluorescent species can be entered into the correlation amplitude terms (the expressions in Eq. 3, a–c) for the general case.
In addition to the concentrations, the correlation amplitude terms require the molecular brightnesses ηi,g and ηi,r. The brightnesses of the free species in the absence of crosstalk are given by
 |
(16) |
If no changes in fluorescence emission occur upon binding, the brightnesses of the bound species are
 |
(17) |
Changes in molecular brightnesses upon binding
If changes in fluorescence emission occur upon binding due to quenching or FRET, Eq. 17 is not valid and the model has to be adapted. We express the change in the fluorescence emission as the ratio q = η*/ η, where η is the fluorescence of the free molecule that changes to η* upon binding. Assuming independent and equivalent binding for all CaMKII subunits and quenching of both CaM and the CaMKII subunit upon binding to be independent from the binding state of neighboring subunits, the brightnesses of the complexes ABi in the red and green channels become
 |
(18) |
 |
(19) |
where the unquenched molecular brightnesses are represented by η(B,r) = ηR and η(A,g) = ηG.
Application of the concentration distribution and varying brightnesses to the correlation amplitudes
The three correlation amplitudes, defined by the expressions in Eq. 3, a–c, can now be rewritten in terms of the newly defined concentrations and brightnesses. The concentrations ci in the expressions in Eq. 3, a–c, are replaced by the concentrations of the different bound species Ci (from Eq. 15), the free concentration of A, C0 (also from Eq. 15), and the concentration of free B, CB. The brightnesses ηi,g and ηi,r are replaced by Eqs. 16, 18, and 19. In doing so, the absolute brightnesses ηG and ηR cancel out, leaving only the quench factors
 |
(20a) |
 |
(20b) |
 |
(20c) |
where the expressions of Ci and Qi are given by Eqs. 15 and 19, respectively.
With the experimentally determined correlation amplitudes, the resulting system of three equations can be solved numerically, providing distinct solutions for the parameters CB, CA,t, and k = 1/Kd if the stoichiometry n and the quench factors qG and qR are known. For all experimental data, these equations gave rise to one unique real solution using Mathematica 5.0 (Wolfram Research, Champaign, IL). Additionally, the concentration of total bound ligand can be determined as  and used to calculate the binding degrees. The overall binding degree is defined as ν = CB,bound/CA,t and the per-site binding degree as θ = ν/n.
Reduced number of available binding sites
One factor that could interfere with the interpretation of the derived results is the possibility of a reduced number of sites ñ among the potential total binding sites n = 12 due to steric hindrance of the fluorescent labels (e.g., only every second site can bind: ñ = 6). In this case, the summations are performed from i = 0 to ñ instead of i = n (the expressions in Eq. 20, a–c). The apparent green quench factor determined from the EGTA and MgATP cases is represented as
 |
then Qi is redefined as
 |
(21) |
and inserted in the expressions for Eq. 20, a and c.
Analysis of the intracellular case: incorporation of unlabeled ligand
The interpretation of intracellular cross-correlation experiments has the added complication of the presence of endogenous, unlabeled proteins that mix with the labeled proteins of interest. For CaMKII, we assume that the effect is negligible for HEK293 cells, since a brain-specific isoform of the enzyme is used, although endogenous γ- and δ-isoforms of CaMKII may be present that can form oligomers with the α-subunit. On the other hand, CaM is a highly conserved, ubiquitous Ca2+-binding protein (van Eldik and Watterson, 1998), and the concentration of endogenous protein cannot be ignored. Therefore, the ratio of labeled to unlabeled CaM must be taken into account. Binding affinities of labeled and unlabeled CaM are assumed to be indistinguishable, for the sake of simplicity.
To accommodate unlabeled ligand B, we consider the concentration of the oligomer A with i ligands B bound, among which j ligands are red-labeled and i–j are unlabeled (i ≤ j). This concentration iCj is characterized by a binomial distribution of the red ligands among the i ligands bound to A,
 |
(22) |
where r is the overall fraction of red-labeled ligand molecules and Ci is taken from Eq. 15. The concentration of A with exactly j red-labeled ligand bound and any number of additional unlabeled ligand bound is obtained by summing up over all A with at least i = j ligands bound,
 |
(23) |
Substituting Eq. 22 into Eq. 23 yields
 |
(24) |
which accounts for the intracellular scenario where there is a mixture of labeled and unlabeled ligands. The concentrations of A that have j = 0 to n of fluorescent B bound, Cj, are applied to the expressions in Eq. 3, a–c, together with the concentration of free, fluorescent B, which is now r · CB. The correlation amplitudes obtained in this manner replace the expressions in Eq. 20, a–c, for the in vivo case.
Note that the assumption for the size of the unlabeled fraction influences the exact distribution of the red-labeled ligands Cj or Ci obtained in the calculation (i.e., Eqs. 24 and 15 are not identical unless r = 1). The reason is that the addition of unlabeled CaM influences the reaction.
Effect of unlabeled ligand on the limiting 1:n full binding case
We have now derived how the presence of a fraction r of fluorescently labeled molecules among the ligands enters the general expressions in the binding theory for any degree of binding. For the special limiting case of full binding with excess CaM described previously, it can be directly illustrated how the mixing with unlabeled CaM reduces the cross-correlation. At full binding, Eq. 24 simplifies to a binomial distribution of red-labeled CaM on all green CaMKII oligomers,
 |
(25) |
The correlation amplitudes in the expressions in Eq. 20, b and c, are re-derived, this time with the simplified expression from Eq. 25 for Cj and again with r · CB as the concentration of free, fluorescent B. Considering that, for a binomial distribution,
 |
 and
and  the autocorrelation amplitude of the ligand B in the red detection channel is given by
 |
(26) |
the cross-correlation amplitude by
 |
(27) |
and the ratio by
 |
(28) |
where potential quenching of the green labeled A is not considered. The value  is as previously defined (Eq. 9). When the ligand is in large excess (
 ), Eq. 28 reduces to
 |
(29) |
For this simple limiting case of full binding with excess ligand, the result could have been predicted from Eq. 10, which states that the relative cross-correlation approaches ηRn/ηR. The average brightness of the fully bound species in the red channel is now ηRn = r · qR · n · ηR, and the relative cross-correlation amplitude becomes modified not only by the quench factor qR, but also by the factor of fractional labeling r.
Nonetheless, in the general case, quenching effects and the presence of unlabeled CaM have to be treated separately, since each affects the fluorescence of the bound CaM and the fluorescence of the free CaM differently. However, the results converge to the analogous appearance of the factors qR and r in Eq. 29 for the limiting case of full binding with large ligand excess.
To reiterate, the effect of unlabeled, endogenous CaM is significant for intracellular measurements. If ignored, the binding affinity will be underestimated from the reduced cross-correlation amplitude.
MATERIALS AND METHODS
Materials
ATP was purchased from Amersham Biosciences (Piscataway, NJ). All chemicals were of reagent grade or higher and were purchased from Sigma-Aldrich (St. Louis, MO) unless otherwise specified. All fluorescent probes were obtained from Molecular Probes (Eugene, OR). The pEGFP-C2 vector was purchased from Clontech (Palo Alto, CA).
Confocal TPCCS instrumentation
The utilized confocal setup is identical to the setup described previously (Kim et al., 2004) and consists of a tunable mode-locked Titanium:Sapphire laser (Tsunami, Spectra Physics, Darmstadt, Germany) coupled to an inverted microscope (IX-71 Olympus, Hamburg, Germany) which was equipped with a water immersion objective (UPlanApo/IR 60×, NA 1.2, Olympus). Various dichroic mirrors and bandpass emission filters (AHF Analysentechnik AG, Tübingen, Germany) were used for coupling the laser beam into the objective as well as for splitting the fluorescence into the green and red detection channels (see Kim et al., 2004, for details). For digital correlation of the detected signal, either of two hardware correlators (ALV-5000 multiple-τ correlator card, ALV, Langen, Germany) for simultaneous measurement of the dual auto- and cross-correlations or a more advanced cross-correlator (Flex02, Correlator.com, Bridgewater, NJ) simultaneously operating in auto- and cross-correlation mode was used. Evaluation of the curves was carried out using ORIGIN (MicroCal Software, Northampton, MA) with a Levenberg-Marquardt nonlinear least-square fitting routine.
The size of the effective (open) volume element was calculated as 0.26 ± 0.04 femtoliters based on calibration measurements with pure Rhodamine Green (RG) dye excited at 920 nm. Optimal alignment is ensured by a calibration procedure recommended by Schwille et al. (1997) to confirm the same size and position in space of both detection volumes of the dual channel system.
In vitro and intracellular TPCCS experimental conditions
All solutions were prepared in low fluorescence HPLC grade water (Merck Sharp & Dohme, Haar, Germany) and were filter-sterilized. Twenty-four microwell chambers (Evotec OAI, Hamburg, Germany) were pre-incubated with 10% BSA for 10 min followed by two subsequent washes with an enzyme dilution buffer (25 mM HEPES, pH 7.0, 150 mM KCl, 0.1 mg/ml BSA). Reaction conditions for cross-correlation measurements included: A633(C2)CaM and eGFP-αCaMKII in 25 mM HEPES, pH 7.0, 100 mM KCl, 10 mM Mg2+ with 0.5 mM CaCl2, and 1 mM MgATP followed by 1 mM EGTA. (Note that A633(C2)CaM was the same construct as previously described in Kim et al., 2004; however, for A633(C3)CaM), the notation has been modified to reflect the conventional amino acid numbering found in the CaM literature.) Each reaction was well mixed before each measurement, and measurements were performed at room temperature. The data recording time for each curve was 100 s.
HEK293 cells were transfected with eGFP-CaM-kinase II using Effectene (Qiagen, Hilden, Germany) as described by the manufacturer. A633(C2)CaM was introduced into adherent cells using electroporation as previously described (Kim et al., 2004). For some experiments cells were incubated in one of the following conditions: HBSS (Kim et al., 2004) with no added Ca2+, 15 μg/ml α-hemolysin (α-toxin; Sigma, St. Louis, MO), and 200 μM EGTA (Ca2+-free); or HBSS with 15 μg/ml α-hemolysin, 10 mM CaCl2, and 1 mM MgATP (elevated Ca2+). The α-hemolysin permeabilizes the cell membrane allowing rapid equilibrium of extracellular ions and nucleotides with the intracellular environment. HEK293 cells were prepared in parallel for spectroscopy measurements and Ca2+ imaging. Fluo-4 was used to confirm that Ca2+ was being elevated or decreased uniformly in all cells under the different conditions.
All experiments were performed at room temperature. The detailed methods including construction, expression, purification, and labeling strategies for the proteins, cell culture, and transfection are described in Kim et al. (2004).
CaM-kinase II activation assay
The activity of recombinant CaM-kinase II and eGFP-CaM-kinase II was determined in the presence of increasing concentrations of recombinant bacterial-expressed CaM (wtCaM) or A633(C2)CaM. Serial dilutions of the CaM stocks were made in 5 mM MOPS buffer with 0.1 mg/ml BSA. CaM at the final concentrations indicated in the figure were added to reaction mixtures (final volume = 25 μl) containing: 25 mM HEPES pH 7.0, 70 mM KCl, 0.5 mM CaCl2, 10 mM MgCl2, 100 μM ATP, 2 μCi of [γ-32P]ATP, 50 μM syntide (PLRRTLSVAA), and 0.4 mM dithiothreitol. CaM-kinase II was diluted in 10 mM MOPS pH 7.0, 200 mM KCl, 0.1% T-20, and 1.0 mg/ml BSA. Reactions were prewarmed for 1 min at 30°C and were initiated by the addition of enzyme (10 ng). Each reaction was incubated for 30 s at 30°C before 20 μl of the reaction mix was spotted onto Whatman P-81 filter paper. The filters were processed as previously described (extensively washed with phosphoric acid and ethanol and dried), and bound radioactivity was quantified by Cerenkov counting (Kim et al., 2001).
Activity is expressed as μmol/min/mg. For Kact and Vmax determinations, activity data were plotted versus CaM concentration and fit using nonlinear least-squares to the hyperbolic Michaelis-Menten equation,
 |
(30) |
where Kact is the concentration of CaM which yielded 50% of maximal activity, and Vmax is the maximal rate of activity of the enzyme.
Excitation and emission spectra
Fluorescence excitation and emission maxima for all fluorescently labeled CaMs were accomplished at room temperature (22°C) using a PTI QuantaMaster steady-state spectrofluorometer (Model CGM-9/2003; Photon Technology International, Lawrenceville, NJ). The excitation and emission slit widths were 2 and 5 nm, respectively. The standard buffer for all fluorescence measurements was 50 mM HEPES, pH 7.0, 100 mM KCl, and 0.1 mM EGTA. A background excitation and emission scan was measured before addition of the probe. Fluorescently labeled CaM (200–500 nM as assessed by a protein assay) was added to 1 ml of the standard buffer to achieve an appropriate fluorescent signal. To test calcium sensitivity, samples were first scanned in the base buffer and rescanned after the addition of 1 M CaCl2 for a 5 mM final calcium concentration. At the end of every run 5 μl of 1 M EGTA was added. To determine pH-dependent changes in fluorescence, separate samples of the protein were tested in the standard spectral buffer at pH 6.5 and pH 8.0.
RESULTS
Establishing an intracellular two-photon cross-correlation assay
Optimizing measurement conditions
Our selected dye system consists of enhanced Green Fluorescent Protein (eGFP, green) coupled to CaMKII and A633 (red) labeling CaM. The emission maxima in aqueous solution using TPE are 510 nm for eGFP and 655 nm for A633. As expected, the emission spectra (Kim et al., 2004) are not notably different compared to their one-photon excited counterparts and are very well separable by optical filter systems.
An optimization procedure of the excitation parameters, wavelength, and intensity, was performed to find an initial compromise of optical conditions for which the dyes exhibit similar performance. First, the optimal common two-photon excitation wavelength was found by scanning with the tunable laser between 800 and 980 nm, and the characteristic molecular brightnesses η (kHz/molecule) at fluorescence saturation were measured with FCS. During the scan, the laser intensity was adjusted to the respective saturation level for maximal efficiency, while the pulse-width was kept constant at 100 fs. Fig. 1 A shows a plot of η versus the TPE wavelength for the current selected fluorophores eGFP (circles) and A633 (squares) measured independently in buffer solution for maximal resolution. All data were recorded under optimal conditions in a standard single color setup with a broadband emission filter and without specific filter separation for red and green. In Fig. 1 A the curves cross at ∼860 nm, indicating the optimal excitation wavelength. However, since CaMKII is a holoenzyme, multiple eGFPs were incorporated per molecule, and thus, for our intracellular dual-color system, the “green” η was found to be ∼6–7 times brighter than wild-type eGFP. Taking this into consideration along with any losses due to the optical setup, the optimal excitation wavelength would be ∼830 nm.
FIGURE 1.

Optimization of measurement conditions. (A) Wavelength dependence of the fluorescence emission yield η for eGFP (circles) and Alexa 633 (squares). Data were measured in a standard two-photon FCS setup under optimal conditions with the pulse width of the laser set at 100 fs. The excitation power was adjusted to the respective fluorescence saturation limit for each fluorophore independently. (Bottom) Plot of fluorescence emission dependence on excitation power for eGFP (circle) and A633 (square) at 830 nm (B) and 920 nm (C). The fluorophores were independently analyzed in aqueous solution in a standard FCS setup. At low power levels (solid symbols) the slope is ∼2. The boxes (dashed line) mark the range of the respective possible excitation power for each individual fluorophore. Contrary to B where these areas show no overlap, C shows “safe” excitation powers where common excitation can be found.
However, Fig. 1 B shows very different saturation levels where no common intensity for mutual excitation can be found at 830 nm. While the fluorescence emission for eGFP is affected by saturation at 6.0 MW/cm2 (Fig. 1 B, circles, framed area), the respective level for A633 is significantly lower (0.5 MW/cm2, Fig. 1 B, squares, framed area), and contrary to eGFP shows a dramatic dependence on excitation wavelength. Such low saturation levels for A633 are found for shorter wavelength between 800 and 860 nm (data not shown). In contrast, for 920-nm excitation A633 tolerates higher intensities up to 2 MW/cm2, whereas that level for eGFP is slightly reduced to 4.0 MW/cm2 so that the curves match sufficiently and a common excitation wavelength for both fluorophores was found in the intensity range tolerated by cells (Fig. 1 C, overlapping framed areas). For all curves in Fig. 1, B and C, the power dependence at lower intensities indicates a clear two-photon process with slopes in the double logarithmic plot of ∼2 (1.93–1.94 for Fig.1 B, 1.93–2.1 for Fig. 1 C).
Accordingly, the optimal wavelength for subsequent cross-correlation experiments at which both dyes were well-excited, while the photobleaching and damage within the cells were minimized, was found to be ∼920 nm. For longer wavelengths, the A633 emission efficiency decreases, whereas for shorter wavelengths, its saturation levels become too low to work in combination with eGFP.
Effects of photobleaching artifacts on cross-correlation experiments
Next, we used the labeled proteins and bound complex to fine-tune measurement conditions for further experimentation. Fig. 2 highlights various aspects of how photobleaching and saturation affects a cross-correlation experiment. For excitation powers up to 1 MW/cm2 the cross-correlation amplitude (Fig. 2, C2), as well as the particle number and the diffusion time of the single species eGFP-CaMKII (Fig. 2, A2) and A633(C2)CaM (Fig. 2, B2), remain constant; however, for higher laser power densities, a typical reduction of the diffusion time (Fig. 2, A4 and B4) and increased apparent particle number (Fig. 2, A3 and B3) are observed.
FIGURE 2.
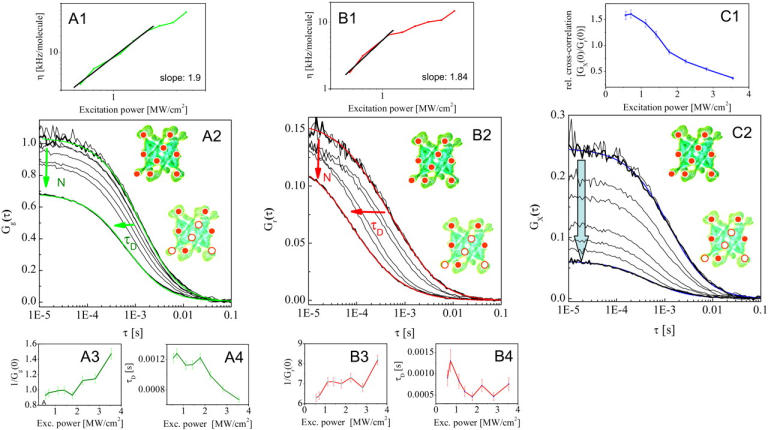
Controlling photobleaching artifacts in two-photon cross-correlation spectroscopy experiments. To assess the optimal intensity where power-dependent bleaching and saturation artifacts were not introduced, cross-correlation and autocorrelation curves were measured for a high affinity binding reaction (10 mM Ca2+/1 mM MgATP) of eGFP-CaMKII (A) and A633(C2)CaM (B) at power densities between 0.5 and 3.5 MW/cm2. The data acquisition time for each curve was 60 s. Although the count rate per molecule that determines the quality of the measurement (A1, B1) increases with increasing excitation power, a decrease of the cross-correlation amplitude (C2) due to photobleaching is observed for excitation powers >1 MW/cm2, which can be easily mistaken for decreased binding (C1). The corresponding autocorrelation curves of the single species eGFP-CaMKII (A2) and A633(C2)CaM (B2) show an increase of the apparent particle number (A3, B3) and a decrease of apparent diffusion time (A4, B4), which indicate saturation and bleaching artifacts.
As expected, for the presented assay the red-emitting A633(C2)CaM is the limiting factor, exhibiting strong bleaching artifacts in the autocorrelation analysis for excitation powers higher than 1 MW/cm2, whereas the eGFP-CaMKII is stable up to 2 MW/cm2. In comparison, an excitation power of 2 MW/cm2 already induces a decrease of the absolute cross-correlation amplitude by ∼60% (Fig. 2, C2) and the relative cross-correlation as a measure for binding by ∼50% (Fig. 2, C1). From a practical view, the most critical point is that the signal/noise ratio of the data, which generally operates as a measure for optimizing experimental conditions, can easily mislead the experimenter into increasing the excitation power toward fluorescence saturation of the fluorophores (Fig. 2, A1 and B1). However, the auto- and cross-correlation amplitudes are potentially affected by bleaching artifacts; therefore, the dynamic range of the cross-correlation experiment can be significantly reduced as illustrated in Fig. 2.
Effects of labeling the proteins
It is essential to characterize the consequences of the dye labeling for the biological and biochemical function of the proteins under investigation. Since CaM does not have any resident Cys residues in its sequence, a single Cys residue was introduced for Asp at amino acid 2 for Alexa 633 labeling. A comparison of the crystal and NMR solution structures of free CaM (Babu et al., 1985) and CaM bound to a peptide derived from CaMKII (Meador et al., 1993) indicated that the side chain of Asp2 does not directly participate in peptide binding. Enhanced green fluorescent protein (eGFP) was attached to CaMKII on the N-terminal end of the protein to avoid interfering with the association domain on the C-terminal end, which is critical for holoenzyme formation (Kolb et al., 1998).
To assure that the A633 dye label on CaM did not seriously affect the activation of CaMKII, labeled and unlabeled CaM were tested for their ability to activate recombinant CaMKII and eGFP-CaMKII (Fig. 3). Fig. 3 shows the activity of CaMKII determined in the presence of increasing concentrations of unlabeled CaM (solid squares) and A633(C2)CaM (shaded circles). The lines represent a fit of the experimental data to the Michaelis-Menten equation (Eq. 30). The value Kact is the concentration of CaM that yielded 50% of maximal activity, and Vmax is the maximal activation of the enzyme. The Kact and Vmax values were obtained for each protein combination by fitting the data using the Levenberg-Marquardt nonlinear least-squares fit. The Kact values for CaM are within the range consistent with those reported under saturating Ca2+ conditions (Kuret and Schulman, 1984; Brickey et al., 1990; Katoh and Fujisawa, 1991). No significant statistical differences (p < 0.05) were seen between CaMKII and eGFP-CaMKII in terms of either Vmax or Kact (Table 1). However, although no difference in the Kact was apparent, Alexa633-labeled CaM resulted in a statistically significant decrease in Vmax for both unlabeled CaMKII (32% reduction; solid triangles) and eGFP-CaMKII (18% reduction; shaded triangles). A full characterization of eGFP-CaMKII showed that the protein was a holoenzyme and possessed minimal basal-independent activity similar to the wild-type enzyme (data not shown).
FIGURE 3.

Characterizing labeling effects on CaM and CaMKII. The activity of CaMKII and eGFP-CaMKII was determined in the presence of increasing concentrations of wild-type CaM and A633(C2)CaM as described in Materials and Methods. CaM concentrations were varied from 3.13 nM to 3.2 μM. Activity is expressed as μmol/min/mg. Each data point represents a mean of three independent measurements (N = 3). The lines represent a fit of the experimental data to the hyperbolic form of the Michaelis-Menten equation (Eq. 30). The Kact and Vmax values were obtained for each protein combination by fitting the data using the Levenberg-Marquardt nonlinear least-squares fit (see Table 1 for values). No statistically significant differences were seen between CaMKII (solid squares, solid curve) and eGFP-CaMKII (shaded circles, shaded curve) when activated with wild-type CaM in terms of both Vmax and Kact. Although no difference in the Kact was apparent, A633(C2)CaM resulted in a statistically significant decrease in Vmax for both unlabeled CaMKII (solid triangles, dashed solid curve) and eGFP-CaMKII (shaded triangles, dashed shaded curve).
TABLE 1.
Experimental data of CaMKII and eGFP-CaMKII activation by wild-type and A633(C2)CaM shown in Fig. 3, fitted with the Michaelis-Menten equation (Eq. 30)
| Protein combination | Vmax [μmol/min/mg] | Kact [μmol] |
|---|---|---|
| wtCaM/wtCaMKII | 10.54 ± 0.97 | 0.056 ± 0.010 |
| wtCaM/eGFP-CaMKII | 9.55 ± 1.12 | 0.106 ± 0.016 |
| A633(C2)CaM/wtCaMKII | 7.18 ± 0.79* | 0.106 ± 0.030 |
| A633(C2)CaM/eGFP-CaMK | 7.84 ± 1.43* | 0.189 ± 0.063 |
Statistically significant p < 0.05.
Ca2+ binding did not produce a change in either the fluorescence intensity or a shift in the excitation or emission maxima (data not shown). A change in the pH from 6.5 to 8.0 produced a 15% increase in the fluorescence intensity and no change in the excitation or emission maxima (data not shown). These pH-dependent changes were avoided both in vitro and in cells by clamping the pH with a HEPES buffered solution. Therefore, the probe did not exhibit spectral changes for our experimental conditions. In total, the dye pair combination chosen and position of labeling did not significantly interfere with binding or CaMKII activity.
Cross-correlation analysis facing variable binding stoichiometry
Diffusional analysis of CaM and CaMKII
Fig. 4 shows the steady-state TPCCS measurements for a reaction of A633(C2)CaM and eGFP-CaMKII in buffer solution under different reaction conditions. The autocorrelation curves and corresponding fits of the higher concentration of ligand, A633(C2)CaM (in red), and respective cross-correlations (in black), are seen in the upper panel, whereas the corresponding autocorrelation curves and fits of eGFP-CaMKII are plotted in the middle panel. No term for triplet or other photophysical dynamics was needed in the fast timescales for fitting because of using TPE in conjunction with low laser intensities (Dittrich and Schwille, 2001). Table 2 provides a summary of diffusion coefficients for reactions seen in Fig. 4.
TABLE 2.
Summary of mobility and binding parameters of eGFP-CaMKII and A633(C2)CaM for in vitro reactions shown in Fig. 4
| + Ca2+
|
+ Ca2+/MgATP
|
+ EGTA
|
||||
|---|---|---|---|---|---|---|
| eGFP-CaMKII | A633(C2) CaM | eGFP-CaMKII | A633(C2) CaM | eGFP-CaMKII | A633(C2) CaM | |
| D1/10−7 cm2/s | 1.3 ± 0.23 | 5.7 ± 1.00 | 1.1 ± 0.20 | 5.9 ± 1.10 | 1.2 ± 0.21 | 5.6 ± 1.00 |
| D2/10−7 cm2/s | – | 1.3 ± 0.23 | – | 1.1 ± 0.20 | – | – |
| App. fraction of D2 | – | 0.03 ± 0.03 | – | 0.08 ± 0.04 | – | – |
| Cfree [nM] | 0.095 | 921 | 0.00 | 826 | 2.2 | 828 |
| Ctotal [nM] | 4.9 | 938 | 4.7 | 882 | 4.2 | 831 |
| App. G×(0)/Gr(0) | 0.71 | 2.6 | 0.13 | |||
| Θ | 0.3 | 1.0 | <0.05 | |||
| Kd [μM] | 2.4 | (<0.2)* | >15 | |||
In all cases, a normal diffusion model is applied with diffusion coefficient D, or diffusion coefficients D1 and D2 for mixtures of two species with clearly different mobility. Quench factors were derived as described in the text, resulting in qg = ηg*/ηg = 0.48 and qr = ηr*/ηr = 0.22.
Assumption.
The autocorrelation functions of unbound A633(C2)CaM and eGFP-CaMKII in buffer solution (+EGTA; Fig. 4 C) yielded normal diffusion for both species as expected with diffusion coefficients of 5.6 ± 1.0 × 10⁻⁷ cm2/s for A633(C2)CaM and 1.2 ± 0.21 × 10⁻⁷ cm2/s for eGFP-CaMKII. For both elevated Ca2+ conditions, A633(C2)CaM was fit to a two-component diffusion model with one of the components fixed to the diffusion time of eGFP-CaMKII bound to CaM. Based on the fit, the majority of the A633(C2)CaM diffused at the same rate as the unbound protein in the EGTA condition with only an apparent fraction of 3% in the Ca2+ and 8% in the Ca2+/MgATP condition bound to CaMKII. Thus, if autocorrelation was employed as the sole determinant for assessing binding, a significant difference would not be seen in these experiments (Table 2). Therefore, cross-correlation in conjunction with autocorrelation analysis is required for a more specific and detailed analysis of binding interactions.
In vitro cross-correlation measurements
Since the biochemistry of CaMKII is well characterized, specific in vitro conditions are known to induce different functional states of the kinase with differential binding of CaM. These in vitro measurements were used to determine the efficiency of the assay and stability of the setup. Simultaneous auto- and cross-correlation measurements were performed to investigate the activated, autophosphorylated, and basal states of CaMKII by varying the Ca2+ and ATP concentrations while maintaining a roughly constant excess of A633(C2)CaM (800–950 nM) compared to the eGFP-CaMKII concentration (4–5 nM of holoenzymes or 48–60 nM of subunits) within the same reaction.
Fig. 4 shows the correlation curves from one set of such measurements taken in succession from the same sample under different conditions. The activated state was first monitored under the initial conditions of 0.5 mM Ca2+ in the absence of MgATP (A). Subsequent addition of MgATP (B; 1 mM final concentration) induced a large increase in the cross-correlation indicative of the binding of multiple CaMs in the autophosphorylated state. Finally, addition of 2 mM EGTA (C) at the end of the reaction chelated the Ca2+ (forming apo-CaM), thereby dissociating the CaM and returning the enzyme back to the unbound state. Individual autocorrelation curves varied <5% with a slight decrease in concentration due to a small dilution effect of adding Ca2+, MgATP, and EGTA solutions.
The autophosphorylated state of CaMKII and determination of the red quench factor
Incubation of CaMKII with Ca2+/CaM in the presence of MgATP (B) leads to a virtually irreversible binding of CaM upon autophosphorylation of Thr286 (Meyer et al, 1992). The binding of Ca2+/CaM to CaMKII subunits has been found to be ∼1:1 (Katoh and Fujisawa, 1991; Sugiura and Yamauchi, 1993). For the concentrations employed here in the in vitro experiments, the limiting case, exemplified in the theory where only saturated CaMKII and a large excess of CaM are present, is applicable. If no changes in red fluorescence occur upon binding, the relative cross-correlation amplitude G×(0)/Gr(0) (ratio of cross-correlation and red autocorrelation) yields the number of binding sites on the target molecule, which is n = 12 for CaMKII. The fact that a smaller value of G×(0)/Gr(0) = 2.6 is observed can be attributed to the quenching of the red CaM fluorescence upon binding to CaMKII. According to the theory, the quench factor qr reduces the maximum cross-correlation amplitude as  Based on the autophosphorylated state (B), the red quench factor is therefore estimated to be qr = 0.2, meaning that a labeled CaM exhibits 80% less fluorescence upon binding. In the case presented here, determination of qr is independent of knowledge about the quenching of the green fluorescence upon CaM binding. Under these conditions where all CaMKII molecules are fully saturated with CaM, the green brightness can be considered to be essentially uniform and the actual value of the brightness cancels out.
For a more accurate evaluation of the red quench factor, the general binding theory was applied, and solutions were calculated. Inserting the experimental values for the three correlation amplitudes, Gg, Gr, and G×, the number of potential binding sites (n = 12), and the size of the detection volume (Veff = 0.26 fl), one obtains a solution for the Kd if the red quench factor qr is known, or vice versa, a solution for the quench factor qr if the Kd is known. Since in our experiments, this quench factor is not known a priori, we therefore determine the qr by using a known value for the Kd in Case B from the well-documented literature. This yields a quench factor, which can then be applied to the other cases (A and C) to obtain experimental values for the Kd in those cases.
With respect to the case of autophosphorylated CaMKII (Case B), several studies have reported that it has one of the highest affinities to date for Ca2+/CaM binding with a Kd in the range of 150 nM down to low pM (Sugiura and Yamauchi, 1993; Meyer et al, 1992; Török et al, 2001; Gaertner et al., 2004). Using the middle value in the range (Kd < 0.02 nM; Meyer et al., 1992), we evaluate qr to be 0.22 in the autophosphorylated state. Since the exact value of the Kd was not independently determined in our experiments, the quenching factor qr was then calculated for the range of Kd values in the literature noted above using the expressions in Eq. 20, a–c. The quench factor was found to remain essentially constant within the entire range of reported Kd values (data not shown). Furthermore, Kd values for the other cases were also found to be constant for the qr values obtained within the reported Kd range for Case B (data not shown).
The basal state of CaMKII and determination of the green quench factor
CaMKII does not significantly bind to CaM in the absence of Ca2+ due to the presence of an intrinsic autoinhibitory region in its regulatory domain (Hudmon and Schulman, 2002). Addition of excess EGTA (C) at the end of the reaction serves to chelate the Ca2+, dissociating the bound CaM. The brightness in kHz per molecule was determined from the product of the green autocorrelation amplitude and the green fluorescence count rate. The green quench factor qg was quantified as the ratio of the brightnesses of the CaMKII holoenzyme in the autophosphorylated fully bound state (ηg*) described above (Fig. 4 B, bottom graph) and the basal unbound state (ηg) and was found to be qg = ηg*/ηg = 0.48. Analysis of CaMKII and apo-CaM demonstrate that binding in the absence of Ca2+ is very weak with a Kd of 15 μM or more.
The activated state of CaMKII and determination of binding parameters
Each subunit of CaMKII becomes activated when CaM in the presence of Ca2+ binds to and displaces the autoinhibitory domain from its active site. For this case using the quench factors determined above and the general 1:n binding theory, the correlation data was evaluated to determine binding parameters of the activated state of CaMKII (A). The analysis yielded the following results: the binding distribution as depicted in the bottom graph of Fig. 4 C; a binding degree of θ = 0.28 CaM per binding site, or ν = 3.4 CaM per CaMKII holoenzyme; and a single site dissociation constant of Kd = 2.4 μM. The activated state of CaMKII, as expected, is therefore intermediate to the basal (C) and autophosphorylated (B) cases.
Potential deviation from the ideal case: reduced number of subunits available for binding
Although care was taken to minimize interactions due to labeling of the protein, it cannot be excluded that the binding stoichiometry of n = 12 is somehow affected by the eGFP fusion or other steric interference with the labeled CaM. Therefore the effect of assuming a smaller n (i.e., ñ = 9 or ñ = 6) was also analyzed. Although, of course, the overall binding degree ν is affected by the assumption for ñ, the (single site) dissociation constant, Kd, and the per-site binding degree, θ, were seen to remain largely unaffected. If we assume, for instance, ñ = 6 (only every second subunit is available for binding), then the results for these parameters of interest do not show any significant difference compared to the ideal case (ñ = n = 12): Kd (Case A) = 2.2 μM (instead of 2.4 μM); θ (Case A) = 0.29 (instead of 0.28); Kd (Case C) > 14.5 μM (instead of 15.2 μM); and θ (Case C) < 0.054 (instead of 0.052).
Cross-correlation analysis extended to the intracellular milieu
Assessing intracellular co-localization of CaM and CaMKII
The confocal laser scanning images (Fig. 5, top) show stably transfected eGFP-CaMKII HEK293 cells electroporated with A633(C2)CaM. Due to the variability in eGFP-CaMKII expression and the gradient of concentrations from the electroporation of A633(C2)CaM, different combinations of protein concentrations were found in the same dish. Higher concentrations of both proteins were used for confocal imaging, whereas lower concentrations were used for cross-correlation measurements (nM to low μM range). Permeabilization of the cell membrane was accomplished using α-hemolysin, which allowed for equilibrium of extracellular ions and nucleotides with the intracellular environment. The images show no meaningful change in appearance under elevated 10 mM Ca2+ and 10 mM Ca2+/1 mM MgATP (Fig. 5, top left and center) in the presence of 15 μg/ml α-hemolysin followed by Ca2+-free conditions (200 μM EGTA) (Fig. 5, top right) in the same dish. In all images Alexa 633(C2)CaM was localized to the cytoplasm with a higher concentration in the nucleus, whereas eGFP-CaMKII was generally cytoplasmic with very little signal in the nucleus. After longer periods of time in elevated Ca2+, eGFP-CaMKII often displayed small punctae throughout the cytoplasm (data not shown). These areas were avoided during cross-correlation measurements. Although the molecules were co-localized in the cytoplasm in both conditions, cross-correlation analyses show very different binding dynamics.
FIGURE 5.

Binding of A633(C2)CaM and eGFP-CaM-kinase II under varying conditions in living cells in culture. (Top) Confocal images of stably transfected eGFP-CaM-kinase II HEK293 cells electroporated with A633(C2)CaM are shown under 10 mM Ca2+ (left) followed by 10 mM Ca2+/1 mM MgATP (middle) and 200 mM EGTA (right) in the presence of 15 mg/ml α-hemolysin in the same dish (scale bar = 10 μm). (Middle) Intracellular auto- and cross-correlation curves were measured simultaneously under each of the conditions but at lower intracellular protein concentrations than used for the LSM images above. Plotted are the six subsequent 10-s acquisitions (thin lines) for both the auto- and cross-correlation measurements and their respective average curves with data fits (corresponding thick lines). (Note that the y axis for the green autocorrelation in A, right side in green, has a different scale than the other curves.) The amplitude of the cross-correlation curve (black) increases under elevated Ca2+ conditions (A, B) and almost disappears in the absence of Ca2+ (C). In comparison to the in vitro case, the cross-correlation amplitudes for both elevated Ca2+ conditions (A, B) are reduced due to the additional presence of unlabeled endogenous CaM in the cell. Distribution plots are shown at the bottom as seen in Fig. 4. The hatched shaded bars represent the distribution of CaM irrespective of the label, and the red bars denote the distribution of Alexa 633-labeled CaM molecules only. In A and B, an assumption of a high binding affinity yields virtually full binding (hatched shaded bar) and the indicated values for the labeled fractions r. In C the hatched bars exemplify a CaM distribution for r = 0.3 based on A and B. Distributions for conditions with other r fractions are also denoted (shaded lines).
Intracellular cross-correlation measurements
The final step of this work was to realize cross-correlation measurements of CaM and CaMKII binding dynamics under varying Ca2+ conditions in living cells. Cross-correlation and autocorrelation curves were both measured simultaneously in living HEK293 cells. HEK293 cells were chosen because of their low autofluorescence, which is essential to minimize background for these types of experiments. Plotted in Fig. 5 are six subsequent runs with 10-s acquisition times (thin lines), which illustrate the stability of the measurements and the respective average curves (thick lines) that were used for fitting. Qualitatively, the amplitude of the cross-correlation, corresponding to the eGFP-CaMKII-A633(C2)CaM binding, increased relative to the autocorrelations with high Ca2+ (Fig. 5 A, black curve) or Ca2+/MgATP (Fig. 5 B, black curve), and decreased in the absence of Ca2+ (Fig. 5 C, black curve) as predicted by the in vitro biochemistry. In the absence of Ca2+ (Fig. 5 C), cross-correlation was found to be close to zero and did not show the conventional shape of a correlation curve. This indicates that there was no significant binding of eGFP-CaMKII and A633(C2)CaM in the absence of Ca2+.
Deviation from the in vitro case: mixing of Alexa 633(C2)CaM with endogenous unlabeled CaM
Quantitatively, the cross-correlation amplitudes obtained in the cells were always smaller than in vitro for comparable conditions. As a consequence, analysis of the intracellular data using the general formalism in the same way as for the in vitro data yielded the binding distributions depicted as red bars in Fig. 5 (bottom) and unexpectedly weak binding constants (Kd = 14 μM in the calcium case and Kd = 160 nM in the MgATP case, when using the same quench factors as in vitro). Although the binding and photophysical properties of the proteins may differ in living cells from the in vitro case, it seems unlikely that the binding is so much weaker or that quenching of the red fluorescence is so much stronger (qr = 0.06) causing such a reduced cross-correlation. A more likely explanation is that the mixing of labeled CaM with the ample endogenous unlabeled CaM in the cell is responsible for the reduced cross-correlation amplitudes and an incorrect value for Kd. We therefore devised a theoretical approach that incorporates the presence of unlabeled CaM (see Theory).
Extracting information about intracellular binding interactions between CaM and CaMKII
The intracellular case of elevated Ca2+ and MgATP (B) where CaMKII should be autophosphorylated was analyzed with the aim of studying the dependency between the Kd and the fraction r of labeled CaM, following the same routine used for obtaining the relationship between Kd and qr from the in vitro data. The essential result is that r = 0.31, if binding can be assumed to be sufficiently strong (Kd < 2 nM, data not shown). Under these conditions, binding in terms of CaM would be virtually complete, as indicated by the hatched bar and a per-site binding degree of θ = 1.0.
For the elevated Ca2+ case in the absence of additional ATP (Fig. 5 A, bottom), the binding distribution for the red-labeled CaM only is strikingly similar to the distribution in the MgATP case (Fig. 5 B, bottom). Strictly speaking, we cannot exclude from this data that the red distribution stems from a weaker binding affinity (Kd = 1.5–3 μM) than in Case B. However, this interpretation would automatically imply a high fraction of labeled CaM (r = 0.5 to 1), which is unlikely. It is therefore more reasonable that binding is again very strong (Kd < 20 nM) and that the fraction of labeled CaM is close to its limiting value for small Kd values, which is r = 0.35. The similar distributions of the red CaM obtained in the two cases thus probably both reflect full binding as indicated by the hatched bars.
In the EGTA case (Fig. 5 C, bottom), the distribution of red-labeled CaM on the CaMKII in the plot is strongly shifted to the left. At least more than half of the CaMKII molecules do not have any red-labeled CaM bound (Ci=0). The quantitative interpretation of this low binding case in terms of the distribution of total CaM, the dissociation constant Kd and the binding degree θ, only provide limits for these values and would again depend on the fractions of red-labeled and unlabeled CaM. The hatched bars in Fig. 5 C (bottom) provide an example of how the total CaM would distribute, if the red-labeled fraction constituted r = 0.3. Modeled CaM distributions for other values of r are also shown denoted by the shaded curves. If the red-labeled CaM is assumed to constitute, at a minimum, a fraction of r = 0.3 of the total CaM, the calculation yields a minimal Kd of 36 μM. Considering that the cross-correlation amplitude may even be closer to zero due to the small nonspecific cross-talk signal that may contribute, and bearing in mind that it is difficult to determine its value accurately with this low signal, binding can only be concluded to be negligible and the Kd to be probably far above 36 μM.
DISCUSSION
In this study we demonstrated the effectiveness of two-photon cross-correlation analysis applied to an intracellular assay for studying the complex binding dynamics of CaM and CaMKII. We first devised the appropriate procedures for setting up a TPCCS assay for intracellular use and thoroughly characterized the biochemical system. Next, an extended cross-correlation analysis was developed for cases beyond those with simple 1:1 stoichiometry and constant brightnesses upon binding. The application of this concept, which incorporated a description of the complex binding stoichiometry and a simple ansatz for fluorescence quenching, yielded values for the in vitro binding parameters. TPCCS was then applied directly to live cells, and the Ca2+-dependency of the binding reaction known from in vitro experiments was confirmed. The following detailed discussion of our results and conclusions focuses on the accompanying experimental considerations, the potential and limitations of the presented cross-correlation theory, and future perspectives for use of TPCCS to study intracellular biochemistry.
Experimental considerations for setting up an intracellular two-photon cross-correlation assay
A thorough understanding of the system at hand and careful controls were both essential for setting up the assay. Both proteins were shown to retain their biological activity when labeled with the carefully selected fluorophore combination of A633 and eGFP and exhibited predictable binding properties as anticipated from their well-characterized, in vitro biochemistry. The optimal excitation wavelength and the appropriate excitation power range were determined. Controls were done to avoid collecting artifacts, and included assessing nonspecific interactions of the fluorescent labels, checking for fluorescence flickering and cross-talk for our selected dye system, calibrating the focal volumes for calculating diffusion coefficients, and testing the intrinsic autofluorescence of the cells for both correlating and static backgrounds.
Two of the most dangerous sources of artifacts are photobleaching and saturation of the involved fluorescent dyes, a well-known problem for other (multicolor) techniques with single-molecule sensitivity. A remarkable feature is that the saturation and bleaching phenomena can cause contrary tendencies of the exposed artifacts. As described in detail by Berland and Shen (2003), excitation saturation and photobleaching can influence both the temporal decay and amplitude of autocorrelation functions. Similarly in our system higher laser powers resulted in a decrease in the autocorrelation amplitude (suggesting an increased particle number) and decrease in the diffusion time (suggesting a higher mobility). Although photobleaching would apparently reduce the diffusion time and average particle number due to photochemical damage of the fluorescent molecules, excitation saturation leads to an effective increase in the non-uniform observation volume, giving a larger average particle number and a corresponding decrease in the autocorrelation amplitude. Here, the diffusion time is limited by photobleaching whereas the derived concentration value appears to be most dominated by excitation saturation. Moreover, photobleaching also manifests itself in the cross-correlation function by yielding misleading false-negative results for molecular binding. Since the numerator in Eq. 1 is a function of only the cross-correlating species, contributions to the cross-correlation amplitude become zero as soon as one or both of the fluorescent species in a bound molecular complex is bleached before or during the transit through the measurement volume.
These effects on the auto- and cross-correlation functions become even more relevant for intracellular measurements since dye resources in the cell are more vulnerable to photobleaching. This is due to the intracellular environment and slower diffusion of molecules in the viscous cytoplasm that exposes molecules for a longer period of time to the excitation light. Use of TPE helps to better preserve dye resources and cell viability but still does not eliminate the issue. In vitro studies have utilized antioxidants to reduce triplet-state transitions and photobleaching (Dittrich and Schwille, 2001; Asimov et al., 1990, Stracke et al. 1999); however, there are no comparable methods that do not dramatically alter the delicate equilibrium of the cell. Thus, complex quantification of molecular behavior in living cells can best be realized by selecting sufficiently photostable fluorescent dyes and controlling excitation powers as shown here. In the future, novel dyes with optimized two-photon cross-sections (Zhao et al., 2004; Mongin et al., 2002; Abbotto et al., 2002; Reinhard, 1998) or modified nanocrystals, such as quantum dots (Larson et al., 2003), may be good candidates to overcome problems of photobleaching, if their dimensions and ability to be coupled to biomolecules become more amenable for intracellular experiments. So far, two-photon fluorescence microscopy and spectroscopy techniques, such as cross-correlation analysis, using genetically encodable proteins or small fluorescent labels, are the most flexible tools to study protein-protein interactions with minimal perturbations.
Quantitating CaMKII and CaM binding interactions—an extended cross-correlation theory to handle multivalent binding stoichiometry
CaMKII has long been hypothesized to be a potential candidate in the search for the molecular basis of memory due to its unique biochemical properties, which depend on its activation state (Lisman et al., 2002). The activation and autophosphorylation of multimeric CaMKII is controlled by the binding of Ca2+/CaM to each of its individual subunits, and full activation of CaMKII requires stoichiometric binding of CaM (Katoh and Fujisawa, 1991; Sugiura and Yamauchi, 1993). Therefore, a more detailed understanding of the binding of these two proteins in cells would provide insight into the activation state of this enzyme and possibly its role as a mediator of Ca2+ transients.
The theoretical framework for quantifying molecular binding with complex stoichiometry using TPCCS has been developed here into a flexible model, to analyze these binding interactions. Although the general principle and theory of FCS was invented more than three decades ago, the theoretical framework to extract biochemical parameters from a complex molecular system must be continuously modified and extended to address the rapidly developing questions in biological research. Our model accommodates up to 12 red-labeled CaMs binding to a single green-labeled CaMKII holoenzyme and incorporates the corresponding brightness changes upon binding. Although the model is suited for our particular case, the generalized formalism presented here can be re-derived and applied to other biochemical systems with different binding stoichiometries and labeling schemes. However, the opposite case of a red-labeled multitarget site and green ligand is likely not to be optimal, due to issues with signal cross-talk.
The reliability of the model was then demonstrated by testing potential non-idealities and their consequences on the derived parameter of interest. Even for misjudged initial conditions, an overestimated number of available binding sites, or an unknown fraction of “competing” unlabeled ligand, the model still operates with an impressively wide tolerance for these deviations. One reason for the reliability of the model is the excellent selectivity and dynamic range provided by the technique itself. Although the higher binding stoichiometry complicates the quantitative data analysis, it induces a larger dynamic range of the cross-correlation signal. Indeed, in the case of higher than 1:1 binding stoichiometry the amplitude of the cross-correlation signal can exceed the amplitude of the autocorrelation function of the ligand (a previously undescribed phenomenon), and can lead conceptually to a dynamic range that is not inherently limited. This implicates the technique's remarkable potential to resolve even higher binding stoichiometries than the one presented here.
Binding results in a distribution of CaMKII holoenzymes with different numbers of bound CaM and therefore different red brightnesses. The model is based on an expression for the underlying binding distribution of the ligand CaM to the n binding sites on the target CaMKII in terms of the single site dissociation constant (Kd) and the free concentrations of reactants. This distribution enters the expressions for the correlation amplitudes and allows us to obtain for each case the binding distribution, the average degree of binding (ν = CaM, bound/cCaMKII, total or θ = ν/n) and the Kd. The affinities of the individual subunits are assumed to be independent of the binding state of the neighboring subunits (no cooperativity) and strong for the elevated Ca2+/MgATP case. Intracellular measurements were analyzed with the added assumptions that fluorescence quenching is the same as the in vitro case and that the red-labeled CaM becomes mixed with endogenous unlabeled CaM exhibiting the same binding affinity for CaMKII.
By applying TPCCS to our biochemical system we determined for our given example that the basal state of the enzyme in the absence of Ca2+ has a Kd of 15 μM or more with the majority of CaMKII molecules having 0 or 1 out of 12 subunits occupied. This lower limit may be due to effects such as signal cross-talk or nonspecific interactions of the fluorophore labels. Although cross-talk artifacts were minimized by realizing an almost perfect spectral separation in combination with using an excess of red-labeled CaM versus green-labeled CaMKII, it may still cause an overestimation of the amount of bound species in the low binding case. More likely, nonspecific interactions of the fluorophore labels may exhibit a slight offset for the cross-correlation amplitude as indicated by a negative control reaction of Alexa 633 hydrazide and eGFP-CaMKII under all conditions (data not shown).
On the other hand, activated CaMKII in the presence of Ca2+/CaM alone reveals a binding degree of 3.4 CaMs per CaMKII holoenzyme with a single site dissociation constant of Kd of 2.4 μM. Our value is similar to the Kd of 2 μM found by Sugiura and Yamauchi (1993), although other work has determined much lower values below 75 nM for the activated state. All analyses were based on the assumption that the Kd for the autophosphorylated state is <0.02 nM; however, as long as the Kd is below 200 nM (within four orders of magnitude of the assumed value), the numbers obtained for the Kd in the other cases exhibit small errors.
Application of TPCCS to live cells clearly demonstrates the difference between little to no binding in Ca2+ free and strong binding in elevated Ca2+ conditions. The technique also shows that intracellular binding is similar under Ca2+ and Ca2+/MgATP conditions, whereas a clear difference in binding was seen for these conditions in vitro. In contrast to the comparable in vitro case where autophosphorylation is prevented by the absence of ATP and binding is weaker, ATP is most likely not limiting in cells. Cellular ATP would then be sufficient for autophosphorylation to occur, thus slowing the rate of dissociation of CaM, independent of the addition of extra MgATP (Fig. 5 B). In both elevated Ca2+ cases, a similar fraction of labeled CaM of ∼0.3 was found if binding was assumed to be sufficiently strong. Based on this fraction a total concentration of CaM can be estimated to be in the low μM range (see Table 3) with our given assumptions. If A633(C2)CaM has completely mixed with the endogenous, unlabeled CaM which can bind to its many targets intracellularly, this value would reflect the total pool of CaM in the cell. This may be reasonable, since cells were allowed to equilibrate for 30 min to 1 h after electroporation before measuring. However, if this is not the case, then this concentration would reflect the freely exchangeable pool of CaM in the cell.
TABLE 3.
Summary of binding parameters of eGFP-CaMKII and A633(C2)CaM in HEK cells under varying conditions seen in Fig. 5
| Binding parameter | + Ca2+ | + Ca2+/MgATP | + EGTA |
|---|---|---|---|
| r | 0.35 | 0.31 | (0.3)* |
| Θ | 1.0 | 1.0 | <0.08 |
| Kd [μM] | (<0.02)* | (<0.002)* | >36 |
| eGFP-CaMKII | |||
| Cfree [nM] | 0 | 0 | 142 |
| Ctotal [nM] | 304 | 222 | 399 |
| CaM | |||
| Cfree [μM] | 4.8 | 0.23 | 3.2 |
| Ctotal [μM] | 8.4 | 2.9 | 3.6 |
The parameter r represents the fraction of labeled CaM to account for the presence of additional unlabeled CaM in the cell. The given concentration values include the labeled and unlabeled molecules of the respective species.
Assumption.
Since the in vitro biochemistry of CaMKII and CaM is well understood, their interactions are ideal for our model where we require certain information for starting assumptions. Our new model applicable to the living cell provides us with a more sophisticated analysis that can offer a more detailed understanding of the status of the holoenzyme on the single molecule level. This type of information cannot be obtained by any other techniques, including fluorescence microscopy, diffusion measurements alone, or other biochemical methods. The next step in extending this type of analysis is to monitor real-time binding of CaM to CaMKII in neurons and to begin to relate physiological stimuli that lead to changes in neuronal physiology to the activation of this key signaling pathway.
Toward a more comprehensive model of complex binding interactions
Further investigations can be performed based on the analysis presented here. Although FCS has the advantage that single measurements suffice to determine Kd values in noncooperative binding systems, performing titrations has the potential to determine the cooperativity in the system. To provide an adequate range of accessible concentrations for titrations, the detection volume could be varied by changing the diameter of the incident laser beam or by reducing the observation volume by implementing total internal reflection illumination, near-field scanning optical microscopy, and zero-mode waveguides (Levene et al., 2003; Thompson et al., 1981).
Furthermore, it may be possible to develop a more sophisticated model to account for fluorescence quenching effects if additional information can be obtained by other methods to compensate for some of the inherent limitations of fluorescence cross-correlation spectroscopy. Fluorescence lifetime measurements would provide an independent approach to determine the quenching of the fully bound species compared to the free CaM, and potentially, to resolve different bound species. In cells, fluorescence lifetime measurements could be performed with the aim of better distinguishing the relative contributions of quenching and unlabeled CaM to the observed reduction in the cross-correlation amplitudes. Fluorescence intensity distribution analysis (Kask et al., 1999) and photon counting histogram analysis (PCH; Chen et al., 1999, 2003) would be other useful techniques to quantify the brightnesses of the fully bound species in the red channel in the presence of excess CaM. Potentially, distributions of brightnesses at lower binding degrees could be studied by this technique, and the linear quenching model proposed here could be confirmed or replaced by a more refined one.
Moreover, a dual-color version of PCH has recently been introduced (Chen et al., 2004) that exclusively exploits information embedded in the amplitude statistics of two separate detection channels and works robustly even in the presence of significant cross-talk. However, its application has so far been limited to only two unbound species. The practical applicability of dual-color PCH to determine the different brightnesses of one or even several bound species in the presence of unbound species in the complex, albeit spectrally better resolved system at hand, remains to be demonstrated.
Perspectives for use of TPCCS and related techniques for understanding intracellular biochemistry
As demonstrated in this work, TPCCS provides a broadly applicable technique for extending our understanding of in vitro biochemistry to the intracellular milieu. With this technique we can determine critical binding parameters, such as the concentrations of the binding partners, average degree of binding, and the binding constant Kd from a reaction with complex binding stoichiometry and potentially monitor, in real time, the progression of reactions in the range of several seconds to minutes. For faster acquisition times down to the 100-ms range, central second moment analysis, which calculates coincidence factors (Winkler et al., 1999; Heinze et al., 2002), can substitute as a simplified cross-correlation analysis, particularly in the case of simple yes-or-no decisions that do not require the evaluation of diffusion dynamics. Additionally, coincidence analysis can be extended for observing higher order complex formation by the introduction of a third color (Heinze et al., 2004).
Cross-correlation also provides high spatial resolution down to 0.5 μm, which can be used to probe biochemical heterogeneities in various subcellular compartments of differentiated cells, such as neurons (Gennerich and Schild, 2000; Meissner and Haberlein, 2003). Thus, two-photon fluorescence cross-correlation spectroscopy offers promising perspectives for transferring our biochemical understanding to the intracellular milieu in terms of understanding intricate processes, such as signaling, development, and disease mechanisms.
Acknowledgments
We thank Elke Haustein and Drs. Enrico Gratton and Zdenek Petrasek for keen insights and motivating discussions regarding crucial aspects of cross-correlation analysis. We also acknowledge Elke Haustein and Dr. Yoshihisa Kubota for critical comments about the manuscript and Jonas Ries for help using Mathematica for data analysis. We also thank Karin Birkenfeld and Sylvia Löbermann for technical assistance with cell culture.
This work was supported by grants from the National Institute of Mental Health (S.A.K.), Fulbright Kommission (S.A.K.), University of Texas Graduate School of Biomedical Sciences (S.A.K.), National Institute of Logical Disease and Stroke (M.N.W.), Human Frontiers Science Program (M.N.W. and P.S.), EFRE (K.B.), and the German Ministry for Education and Research (P.S.).
Sally A. Kim and Katrin G. Heinze contributed equally to this work.
Katrin G. Heinze's present address is Dept. of Physics, McGill University, Montreal, Quebec H3A 2T8, Canada.
References
- Abbotto, A., A. Beverina, R. Bozio, A. Facchetti, C. Ferrante, G. A. Pagani, D. Pedron, and R. Signorini. 2002. Novel heterocycle-based two-photon absorbing dyes. Org. Lett. 4:1495–1498. [DOI] [PubMed] [Google Scholar]
- Asimov, M. M., V. N. Gavrilenko, and A. N. Rubinov. 1990. Laser photolysis of laser dyes and the influence of triplet quenchers. J. Luminesc. 46:243–249. [Google Scholar]
- Babu, Y. S., J. S. Sack, T. J. Greenhough, C. E. Bugg, A. R. Means, and W. J. Cook. 1985. Three-dimensional structure of calmodulin. Nature. 315:37–40. [DOI] [PubMed] [Google Scholar]
- Bacia, K., I. V. Majoul, and P. Schwille. 2002. Probing the endocytic pathway in live cells using dual-color fluorescence cross-correlation analysis. Biophys. J. 83:1184–1193. [DOI] [PMC free article] [PubMed] [Google Scholar]
- Berland, K. M., and G. Shen. 2003. Excitation saturation in two-photon fluorescence correlation spectroscopy. Appl. Opt. 42:5566–5576. [DOI] [PubMed] [Google Scholar]
- Berland, K. M., P. T. So, and E. Gratton. 1995. Two-photon fluorescence correlation spectroscopy: method and application to the intracellular environment. Biophys. J. 68:694–701. [DOI] [PMC free article] [PubMed] [Google Scholar]
- Brickey, D. A., R. J. Colbran, Y. L. Fong, and T. R. Soderling. 1990. Expression and characterization of the α-subunit of Ca2+/calmodulin-dependent protein kinase II using the baculovirus expression system. Biochem. Biophys. Res. Commun. 173:578–584. [DOI] [PubMed] [Google Scholar]
- Chen, Y., J. D. Müller, P. T. So, and E. Gratton. 1999. The photon counting histogram in fluorescence fluctuation spectroscopy. Biophys. J. 77:553–567. [DOI] [PMC free article] [PubMed] [Google Scholar]
- Chen, Y., M. Tekmen, L. Hillesheim, J. Skinner, B. Wu, and J. D. Müller. 2004. Dual-color photon counting histogram. Biophys. J. published ahead of print on December 13, 2004. [DOI] [PMC free article] [PubMed]
- Chen, Y., L. N. Wei, and J. D. Müller. 2003. Probing protein oligomerization in living cells with fluorescence fluctuation spectroscopy. Proc. Natl. Acad. Sci. USA. 100:15492–15497. [DOI] [PMC free article] [PubMed] [Google Scholar]
- Dittrich, P. S., and P. Schwille. 2001. Photobleaching and stabilization of fluorophores used for single-molecule analysis with one- and two-photon excitation. Appl. Phys. B. 73:829–837. [Google Scholar]
- Eigen, M., and R. Rigler. 1994. Sorting single molecules: application to diagnostics and evolutionary biotechnology. Proc. Natl. Acad. Sci. USA. 91:5740–5747. [DOI] [PMC free article] [PubMed] [Google Scholar]
- Elson, E. L., and D. Magde. 1974. Fluorescence correlation spectroscopy. I. Conceptual basis and theory. Biopolymers. 13:1–27. [DOI] [PubMed] [Google Scholar]
- Gaertner, T. R., S. J. Kolodziej, D. Wang, R. Kobayashi, J. M. Koomen, J. K. Stoops, and M. N. Waxham. 2004. Comparative analyses of the three-dimensional structures and enzymatic properties of α, β, γ, and δ isoforms of Ca2+-calmodulin-dependent protein kinase II. J. Biol. Chem. 279:12484–12494. [DOI] [PubMed] [Google Scholar]
- Gennerich, A., and D. Schild. 2000. Fluorescence correlation spectroscopy in small cytosolic compartments depends critically on the diffusion model used. Biophys. J. 79:3294–3306. [DOI] [PMC free article] [PubMed] [Google Scholar]
- Heinze, K. G., M. Jahnz, and P. Schwille. 2004. Triple-color coincidence analysis: one step further in following higher order molecular complex formation. Biophys. J. 86:506–516. [DOI] [PMC free article] [PubMed] [Google Scholar]
- Heinze, K. G., M. Rarbach, M. Jahnz, and P. Schwille. 2002. Two-photon fluorescence coincidence analysis: rapid measurements of enzyme kinetics. Biophys. J. 83:1671–1681. [DOI] [PMC free article] [PubMed] [Google Scholar]
- Hudmon, A., and H. Schulman. 2002. Neuronal Ca2+/calmodulin-dependent protein kinase II: the role of structure and autoregulation in cellular function. Annu. Rev. Biochem. 71:473–510. [DOI] [PubMed] [Google Scholar]
- Kask, P., K. Palo, D. Ullmann, and K. Gall. 1999. Fluorescence-intensity distribution analysis and its application in biomolecular detection technology. Proc. Natl. Acad. Sci. USA. 96:13756–13761. [DOI] [PMC free article] [PubMed] [Google Scholar]
- Katoh, T., and H. Fujisawa. 1991. Calmodulin-dependent protein kinase II. Kinetic studies on the interaction with substrates and calmodulin. Biochim. Biophys. Acta. 1091:205–212. [DOI] [PubMed] [Google Scholar]
- Kim, S. A., K. G. Heinze, M. N. Waxham, and P. Schwille. 2004. Intracellular calmodulin availability accessed with two-photon cross-correlation. Proc. Natl. Acad. Sci. USA. 101:105–110. [DOI] [PMC free article] [PubMed] [Google Scholar]
- Kim, S. A., A. Hudmon, A. Volmer, and M. N. Waxham. 2001. CaM-kinase II dephosphorylates Thr286 by a reversal of the autophosphorylation reaction. Biochem. Biophys. Res. Comm. 282:773–780. [DOI] [PubMed] [Google Scholar]
- Kohl, T., K. G. Heinze, R. Kuhlemann, A. Koltermann, and P. Schwille. 2002. A protease assay for two-photon cross-correlation and FRET analysis based solely on fluorescent proteins. Proc. Natl. Acad. Sci. USA. 99:12161–12166. [DOI] [PMC free article] [PubMed] [Google Scholar]
- Kolb, S. J., A. Hudmon, T. R. Ginsberg, and M. N. Waxham. 1998. Identification of domains essential for the assembly of calcium/calmodulin-dependent protein kinase II holoenzymes. J. Biol. Chem. 273:31555–31564. [DOI] [PubMed] [Google Scholar]
- Kolodziej, S. J., A. Hudmon, M. N. Waxham, and J. K. Stoops. 2000. Three-dimensional reconstructions of calcium/calmodulin-dependent (CaM) kinase IIα and truncated CaM kinase IIα reveal a unique organization for its structural core and functional domains. J. Biol. Chem. 275:14354–14359. [DOI] [PubMed] [Google Scholar]
- Kuret, J., and H. Schulman. 1984. Purification and characterization of a Ca2+/calmodulin-dependent protein kinase from Rat brain. Biochemistry. 23:5495–5504. [DOI] [PubMed] [Google Scholar]
- Larson, D. R., J. A. Gosse, D. A. Holowka, B. A. Baird, and W. W. Webb. 2004. Dual-color fluorescence cross-correlation spectroscopy to examine initial steps of IgE receptor signaling. Biophys. J. 86:10a (Abstr.)14695245 [Google Scholar]
- Larson, D. R., W. R. Zipfel, R. M. Williams, S. W. Clark, M. P. Bruchez, F. W. Wise, and W. W. Webb. 2003. Water-soluble quantum dots for multiphoton fluorescence imaging in vivo. Science. 300:1434–1436. [DOI] [PubMed] [Google Scholar]
- Levene, M. J., J. Korlach, S. W. Turner, M. Foquet, H. G. Craighead, and W. W. Webb. 2003. Zero-mode waveguides for single-molecule analysis at high concentrations. Science. 299:682–686. [DOI] [PubMed] [Google Scholar]
- Lisman, J., H. Schulman, and H. Cline. 2002. The molecular basis of CaMKII function in synaptic and behavioral memory. Nat. Rev. Neurosci. 3:175–190. [DOI] [PubMed] [Google Scholar]
- Magde, D., E. L. Elson, and W. W. Webb. 1972. Thermodynamic fluctuations in a reacting system—measurement by fluorescence correlation spectroscopy. Phys. Rev. Lett. 29:705–708. [Google Scholar]
- Meador, W. E., A. R. Means, and F. A. Quiocho. 1993. Modulation of calmodulin plasticity in molecular recognition on the basis of x-ray structures. Science. 262:1718–1721. [DOI] [PubMed] [Google Scholar]
- Meissner, O., and H. Haberlein. 2003. Lateral mobility and specific binding to GABAA receptors on hippocampal neurons monitored by fluorescence correlation spectroscopy. Biochemistry. 42:1667–1672. [DOI] [PubMed] [Google Scholar]
- Meyer, T., P. I. Hanson, L. Stryer, and H. Schulman. 1992. Calmodulin trapping by calcium-calmodulin-dependent protein kinase. Science. 256:1199–1202. [DOI] [PubMed] [Google Scholar]
- Mongin, O., L. Porres, L. Moreaux, J. Mertz, and M. Blanchard-Desce. 2002. Synthesis and photophysical properties of new conjugated fluorophores designed for two-photon-excited fluorescence. Org. Lett. 4:719–722. [DOI] [PubMed] [Google Scholar]
- Putkey, J. A., and M. N. Waxham. 1996. A peptide model for calmodulin trapping by calcium/calmodulin-dependent protein kinase II. J. Biol. Chem. 271:29619–29623. [DOI] [PubMed] [Google Scholar]
- Rarbach, M., U. Kettling, A. Koltermann, and M. Eigen. 2001. Dual-color fluorescence cross-correlation spectroscopy for monitoring the kinetics of enzyme-catalyzed reactions. Methods. 24:104–116. [DOI] [PubMed] [Google Scholar]
- Reinhard, B. A. 1998. Highly active two-photon dyes: design, synthesis and characterization towards applications. Chem. Mater. 10:1863–1874. [Google Scholar]
- Schwille, P. 2001. Cross-correlation analysis in FCS. In Fluorescence Correlation Spectroscopy. Theory and Applications, E.L. Elson and R. Rigler, editors. Springer, Berlin, Germany. 360–378.
- Schwille, P., U. Haupts, S. Maiti, and W. W. Webb. 1999. Molecular dynamics in living cells observed by fluorescence correlation spectroscopy with one- and two-photon excitation. Biophys. J. 77:2251–2265. [DOI] [PMC free article] [PubMed] [Google Scholar]
- Schwille, P., F.-J. Meyer-Almes, and R. Rigler. 1997. Dual-color fluorescence cross-correlation spectroscopy for multicomponent diffusional analysis in solution. Biophys. J. 72:1878–1886. [DOI] [PMC free article] [PubMed] [Google Scholar]
- Stracke, F., M. Heupel, and E. Thiel. 1999. Singlet molecular oxygen photosensitized by Rhodamine dyes: correlation with photophysical properties of the sensitizers. J. Photochem. Photobiol. A Chem. 126:51–58. [Google Scholar]
- Sugiura, H., and T. Yamauchi. 1993. Effect of ATP on binding of Ca2+/calmodulin-dependent protein kinase II with calmodulin. Biochim. Biophys. Acta. 1177:270–274. [DOI] [PubMed] [Google Scholar]
- Thompson, N. L., T. P. Burghardt, and D. Axelrod. 1981. Measuring surface dynamics of biomolecules by total internal reflection fluorescence with photobleaching recovery or correlation spectroscopy. Biophys. J. 33:435–454. [DOI] [PMC free article] [PubMed] [Google Scholar]
- Török, K., A. Tzortzopoulos, Z. Grabarek, S. L. Best, and R. Thorogate. 2001. Dual effect of ATP in the activation mechanism of brain Ca2+/calmodulin-dependent protein kinase II by Ca2+/calmodulin. Biochemistry. 40:14878–14890. [DOI] [PubMed] [Google Scholar]
- van Eldik, L. J., and D. M. Watterson. 1998. Calmodulin and calcium signal transduction: an introduction. In Calmodulin and Signal Transduction. L.J. van Eldik and D.M. Watterson, editors. Academic Press, New York. 1–15.
- van Holde, K. E., W. C. Johnson, and P. S. Ho. 1998. Principles of Physical Chemistry. Prentice Hall, London, UK.
- Weidemann, T., M. Wachsmuth, M. Tewes, K. Rippe, and J. Langowski. 2002. Analysis of ligand binding by two-colour fluorescence cross-correlation spectroscopy. Single Mol. 3:49–61. [Google Scholar]
- Winkler, T., U. Kettling, A. Koltermann, and M. Eigen. 1999. Confocal fluorescence coincidence analysis: an approach to ultra high-throughput screening. Proc. Natl. Acad. Sci. USA. 96:1375–1378. [DOI] [PMC free article] [PubMed] [Google Scholar]
- Yamauchi, T., S. Ohsako, and T. Deguchi. 1989. Expression and characterization of calmodulin-dependent protein kinase II from cloned cDNAs in Chinese Hamster ovary cells. J. Biol. Chem. 264:19108–19116. [PubMed] [Google Scholar]
- Zhao, Y., Q. Zheng, K. Dakin, K. Xu, M. L. Martinez, and W.-H. Li. 2004. New caged Coumarin fluorophores with extraordinary uncaging cross section suitable for biological imaging applications. J. Am. Chem. Soc. 126:4653–4663. [DOI] [PubMed] [Google Scholar]