

Abstract
Caged-Ca2+ compounds such as nitrophenyl-EGTA (NP-EGTA) and DM-nitrophen (DMn) are extremely useful in biological research, but their use in live cells is hampered by cytoplasmic [Mg2+]. We determined the properties of Ca2+ release from NP-EGTA and DMn by using Oregon green BAPTA-5N to measure changes in [Ca2+] after ultraviolet flash photolysis in vitro, with or without Mg2+ present. A large fraction (65%) of NP-EGTA, which has a negligible Mg2+ affinity, uncages with a time constant of 10.3 ms, resulting in relatively slow increases in [Ca2+]. Uncaging of DMn is considerably faster, but DMn has a significant affinity for Mg2+ to complicate the uncaging process. With experimentally determined values for the Ca2+ and Mg2+ binding/unbinding rates of DMn and NP-EGTA, we built a mathematical model to assess the utility of NP-EGTA and DMn in rapid Ca2+-uncaging experiments in the presence of Mg2+. We discuss the advantages and disadvantages of using each compound under different conditions. To determine the kinetics of Ca2+ binding to biologically relevant Ca2+ buffers, such as Ca2+-binding proteins, the use of DMn is preferable even in the presence of Mg2+.
INTRODUCTION
Ca2+ is an important second messenger for a variety of physiological and biochemical processes, including muscle contraction, exocytosis and ion-channel gating. Over the last 20 years, a variety of caged-Ca2+ compounds have been developed (for review, see Ellis-Davies, 2003) that strongly bind Ca2+ and which, upon illumination with a certain wavelength, photolyze into photoproducts (PPs) with much lower affinities for Ca2+. Thus controlled by locally applied flashes of light, Ca2+ ions become “released” from a “cage”, causing rapid rises in [Ca2+]. Of the three most commonly used commercially available caged-Ca2+ compounds (DM-nitrophen (DMn), nitrophenyl-EGTA (NP-EGTA), and nitr-5), DMn seems to be the best choice to release caged Ca2+ when rapid and large increases in [Ca2+] are desired (Nagerl et al., 2000). Compared to nitr-5 and NP-EGTA, DMn has the highest affinity for Ca2+ (Kd of 5 nM vs. 145 nM and 80 nM, respectively). In addition, its PPs have the lowest affinity for Ca2+ after photolysis (Kd of 3 mM vs. 6.3 μM and 1 mM for nitr-5 and NP-EGTA, respectively) (Adams et al., 1988; Ellis-Davies, 2003; Ellis-Davies and Kaplan, 1994; Kaplan and Ellis-Davies, 1988). Consequently, ∼67–95% of DMn is bound to Ca2+ under the normal resting intracellular conditions for most cells (10–100 nM [Ca2+]), and most of the bound Ca2+ can be released by photolysis. DMn's relatively high quantum efficiency of 0.18 (Kaplan and Ellis-Davies, 1988) and fast fragmentation into PPs (photolysis of 1.1 × 10⁴–8 × 10⁴ s−1 (Ellis-Davies et al., 1996)) make it an almost ideal caged-Ca2+ compound. However, its main drawback for physiological experiments involving Ca2+ release inside cells is its high affinity for Mg2+ ions normally present in the cytoplasm (Romani and Scarpa, 2000). Large steps in [Ca2+] in a Mg2+-rich environment can also be accomplished by using NP-EGTA as a Ca2+ cage. NP-EGTA has a very low affinity for Mg2+ (9 mM) and a relatively large flash-induced change in Ca2+ affinity (Ellis-Davies and Kaplan, 1994). When using relatively high resting [Ca2+] (>1 μM), the difference in Kd for Ca2+ between DMn and NP-EGTA will make only a small difference in the amount of total uncaged Ca2+, since Ca2+ is bound to >90% of either compound.
We have previously used a mathematical model to describe Ca2+ uncaging from DMn (Escobar et al., 1995, 1997) by a short (20-ns) flash of ultraviolet (UV) light. More recently, a similar model was used to describe the Ca2+ transients after fast uncaging of Ca2+ and its binding to calbindin D28k, thus allowing the study of the kinetic properties of Ca2+ binding to this calcium-binding protein (CBP) (Nagerl et al., 2000). Yet, intracellular CBPs normally operate in the presence of Mg2+ and some CBPs may even bind this cation, which could interfere with their Ca2+ binding properties (Malmendal et al., 1999; Pechere et al., 1977). To emulate the cytoplasmic conditions, it is imperative to investigate the CBP binding kinetics with both Ca2+ and Mg2+ present. In such an environment the use of NP-EGTA might be warranted because of its negligible affinity for Mg2+(Ellis-Davies and Kaplan, 1994). However, depending on the desired time course of the Ca2+ release, certain experiments might require fast steplike changes in [Ca2+]. This might be better accomplished by the use of DMn despite its significant affinity for Mg2+ (Kaplan and Ellis-Davies, 1988, Ayer and Zucker, 1999). However, a thorough comparison of the kinetic properties of DMn and NP-EGTA is presently unavailable. Because experiments with DMn become confounding whenever Mg2+ is present, most studies have been carried out in the absence of Mg2+ (Xu et al., 1997, Neher and Zucker, 1993, Nagerl et al., 2000). Yet, if the properties of Mg2+ and Ca2+ binding to DMn and its PPs could be well characterized, it should be possible to accurately determine the amount of Ca2+ uncaged from DMn in the presence of physiological [Mg2+].
Ayer and Zucker (1999) have sought to determine the Mg2+ binding and uncaging properties of DMn by monitoring the [Ca2+] with fura-2 in a solution containing DMn, Ca2+, and Mg2+ during and after UV illumination at a time resolution of seconds. In contrast, our goal was to develop a model for fast-timescale “steplike” Ca2+ uncaging from DMn and NP-EGTA at resting Ca2+ concentrations of >1 μM. Thus we needed to find a correct mathematical description of the properties of DMn, NP-EGTA, and their PPs and the kinetics of DMn and NP-EGTA uncaging. The model provided as many kinetic constants as possible without overly relying on values determined by earlier studies under experimental conditions vastly different from ours. Our model describes the fast uncaging properties of DMn and NP-EGTA with both Ca2+ and Mg2+ present, allowing us to make predictions and compare their behavior in a physiological environment. The properties of DMn and NP-EGTA thus determined can be used to study the kinetics of Ca2+ binding to CBPs under physiological [Mg2+].
MATERIALS AND METHODS
Solutions
All experiments were done with solutions of 5 mM or 10 mM DMn ((4,5-dimethoxi-2-nitrophenyl)-1,2-diaminoethane-N,N,N′,N′-tetrasodium salt; Calbiochem, San Diego, CA) or 5 mM NP-EGTA (o-nitrophenyl-ethylene glycol-bis(2-aminoethylether)-N,N,N′,N′-tetraacetic acid; Molecular Probes, Eugene, OR) as Ca2+ cage with 120 mM KCl and 40 mM HEPES (pH 7.30). Depending on the experiment, a combination of CaCl2 and/or MgCl2 and/or Oregon green BAPTA-5N (OGB-5N, Molecular Probes) was added to these solutions (see below).
Both DMn and NP-EGTA solutions were prepared freshly before every experiment. Fresh stock solutions of DMn and NP-EGTA (15–20 mM) were tested for their accuracy in concentration by measuring their absorbance with a spectrophotometer (Hewlett-Packard 8453, Palo Alto, CA) and using an extinction coefficient of 4.33 × 10³ M−1 cm−1 at 350 nm for DMn (Kaplan and Ellis-Davies, 1988) and 5.52 × 10³ M−1 cm−1 at 260 nm for NP-EGTA (Ellis-Davies and Kaplan, 1994). For these measurements, small samples were diluted to yield [DMn] or [NP-EGTA] of 50 μM in a solution containing 4 mM EGTA to remove all free Ca2+. We found that most stock solutions contained ∼80–90% of the expected DMn or NP-EGTA concentration based on the manufacturer's specifications (amount of product per vial and molecular weight). To accurately account for the amounts of Ca2+ cage, the actual [DMn] and [NP-EGTA] in our experimental solutions were calculated, and these corrected values were used in our analysis. Experiments were carried out at room temperature (∼24°C). The experimentation room was outfitted with a yellow filter (500 nm long-pass) for environmental light, to avoid unwanted photolysis. All chemicals were obtained from Sigma-Aldrich (St. Louis, MO) unless otherwise mentioned. Values are expressed as mean ± SE.
Solution preparation and steady-state [Ca2+] measurements with Ca2+ sensitive electrodes
To measure the equilibrium dissociation constants of DMn for Ca2+ (Kd(CaDMn)) and Mg2+ (Kd(MgDMn)), we monitored the free [Ca2+] while titrating Ca2+-free solutions of DMn (starting with 100 or 200 μl, 5 or 10 mM) with aliquots (1–3 μl) of similar solutions containing 1–100 mM CaCl2. After thoroughly mixing every added aliquot, the [Ca2+] was measured with custom-made Ca2+-sensitive electrodes. This procedure was repeated until a complete binding assay was obtained. The Ca2+-sensitive electrodes were made of a small plastic (PVC) tube (10–20 mm long, diameter 0.7 mm); ∼0.5–1 mm on one side of this tube was filled with a 1:1 mixture of 1), 10% (w/w) Ca2+-selective ionophore II (Fluka/Sigma-Aldrich, St. Louis, MO) and 2% (w/w) Na tetraphenylborate dissolved in 2-nitrophenyloctyl ether, and 2), 8–10% (w/w) polyvinylchloride dissolved in tetrahydrofuran. A thin Ca2+-selective membrane formed after evaporation of the tetrahydrofuran. The electrodes were stored in the dark at room temperature for at least 2 days before use. Calibration solutions consisted of KCl-based pCa standards (Rink et al., 1980) and the pCa 6 standard was used as a reference solution in Ca2+-electrodes. New electrodes were filled with the reference solution at least 12 h before use to allow complete saturation of the membrane. Each electrode was calibrated before every experiment and checked for drift after each experiment. Electrodes were used only if they behaved linearly in the pCa range of 3–7.5 with a slope of at least 27 mV/pCa unit and drifted <1 mV/h. Compensations were made for any drift <1 mV/h. Measurements were accepted if readouts were stable for at least 1 min. The electrodes were insensitive to [Mg2+] up to 10 mM. Since total Mg2+ concentrations did not exceed 5 mM in any of our experiments, the Ca2+-sensitive electrodes gave accurate readings of [Ca2+] with Mg2+ present. To determine Kd(CaDMn) in Mg2+-free solutions we used a simple Scatchard analysis. However, when Mg2+ was present, the analysis became more complex. As shown in Appendix A (see Supplementary Material), we were able to express the relative amount of Ca2+-bound DMn ([CaDMn]/[DMn]T) as a function of the measured parameter [Ca2+], of the known parameters [Ca2+]T, [Mg2+]T, and [DMn]T, and of the unknown parameters Kd(CaDMn) and Kd(MgDMn). The values of Kd(CaDMn) and Kd(MgDMn) were determined by iterative fitting of the data (Excel, Microsoft, Redmond WA).
Dynamic Ca2+ measurements
To measure the dynamics of Ca2+ uncaging from DMn or NP-EGTA with high temporal resolution, we used UV-flash photolysis of DMn or NP-EGTA. For these uncaging experiments, all solutions contained 100 μM OGB-5N to monitor rapid changes in Ca2+ concentrations. The initial free [Ca2+] was titrated to 1–3 μM so that >99% of the DMn or ∼95% of the NP-EGTA had Ca2+ bound.
We used a setup comparable to that described earlier (Escobar et al., 1995, 1997; Nagerl et al., 2000). Briefly, it consisted of a small chamber (20 μl) mounted on an inverted microscope equipped for epifluorescence (IM35; Zeiss, Oberkochen, Germany) with a 505-nm dichroic mirror and 510 LP emission filter (Chroma Technology, Rockingham, VT). In the chamber, the polished end of a silica multimode optical fiber (diameter 800 μm; Thorlabs, Newton NJ)) was mounted to deliver 20 ns flashes of UV light (347 nm) from a frequency-doubled ruby laser (Lumonics, Rugby, UK) to photolyze DMn or NP-EGTA. To excite the OGB-5N molecules, an argon laser (model 95, Lexel, Freemont, CA; 488 nm, 1 W) was focused through the epifluorescence illumination port of the microscope with a 20× objective (Fluo20, Nikon, Tokyo, Japan), forming a small illumination spot directly in front of the optical fiber. The relatively small spot size of the excitation light (1–10 μm) compared to the large area of UV illumination (cone with a minimal diameter of 800 μm) ensured minimal diffusion effects during the time span (200 ms) of [Ca2+] changes. The [Ca2+] transients changed substantially only when the illumination spot was moved toward the outer edge of the optical fiber, i.e., to the edge where uncaging took place (not shown). This indicated that diffusion artifacts on the timescale of our measurements occur only very close to the edge of the UV-illuminated area, but not in the area of data collection. The fluorescence of OGB-5N was measured with a photodiode (PIN-HR008, UDT Sensors, Hawthorne, CA) in the focal plane of the microscope. The small diameter of the photodiode (200 μm) minimized errors caused by diffusion in the z axis. Despite the appropriate optical filters and the peak excitation spectrum of OGB-5N at 494 nm, the high-energy UV flashes still induced brief but large optical transients that saturated the detection system. To avoid these artifacts, a patch-clamp amplifier (Axopatch 200A, Axon Instruments, Foster City, CA) with an integrating headstage was used to measure the currents generated by the photodiode. The feedback capacitor of the headstage was short-circuited (reset) and its readout was blanked exactly at the time of the UV flash so that there was no signal measured at the instant of the flash. The analog signal was low-pass filtered at 10 kHz with the 8-pole Bessel filter of the amplifier, digitized at 50 kHz (PCIO-MIO-16XE-10, National instruments, Austin, TX), and sampled on a PC with a custom-made program (EVAN) written in LabView (National Instruments). A pulse generator (4000 PG, Neuro-Data Instruments, New York, NY) was used to trigger the sampling, UV laser, headstage reset and blanking, and the shutter for the OGB-5N excitation light.
For a typical experiment, a 10–15 μl droplet of DMn solution was placed in the recording chamber. During each flash, only 0.05–1.5% of the DMn was uncaged in the spot directly in front of the optical fiber (predicted by our model, see Results). However, to avoid significant changes in baseline conditions due to excessive uncaging of DMn or evaporation, no more than three flash-evoked transients were acquired from each droplet. Measurements in the same droplet were performed at least 1 min apart to ensure that all the components in the droplet returned to steady-state baseline conditions. A peak detection circuit located in the laser head measured the energy in each UV flash. The fluorescence transients were stored for offline analysis with a computer model (see below).
Absorbance spectra of the DMn PPs
The absorbance spectra of the PPs formed from DMn, Ca2+-bound DMn and Mg2+-bound DMn were measured with a spectrophotometer (Hewlett-Packard 8453). To produce the various PPs, the following three solutions were exposed for 5 min to the light of a Hg arc-lamp: 50 μM DMn with 10 mM EDTA, 50 μM DMn with 8 mM CaCl2, and 50 μM DMn with 8 mM MgCl2. To ensure that all PPs were free of Ca2+ or Mg2+, the solutions were mixed 1:1 with a 10-mM EDTA solution. The absorption spectra were measured directly after the exposure and mixing with the EDTA solution.
Properties of OGB-5N
We used the low-affinity dye OGB-5N because of its fast kinetics of Ca2+ binding and unbinding needed for tracking the expected rapid changes in [Ca2+]. To determine the properties of OGB-5N, we measured its fluorescence in drops containing 5 μM OGB-5N dissolved in the pCa standards. For one batch of the dye (Molecular Probes, lot 34B1-2) we found a Kd of 29.3 μM and an Fmax/Fmin ratio of 10:8. For another batch (lot 15C1-2) we measured a Kd of 36.1 μM and an Fmax/Fmin ratio of 40.0. We have no explanation for the variability between the batches other than the fact that specific contaminations might occur in different batches, as stated by the supplier (Molecular Probes). We tested fluorescence changes as a function of Mg2+ concentration and found that OGB-5N had no affinity for Mg2+ in the concentration range used (<10 mM). To determine the rate constants of Ca2+ binding to OGB-5N, an uncaging experiment was done with a DMn solution that had a free [Ca2+] of only ∼2 nM. In this case, no more than 30% of the DMn will bind Ca2+, and consequently any uncaged Ca2+ will rapidly rebind to free DMn. Compared to Ca2+ dye kinetics, the Ca2+ signal generated by uncaging from and rebinding to DMn at low free [Ca2+], will approach a delta function (Escobar et al., 1997). Therefore, with low [Ca2+], the decay of ΔF/F will resemble the unbinding of Ca2+ from OGB-5N. Indeed the signal could be accurately fitted with a single decay time constant of 133 μs for lot 34B1-2 and 115 μs for lot 15C1-2. These numbers indicate a koff(D) of 7.52 × 10³ s−1 and a kon(D) of 2.6 × 10⁸ M−1 s−1 for lot 34B1-2 and a koff(D) of 8.67 × 10³ s−1 and a kon(D) of 2.4 × 10⁸ M−1 s−1 for lot 15C1-2. These values were used in the mathematical model (see below) to describe the properties of the two batches of OGB-5N used in the various experiments.
Data analysis
All data were analyzed using MS Excel (Microsoft) and Berkeley Madonna 8.0 (University of California, Berkeley, CA). To determine the kinetic parameters (association and dissociation rates) from the fluorescence recordings we used a mathematical model incorporating all of the reactions in the uncaging solution (see Supplementary Material, Appendix B).
The general-purpose differential equation solver Berkeley Madonna was used to fit the simulations to the fluorescence recordings by iterating the parameters with the fourth-order Runge-Kutta method. First, all data were expressed as
 |
(1) |
where F(t) is the fluorescence acquired over time t, with t = 0 at the time of the flash, and Frest is the resting fluorescence averaged over 50 ms before flash delivery. To more accurately fit the fast rising phase while avoiding bias from late slow-decaying phase of the fluorescence transients, data points were omitted exponentially in time from the fitting routine.
To increase the accuracy of the fits to the model, sets of 10 traces obtained at different flash energies were fitted simultaneously. For each set of traces, all fitted parameters except for the amount of uncaging, which is dependent on the flash energy, were constrained to be equal between the individual traces.
RESULTS
Ca2+ release from NP-EGTA
Due to its very low Mg2+ affinity (Kd(MgNP-EGTA) = 9 mM) and relatively large quantum yield (0.23 vs. 0.18 for DMn) (Ellis-Davies et al., 1996; Ellis-Davies and Kaplan, 1994), NP-EGTA has been considered the “caged-Ca2+” molecule of choice whenever the experimental conditions demand the presence of physiological [Mg2+]. However, careful evaluation of the kinetic properties of Ca2+ binding to NP-EGTA and its photoproducts after photolysis is necessary to fully assess the potential of this probe as a tool for the rapid control of the [Ca2+] inside a cell. Fig. 1 shows that immediately after uncaging NP-EGTA, a short spike in [Ca2+] was observed, followed by a much slower rise in the [Ca2+], ultimately leading to a lasting steady-state level. To analyze quantitatively the kinetics of the fluorescence traces and to determine the properties of NP-EGTA, we used a mathematical model of the uncaging and the various equilibrium reactions (see Appendix B, Supplementary Material). This model is extensively described below for DMn. Sets of NP-EGTA uncaging traces could only be accurately fit when using two uncaging time constants (Fig. 1) and a dissociation constant (Kd(CaNP-EGTA)) of 50 ± 4 nM that changes into a Kd of 11 ± 1 mM for the photoproducts of NP-EGTA (n = four sets of 10 traces; for detailed rate constants, see 1). We found that 35 ± 4% of NP-EGTA uncaged with a time constant, τfast, of 2.8 ± 0.8 μs, whereas 65 ± 4% uncaged with a τslow of 10.3 ± 0.7 ms. The Ca2+ released from the rapidly uncaging fraction of NP-EGTA is quickly rebound to Ca2+-free NP-EGTA, whereas 2/3 of NP-EGTA uncages slowly, causing a gradual increase in [Ca2+]. The slow Ca2+ release from NP-EGTA may limit its use in physiological experiments despite its low Mg2+ affinity. Conversely, DMn might have beneficial kinetic properties over those of NP-EGTA even with Mg2+ present. To compare the two caged compounds, we measured the binding constants and uncaging kinetics of Ca2+ from DMn under physiological [Mg2+].
FIGURE 1.

Fluorescence data of Ca2+ uncaging from NP-EGTA (open circles) using different flash energies. At a resting [Ca2+] of 2.1 μM, NP-EGTA causes a large biphasic change in ΔF/F and thus in [Ca2+] (a and b). The initial rise in [Ca2+] is more clearly depicted on a faster timescale in b. Ca2+ uncaging from NP-EGTA was fitted simultaneously to sets of 10 traces evoked by different flash intensities (see text for details), with the models using two uncaging time constants (solid lines in a; only four traces are shown for clarity).
TABLE 1.
Properties of DMn and NP-EGTA and their photoproducts determined by titration or with flash photolysis

Steady-state analysis of Ca2+ and Mg2+ binding to DMn
First we determined the steady-state Kd(CaDMn) by titrating a DMn (5 mM) solution with Ca2+ while measuring the [Ca2+]. The Kd(CaDMn) was determined by fitting the data in Scatchard plots as shown in Fig. 2 a (solid circles). The Kd(CaDMn) determined in this manner was 8.1 ± 1.4 nM (n = 13), comparable to values found previously using a variety of techniques (Escobar et al., 1997; Kaplan and Ellis-Davies, 1988). The same titrations with Ca2+ were made to determine the Kd(MgDMn), but with a constant amount of Mg2+ (1–5 mM) present during the titration. The Mg2+ ions interfered with Ca2+ binding according to the following scheme:
 |
(2) |
FIGURE 2.
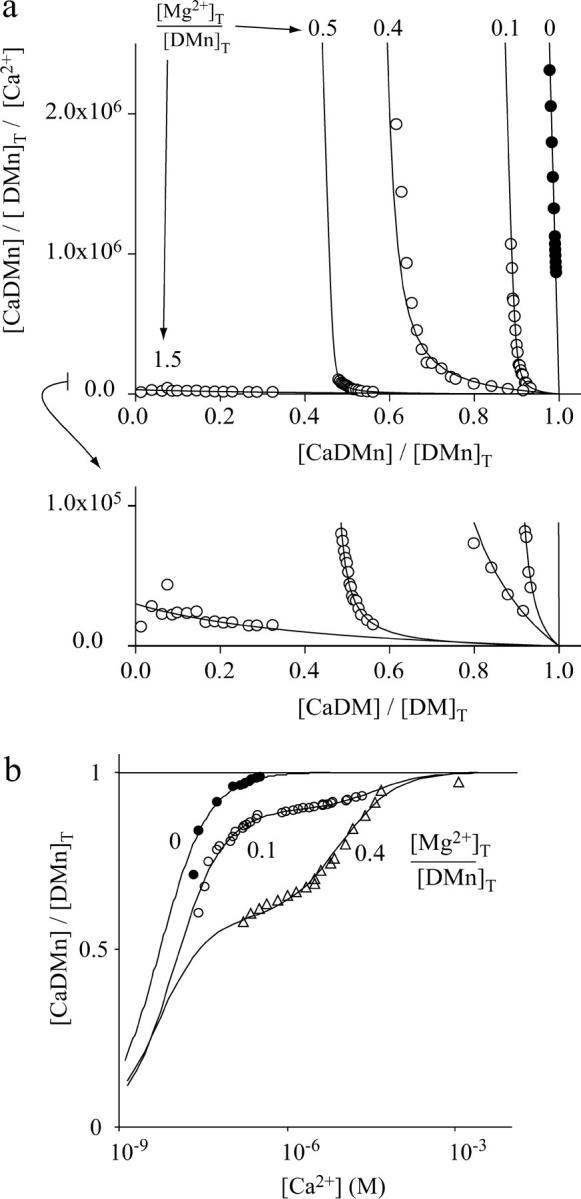
Steady-state Ca2+- and Mg2+-binding properties of DMn. (a) Scatchard plots of the titration with Ca2+ of typical solutions containing DMn without Mg2+ present ([Mg2+]T/[DMn]T = 0; •) and with Mg2+ present ([Mg2+]T/[DMn]T = 0.1, 0.4, 0.5, or 1.5; ○). A Ca2+-sensitive electrode was used to measure the free [Ca2+] and the [CaDMn] was calculated as the difference between added and free [Ca2+]. Linear fit through the solid circles was made to determine the Kd(CaDMn) (1/slope). The open circles represent data from titrations with the indicated ratios of Mg2+ present relative to the amount of DMn. The open circles were fitted with a function that described the relationship between [CaDMn] and [Ca2+] as a function of [Ca2+]T, [Mg2+]T, [DMn]T, Kd(CaDMn), and Kd(MgDMn) to determine Kd(CaDMn) and Kd(MgDMn) (see Supplementary Material, Appendix A ). The inset expands the y axis 10-fold. (b) Some of the data in a are shown as binding curves to clarify that with Mg2+ present more Ca2+ is needed to occupy all the binding sites of DMn. The binding curves for Ca2+ to DMn are shown at three different ratios of [Mg]T/[DMn]T: 0, i.e., no Mg2+ present (•); 0.1 (○); and 0.4 (▵).
In the presence of Mg2+, it took relatively higher concentrations of free Ca2+ to occupy the same number of binding sites on DMn. This is illustrated in Fig. 2 a, where the data are plotted as Scatchard plots, and in Fig. 2 b, where some of the data of Fig. 2 a, are plotted as a steady-state binding curve of Ca2+ to DMn. With no Mg2+ present, the Ca2+ binding to DMn can be described by a linear function in the Scatchard plot or a sigmoidal function in the steady-state binding plots (fits through solid symbols in Fig. 2, a and b). When Mg2+ is present, the Scatchard plots shift to the left. This shift becomes more pronounced with increasing [Mg2+] (open circles). The left shift of the Scatchard plots is equivalent to a shift to the right in the steady-state binding curves (Fig. 2 b). Thus, as expected, increasing [Mg2+] increased the amount of Ca2+ needed to fully occupy all DMn with Ca2+. Furthermore, when Mg2+ is present, the Ca2+ binding curves cannot be described by a simple sigmoidal function (Fig. 2 b) and, similarly, the Scatchard plots can no longer be described by a simple line (Fig. 2 a). From the general steady-state equations for the equilibrium condition, as shown in Eq. 2, we derived a function describing the relative amount of CaDMn ([CaDMn]/[DMn]T) as a function of the measured [Ca2+], known parameters such as [Ca2+]T, [Mg2+]T, and [DMn]T, and of unknown parameters Kd(CaDMn) and Kd(MgDMn) (see Supplementary Material, Appendix A). To determine Kd(CaDMn) and Kd(MgDMn), this function was fitted to the Scatchard plots (shown in Fig. 2, a and b, as lines through the open symbols). The fitted Kd(CaDMn) was 7.0 ± 1.4 nM (n = 10), comparable to the Kd(CaDMn) found when no Mg2+ was present. This indicates that Mg2+ ions do not change the affinity of DMn for Ca2+, but merely compete with Ca2+ for binding to DMn. For Mg2+ binding to DMn we found Kd(CaDMn) of 1.5 ± 0.7 μM.
Kinetic properties for the interaction between Ca2+ and DMn
To establish the kinetic properties of Ca2+ and Mg2+ binding to DMn, we measured the [Ca2+] directly after uncaging DMn in different solutions. The open circles in Fig. 3, b and e, show changes in OGB-5N fluorescence immediately after photolysis of DMn in the presence of Ca2+ ([Mg2+] = 0; resting [Ca2+] = 1–3 μM) at different flash energies of the UV laser. In response to the UV flash, a fraction of the total DMn breaks up, releasing Ca2+. Before the flash, CaDMn and DMn, and CaOGB-5N and OGB-5N, are at equilibrium. Upon flash delivery, a fraction of both the Ca2+-free and Ca2+-bound DMn break up to form a PP and Ca2+-bound PP (CaPP), as indicated in Fig. 3 a. Since the affinity of PP for Ca2+ is much lower than that of DMn, a certain amount of the formed CaPP complexes will dissociate into PP and Ca2+, resulting in a sharp increase in the [Ca2+]. It has been shown (Escobar et al., 1997) that at a high preflash [Ca2+] photolysis of DMn will lead to a steplike increase in [Ca2+] since most of the DMn is Ca2+-bound and rebinding of uncaged Ca2+ to free DMn molecules becomes negligible. In our experiments, the preflash [Ca2+] was between 1 and 3 μM, yielding 99.2–99.7% of DMn Ca2+-bound, considering a Kd(CaDMn) of 7–8 nM. Although our experiments are consistent with roughly a square step-shaped rise in [Ca2+], under these conditions some Ca2+ still rebinds to free DMn molecules, leading to a small drop in [Ca2+] after the initial rise (Fig. 3, b and e).
FIGURE 3.

Modeling and fitting of Ca2+ uncaging from DMn. (a) Scheme of the model to simulate the dynamic redistribution of Ca2+ generated by flash photolysis of DMn. Upon flash delivery, a fraction of the DMn uncages (shaded arrows) with a single time constant (τ) into PPs. Free Ca2+ levels are detected by the change of OGB-5N fluorescence (Fmin versus Fmax) as it binds Ca2+. Insets show structure of DMn and suggested structure of PPs. (b) Typical set of fluorescence data of Ca2+ uncaging from DMn (open circles) with different flash energies. Attempts to fit these data with the model shown in a failed (solid lines). (c) The initial part of the largest fluorescence transient in b is shown on an expanded timescale to demonstrate the two apparent uncaging time constants: a fast one (black) and a slow one (shaded). (d) A part of the scheme in a is shown incorporating into the model the two uncaging time constants (τf and τs, shown in gray). (e) The model with the two uncaging time constants accurately fits the same set of data as in b. Note that in the fit to the transients in both b and e a more accurate fit over the fast rising and falling phases at the start of the traces was ensured by exponentially weighting the fits by omitting data points from fitting toward the end of the sweeps.
To analyze the kinetics of the fluorescence traces and to obtain the properties of DMn, we used a mathematical model describing three equilibrium reactions (Fig. 3 a, and Supplementary Material, Appendix B). We first assumed that the uncaging of affected DMn, i.e., the transition of DMn to PP, is governed by a single time constant (τ, Fig. 3 a, and Supplementary Material, Appendix B). Furthermore, we assumed that the association rates of Ca2+ (kon(CaDMn)) with both DMn and PP were equal. Sets of 10 sweeps obtained at different flash energies were fitted simultaneously to determine Kd(CaDMn), kon(CaDMn), and the Ca2+ dissociation rate for PP (koff(CaPP)). From these values, the dissociation rate of Ca2+ from DMn (koff(CaDMn)) and the Kd of PP for Ca2+ (Kd(CaPP)) were calculated. For a given fitted dataset, all corresponding values were constrained to be equal across the traces obtained with different flash energies. Only the fraction of affected DMn, i.e., the amount of uncaging, was allowed to vary between traces. The model was unable to make accurate fits in every one of the 11 experiments (example in Fig. 3 b) even when all kinetic parameters for DMn and PP were fitted (thus could be of any value). A high-resolution plot of the rising phase of the fluorescence transient shows a steep elevation followed by a slower rise of [Ca2+] (Fig. 3 c). This suggests that the transition from DMn to PP might be governed by two time constants instead of one. This is plausible, as DMn breaks up via two different pathways (Il'ichev et al., 2004; Ellis-Davies et al., 1996).
Accordingly, we adapted the model to accommodate the transition breakup of DMn into PP via two pathways, one with a fast time constant (τfast) and the other with a slow time constant (τslow) (Fig. 3 d). With the bi-exponential uncaging implemented, the model more accurately described the experimental data fitting Kd(CaDMn), kon(CaDMn), koff(CaPP), τfast, τslow, and the relative contribution of these time constants (Fig. 3 e and 1). We found that 67 ± 2% of DMn uncaged with a τfast of 15 ± 2 μs, whereas 33 ± 2% uncaged with a τslow of 2.0 ± 0.4 ms. The relative distribution of τfast and τslow is comparable to the previously reported distribution of the two decay pathways of DMn (Ellis-Davies et al., 1996; McCray et al., 1992). The Kd(CaDMn) for these fits was 7.0 ± 1.4 nM, which is similar to the values for Kd(CaDMn) found in the titration experiments. The determined rate constants of 2.9 ± 0.3 ×10⁷ M−1 s−1 for kon(CaDMn) and 0.19 ± 0.03 s−1 for koff(CaDMn) are comparable to previously published values, as are the values for the PP, with a Kd(CaPP) of 3.3 ± 0.6 mM and a koff(CaPP) of 77 ± 8 ×10³ s−1 (Ayer and Zucker, 1999; Ellis-Davies et al., 1996; Escobar et al., 1995, 1997; Kaplan and Ellis-Davies, 1988). The values of the Kds and rate constants determined by us (see summary in Table 1) agree well with those obtained by others using different techniques. This, together with the highly accurate fits to the ΔF/F curves, substantiate that our mathematical model provides a realistic representation of the DMn uncaging process. Therefore, in our subsequent experiments the bi-exponential model was used to describe the uncaging of DMn.
Kinetic properties of the interactions between Mg2+ and DMn
To study the kinetics of interactions between DMn and Mg2+ we carried out uncaging experiments as described above, but in the presence of 1–5 mM Mg2+. Fig. 4 a shows uncaging curves generated with similar uncaging energies and at comparable resting [Ca2+] (1–3 μM). The only difference between the traces is the total Mg2+ present. A rapid rise in [Ca2+] was observed, but in contrast to the Mg2+-free experiments there was a strong drop in [Ca2+] after the initial rise (Fig. 4 a, solid versus open circles). In addition, at higher [Mg2+], larger flash energies were needed to produce commensurate changes in OGB-5N fluorescence after the flash, which is apparent from the decreased maximal fluorescence (Fig. 4, a and b). With increasing [Mg2+], more DMn will be occupied by Mg2+ and, therefore, less DMn will be available to bind Ca2+ and fewer Ca2+ ions will be needed to titrate the solution to the preflash [Ca2+] of 1–3 μM. This also means that fewer CaDMn molecules are present and less Ca2+ will be released for a certain flash energy. Furthermore, as Ca2+ is released, it will slowly replace some of the Mg2+ bound to DMn, hence the Ca2+ is buffered away after the uncaging.
FIGURE 4.
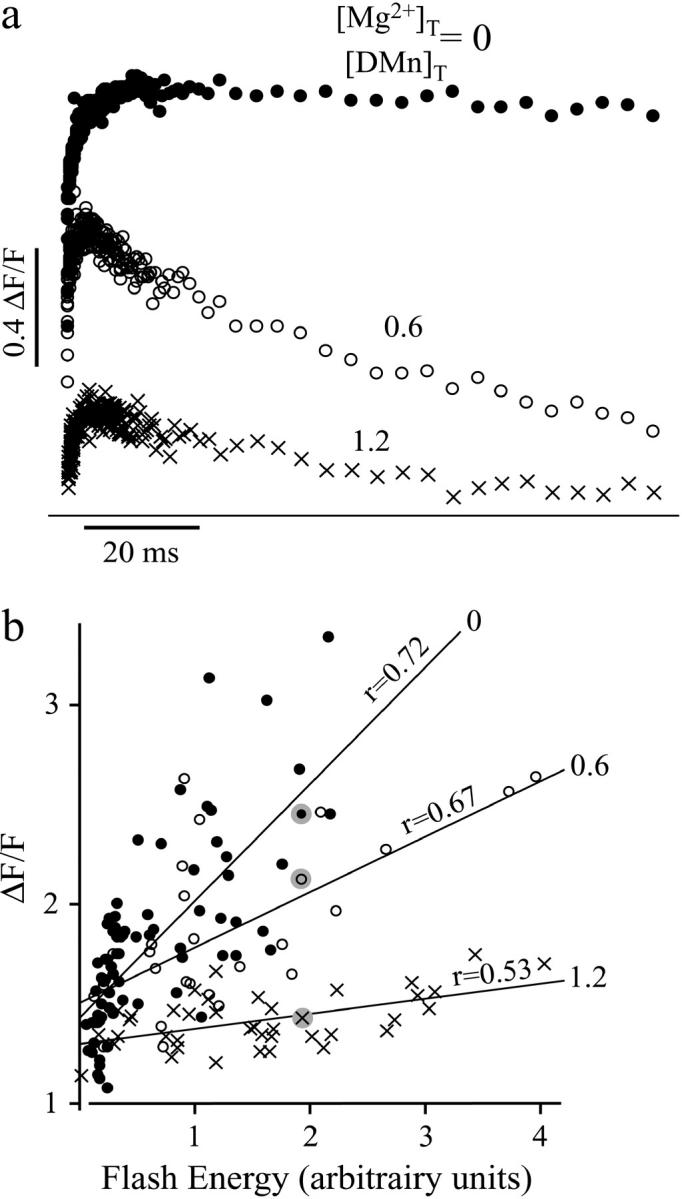
Fluorescence signals increase with increased UV flash energies. (a) Examples of uncaging with similar flash energies, but with different relative amounts of Mg2+(○, no Mg2+, i.e., [Mg2+]T/[DMn]T = 0; •, [Mg2+]T/[DMn]T = 0.6; ×, [Mg2+]T/[DMn]T = 1.2). (b) Linear fits to the plots of the maximum ΔF/F for different relative ratios of [Mg2+]T/[DMn]T as a function of flash energy. Symbols are the same as in a; the shaded dots indicate the maxima of the measurements shown in a.
To support the analysis of kinetic data in the presence of Mg2+, we expanded the kinetic model to include interactions between DMn and Mg2+ (see Supplementary Material, Appendix B). Every experiment started by uncaging Ca2+ in a solution without Mg2+. From these data, the parameters for the interaction between DMn and Ca2+ were determined as described above for the given experiment. These parameters were then fixed at the averaged values obtained from three or four fits (each with a set of 10 traces). Different [Mg2+]T were used that gave [Mg2+]T/[DMn]T ratios of 0.2, 0.4, 0.6, and 1.2. Using the Kd(CaDMn) and Kd(MgDMn) as found in the titration experiments, this would render an approximate resting [Mg2+] of ∼0.1 mM, ∼0.3 mM, ∼0.5 mM, and ∼1.5 mM, respectively. The different [Mg2+]T/[DMn]T ratios yielded comparable results and thus were grouped for statistical comparisons. We assumed that photolysis of Mg2+-bound DMn (MgDMn) was similar to the photolysis of free DMn or of CaDMn (see the kinetic scheme shown in Fig. 5 a). This model will be referred to as “model (a)”. Fitting the Mg2+ data (n = 12 sets of traces, Fig. 6 a) with model (a) resulted in a Kd(MgDMn) of 0.5 ± 0.09 mM with an association rate (kon(MgDMn)) of 40 ± 19 ×103 M−1 s−1 and a dissociation rate (koff(MgDMn)) of 28 ± 19 s−1. For the photoproduct, the Kd for Mg2+ (Kd(MgPP)) was 5.4 ± 6.5 M, caused by a shift in the dissociation rate koff(MgDMn) to a koff(MgPP) of 92 ± 53 ms−1. Even though model (a) could reproduce the ΔF/F signals with Mg2+ present, the Kd(MgDMn) thus determined was ∼300 times larger than both the Kd(MgDMn) found in our titration experiments (p < 0.0001) and the previously reported value for the dissociation constant of Mg2+ from DMn (Ayer and Zucker, 1999). If the Kd(MgDMn) was forced to a value within the range of its expected value (1–3 μM), no satisfactory fits could be obtained (not shown). Furthermore, as shown in the inset of Fig. 6 a, model (a) poorly reproduced the initial rise and fall in fluorescence. Thus, we conclude that model (a) does not accurately describe the actual uncaging process in these experiments.
FIGURE 5.

Schematics of the two models used to simulate Ca2+ and Mg2+ uncaging (double arrows) from DMn with the corresponding equilibria. (a) Model (a), in which DMn, CaDMn, and MgDMn all break up into similar photoproducts (PPs). (b) Model (b), in which CaDMn uncages into PP1, whereas DMn and MgDMn uncage into PP2 with a different Ca2+ affinity. (c) The difference in the absorption spectra for the PPs of DMn indicates that DMn forms different PPs depending on the ion it binds. The different numbers (1–4) indicate the following absorption spectra: 1, 25 μM DMn; 2, the PPs of 25 μM DMn; 3, the PPs of 25 μM CaDMn; and 4, the PPs of 25 μM MgDMn, all in high EDTA (>5 mM).
FIGURE 6.

Model-generated fits of Ca2+ uncaging from DMn with Mg2+ present. Examples of data obtained when uncaging Ca2+ in the presence of Mg2+ (○). Left panel, [Mg2+]T/[DMn]T = 0.2; right panel, [Mg2+]T/[DMn]T = 1.2. For comparison, the top traces in each data set represent Ca2+ uncaging in the absence of Mg2+ with a comparable ΔF/F value (•; fitted curves have been omitted for clarity). (a) Fits using model (a). (b) Fits using model (b). Insets show on a faster timescale the largest curves with Mg2+ present. It is clear that model (b) is far better than model (a) in fitting the fast initial rise and fall in fluorescence.
Kaplan and Ellis-Davies (1988) showed that the PPs from DMn and CaDMn have different absorbance spectra. Therefore, the PPs resulting from either Ca2+-bound or Ca2+-free DMn are different, and the properties of these two PPs can differ significantly. In our experiments in the absence of Mg2+, >99% of the DMn has bound Ca2+ and the contribution of the PP formed from free DMn is negligible. However, in experiments with Mg2+ present, a significant portion of DMn is occupied by Mg2+. This MgDMn may also be uncaged into different PPs compared to the PPs formed by CaDMn. To test this hypothesis we evaluated the absorption spectra of PPs formed by DMn, CaDMn, and MgDMn. Fig. 5 c shows the absorbance spectra of DMn and the PPs formed from free DMn, CaDMn, and MgDMn. As expected (Kaplan and Ellis-Davies, 1988), the spectrum of DMn (Fig. 5 c, 1) was dramatically different from its PPs, and the spectra of the individual PPs were different from each other, depending on whether DMn was in its Ca2+-free (Fig. 5 c, 2) or Ca2+-bound (Fig. 5 c, 3) form before uncaging. More importantly, when Mg2+ was bound to DMn, the PPs had a significantly different spectra (Fig. 5 c, 4) compared to the PPs from CaDMn. This means that PPs formed from either CaDMn or MgDMn are different and may have different Ca2+ binding properties. Hence, we incorporated into our model the possibility that MgDMn uncages into different PPs than CaDMn (Fig. 5 b), and we will refer to this model as “model (b)”. In model (b), CaDMn breaks down into two PP1 molecules and MgDMn breaks down into two PP2 molecules. The Ca2+ binding properties of PP1 are determined from the experiments without Mg2+ present. The values for PP1 are fixed when analyzing experiments with Mg2+ present. It is nearly impossible to resolve if the PPs formed by free DMn can be represented by the properties of either PP1 or PP2. Furthermore, modeling the PPs of free DMn as PP1 or PP2 led to similar results, indicating a negligible contribution of free DMn. We chose to model the PPs of free DMn as PP2 because the absorption spectra of PPs of free DMn and MgDMn are alike. In addition, for simplicity we also assumed that the affinities and binding rate constants of either PP1 or PP2 for Mg2+ are similar. Fig. 5 b shows a schematic representation of this model. Fig. 6 b shows the same examples as Fig. 5 a fit with model (b), which more accurately describes the initial fast changes compared to model (a) (compare insets of Fig. 6, a and b). The Kd(MgDMn) determined with model (b) was 1.9 ± 0.2 μM (n = 12), which changes to a Kd(MgPP) of 2.5 ± 0.6 mM (for both PP1 and PP2) after photolysis. For Ca2+, the Kd(CaPP1) was still 3.1 mM because it was determined without Mg2+ present, as described above. The PP2s formed from MgDMn had a Kd(CaPP2) of 89 ± 41 μM, a much higher affinity for Ca2+ than the PP1s formed by CaDMn. All association and dissociation rates are presented in Table 1 and are comparable to those found in studies using much longer illuminations of DMn (Ayer and Zucker, 1999) and also match the Kds determined in our steady-state experiments. Apparently, DMn breaks up into different PPs depending on the ion bound to it. Earlier findings (Ayer and Zucker, 1999; Kaplan and Ellis-Davies, 1988) and our own results suggest that at least two types of PPs are formed, one with a Kd for Ca2+ of ∼3 mM and another with a Kd of ∼10–100 μM.
DISCUSSION
We studied the properties of NP-EGTA, a Ca2+ cage with negligible Mg2+ affinity, to determine its usefulness in inducing steplike changes in [Ca2+] under our desired experimental conditions (resting [Ca2+], 1–3 μM; resting [Mg2+], 1 mM). We also determined the Ca2+ and Mg2+ binding kinetics to DMn and its PPs using ultrafast flash photolysis. Once the Ca2+ binding properties of DMn were determined in the absence of Mg2+, the kinetic parameters were used in an extended model incorporating Mg2+ binding to DMn. The results of our measurements will enable the use of Ca2+ uncaging experiments in the presence of physiological [Mg2+] to resolve the properties of Ca2+ binding kinetics to various CBPs under physiological conditions.
Uncaging time constants of DMn and NP-EGTA
Our model accurately described the uncaging of DMn and NP-EGTA and their Ca2+ binding if only two uncaging time constants were used. Earlier studies of DMn, NP-EGTA, or similar compounds irradiated by short UV pulses have shown that the resulting aci-nitro intermediates (intermediate molecules formed in the transition from DMn or NP-EGTA to PPs) have two decay rates (Ellis-Davies et al., 1996; Il'ichev et al., 2004). For example, for DMn at pH 7.2, 66% of the aci-nitro species decays at a rate of 80,000 s−1, whereas the rest decays at 11,000 s−1. However, since the rate-limiting step of the entire uncaging process is unknown, and may vary depending on pH (Il'ichev et al., 2004; Schupp et al., 1987), the decay rates of any given intermediate aci-nitro species may not reflect the rate of the complete uncaging process. Nevertheless, the two different pathways for uncaging DMn (Ellis-Davies et al., 1996) could underlie the two uncaging time constants found in our experiments. The ratios of the τfast/τslow components of 67:33% for DMn and 36:64% for NP-EGTA are in good agreement with the 66:34% and 37:63% ratios found for the distributions of decay rates for the aci-nitro species for DMn and NP-EGTA, respectively (Ellis-Davies et al., 1996).
Changes in pH during uncaging may be an alternative explanation for two uncaging time constants in our experiments. Proton binding in the last transition step from aci-nitro species to PPs can raise local pH to modulate the pH-sensitive uncaging process (Ellis-Davies et al., 1996; Il'ichev et al., 2004). This latter explanation seems unlikely since there is an excess pH buffer present (40 mM HEPES) and only small (local) amounts of DMn are uncaged (<1.5%).
Previously recorded Ca2+ signals after DMn uncaging were adequately described with models using only one uncaging time constant (Ayer and Zucker, 1999; Ellis-Davies et al., 1996; Escobar et al., 1997), but under quite different experimental conditions. For example, Ellis-Davies et al. (1996) used fast recordings at high resting [Ca2+] (∼70 μM) to determine the uncaging time constants of DMn and NP-EGTA. The short timescale (∼200 μs) of their measurements precludes distinguishing a second slower time constant. In their experiments on a longer timescale (∼3 ms), the resting [Ca2+] used (∼15 nM for DMn and ∼450 nM for NP-EGTA) was much lower than in ours, which was also the case in earlier experiments by Escobar et al. (1997). Under such conditions, considerable amounts of DMn or NP-EGTA are Ca2+-free and can mask slow Ca2+ release by acting as relatively fast Ca2+ buffers. We tested this hypothesis by simulating experiments using our model (with two uncaging time constants) under conditions equivalent to those used by Ellis-Davies et al. (1996). In these simulations the data could be fitted with single uncaging time constants for DMn or NP-EGTA similar to those found by Ellis-Davies et al. (1996). Thus, a model with only one uncaging time constant might suffice depending on the experimental conditions. However, other conditions such as ours will require a second uncaging time constant to accurately describe DMn or NP-EGTA uncaging.
DMn and Ca2+
The Kd(CaDMn) found by our fitting method (7.6 nM) is in good agreement with the steady state experiments either with or without Mg2+ present (7.0 nM and 8.1 nM, respectively) and is comparable to previously measured or estimated values of ∼5 nM (Escobar et al., 1997; Kaplan and Ellis-Davies, 1988). Compared to the three reported on-rates for Ca2+ binding to DMn—∼8 × 10⁷ M−1 s−1 (Ellis-Davies et al., 1996), ∼3 × 10⁷ M−1 s−1 (Ayer and Zucker, 1999; Escobar et al., 1997; Xu et al., 1997), and ∼1.5 × 10⁶ M−1 s−1 (Zucker, 1993)—the kon(CaDMn) of 2.9 × 10⁷ M−1 s−1 found in our experiments strongly supports intermediate binding rates. For the PPs we found that the Kd(CaPP) was 3.1 mM, again in close agreement with the initially reported and widely used value of ∼3 mM (Ellis-Davies et al., 1996; Escobar et al., 1995, 1997; Kaplan and Ellis-Davies, 1988; Xu et al., 1997). However, Neher and Zucker (1993) reported a sixfold lower Kd of 250 μM. It was later suggested that this could be an apparent Kd resulting from a combination of the two dissimilar Kds of the two PPs (PP1 and PP2) formed from CaDMn and DMn (Ayer and Zucker, 1999).
DMn and Mg2+
The Kd(MgDMn) of 1.5 μM determined in our titration experiments is comparable to the originally estimated 2.5 μM (Kaplan and Ellis-Davies, 1988). Our model (a) resulted in a much higher estimate of Kd(MgDMn) (0.5 mM) and this model also failed to fit the initial phase of the Ca2+ signals. We incorporated a second PP, formed by MgDMn and free DMn, with a higher affinity for Ca2+ but otherwise similar properties for Mg2+, thus creating model (b), which accurately fitted our results. Based on the absorbance spectra we show that the PPs formed from MgDMn are indeed different from those formed by CaDMn.
Our findings are in many respects similar to those of Ayer and Zucker (1999): PPs formed by MgDMn have a much higher affinity for Ca2+ than PPs formed by CaDMn. We found the Kd(CaPP2) to be ∼90 μM, within the same order of magnitude as the ∼13 μM estimated by Ayer and Zucker (1999). Also in agreement with Ayer and Zucker (1999), the association rate of Mg2+ binding is slower than that for Ca2+, since Mg2+ binding is rate-limited by the removal of H2O from hydrated Mg2+ (Hague, 1977). The most significant difference between the previous model (Ayer and Zucker, 1999) and ours for the uncaging of DMn or NP-EGTA is that we use two uncaging time constants instead of one.
Assumptions
In a prior analysis (Ayer and Zucker, 1999), various constants, including Kd(CaDMn), kon(CaDMn), Kd(CaPP1), and Kd(MgPP), were preset to previously reported values. Our approach determined the most critical values by iteration with the model, testing its robustness. Nevertheless, like others (Ayer and Zucker, 1999; Ellis-Davies et al., 1996; Escobar et al., 1995, 1997; Kaplan and Ellis-Davies, 1988; Nagerl et al., 2000), we had to make some assumptions about how DMn uncages. One of the major assumptions is that every DMn molecule breaks up into two PPs with similar properties. Based on the general idea of how DMn breaks up according to Fig. 2 a (adapted from Kaplan and Ellis-Davies, 1988), the two fractions should be very different. If DMn can uncage in different ways into PP1 and PP2, there should be up to four different photoproducts, possibly with different properties. Based on our data, it is impossible to resolve these reactions in such detail, but our model has proven to be sufficiently accurate to be applicable to the experimental data. Previously, we and others used a simpler model in experiments with only Ca2+ present, where every DMn molecule “broke up” into only one molecule of photoproduct with a significant affinity for Ca2+ (Escobar et al., 1995, 1997; Nagerl et al., 2000). We compared this earlier model to our expanded models used here. Surprisingly, the results for fitting with the simpler model were quite similar to the results obtained here. Since only small amounts of the total DMn (∼1%) are uncaged in our experiments, the relative amounts of the resulting PPs will be nearly equal.
Another assumption made by us and others (Ayer and Zucker, 1999; Ellis-Davies et al., 1996; Nagerl et al., 2000) is that the change in affinity between DMn or NP-EGTA and its PPs is caused by a change in the off-rates, whereas the on-rates remain constant. It was also assumed that the quantum yield and kinetics for uncaging Ca2+-bound, Mg2+-bound, or ion-free DMn or NP-EGTA are equal. Apparently, small errors possibly introduced by these latter assumptions do not significantly interfere with the accuracy of the model.
DMn versus NP-EGTA
Our goal was to induce steplike changes in [Ca2+] by uncaging from DMn in the presence of Mg2+. An accurate model for the underlying uncaging kinetics will be essential to determine Ca2+ binding kinetics to CPBs in the presence of Mg2+. But is the use of DMn warranted when other Ca2+ cages with no sensitivity to Mg2+ (e.g., NP-EGTA and nitr-5) are commercially available? The relatively high affinities for Ca2+ (6.3 μM (Ellis-Davies, 2003)) of the photoproducts of nitr-5 make this Ca2+ cage of limited use for inducing steplike changes in [Ca2+]. However, the properties of NP-EGTA might render it useful for Ca2+ photolysis in the presence of Mg2+. Using the determined properties of DMn and NP-EGTA, we simulated the change in [Ca2+] after uncaging from either of these compounds under different experimental conditions (Fig. 7). Despite the relatively high affinity of DMn for Mg2+, we found significant advantages of using DMn over NP-EGTA under some conditions.
FIGURE 7.

Simulations of Ca2+ uncaging using model (b) and the parameters obtained from our measurements (also see Table 1). (a) Uncaging of 5 mM DMn or NP-EGTA with an initial [Ca2+] of 1 μM and no Mg2+ present. To reach a similar steady-state [Ca2+] level, more NP-EGTA has to be uncaged. Release of Ca2+ from NP-EGTA release causes a clear “dip” in [Ca2+]. (b) At a resting [Mg2+] of 1 mM, Ca2+ release is significantly reduced (compare panels I and II), but can be restored by increasing the fraction of uncaging (panel III). Uncaging from NP-EGTA to produce a similar initial rise in [Ca2+] will result in a large secondary rise in [Ca2+] (panel IV). With Mg2+ present, uncaging from DMn will also release considerable amounts of Mg2+ as shown in panel V. (c) At the physiological resting [Ca2+] of 100 nM, the amount of uncaged Ca2+ from DMn decreases significantly when Mg2+ is added; however, peak values of the [Ca2+] spike can be restored by increasing the level of uncaging (c, right panel). (d) Uncaging from NP-EGTA can accomplish a similar peak in [Ca2+] if the uncaging level is slightly increased or the total NP-EGTA is considerably elevated. However, note that the Ca2+ spikes after release from NP-EGTA are much shorter lasting than those after uncaging DMn (note the 10-fold difference between the timescales of c and d).
When studying Ca2+ binding to CBPs (Nagerl et al., 2000), the experiments have to be performed at a relatively high resting [Ca2+] to minimize rebinding of uncaged Ca2+ to free DMn or NP-EGTA. Fig. 7, a and b) shows simulations of Ca2+ uncaging from 5 mM DMn or NP-EGTA solutions at a resting [Ca2+] of 1 μM to induce steplike changes in [Ca2+]. With no Mg2+ present (Fig. 7 a), 1% uncaging of DMn will produce an ∼18-μM step in [Ca2+] (Fig. 7 a and b, I). More uncaging is needed to evoke similar long lasting changes in [Ca2+] from NP-EGTA (compare Fig. 7 a, II and III). However, the major disadvantage of NP-EGTA is that only ∼35% of it uncages rapidly (τ = ∼3 μs) and ∼65% uncages slowly (τ = ∼10 ms). Consequently, no steplike change in [Ca2+] can be obtained. Instead, a biphasic change in [Ca2+] results that is more evident with more uncaging (Fig. 7 a, IV and V). This means that under these conditions Ca2+ uncaging from NP-EGTA makes it impossible to study Ca2+ binding kinetics of various processes that respond to higher [Ca2+], or of those that temporally overlap with the dip in the [Ca2+] caused by Ca2+ rebinding to NP-EGTA. Therefore, the use of NP-EGTA would be limited to the study of processes faster than the rebinding of Ca2+ to NP-EGTA (kon=3.5 × 10⁵ M−1 s−1) or to those slower than the slow time constant of uncaging (τ = 10 ms). This problem may be avoided by using higher resting [Ca2+] to lower the free NP-EGTA available to rebind the released Ca2+. An ∼99.5% occupancy of DMn is sufficient to eliminate any major drop in [Ca2+] directly after uncaging (Figs. 2, b and e, and 5). A resting free [Ca2+] of ∼10 μM would be needed to accomplish 99.5% occupancy of NP-EGTA. Such a high concentration may confound the study of a process with a high-affinity Ca2+ component. For instance, CBPs with a Kd of 525 nM or less (Nagerl et al., 2000), will have >95% of these sites occupied at 10 μM [Ca2+]. Thus it might be difficult to detect changes in [Ca2+] produced by <5% of the free binding sites. In comparison, at 1.4 μM free [Ca2+] (99.5% occupancy of DMn) the 27% unoccupied binding sites of a CBP with a Kd of ∼500 nM would more likely produce detectable Ca2+ changes.
The use of DMn is advantageous even when Mg2+ is present. Large uncaging energies are needed, but small steplike changes in [Ca2+] can still be made (compare Fig. 7 b, I–III). It may be argued that NP-EGTA may be used for experiments requiring small changes in [Ca2+], as long as the dip in [Ca2+] is above the minimal desired value of [Ca2+]. However, the [Ca2+] would still steadily rise after this dip (Fig. 7 b, IV), complicating the measurements. It should be taken into account that uncaging DMn with Mg2+ present will also release considerable amounts of Mg2+ (Fig. 7 b, V), most of it directly by uncaging MgDMn and a very small amount (estimated at <1%) by uncaged Ca2+ ions replacing Mg2+ ions bound to nonphotolyzed DMn molecules. This also induces a slow decay in [Ca2+] (Fig. 5), but this drop in [Ca2+] is too slow to interfere with the faster binding processes expected to be present in CPBs (Nagerl et al., 2000).
To replicate possible physiological uncaging experiments, we also simulated Ca2+ uncaging at the intracellular physiological resting [Ca2+] of 100 nM (Fig. 7, c and d), with 5 mM total DMn and 1% uncaging. As previously reported (Escobar et al., 1997; Zucker, 1993), with no Mg2+ present, uncaging results in a sharp and short-lived Ca2+ spike of ∼20 μM and within ∼0.7 ms the [Ca2+] reaches a steady-state value of ∼240 nM (Fig. 7 a). Upon addition of only 0.1 mM free [Mg2+], the [Ca2+] peak becomes dramatically reduced to ∼6 μM and declines within ∼2 ms to a steady-state [Ca2+] of ∼310 nM. Increasing the free [Mg2+] to 1 mM, the high end of its intracellular concentration (Romani and Scarpa, 2000, Li-Smerin et al., 2001) reduces the peak and steady-state levels to ∼850 nM and ∼460 nM, respectively. The simulations indicate that the peak [Ca2+] is inversely related to the relative amount of DMn occupied by Mg2+ (not shown). To compensate for the diminished [Ca2+] change without increasing the resting [Ca2+], either the uncaging percentage (flash energy) or the DMn concentration should be increased. With 1 mM [Mg2+] changing just one of these parameters would not be sufficient to evoke an ∼6-μM peak in [Ca2+], unless a concentration of >500 mM DMn is used or an uncaging of 80% is achieved. The right panel in Fig. 7 c shows Ca2+ release from 16% uncaging with 25 mM DMn starting at a [Mg2+] of 1 mM and a [Ca2+] of 100 nM. A combined increase in total DMn and uncaging can rescue the peak [Ca2+], although the peak will become shorter and the steady-state [Ca2+] will be higher. With 5 mM NP-EGTA and 100 nM resting [Ca2+], 1% uncaging obviously does not create a Ca2+ pulse with the same amplitude as 1% DMn uncaging. The peak of the Ca2+ pulse can be increased to ∼20 μM by augmenting the release to ∼2.7% or by increasing the NP-EGTA concentration to ∼33 mM. Therefore, NP-EGTA seems to be a good candidate to induce intracellular Ca2+ spikes with Mg2+ present. However, compared to Ca2+ release from DMn, the Ca2+ spikes are very short-lasting. The Ca2+spike created by 2.7% uncaging NP-EGTA lasts ∼50 μs (Fig. 7, c and d) compared to 500 μs for 1% uncaging from DMn with no Mg2+ present. Various Ca2+-dependent processes may not sense such extremely short Ca2+pulses because of their relatively slow association rates. In conclusion, it may be problematic to use DMn in environments with low resting [Ca2+] and physiological [Mg2+], but NP-EGTA may not be a perfect alternative, as it produces extremely short-lived changes in [Ca2+]. The simulations with DMn uncaging with Mg2+ present indicate that Mg2+ will also be released (not shown). The [Mg2+] rises slowly after the flash, but it is relatively small: with 1 mM Mg2+ and 1% uncaging the [Mg2+] would rise by 45 μM after 100 ms.
CONCLUSIONS
Our model was used to predict the behavior of DMn near physiological levels of free [Ca2+] (100 nM) and [Mg2+] (1 mM). Its main limitation as a Ca2+ cage is not the excessive release of Mg2+, but the small [Ca2+] rise produced under these conditions. If the goal is to produce relatively small changes in cellular [Ca2+], DMn is suitable, particularly since only negligible changes in Mg2+ will occur. Intracellular Ca2+ uncaging from NP-EGTA might be a better solution, if very short-lived Ca2+ signals are desirable. In other experiments, such as determination of binding rates of CPBs, where a higher initial [Ca2+] might be tolerated or even preferable, steplike changes in [Ca2+] can best be produced by DMn even in the presence of Mg2+.
SUPPLEMENTARY MATERIAL
An online supplement to this article can be found by visiting BJ Online at http://www.biophysj.org.
Supplementary Material
References
- Adams, S. R., J. P. Y. Kao, G. Grynkiewicz, A. Minta, and R. Y. Tsien. 1988. Biologically useful chelators that release Ca2+ upon illumination. J. Am. Chem. Soc. 110:3212–3220. [Google Scholar]
- Ayer, R. K., Jr., and R. S. Zucker. 1999. Magnesium binding to DM-nitrophen and its effect on the photorelease of calcium. Biophys. J. 77:3384–3393. [DOI] [PMC free article] [PubMed] [Google Scholar]
- Ellis-Davies, G. C. 2003. Development and application of caged calcium. Methods Enzymol. 360:226–238. [DOI] [PubMed] [Google Scholar]
- Ellis-Davies, G. C., and J. H. Kaplan. 1994. Nitrophenyl-EGTA, a photolabile chelator that selectively binds Ca2+ with high affinity and releases it rapidly upon photolysis. Proc. Natl. Acad. Sci. USA. 91:187–191. [DOI] [PMC free article] [PubMed] [Google Scholar]
- Ellis-Davies, G. C., J. H. Kaplan, and R. J. Barsotti. 1996. Laser photolysis of caged calcium: rates of calcium release by nitrophenyl-EGTA and DM-nitrophen. Biophys. J. 70:1006–1016. [DOI] [PMC free article] [PubMed] [Google Scholar]
- Escobar, A. L., F. Cifuentes, and J. L. Vergara. 1995. Detection of Ca2+-transients elicited by flash photolysis of DM-nitrophen with a fast calcium indicator. FEBS Lett. 364:335–338. [DOI] [PubMed] [Google Scholar]
- Escobar, A. L., P. Velez, A. M. Kim, F. Cifuentes, M. Fill, and J. L. Vergara. 1997. Kinetic properties of DM-nitrophen and calcium indicators: rapid transient response to flash photolysis. Pflugers Arch. 434:615–631. [DOI] [PubMed] [Google Scholar]
- Hague, D. N. 1977. Dynamics of substitution at metal ions. Mol. Biol. Biochem. Biophys. 24:84–106. [DOI] [PubMed] [Google Scholar]
- Il'ichev, Y. V., M. A. Schworer, and J. Wirz. 2004. Photochemical reaction mechanisms of 2-nitrobenzyl compounds: methyl ethers and caged ATP. J. Am. Chem. Soc. 126:4581–4595. [DOI] [PubMed] [Google Scholar]
- Kaplan, J. H., and G. C. Ellis-Davies. 1988. Photolabile chelators for the rapid photorelease of divalent cations. Proc. Natl. Acad. Sci. USA. 85:6571–6575. [DOI] [PMC free article] [PubMed] [Google Scholar]
- Li-Smerin, Y., E. S. Levitan, and J. W. Johnson. 2001. Free intracellular Mg2+ concentration and inhibition of NMDA responses in cultured rat neurons. J. Physiol. 533:729–743. [DOI] [PMC free article] [PubMed] [Google Scholar]
- Malmendal, A., S. Linse, J. Evenas, S. Forsen, and T. Drakenberg. 1999. Battle for the EF-hands: magnesium-calcium interference in calmodulin. Biochemistry. 38:11844–11850. [DOI] [PubMed] [Google Scholar]
- McCray, J. A., N. Fidler-Lim, G. C. Ellis-Davies, and J. H. Kaplan. 1992. Rate of release of Ca2+ following laser photolysis of the DM-nitrophen-Ca2+ complex. Biochemistry. 31:8856–8861. [DOI] [PubMed] [Google Scholar]
- Nagerl, U. V., D. Novo, I. Mody, and J. L. Vergara. 2000. Binding kinetics of calbindin-D(28k) determined by flash photolysis of caged Ca2+. Biophys. J. 79:3009–3018. [DOI] [PMC free article] [PubMed] [Google Scholar]
- Neher, E., and R. S. Zucker. 1993. Multiple calcium-dependent processes related to secretion in bovine chromaffin cells. Neuron. 10:21–30. [DOI] [PubMed] [Google Scholar]
- Pechere, J. F., J. Derancourt, and J. Haiech. 1977. The participation of parvalbumins in the activation-relaxation cycle of vertebrate fast skeletal-muscle. FEBS Lett. 75:111–114. [DOI] [PubMed] [Google Scholar]
- Rink, T. J., R. Y. Tsien, and A. E. Warner. 1980. Free calcium in Xenopus embryos measured with ion-selective microelectrodes. Nature. 283:658–660. [DOI] [PubMed] [Google Scholar]
- Romani, A. M., and A. Scarpa. 2000. Regulation of cellular magnesium. Front. Biosci. 5:D720–D734. [DOI] [PubMed] [Google Scholar]
- Schupp, H., W. K. Wong, and W. Schnabel. 1987. Mechanistic studies of the photorearrangement of o-nitrobenzyl esters. J. Photochem. 36:85–97. [Google Scholar]
- Xu, T., M. Naraghi, H. Kang, and E. Neher. 1997. Kinetic studies of Ca2+ binding and Ca2+ clearance in the cytosol of adrenal chromaffin cells. Biophys. J. 73:532–545. [DOI] [PMC free article] [PubMed] [Google Scholar]
- Zucker, R. S. 1993. The calcium concentration clamp: spikes and reversible pulses using the photolabile chelator DM-nitrophen. Cell Calcium. 14:87–100. [DOI] [PubMed] [Google Scholar]
Associated Data
This section collects any data citations, data availability statements, or supplementary materials included in this article.